Q4 2012 Capital Markets Newsletter - Western Reserve Partners LLC
Q4 2012 Capital Markets Newsletter - Western Reserve Partners LLC
Q4 2012 Capital Markets Newsletter - Western Reserve Partners LLC

You also want an ePaper? Increase the reach of your titles
YUMPU automatically turns print PDFs into web optimized ePapers that Google loves.
2<br />
M&A <strong>Markets</strong> Overview<br />
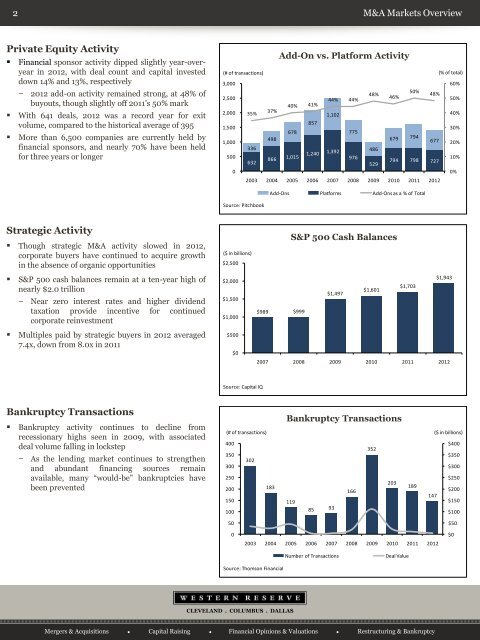
Private Equity Activity<br />
• Financial sponsor activity dipped slightly year-overyear<br />
in <strong>2012</strong>, with deal count and capital invested<br />
down 14% and 13%, respectively<br />
− <strong>2012</strong> add-on activity remained strong, at 48% of<br />
buyouts, though slightly off 2011’s 50% mark<br />
• With 641 deals, <strong>2012</strong> was a record year for exit<br />
volume, compared to the historical average of 395<br />
• More than 6,500 companies are currently held by<br />
financial sponsors, and nearly 70% have been held<br />
for three years or longer<br />
Add-On vs. Platform Activity<br />
(# of transactions) (% of total)<br />
3,000<br />
60%<br />
2,500<br />
50%<br />
48%<br />
44% 44%<br />
46%<br />
48%<br />
50%<br />
40% 41%<br />
2,000 35%<br />
37%<br />
1,102<br />
40%<br />
857<br />
1,500<br />
30%<br />
678<br />
775<br />
498<br />
679 794<br />
1,000<br />
677 20%<br />
500<br />
336<br />
1,240<br />
1,392<br />
486<br />
866<br />
1,015<br />
976<br />
632<br />
794 798 727<br />
529<br />
10%<br />
0<br />
0%<br />
2003 2004 2005 2006 2007 2008 2009 2010 2011 <strong>2012</strong><br />
Add-Ons Platforms Add-Ons as a % of Total<br />
Source: Pitchbook<br />
Strategic Activity<br />
• Though strategic M&A activity slowed in <strong>2012</strong>,<br />
corporate buyers have continued to acquire growth<br />
in the absence of organic opportunities<br />
($ in billions)<br />
$2,500<br />
S&P 500 Cash Balances<br />
• S&P 500 cash balances remain at a ten-year high of<br />
nearly $2.0 trillion<br />
−<br />
Near zero interest rates and higher dividend<br />
taxation provide incentive for continued<br />
corporate reinvestment<br />
$2,000<br />
$1,500<br />
$1,000<br />
$989 $999<br />
$1,497<br />
$1,601<br />
$1,703<br />
$1,943<br />
• Multiples paid by strategic buyers in <strong>2012</strong> averaged<br />
7.4x, down from 8.0x in 2011<br />
$500<br />
$0<br />
2007 2008 2009 2010 2011 <strong>2012</strong><br />
Source: <strong>Capital</strong> IQ<br />
Bankruptcy Transactions<br />
• Bankruptcy activity continues to decline from<br />
recessionary highs seen in 2009, with associated<br />
deal volume falling in lockstep<br />
−<br />
As the lending market continues to strengthen<br />
and abundant financing sources remain<br />
available, many “would-be” bankruptcies have<br />
been prevented<br />
Bankruptcy Transactions<br />
(# of transactions) ($ in billions)<br />
400<br />
$400<br />
352<br />
350<br />
$350<br />
302<br />
300<br />
$300<br />
250<br />
$250<br />
200<br />
183<br />
166<br />
203<br />
189<br />
147<br />
$200<br />
150<br />
119<br />
$150<br />
100<br />
85 93<br />
$100<br />
50<br />
0<br />
2003 2004 2005 2006 2007 2008 2009 2010 2011 <strong>2012</strong><br />
$50<br />
$0<br />
Number of Transactions<br />
Deal Value<br />
Source: Thomson Financial<br />
CLEVELAND . COLUMBUS . DALLAS<br />
Mergers & Acquisitions ● <strong>Capital</strong> Raising ● Financial Opinions & Valuations ● Restructuring & Bankruptcy