2005 Annual Report - Virginia Department of Criminal Justice Services
2005 Annual Report - Virginia Department of Criminal Justice Services
2005 Annual Report - Virginia Department of Criminal Justice Services

Create successful ePaper yourself
Turn your PDF publications into a flip-book with our unique Google optimized e-Paper software.
<strong>Virginia</strong> Advisory Committee on Juvenile <strong>Justice</strong><br />
Disproportionate Minority Contact<br />
with the Juvenile <strong>Justice</strong> System<br />
<br />
Issue<br />
Racial disparity in the juvenile<br />
justice system may not<br />
be based on racial discrimination<br />
exclusively. It may<br />
result from school policies,<br />
targeting <strong>of</strong> crime-ridden<br />
neighborhoods, inability<br />
<strong>of</strong> the indigent to retain<br />
paid counsel, and lack <strong>of</strong><br />
available prevention opportunities<br />
and alternatives to<br />
detention in economically<br />
deprived communities.<br />
5.0<br />
4.0<br />
3.0<br />
2.0<br />
1.0<br />
0.0<br />
Relative Rate Indices, FY <strong>2005</strong><br />
State <strong>of</strong> <strong>Virginia</strong><br />
Court Intake Diverted Detained Petitioned<br />
Data Source: <strong>Department</strong> <strong>of</strong> Juvenile <strong>Justice</strong><br />
Indices computed by Juvenile <strong>Services</strong> Section, DCJS<br />
Confined -<br />
JCCs<br />
African Amer. 2.60 0.91 1.31 1.03 2.49<br />
Hispanic 1.20 0.79 1.49 1.09 1.27<br />
Asian 0.30 1.28 0.98 0.91 **<br />
** insufficient cases for analysis Prepared by: Juvenile <strong>Services</strong> Section, DCJS.<br />
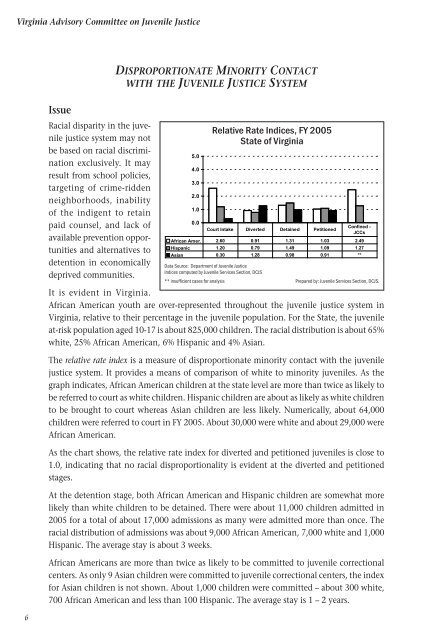
It is evident in <strong>Virginia</strong>.<br />
African American youth are over-represented throughout the juvenile justice system in<br />
<strong>Virginia</strong>, relative to their percentage in the juvenile population. For the State, the juvenile<br />
at-risk population aged 10-17 is about 825,000 children. The racial distribution is about 65%<br />
white, 25% African American, 6% Hispanic and 4% Asian.<br />
The relative rate index is a measure <strong>of</strong> disproportionate minority contact with the juvenile<br />
justice system. It provides a means <strong>of</strong> comparison <strong>of</strong> white to minority juveniles. As the<br />
graph indicates, African American children at the state level are more than twice as likely to<br />
be referred to court as white children. Hispanic children are about as likely as white children<br />
to be brought to court whereas Asian children are less likely. Numerically, about 64,000<br />
children were referred to court in FY <strong>2005</strong>. About 30,000 were white and about 29,000 were<br />
African American.<br />
As the chart shows, the relative rate index for diverted and petitioned juveniles is close to<br />
1.0, indicating that no racial disproportionality is evident at the diverted and petitioned<br />
stages.<br />
At the detention stage, both African American and Hispanic children are somewhat more<br />
likely than white children to be detained. There were about 11,000 children admitted in<br />
<strong>2005</strong> for a total <strong>of</strong> about 17,000 admissions as many were admitted more than once. The<br />
racial distribution <strong>of</strong> admissions was about 9,000 African American, 7,000 white and 1,000<br />
Hispanic. The average stay is about 3 weeks.<br />
African Americans are more than twice as likely to be committed to juvenile correctional<br />
centers. As only 9 Asian children were committed to juvenile correctional centers, the index<br />
for Asian children is not shown. About 1,000 children were committed – about 300 white,<br />
700 African American and less than 100 Hispanic. The average stay is 1 – 2 years.