Barnes Miller Village - Commercial Realty Advisors
Barnes Miller Village - Commercial Realty Advisors
Barnes Miller Village - Commercial Realty Advisors

Create successful ePaper yourself
Turn your PDF publications into a flip-book with our unique Google optimized e-Paper software.
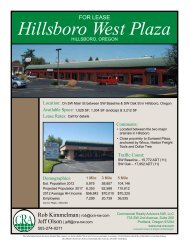
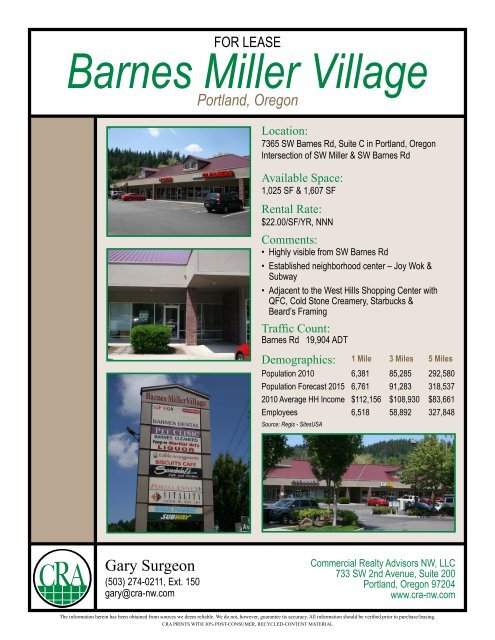
For lease<br />
<strong>Barnes</strong> <strong>Miller</strong> <strong>Village</strong><br />
Portland, Oregon<br />
Location:<br />
7365 SW <strong>Barnes</strong> Rd, Suite C in Portland, Oregon<br />
Intersection of SW <strong>Miller</strong> & SW <strong>Barnes</strong> Rd<br />
Available Space:<br />
1,025 SF & 1,607 SF<br />
Rental Rate:<br />
$22.00/SF/YR, NNN<br />
Comments:<br />
• Highly visible from SW <strong>Barnes</strong> Rd<br />
• Established neighborhood center – Joy Wok &<br />
Subway<br />
• Adjacent to the West Hills Shopping Center with<br />
QFC, Cold Stone Creamery, Starbucks &<br />
Beard’s Framing<br />
Traffic Count:<br />
<strong>Barnes</strong> Rd 19,904 ADT<br />
Demographics: 1 Mile 3 Miles 5 Miles<br />
Population 2010 6,381 85,285 292,580<br />
Population Forecast 2015 6,761 91,283 318,537<br />
2010 Average HH Income $112,156 $108,930 $83,661<br />
Employees 6,518 58,892 327,848<br />
Source: Regis - SitesUSA<br />
Gary Surgeon<br />
(503) 274-0211, Ext. 150<br />
gary@cra-nw.com<br />
<strong>Commercial</strong> <strong>Realty</strong> <strong>Advisors</strong> NW, LLC<br />
733 SW 2nd Avenue, Suite 200<br />
Portland, Oregon 97204<br />
www.cra-nw.com<br />
The information herein has been obtained from sources we deem reliable. We do not, however, guarantee its accuracy. All information should be verified prior to purchase/leasing.<br />
CRA PRINTS WITH 30% POST-CONSUMER, RECYCLED-CONTENT MATERIAL
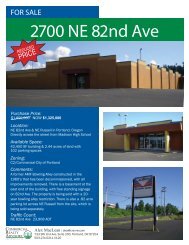
SW Portland, Oregon<br />
<br />
<br />
Walker Rd<br />
Cedar Mill<br />
<br />
Sylvan<br />
Cornell Rd<br />
St Vincent’s<br />
Hospital<br />
Forest<br />
Heights<br />
<strong>Village</strong><br />
<strong>Miller</strong> Rd<br />
<strong>Barnes</strong> Rd<br />
<br />
SITE<br />
Skyline Rd<br />
<br />
<br />
<br />
<br />
Lat: 45.5151 Lon: -122.754 Zoom: 9.37 mi Logos are for identification purposes only and may be trademarks of their respective companies.<br />
Murray Rd<br />
Jenkins Rd<br />
Cedar Hills<br />
Cedar Hills Blvd<br />
West Haven<br />
<br />
<br />
Patton Rd<br />
<br />
West Slope<br />
<br />
Canyon Rd<br />
Beaverton Hillsdale Hwy<br />
Raleigh Hills<br />
Scholls Ferry Rd<br />
<br />
<br />
<br />
Barbur Blvd<br />
<br />
Beaverton<br />
This map was produced using data from private and government sources deemed to be reliable. The information herein is provided without representation or warranty.
FULL PROFILE<br />
1990 - 2000 Census, 2010 Estimates with 2015 Projections<br />
Calculated using Proportional Block Groups<br />
Lat/Lon: 45.51659/-122.753<br />
7365 Sw <strong>Barnes</strong> Rd<br />
Portland, OR<br />
1 Mile 3 Miles 5 Miles<br />
AGE<br />
HOUSEHOLDS POPULATION<br />
MARITAL STATUS<br />
INCOME<br />
& SEX<br />
2010 Estimated Population 6,381 85,285 292,580<br />
2015 Projected Population 6,761 91,283 318,537<br />
2000 Census Population 5,473 75,177 254,714<br />
1990 Census Population 4,851 67,393 217,291<br />
Historical Annual Growth 1990 to 2010 1.6% 1.3% 1.7%<br />
Projected Annual Growth 2010 to 2015 1.2% 1.4% 1.8%<br />
2010 Est. Households 2,768 37,818 128,534<br />
2015 Proj. Households 2,808 38,800 134,900<br />
2000 Census Households 2,471 34,800 114,916<br />
1990 Census Households 2,100 31,141 97,992<br />
Historical Annual Growth 1990 to 2010 1.6% 1.1% 1.6%<br />
Projected Annual Growth 2010 to 2015 0.3% 0.5% 1.0%<br />
2010 Est. Population 0 to 9 Years 10.8% 11.2% 11.4%<br />
2010 Est. Population 10 to 19 Years 10.3% 9.9% 10.1%<br />
2010 Est. Population 20 to 29 Years 12.5% 12.9% 15.6%<br />
2010 Est. Population 30 to 44 Years 21.1% 23.2% 24.6%<br />
2010 Est. Population 45 to 59 Years 25.1% 23.9% 21.5%<br />
2010 Est. Population 60 to 74 Years 14.4% 13.4% 11.8%<br />
2010 Est. Population 75 Years Plus 5.8% 5.6% 5.0%<br />
2010 Est. Median Age 40.2 39.4 36.9<br />
2010 Est. Male Population 49.6% 49.7% 50.4%<br />
2010 Est. Female Population 50.4% 50.3% 49.6%<br />
2010 Est. Never Married 29.0% 29.8% 33.9%<br />
2010 Est. Now Married 52.4% 50.6% 44.2%<br />
2010 Est. Separated or Divorced 14.1% 14.6% 16.9%<br />
2010 Est. Widowed 4.6% 5.0% 5.0%<br />
2010 Est. HH Income $200,000 or More 11.8% 11.0% 6.2%<br />
2010 Est. HH Income $150,000 to $199,999 12.4% 10.2% 6.5%<br />
2010 Est. HH Income $100,000 to $149,999 17.3% 16.8% 14.2%<br />
2010 Est. HH Income $75,000 to $99,999 12.1% 10.8% 11.1%<br />
2010 Est. HH Income $50,000 to $74,999 14.9% 13.9% 15.6%<br />
2010 Est. HH Income $35,000 to $49,999 11.9% 10.6% 12.2%<br />
2010 Est. HH Income $25,000 to $34,999 6.8% 8.7% 10.0%<br />
2010 Est. HH Income $15,000 to $24,999 6.9% 7.9% 10.4%<br />
2010 Est. HH Income $0 to $14,999 6.0% 10.2% 13.8%<br />
2010 Est. Average Household Income $112,156 $108,930 $83,661<br />
2010 Est. Median HH Income $83,995 $79,501 $62,507<br />
2010 Est. Per Capita Income $49,268 $48,802 $37,725<br />
This report was produced using data from private and government sources deemed to be reliable. The information herein is provided without representation or warranty.<br />
2010 Est. Number of Businesses 488 5,215 22,756<br />
2010 Est. Total Number of Employees 6,518 58,892 327,848<br />
©2011, Sites USA, Chandler, Arizona, 480-491-1112 page 1 of 3 Demographic Source: Applied Geographic Solutions 10/2010, TIGER Geography
FULL PROFILE<br />
1990 - 2000 Census, 2010 Estimates with 2015 Projections<br />
Calculated using Proportional Block Groups<br />
Lat/Lon: 45.51659/-122.753<br />
7365 Sw <strong>Barnes</strong> Rd<br />
Portland, OR<br />
1 Mile 3 Miles 5 Miles<br />
HISPANIC RACE<br />
EDUCATION<br />
(Adults 25 or Older)<br />
HOME VALUES<br />
HOMES BUILT BY YEAR HOUSING<br />
2010 Est. White Population 88.5% 87.4% 80.7%<br />
2010 Est. Black Population 2.1% 1.8% 4.5%<br />
2010 Est. Asian & Pacific Islander 5.5% 5.6% 7.9%<br />
2010 Est. American Indian & Alaska Native 0.6% 0.7% 1.0%<br />
2010 Est. Other Races Population 3.4% 4.5% 5.9%<br />
2010 Est. Hispanic Population 469 7,542 31,992<br />
2010 Est. Hispanic Population Percent 7.3% 8.8% 10.9%<br />
2015 Proj. Hispanic Population Percent 8.9% 10.0% 12.2%<br />
2000 Hispanic Population Percent<br />
2010 Est. Adult Population (25 Years or Older) 4,673 62,859 210,132<br />
2010 Est. Elementary (0 to 8) 1.4% 2.3% 3.4%<br />
2010 Est. Some High School (9 to 11) 2.5% 2.7% 4.0%<br />
2010 Est. High School Graduate (12) 11.1% 11.8% 15.7%<br />
2010 Est. Some College (13 to 16) 19.6% 18.2% 20.4%<br />
2010 Est. Associate Degree Only 6.0% 5.8% 6.5%<br />
2010 Est. Bachelor Degree Only 32.8% 33.0% 29.6%<br />
2010 Est. Graduate Degree 26.6% 26.2% 20.4%<br />
2010 Est. Total Housing Units 2,924 40,323 137,881<br />
2010 Est. Owner Occupied Percent 60.3% 54.4% 48.2%<br />
2010 Est. Renter Occupied Percent 34.4% 39.4% 45.0%<br />
2010 Est. Vacant Housing Percent 5.3% 6.2% 6.8%<br />
2000 Homes Built 1999 to 2000 2.1% 2.1% 2.4%<br />
2000 Homes Built 1995 to 1998 5.0% 5.4% 7.9%<br />
2000 Homes Built 1990 to 1994 11.7% 6.0% 6.4%<br />
2000 Homes Built 1980 to 1989 18.6% 9.5% 11.2%<br />
2000 Homes Built 1970 to 1979 26.1% 19.3% 18.3%<br />
2000 Homes Built 1960 to 1969 17.0% 16.6% 14.1%<br />
2000 Homes Built 1950 to 1959 9.9% 15.3% 11.2%<br />
2000 Homes Built Before 1949 9.5% 25.7% 28.3%<br />
2000 Home Value $1,000,000 or More 1.7% 1.4% 0.6%<br />
2000 Home Value $500,000 to $999,999 11.0% 11.7% 5.3%<br />
2000 Home Value $400,000 to $499,999 9.8% 10.8% 5.5%<br />
2000 Home Value $300,000 to $399,999 17.9% 17.4% 10.7%<br />
2000 Home Value $200,000 to $299,999 40.3% 30.2% 26.3%<br />
2000 Home Value $150,000 to $199,999 13.4% 18.8% 27.9%<br />
2000 Home Value $100,000 to $149,999 3.3% 8.3% 19.1%<br />
2000 Home Value $50,000 to $99,999 2.0% 1.1% 3.8%<br />
2000 Home Value $25,000 to $49,999 0.8% 0.2% 0.4%<br />
2000 Home Value $0 to $24,999 - 0.1% 0.3%<br />
2000 Median Home Value $287,514 $298,015 $229,343<br />
2000 Median Rent $692 $609 $582<br />
This report was produced using data from private and government sources deemed to be reliable. The information herein is provided without representation or warranty.<br />
©2011, Sites USA, Chandler, Arizona, 480-491-1112 page 2 of 3 Demographic Source: Applied Geographic Solutions 10/2010, TIGER Geography
FULL PROFILE<br />
1990 - 2000 Census, 2010 Estimates with 2015 Projections<br />
Calculated using Proportional Block Groups<br />
Lat/Lon: 45.51659/-122.753<br />
7365 Sw <strong>Barnes</strong> Rd<br />
Portland, OR<br />
TRANSPORTATION<br />
LABOR FORCE<br />
OCCUPATION<br />
TRAVEL TIME<br />
CONSUMER EXPENDITURE<br />
TO WORK<br />
1 Mile 3 Miles 5 Miles<br />
2010 Est. Labor: Population Age 16+ 5,278 70,473 241,485<br />
2010 Est. Civilian Employed 62.7% 62.9% 61.9%<br />
2010 Est. Civilian Unemployed 6.8% 7.0% 8.9%<br />
2010 Est. in Armed Forces 0.1% 0.1% 0.1%<br />
2010 Est. not in Labor Force 30.4% 30.0% 29.2%<br />
2010 Labor Force: Males 49.2% 49.4% 50.3%<br />
2010 Labor Force: Females 50.8% 50.6% 49.7%<br />
2000 Occupation: Population Age 16+ 3,063 41,764 139,664<br />
2000 Mgmt, Business, & Financial Operations 25.2% 21.5% 18.0%<br />
2000 Professional & Related 30.7% 31.0% 28.2%<br />
2000 Service 8.5% 10.7% 12.6%<br />
2000 Sales and Office 23.1% 25.4% 26.2%<br />
2000 Farming, Fishing, and Forestry 0.1% 0.2% 0.3%<br />
2000 Construction, Extraction, & Maintenance 4.0% 4.0% 5.3%<br />
2000 Production, Transport, & Material Moving 8.4% 7.3% 9.5%<br />
2000 Percent White Collar Workers 79.0% 77.8% 72.4%<br />
2000 Percent Blue Collar Workers 21.0% 22.2% 27.6%<br />
2000 Drive to Work Alone 76.1% 68.5% 65.6%<br />
2000 Drive to Work in Carpool 7.6% 8.4% 9.8%<br />
2000 Travel to Work by Public Transportation 7.8% 9.7% 10.7%<br />
2000 Drive to Work on Motorcycle 0.1% 0.1% 0.1%<br />
2000 Walk or Bicycle to Work 2.1% 6.6% 8.3%<br />
2000 Other Means 0.4% 0.5% 0.6%<br />
2000 Work at Home 5.9% 6.1% 4.9%<br />
2000 Travel to Work in 14 Minutes or Less 22.9% 28.9% 30.3%<br />
2000 Travel to Work in 15 to 29 Minutes 56.0% 48.6% 44.9%<br />
2000 Travel to Work in 30 to 59 Minutes 18.1% 19.0% 20.9%<br />
2000 Travel to Work in 60 Minutes or More 2.9% 3.5% 3.9%<br />
2000 Average Travel Time to Work 19.7 19.3 19.9<br />
2010 Est. Total Household Expenditure $212 M $2.80 B $7.88 B<br />
2010 Est. Apparel $10.3 M $136 M $380 M<br />
2010 Est. Contributions & Gifts $15.8 M $207 M $541 M<br />
2010 Est. Education & Reading $6.72 M $89.1 M $236 M<br />
2010 Est. Entertainment $12.0 M $158 M $441 M<br />
2010 Est. Food, Beverages & Tobacco $32.2 M $427 M $1.23 B<br />
2010 Est. Furnishings & Equipment $9.73 M $128 M $352 M<br />
2010 Est. Health Care & Insurance $14.6 M $193 M $554 M<br />
2010 Est. Household Operations & Shelter & Utilities $63.6 M $842 M $2.37 B<br />
2010 Est. Miscellaneous Expenses $3.40 M $45.0 M $130 M<br />
2010 Est. Personal Care $3.03 M $40.1 M $114 M<br />
2010 Est. Transportation $40.6 M $534 M $1.53 B<br />
This report was produced using data from private and government sources deemed to be reliable. The information herein is provided without representation or warranty.<br />
©2011, Sites USA, Chandler, Arizona, 480-491-1112 page 3 of 3 Demographic Source: Applied Geographic Solutions 10/2010, TIGER Geography