Hillsboro West Plaza - Cra-nw.com
Hillsboro West Plaza - Cra-nw.com
Hillsboro West Plaza - Cra-nw.com

Create successful ePaper yourself
Turn your PDF publications into a flip-book with our unique Google optimized e-Paper software.
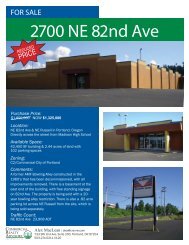
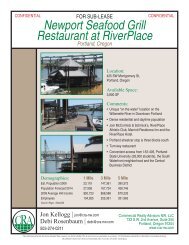
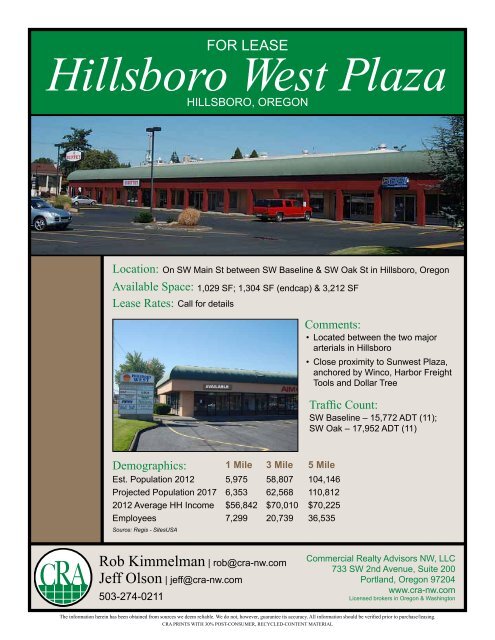
For lease<strong>Hillsboro</strong> <strong>West</strong> <strong>Plaza</strong>hillsboro, OregonLocation:Available Space:Lease Rates:On SW Main St between SW Baseline & SW Oak St in <strong>Hillsboro</strong>, Oregon1,029 SF; 1,304 SF (endcap) & 3,212 SFCall for detailsComments:• Located between the two majorarterials in <strong>Hillsboro</strong>• Close proximity to Su<strong>nw</strong>est <strong>Plaza</strong>,anchored by Winco, Harbor FreightTools and Dollar TreeTraffic Count:SW Baseline – 15,772 ADT (11);SW Oak – 17,952 ADT (11)Demographics: 1 Mile 3 Mile 5 MileEst. Population 2012 5,975 58,807 104,146Projected Population 2017 6,353 62,568 110,8122012 Average HH In<strong>com</strong>e $56,842 $70,010 $70,225Employees 7,299 20,739 36,535Source: Regis - SitesUSARob Kimmelman | rob@cra-<strong>nw</strong>.<strong>com</strong>Jeff Olson | jeff@cra-<strong>nw</strong>.<strong>com</strong>503-274-0211Commercial Realty Advisors NW, LLC733 SW 2nd Avenue, Suite 200Portland, Oregon 97204www.cra-<strong>nw</strong>.<strong>com</strong>Licensed brokers in Oregon & WashingtonThe information herein has been obtained from sources we deem reliable. We do not, however, guarantee its accuracy. All information should be verified prior to purchase/leasing.CRA PRINTS WITH 30% POST-CONSUMER, RECYCLED-CONTENT MATERIAL
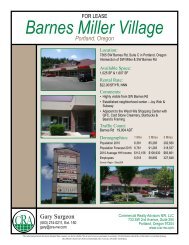
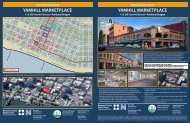
cornelius & hillsboro, oregonKILLARNEY WESTGOLF COURSEHare FieldMCKAY CREEKGOLF COURSELincoln StreetElementaryWASHINGTONCOUNTYOFFICESCINEMAsiteHILLSBOROCAMPUSTUALITYHOSPITALFree OrchardsElementaryPOSTOFFICEDAIRYCREEK PARKSHUTE PARKAQUATIC0 0.5 1Miles
tdemographic map | hillsboro
FULL PROFILE2000 - 2010 Census, 2012 Estimates with 2017 ProjectionsCalculated using Proportional Block GroupsLat/Lon: 45.51912/-123.0029SW Main St & SW Oak<strong>Hillsboro</strong>, OR1 Mile 3 Miles 5 MilesAGEHOUSEHOLDS POPULATIONMARITAL STATUSINCOME& SEX2012 Estimated Population 5,975 58,807 104,1462017 Projected Population 6,353 62,568 110,8122010 Census Population 5,804 57,112 101,1452000 Census Population 5,137 48,829 82,722Historical Annual Growth 2000 to 2012 1.4% 1.7% 2.2%Projected Annual Growth 2012 to 2017 1.3% 1.3% 1.3%2012 Est. Households 1,884 18,981 35,2672017 Proj. Households 1,999 20,146 37,4322010 Census Households 1,831 18,453 34,2832000 Census Households 1,532 15,630 27,673Historical Annual Growth 2000 to 2012 1.9% 1.8% 2.3%Projected Annual Growth 2012 to 2017 1.2% 1.2% 1.2%2012 Est. Population 0 to 9 Years 13.9% 16.5% 16.0%2012 Est. Population 10 to 19 Years 13.7% 15.2% 14.9%2012 Est. Population 20 to 29 Years 15.1% 13.0% 13.3%2012 Est. Population 30 to 44 Years 25.0% 23.3% 23.4%2012 Est. Population 45 to 59 Years 19.9% 18.3% 18.0%2012 Est. Population 60 to 74 Years 9.3% 10.1% 10.2%2012 Est. Population 75 Years Plus 3.1% 3.6% 4.3%2012 Est. Median Age 33.0 32.7 32.92012 Est. Male Population 53.9% 50.8% 50.1%2012 Est. Female Population 46.1% 49.2% 49.9%2012 Est. Never Married 39.6% 33.3% 33.7%2012 Est. Now Married 39.0% 50.1% 49.7%2012 Est. Separated or Divorced 20.9% 15.1% 14.9%2012 Est. Widowed 0.5% 1.5% 1.8%2012 Est. HH In<strong>com</strong>e $200,000 or More 2.8% 4.2% 4.1%2012 Est. HH In<strong>com</strong>e $150,000 to $199,999 1.7% 3.1% 3.3%2012 Est. HH In<strong>com</strong>e $100,000 to $149,999 9.6% 13.7% 14.0%2012 Est. HH In<strong>com</strong>e $75,000 to $99,999 13.4% 14.7% 14.8%2012 Est. HH In<strong>com</strong>e $50,000 to $74,999 17.4% 21.4% 22.4%2012 Est. HH In<strong>com</strong>e $35,000 to $49,999 12.9% 14.2% 14.2%2012 Est. HH In<strong>com</strong>e $25,000 to $34,999 14.4% 11.0% 10.0%2012 Est. HH In<strong>com</strong>e $15,000 to $24,999 12.9% 8.8% 9.5%2012 Est. HH In<strong>com</strong>e $0 to $14,999 15.0% 8.7% 7.7%2012 Est. Average Household In<strong>com</strong>e $56,842 $70,010 $70,2252012 Est. Median HH In<strong>com</strong>e $45,904 $59,811 $60,2082012 Est. Per Capita In<strong>com</strong>e $19,234 $22,969 $24,140This report was produced using data from private and government sources deemed to be reliable. The information herein is provided without representation or warranty.2012 Est. Number of Businesses 582 1,860 3,0442012 Est. Total Number of Employees 7,299 20,739 36,535©2012, Sites USA, Chandler, Arizona, 480-491-1112 page 1 of 3 Demographic Source: Applied Geographic Solutions 6/2012, TIGER Geography
FULL PROFILE2000 - 2010 Census, 2012 Estimates with 2017 ProjectionsCalculated using Proportional Block GroupsLat/Lon: 45.51912/-123.0029SW Main St & SW Oak<strong>Hillsboro</strong>, OR1 Mile 3 Miles 5 MilesHISPANIC RACEEDUCATION(Adults 25 or Older)HOME VALUESHOMES BUILT BY YEAR HOUSING2012 Est. White Population 68.8% 69.6% 69.8%2012 Est. Black Population 1.7% 1.3% 1.4%2012 Est. Asian & Pacific Islander 3.3% 4.7% 6.8%2012 Est. American Indian & Alaska Native 1.0% 1.0% 0.9%2012 Est. Other Races Population 25.1% 23.5% 21.1%2012 Est. Hispanic Population 1,910 19,952 29,9162012 Est. Hispanic Population Percent 32.0% 33.9% 28.7%2017 Proj. Hispanic Population Percent 35.0% 37.1% 31.5%2010 Hispanic Population Percent 30.5% 32.3% 27.3%2012 Est. Adult Population (25 Years or Older) 3,892 36,482 65,2722012 Est. Elementary (0 to 8) 14.3% 11.8% 9.1%2012 Est. Some High School (9 to 11) 6.0% 7.9% 7.4%2012 Est. High School Graduate (12) 28.2% 23.0% 23.5%2012 Est. Some College (13 to 16) 22.7% 22.5% 24.1%2012 Est. Associate Degree Only 6.4% 7.1% 7.4%2012 Est. Bachelor Degree Only 18.4% 19.4% 19.7%2012 Est. Graduate Degree 4.0% 8.3% 8.7%2012 Est. Total Housing Units 2,006 19,850 37,0192012 Est. Owner Occupied Percent 51.9% 59.9% 58.4%2012 Est. Renter Occupied Percent 42.0% 35.7% 36.9%2012 Est. Vacant Housing Percent 6.1% 4.4% 4.7%2010 Homes Built 2005 or later 7.5% 8.3% 8.7%2010 Homes Built 2000 to 2004 13.9% 10.0% 11.8%2010 Homes Built 1990 to 1999 12.8% 20.2% 23.6%2010 Homes Built 1980 to 1989 10.1% 12.2% 12.3%2010 Homes Built 1970 to 1979 20.0% 21.5% 19.1%2010 Homes Built 1960 to 1969 10.0% 9.2% 8.2%2010 Homes Built 1950 to 1959 9.3% 7.4% 6.1%2010 Homes Built Before 1949 16.4% 11.2% 10.2%2010 Home Value $1,000,000 or More 0.2% 0.5% 0.7%2010 Home Value $500,000 to $999,999 2.4% 3.7% 4.1%2010 Home Value $400,000 to $499,999 3.7% 5.4% 5.3%2010 Home Value $300,000 to $399,999 22.2% 20.1% 19.9%2010 Home Value $200,000 to $299,999 41.3% 43.1% 44.0%2010 Home Value $150,000 to $199,999 17.7% 15.8% 13.7%2010 Home Value $100,000 to $149,999 3.2% 4.3% 4.3%2010 Home Value $50,000 to $99,999 2.8% 1.8% 1.9%2010 Home Value $25,000 to $49,999 1.5% 1.3% 1.1%2010 Home Value $0 to $24,999 5.0% 4.1% 4.8%2010 Median Home Value $238,617 $250,443 $251,6862010 Median Rent $659 $774 $816This report was produced using data from private and government sources deemed to be reliable. The information herein is provided without representation or warranty.©2012, Sites USA, Chandler, Arizona, 480-491-1112 page 2 of 3 Demographic Source: Applied Geographic Solutions 6/2012, TIGER Geography
FULL PROFILE2000 - 2010 Census, 2012 Estimates with 2017 ProjectionsCalculated using Proportional Block GroupsLat/Lon: 45.51912/-123.0029SW Main St & SW Oak<strong>Hillsboro</strong>, ORLABOR FORCEOCCUPATIONTRANSPORTATIONTO WORKTRAVEL TIMECONSUMER EXPENDITURE1 Mile 3 Miles 5 Miles2012 Est. Labor: Population Age 16+ 4,676 43,619 78,2112012 Est. Civilian Employed 54.4% 58.5% 59.9%2012 Est. Civilian Unemployed 11.8% 10.8% 10.3%2012 Est. in Armed Forces - 0.2% 0.1%2012 Est. not in Labor Force 33.7% 30.6% 29.7%2012 Labor Force: Males 54.5% 50.5% 49.6%2012 Labor Force: Females 45.5% 49.5% 50.4%2010 Occupation: Population Age 16+ 2,292 24,991 45,4462010 Mgmt, Business, & Financial Operations 6.5% 12.3% 12.2%2010 Professional & Related 17.2% 21.9% 23.4%2010 Service 27.0% 20.5% 19.6%2010 Sales and Office 23.8% 21.5% 22.2%2010 Farming, Fishing, and Forestry 4.3% 4.5% 3.6%2010 Construction, Extraction, & Maintenance 5.9% 7.6% 7.5%2010 Production, Transport, & Material Moving 15.3% 11.6% 11.5%2010 Percent White Collar Workers 47.5% 55.7% 57.8%2010 Percent Blue Collar Workers 52.5% 44.3% 42.2%2010 Drive to Work Alone 65.7% 71.7% 72.7%2010 Drive to Work in Carpool 12.9% 11.6% 10.6%2010 Travel to Work by Public Transportation 10.9% 7.2% 6.4%2010 Drive to Work on Motorcycle 0.2% 0.4% 0.3%2010 Walk or Bicycle to Work 4.9% 4.1% 4.6%2010 Other Means 1.0% 0.5% 0.6%2010 Work at Home 4.4% 4.5% 4.8%2010 Travel to Work in 14 Minutes or Less 27.3% 29.0% 29.7%2010 Travel to Work in 15 to 29 Minutes 42.4% 33.2% 33.7%2010 Travel to Work in 30 to 59 Minutes 24.1% 29.8% 29.1%2010 Travel to Work in 60 Minutes or More 6.2% 8.0% 7.6%2010 Average Travel Time to Work 19.7 22.0 21.22012 Est. Total Household Expenditure $89.1 M $1.03 B $1.93 B2012 Est. Apparel $4.27 M $49.6 M $92.6 M2012 Est. Contributions & Gifts $5.42 M $65.6 M $123 M2012 Est. Education & Reading $2.35 M $28.2 M $52.8 M2012 Est. Entertainment $4.96 M $57.9 M $108 M2012 Est. Food, Beverages & Tobacco $14.5 M $165 M $307 M2012 Est. Furnishings & Equipment $3.85 M $45.8 M $85.6 M2012 Est. Health Care & Insurance $6.46 M $73.0 M $136 M2012 Est. Household Operations & Shelter & Utilities $26.6 M $308 M $575 M2012 Est. Miscellaneous Expenses $1.50 M $17.1 M $32.0 M2012 Est. Personal Care $1.30 M $15.0 M $28.0 M2012 Est. Transportation $17.9 M $208 M $388 MThis report was produced using data from private and government sources deemed to be reliable. The information herein is provided without representation or warranty.©2012, Sites USA, Chandler, Arizona, 480-491-1112 page 3 of 3 Demographic Source: Applied Geographic Solutions 6/2012, TIGER Geography