Better than growth - Australian Conservation Foundation
Better than growth - Australian Conservation Foundation
Better than growth - Australian Conservation Foundation

You also want an ePaper? Increase the reach of your titles
YUMPU automatically turns print PDFs into web optimized ePapers that Google loves.
2010<br />
<strong>Better</strong><br />
<strong>than</strong><br />
<strong>growth</strong><br />
The new economics of genuine progress and quality of life<br />
a primer for policy innovation
Contents<br />
03 Introduction<br />
<strong>Australian</strong> <strong>Conservation</strong> <strong>Foundation</strong><br />
Floor 1, 60 Leicester Street<br />
Carlton VIC 3053<br />
Australia<br />
+61 3 9345 1111<br />
acf@acfonline.org.au<br />
www.acfonline.org.au<br />
First published in 2010 by the <strong>Australian</strong> <strong>Conservation</strong> <strong>Foundation</strong><br />
ISBN: 978-0-85802-164-8<br />
© 2010, <strong>Australian</strong> <strong>Conservation</strong> <strong>Foundation</strong><br />
Author<br />
This report was prepared by Charles Berger, ACF Director of Strategic Ideas.<br />
The <strong>Australian</strong> <strong>Conservation</strong> <strong>Foundation</strong> (ACF) is committed to inspiring<br />
people to achieve a healthy environment for all <strong>Australian</strong>s. For over 40<br />
years we have been a strong voice for the environment, promoting solutions<br />
through research, consultation, education and partnerships. We work with<br />
the community, business and government to protect, restore and sustain our<br />
environment.<br />
Design and production: Coretext, www.coretext.com.au<br />
Photography: Paul Jones, www.pauljonesphotography.com.au<br />
05 <strong>Better</strong> progress<br />
Improving quality of life, not quantity of wealth<br />
11 <strong>Better</strong> work<br />
Balancing paid and non-paid work, family and leisure time<br />
15 <strong>Better</strong> production<br />
Making cradle-to-cradle manufacturing a reality<br />
17 <strong>Better</strong> consumption<br />
Stepping off the consumer treadmill<br />
21 <strong>Better</strong> markets<br />
Aligning prices with social and environmental impacts<br />
25 <strong>Better</strong> business<br />
Matching private incentives with long-term public goals<br />
29 <strong>Better</strong> taxation<br />
Rewarding work, not waste<br />
33 <strong>Better</strong> regulation<br />
Fixing cost-benefit analysis<br />
37 Conclusion<br />
Towards a new economics<br />
39 Further information<br />
2<br />
ACF BETTER THAN GROWTH
Introduction<br />
› The economic models of the 20th century are now hitting the limits of what is<br />
possible – possible in terms of delivering better livelihoods for the 2.6 billion people<br />
still living on less <strong>than</strong> $2 a day and possible in terms of our ecological footprint. ‹<br />
<br />
Pavan Sukhdev, Head Global Markets, Deutsche Bank<br />
For most industrialised countries, the 20th century brought great strides<br />
in health and life expectancy, access to education and social services, civil<br />
rights and equity, and material prosperity.<br />
During this period, the prevailing thought was that material prosperity<br />
was the essential gateway to social progress and individual quality of life.<br />
This model of development has become an article of faith among rich and<br />
poor countries alike.<br />
To be sure, a certain standard of material wealth for individuals and nations<br />
is necessary for many essential needs, such as health care, education, housing<br />
and good nutrition. But is the emphasis on economic <strong>growth</strong> as the leading<br />
measurement of a society’s progress really working well for us?<br />
Many think that we can do better, and not just those outside the<br />
economic mainstream. When the head of global markets at Deutsche Bank<br />
calls on us to re-think the economic models of the 20th century, for example,<br />
we should listen carefully.<br />
There are at least three reasons to be sceptical of economic strategies<br />
that focus heavily on increasing the material wealth of already affluent<br />
nations such as Australia.<br />
First, ongoing increases in wealth in affluent countries are no longer<br />
leading to improvements in people’s actual quality of life. Even as<br />
consumption goes up, wealthy countries are struggling with so-called<br />
‘diseases of affluence’, such as depression, social isolation, stress and<br />
overwork, obesity, and erosion of community connections.<br />
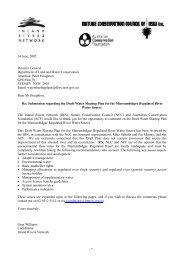
FIGURE 1: INDICATORS OF AUSTRALIAN ENVIRONMENTAL<br />
PRESSURE, 1951 TO 2001<br />
Index: 1961 = 100<br />
400<br />
300<br />
200<br />
100<br />
0<br />
1951 1961 1971 1981 1991 2001<br />
CO 2 emissions Material flows, total Material flows, renewable<br />
Land degradation Intensive land use Water use<br />
SOURCE: CALCULATED FROM ASFF DATA, CSIRO<br />
Second, the development strategy pursued during the 20th century<br />
has triggered an accelerating ecological crisis. Biodiversity and habitat<br />
loss, greenhouse pollution and scarcity of key resources such as water and<br />
petroleum suggest that future economic structures cannot simply replicate<br />
the patterns of past development. For example, Australia’s economy has<br />
become more efficient over the past 50 years, but total environmental<br />
impacts have increased dramatically 1 (see Figure 1).<br />
1. Steve Hatfield-Dodds,<br />
’Economic Growth,<br />
Employment, and<br />
Environmental Pressure:<br />
Insights from <strong>Australian</strong><br />
experience 1951-2001‘,<br />
Working Paper, ANU<br />
Environmental Economics<br />
Network (18 November<br />
2004),<br />
een.anu.edu.au/esemhatf.<br />
pdf<br />
ACF BETTER THAN GROWTH 3
introduction<br />
Finally, and most interestingly, some countries seem to have succeeded<br />
in providing very high levels of wellbeing without high levels of material<br />
wealth. In Costa Rica, for example, people lead long, healthy lives and<br />
report high degrees of personal satisfaction, despite Costa Rica having far<br />
less wealth <strong>than</strong> most industrialised nations.<br />
For Australia, the critical economic challenge is no longer how to<br />
increase the production of goods and services. Many of the things that<br />
<strong>Australian</strong>s desire – leisure time, vibrant communities, a thriving natural<br />
environment, a sense of purpose and wellness in our lives – will not flow<br />
automatically from a growing economy. We need a new approach: not one<br />
framed in opposition to economic <strong>growth</strong>, but one that is actively better<br />
<strong>than</strong> <strong>growth</strong>.<br />
This report addresses the following eight themes, each of which is an<br />
important component in a better-<strong>than</strong>-<strong>growth</strong> economy:<br />
1<strong>Better</strong> progress<br />
Improving quality of life, not quantity of wealth<br />
Emphasising measurements of social and individual wellbeing,<br />
and ecological health, will give us better results <strong>than</strong> focusing on<br />
narrow economic measurements such as GDP.<br />
2<strong>Better</strong> work<br />
Balancing paid and non-paid work, family and leisure time<br />
While some <strong>Australian</strong>s are unemployed, many more are<br />
overemployed. We’d be better off reducing average working hours<br />
and increasing time available for leisure, family, community and<br />
our democracy.<br />
3<strong>Better</strong> production<br />
Making cradle-to-cradle manufacturing a reality<br />
Rather <strong>than</strong> producing disposable goods that are destined for<br />
the tip, we should reorient design and manufacturing toward<br />
completely reusable products.<br />
4<strong>Better</strong> consumption<br />
Stepping off the consumer treadmill<br />
Overconsumption is at the root of many social and environmental<br />
challenges. Government can support people to become smart<br />
consumers; to consume less and consume smarter.<br />
5<strong>Better</strong> markets<br />
Aligning prices with social and environmental impacts<br />
Ensuring that the full environmental and social costs are included in<br />
the price tag of goods and services will stimulate a cleaner economy.<br />
6<strong>Better</strong> business<br />
Matching private incentives with long-term public goals<br />
Businesses that focus too much on short-term profits are unlikely<br />
to be part of a long-term transition to a more sustainable economy.<br />
Supporting non-profit business models and ensuring that executive<br />
compensation rewards long-term performance are needed.<br />
7<strong>Better</strong> taxation<br />
Rewarding work, not waste<br />
Shifting taxes away from productive activity such as income<br />
generation and towards pollution and resource use would create<br />
jobs while improving environmental performance throughout the<br />
economy.<br />
8<strong>Better</strong> regulation<br />
Fixing cost-benefit analysis<br />
Much government analysis depends on cost-benefit calculations<br />
which are based on faulty assumptions and exclude the full value<br />
of the natural environment. We should insist that cost-benefit<br />
analysis include all aspects of wellbeing.<br />
Fortunately, many of the solutions are staring us in the face. As William<br />
Gibson said, “The future is here, it’s just not widely distributed yet.”<br />
In each of this report’s sections, we outline some of the best thinking from<br />
around the world on what is needed to transform to a better-<strong>than</strong>-<strong>growth</strong><br />
economy. All of these ideas and specific policy recommendations are already<br />
being implemented or seriously considered somewhere around the globe.<br />
Our responsibility must be to put these ideas to work for Australia<br />
as well.<br />
4<br />
ACF BETTER THAN GROWTH
1 <strong>Better</strong> progress<br />
improving quality of life, not quantity of wealth<br />
› Economic <strong>growth</strong> is not to be pursued for its own sake. ‹<br />
australian Treasury, 1973 2<br />
› We should dethrone the idea that maximising the <strong>growth</strong> in measured prosperity,<br />
GDP per capita, should be an explicit objective of economic and social policy. ‹<br />
Adair Turner, Chair of the UK Financial Services Authority, 2007<br />
In 2007, the UK Conservative Party issued a landmark report, Blueprint for<br />
a Green Economy, the first serious attempt by a major political party in the<br />
industrialised world to refocus attention away from economic <strong>growth</strong> and<br />
towards real quality of life. The authors reached the startling conclusion<br />
that increasing material prosperity has become counterproductive in<br />
wealthy societies:<br />
… beyond a certain point – a point which the UK reached some time ago<br />
– ever-increasing material gain can become not a gift but a burden. As<br />
people, it makes us less happy, and the environment upon which all of<br />
us, and our economy, depend is increasingly degraded by it. 3<br />
The same can be said of Australia. According to extensive survey<br />
data from the <strong>Australian</strong> Unity Wellbeing Index, there has been no<br />
overall improvement in our sense of wellbeing since the survey started<br />
in 2001, despite a continually growing economy. Meanwhile, Australia<br />
confronts worsening trends on critical issues such as greenhouse<br />
pollution, health issues (including depression and obesity), traffic<br />
congestion, Indigenous disadvantage, and growing levels of social<br />
exclusion and inequity.<br />
The usual measures of economic success fail to capture many aspects<br />
of our quality of life, and exclude the dimension of sustainability. A<br />
recent review by a group of prominent economists, chaired by former<br />
World Bank chief economist Joseph Stiglitz, highlighted the numerous<br />
shortcomings of the GDP, even as a measure of market activity. 4 For<br />
example, GDP ignores or obscures the costs of environmental damage<br />
and resource depletion, the value of non-paid work and leisure time,<br />
the distribution of wealth, and ‘defensive expenditures’ such as prisons<br />
and pollution clean-up costs, which add to GDP despite being based on<br />
undesirable conditions.<br />
From October 2007 to October 2008, satisfaction<br />
with life in Australia increased by 1.3 points –<br />
even as satisfaction with the economy fell by<br />
12.4 points. 5<br />
2. <strong>Australian</strong> Treasury,<br />
’Economic Growth: Is it<br />
Worth Having?’, <strong>Australian</strong><br />
Government Publishing<br />
Service (1973), Foreword,<br />
www.treasury.gov.au/<br />
documents/1689/PDF/<br />
Treasury_1973_Economic_<br />
Growth_is_it_worth_<br />
having.pdf<br />
3. UK Conservative Party,<br />
Quality of Life Policy<br />
Group, Blueprint for a<br />
Green Economy (2007), p.8,<br />
www.qualityoflifechallenge.<br />
com/documents/<br />
fullreport-1.pdf<br />
4. Commission on the<br />
Measurement of Economic<br />
Performance and Social<br />
Progress, Final Report<br />
(2009),<br />
www.stiglitz-sen-fitoussi.<br />
fr/documents/rapport_<br />
anglais.pdf<br />
5. <strong>Australian</strong> Unity<br />
Wellbeing Index,<br />
Wellbeing Monitor,<br />
August 2009,<br />
www.australianunity<br />
corporate.com.au/<br />
community/auwi<br />
ACF BETTER THAN GROWTH 5
etter progress<br />
6<br />
ACF BETTER THAN GROWTH
etter progress<br />
FIGURE 2: OECD FRAMEWORK FOR THE PROGRESS OF SOCIETIES 6<br />
Culture<br />
Human system<br />
Individual<br />
wellbeing<br />
Economy<br />
Social<br />
wellbeing<br />
Ecosystem services<br />
Governance<br />
Resource demand<br />
Ecosystem<br />
Ecosystem<br />
condition<br />
Our choice of measures to assess Australia’s progress is therefore<br />
critical. According to Stiglitz:<br />
What we measure affects what we do. If we have the wrong metrics, we<br />
will strive for the wrong things. In the quest to increase GDP, we may<br />
end up with a society in which most citizens have become worse off. We<br />
care, moreover, not just for how well-off we are today, but how well-off<br />
we will be in the future. If we are borrowing unsustainably from this<br />
future, we should want to know. 7<br />
So if GDP isn’t a good measure of our progress as a society, or our<br />
quality of life and wellbeing as individuals, what should we be measuring<br />
instead?<br />
The OECD has proposed a framework focusing on the ultimate goals<br />
of individual and social wellbeing, and healthy ecosystem condition<br />
(Figure 2). Culture, Economy and Governance are identified as important<br />
means for achieving those goals, and resource demands and ecosystem<br />
services are tracked as the links between human and natural systems. This<br />
framework offers a far more robust and sustainable model of progress,<br />
while still allowing for considerable diversity in how individuals and<br />
Estimated annual cost of mineral and resource<br />
depletion to Australia: $29 billion. 8 This cost is<br />
not reflected in our GDP.<br />
communities choose to value specific social and environmental assets.<br />
Such a framework leads to the construction of alternative indices and<br />
measures of progress. Some of the better-known examples of indicators<br />
of progress that better reflect our overall wellbeing and ecological<br />
sustainability include:<br />
• the UN Human Development Index;<br />
• the Happy Planet Index, an initiative of the New Economics <strong>Foundation</strong>;<br />
• the Economist Intelligence Unit’s Quality of Life Index;<br />
• the Genuine Progress Indicator, created by Redefining Progress, a<br />
US think tank; and<br />
• the WWF Living Planet Index.<br />
The Happy Planet Index, which tracks life expectancy, life satisfaction<br />
and ecological footprint of most countries, will surprise those who<br />
are accustomed to assuming that life is generally better in wealthy<br />
industrialised nations (see Figure 3, page 8). The citizens of Costa Rica, for<br />
instance, live nearly as long as <strong>Australian</strong>s, are more satisfied with their<br />
lives, and have less <strong>than</strong> a third of our impact on the environment – all on a<br />
per-capita GDP of around US$11,000, or 30 per cent of Australia’s wealth.<br />
The results of the Happy Planet Index are consistent with other global<br />
surveys of life satisfaction. A global Nielsen survey conducted in 2008<br />
found that: “Many of the world’s poorer and emerging markets outranked<br />
developed countries for happiness and satisfaction levels in nearly all<br />
aspects of their lives.” 9 Australia ranked as “rich but unhappy” in that<br />
survey.<br />
Australia has started to collect and present information more<br />
comprehensively on some social, environmental and cultural issues. The<br />
<strong>Australian</strong> Bureau of Statistics has developed ‘Measures of Australia’s<br />
Progress’, which includes a range of measures reflecting the health of<br />
individuals, communities, the environment and our democracy.<br />
In 2009, leaders of G20 nations recognised the need to use a broader<br />
range of progress measures, with a commitment to “encourage work on<br />
measurement methods so as to better take into account the social and<br />
environmental dimensions of economic development”. 10 And a seminal<br />
report by a leading group of economists convened by French President<br />
Nicholas Sarkozy recommended comprehensive reforms to GDP and other<br />
lead economic indicators (see box, page 9). 11<br />
But even though the overwhelming majority of <strong>Australian</strong>s think we<br />
6. OECD, A Framework to<br />
Measure the Progress of<br />
Societies, Working draft<br />
(September 2009), p.11,<br />
www.oecd.org/dataoecd/<br />
40/46/43631612.pdf<br />
7. Joseph Stiglitz, ‘Towards<br />
a better measure of<br />
wellbeing‘, Financial Times<br />
(13 September 2009)<br />
8. Derived from World<br />
Bank, World Development<br />
Indicators 2006, Table 3.15<br />
(Energy and mineral<br />
resource depletion<br />
estimated at 2.8 per cent<br />
of Australia’s national<br />
income),<br />
http://devdata.<br />
worldbank.org/wdi2006/<br />
contents/cover.htm<br />
9. Nielsen, ‘How men<br />
and women cope in a<br />
recession‘ (12 December<br />
2008),<br />
http://au.nielsen.com/<br />
news/documents/<br />
HappinessRelease_Dec08_<br />
Final.pdf<br />
10. Pittsburgh G20 Summit,<br />
Leader’s Statement<br />
(25 September 2009),<br />
www.<br />
pittsburghsummit.gov/<br />
mediacenter/129639.htm<br />
11. Commission on the<br />
Measurement of<br />
Economic Performance<br />
and Social Progress, Final<br />
Report (2009),<br />
www.stiglitz-sen-fitoussi.<br />
fr/documents/rapport_<br />
anglais.pdf<br />
ACF BETTER THAN GROWTH 7
etter progress<br />
12. GlobeScan Incorporated,<br />
‘Worldwide Support for<br />
True Wealth Measures:<br />
Three-Quarters Say<br />
Governments Should<br />
Look Beyond Economics<br />
and Measure Social and<br />
Environmental Progress‘<br />
(12 November 2007),<br />
www.globescan.com/<br />
news_archives/emm_<br />
beyondgdp.htm<br />
should be using health, social and environmental statistics to measure our<br />
national progress, the great weight of media and political discourse still<br />
revolves around economic statistics.<br />
Economic data are released, reported and discussed more often,<br />
more prominently and in greater detail <strong>than</strong> other key indicators. We are<br />
bombarded by daily updates on stock-market trends and commodity prices,<br />
quarterly and monthly economic releases, and continual analysis of interest<br />
rates, employment and spending patterns. Yet many basic environmental<br />
indicators are released only every few years, and there remain huge gaps in<br />
our knowledge of ecological conditions and trends.<br />
With internet access, one can ascertain the price trend of bananas in<br />
Hobart in an instant, but not whether Australia’s threatened species are<br />
recovering or declining. Export volumes of coal for last quarter? No problem.<br />
Condition of native forests or river health? Not available. And so forth.<br />
Improving the quality, comprehensiveness and frequency of data on<br />
environmental, social and cultural issues is a precondition for a society that<br />
can measure and improve its wellbeing and sustainability, rather <strong>than</strong> just<br />
its material wealth.<br />
In the end, no single definition of progress can encapsulate the disparate<br />
values and priorities of all <strong>Australian</strong>s. We need a vibrant and ongoing<br />
public discussion about what constitutes progress. Our governments can<br />
help lead that discussion by focusing our attention on the quality of our lives<br />
and the condition of our environment, not the quantity of market activity.<br />
Fixing our existing structure of National Accounts, and refocusing on<br />
broader measurements of progress, are vital steps along the way.<br />
Proportion of <strong>Australian</strong>s who think we<br />
should focus on economic statistics to measure<br />
national progress: 18%.<br />
Proportion who think we should also use health,<br />
social and environmental statistics: 79%. 12<br />
FIGURE 3: Results of the Happy Planet Index 2.0<br />
(selected countries)<br />
Rank<br />
Country<br />
Life<br />
Life<br />
Expectancy satisfaction Footprint<br />
Total<br />
2050 target 87.0 8.0 1.7 89.0<br />
1 Costa Rica 78.5 8.5 2.3 76.1<br />
2 Dominican Rep. 71.5 7.6 1.5 71.8<br />
3 Jamaica 72.2 6.7 1.1 70.1<br />
4 Guatemala 69.7 7.4 1.5 68.4<br />
5 Vietnam 73.7 6.5 1.3 66.5<br />
16 Indonesia 69.7 5.7 0.9 58.9<br />
20 China 72.5 6.7 2.1 57.1<br />
35 India 63.7 5.5 0.9 53.0<br />
53 Sweden 80.5 7.9 5.1 48.0<br />
74 United Kingdom 79.0 7.4 5.3 43.3<br />
75 Japan 82.3 6.8 4.9 43.3<br />
89 Canada 80.3 8.0 7.1 39.4<br />
102 Australia 80.9 7.9 7.8 36.6<br />
103 New Zealand 79.8 7.8 7.7 36.2<br />
114 United States 77.9 7.9 9.4 30.7<br />
118 South Africa 50.8 5.0 2.1 29.7<br />
143 Zimbabwe 40.9 2.8 1.1 16.6<br />
Australia is ranked only 102 out of 143 countries, largely because of our high environmental<br />
footprint. Leading countries such as Costa Rica provide long and fulfilling lives for their citizens,<br />
at a much lower environmental cost.<br />
Traffic light thresholds for the<br />
3 components<br />
Blood<br />
red<br />
Red Amber Green<br />
Life<br />
expectancy<br />
Life<br />
satisfaction<br />
Ecological<br />
footprint<br />
> 4<br />
planets<br />
< 60<br />
years<br />
60-75<br />
years<br />
> 75<br />
years<br />
< 5.5 5.5 - 7.0 > 7.0<br />
2 – 4<br />
planets<br />
1 – 2<br />
planets<br />
< 1<br />
planet<br />
Happy Planet<br />
Index 2.0 key<br />
(total)<br />
All 3 components<br />
good<br />
2 components good,<br />
1 middling<br />
1 component good<br />
and 2 middling<br />
3 components<br />
middling<br />
Any with 1<br />
component poor<br />
2 components poor<br />
or 'blood red' footprint<br />
8<br />
ACF BETTER THAN GROWTH
etter progress<br />
Final recommendations of the Commission on the<br />
Measurement of Economic Performance and Social Progress<br />
www.stiglitz-sen-fitoussi.fr/documents/rapport_anglais.pdf<br />
1. When evaluating material wellbeing, look at income and consumption rather<br />
<strong>than</strong> production.<br />
2. Emphasise the household perspective.<br />
3. Consider income and consumption jointly with wealth.<br />
4. Give more prominence to the distribution of income, consumption and wealth.<br />
5. Broaden income measures to non-market activities.<br />
6. Quality of life depends on people’s objective conditions and capabilities. Steps<br />
should be taken to improve measures of people’s health, education, personal<br />
activities and environmental conditions. In particular, substantial effort should<br />
be devoted to developing and implementing robust, reliable measures of social<br />
connections, political voice and insecurity that can be shown to predict life<br />
satisfaction.<br />
7. Quality-of-life indicators in all the dimensions covered should assess<br />
inequalities in a comprehensive way.<br />
8. Surveys should be designed to assess the links between various quality-of-life<br />
domains for each person, and this information should be used when designing<br />
policies in various fields.<br />
9. Statistical offices should provide the information needed to aggregate across<br />
quality-of-life dimensions, allowing the construction of different indexes.<br />
10. Measures of both objective and subjective wellbeing provide key information<br />
about people’s quality of life. Statistical offices should incorporate questions<br />
to capture people’s life evaluations, hedonic experiences and priorities in their<br />
own survey.<br />
11. Sustainability assessment requires a well-identified dashboard of indicators.<br />
The distinctive feature of the components of this dashboard should be that<br />
they are interpretable as variations of some underlying ‘stocks’. A monetary<br />
index of sustainability has its place in such a dashboard but, under the current<br />
state of the art, it should remain essentially focused on economic aspects of<br />
sustainability.<br />
12. The environmental aspects of sustainability deserve a separate follow-up based<br />
on a well-chosen set of physical indicators. In particular there is a need for a<br />
clear indicator of our proximity to dangerous levels of environmental damage<br />
(such as associated with climate change or the depletion of fishing stocks).<br />
Policy directions<br />
• Broaden the ABS’s Measures of Australia’s Progress in line with the proposed<br />
OECD Framework to Measure the Progress of Societies, and increase the<br />
frequency, prominence and local geographic relevance of reporting.<br />
• Adopt a National Progress Framework that sets clear targets for national<br />
priority indicators (tying in to Measures of Australia’s Progress) and with clear<br />
independent auditing of progress towards those targets.<br />
• South Australia’s Strategic Plan is a useful model to inform a national<br />
framework 13<br />
• Broad public engagement in the process of identifying shared targets is critical<br />
• Implement the recommendations of the Commission on the Measurement of<br />
Economic Performance and Social Progress (see box, left), and ensure Australia<br />
takes a leadership position in pressing for a global agreement on improving the<br />
system of National Accounts.<br />
• Shift the emphasis from measuring production to measuring people’s<br />
wellbeing and sustainability.<br />
• Invest in the collection and analysis of data to fill critical gaps in Australia’s<br />
current statistical system.<br />
• State of the Environment reports consistently highlight the inadequacy of<br />
information about Australia’s ecosystems. Currently, data for five of the six<br />
headline environmental issues in Measures of Australia’s Progress are partial,<br />
qualified, outdated or have other significant limitations.<br />
• The Wentworth Group of Concerned Scientist’s proposal to establish ‘National<br />
Environmental Accounts’, centred around regular monitoring and reporting on<br />
the health of Australia’s 56 national resource management regions, should be<br />
implemented. 14<br />
• Based on its forward work program for 2009-10 to 2012-13, the <strong>Australian</strong><br />
Bureau of Statistics currently devotes the equivalent of 443 full-time staff<br />
positions to economic statistics, compared to 29 for energy and environment.<br />
This imbalance should be redressed.<br />
• Through Treasury, report quarterly or twice-yearly on our nation’s progress as an<br />
integral feature of existing economic reporting such as the Mid-Year Economic<br />
and Fiscal Outlook. These could be called ‘Progress of the Nation Reports‘ rather<br />
<strong>than</strong> ‘economic’ outlooks.<br />
• Increase the frequency of the Intergenerational Report, currently required every<br />
five years, so that it can become the overarching primary vehicle for periodic longterm<br />
forecasting on Australia’s economic, social and environmental progress.<br />
13. South Australia’s<br />
Strategic Plan,<br />
http://saplan.org.au<br />
14. Wentworth Group,<br />
Accounting for Nature:<br />
A Model for Building the<br />
National Environmental<br />
Accounts of Australia<br />
(April 2008),<br />
www.wentworthgroup.<br />
org/blueprints/<br />
accounting-for-nature-amodel-for-building-thenational-environmentalaccounts-of-australia<br />
ACF BETTER THAN GROWTH 9
etter progress<br />
10<br />
ACF BETTER THAN GROWTH
2 <strong>Better</strong> work<br />
balancing paid and non-paid work, family and<br />
leisure time<br />
› We lack time in our own lives: time for ourselves, time for family, time for<br />
community. And so much of the destruction that we wreak on the environment is<br />
because of man’s desire to find more time. … We are so busy saving time that we<br />
often don’t get round to using it for the good things in life. … I’d like us to think<br />
not just about how we give people a tax cut, but how we give them a time increase. ‹<br />
david Cameron, leader UK Conservative Party, 2006<br />
› We are the only species without full employment. ‹ Matthew Fox, theologian<br />
In 1930, the economist John Maynard Keynes speculated that, due to major<br />
advances in productivity in the 20th century, people in wealthy countries<br />
would have no need to work more <strong>than</strong> about 15 hours per week. Within a<br />
hundred years, he said, “the economic problem might be solved”. 15<br />
Keynes was right in his prediction of greater productivity, but<br />
spectacularly wrong in his vision of a future era of leisure. Rather <strong>than</strong><br />
enjoying more leisure, we have consistently spent nearly all of our<br />
‘productivity dividends’ on working more and increasing material<br />
consumption whilst also increasing our personal and national debts.<br />
In fact, far from reducing hours of work, <strong>Australian</strong>s are working<br />
harder <strong>than</strong> ever. From 1985 to 2009, the number of working-age<br />
<strong>Australian</strong>s increased by 42.3 per cent, but the total number of hours<br />
worked increased by 50.3 per cent. And overwork is not always a matter<br />
of a willing trade-off between time and money. Twenty-two per cent of<br />
men and 19 per cent of women workers would prefer to be working fewer<br />
In 2007, 28.7% of full-time workers in Australia<br />
worked 50 hours per week or more. 16 Of these<br />
workers, 46% would prefer to work fewer hours,<br />
accepting a drop in pay. 17<br />
15. John Maynard Keynes,<br />
Economic Possibilities for<br />
our Grandchildren (1930)<br />
16. ABS 6361.0, Table 4<br />
17. <strong>Australian</strong> Social Trends,<br />
ABS 4102.0, ‘Trends in<br />
Work’<br />
ACF BETTER THAN GROWTH 11
etter work<br />
18. ABS 2007 Survey<br />
of Employment<br />
Arrangements,<br />
Retirement and<br />
Superannuation,<br />
www.abs.gov.au/<br />
AUSSTATS/abs@.nsf/<br />
Lookup/4102.0Main+Fea<br />
tures50Dec+2009<br />
19. ABS 6361.0, Table 6<br />
20. Ibid.<br />
21. Joseph Romm, ‘Is a 4-day<br />
workweek inevitable?<br />
Utah cuts energy use<br />
13%,‘ Grist (7 August<br />
2009),<br />
www.grist.org/<br />
article/2009-08-07-isa-4-day-workweekinevitable-utah-cutsenergy-use-13<br />
22. Deutsche Bank Research,<br />
‘Measures of wellbeing‘<br />
(8 September 2006), p.9,<br />
http://tiny.cc/e2x6s<br />
FIGURE 4: EMPLOYED PEOPLE(a)(b), SATISFACTION WITH NUMBER<br />
OF HOURS USUALLY WORKED PER WEEK, 2007 18<br />
%(c)<br />
100<br />
80<br />
60<br />
40<br />
20<br />
0<br />
1-15 16-24 25-29 30-34 35-39 40 41-44 45-49 49+<br />
Weekly hours usually worked in all jobs<br />
Prefer to work more hours<br />
Prefer to work fewer hours<br />
Prefer to work about the same number of hours<br />
(a) Excluding those usually working less <strong>than</strong> one hour a week in all jobs.<br />
(b) Excluding those who are a contributing family worker in their main job.<br />
(c) People who did not know which option they preferred were excluded prior to the<br />
calculation of all percentages presented in this graph.<br />
hours, in exchange for less pay. 19 And 43 per cent of men and 52 per cent<br />
of women often or always feel rushed or pressed for time. 20 And so while<br />
public and political attention focuses exclusively on unemployment, the<br />
phenomenon of overemployment is equally serious (Figure 4).<br />
Overwork takes its toll on personal relationships, health, family and<br />
community vitality, democratic participation, and the environment. The<br />
pressure to work harder is closely linked with pressures to consume more.<br />
Ever-increasing expectations of material standards of living can lead<br />
consumers to overcommit themselves, leading to high debt, low savings<br />
and pressure to work more to finance it all. Or, as Clive Hamilton puts<br />
it, we are constantly urged to use money we don’t have to buy things we<br />
don’t want to impress people we don’t like. And of course, the more we<br />
consume, the higher our ecological footprint.<br />
What causes overwork? The reasons are complex and varied. According<br />
to research by Deutsche Bank, “People tend to work too much because they<br />
Reduction in energy use achieved<br />
by the Utah State Government by shifting<br />
to a four-day work week: 13%. 21<br />
overestimate the impact of income on happiness.” 22 Who hasn’t thought<br />
that just a bit more wealth will give us peace of mind, open up more<br />
choices, or allow us greater comfort? Yet the evidence shows that even<br />
individuals in the top income brackets continue to aspire to even greater<br />
wealth, with no end in sight.<br />
There are important structural causes of overemployment as well.<br />
A wide range of government policies are explicitly designed to mobilise<br />
individuals into the formal paid economy, and indeed the ABS tracks<br />
the “labour force underutilisation rate” as a key measure of Australia’s<br />
progress. Implicit in this measure is the view that individuals who are not<br />
part of the paid labour force are being socially “underutilised”, or that the<br />
unpaid activities they are doing are not socially desirable.<br />
In fact, activities including parenting and child care, voluntary community<br />
work, non-paid household and carers’ work, production outside the<br />
marketplace (from suburban veggie gardens to traditional Indigenous ways<br />
of life), participating in democratic processes and leisure time are all vital to<br />
the health and prosperity of human communities. Yet they are not counted in<br />
our economic statistics, and seldom valued in public policy. We should seek<br />
to foster these activities, rather <strong>than</strong> demand ever-increasing productivity and<br />
formal workplace participation.<br />
There are better ways of arranging a sensible balance between paid and<br />
non-paid work, family life and leisure time. For example, the US state of Utah<br />
has recently shifted to four-day working weeks for all public employees. The<br />
resulting pattern of work has resulting in significant environmental benefits,<br />
with reduced transport and energy costs. But the extra day off work has also<br />
led to a dramatic increase in community volunteering in Utah.<br />
Even more far-reaching is the proposal to establish a guaranteed<br />
minimum income or “negative income tax”. Economists as disparate as<br />
Milton Friedman and John Kenneth Galbraith have supported this idea,<br />
which decreases the cost of labour, while providing better support for<br />
individuals who are engaged in important unpaid activities such as raising<br />
children or caring for the unwell. In 2004, Brazil became the first country to<br />
enact a law providing for an unconditional minimum income for its citizens.<br />
To introduce such employment policies successfully, workload would<br />
need to be more equitably shared across the labour force, to create a more<br />
equitable earnings distribution across the economy and overall increased<br />
leisure time.<br />
12<br />
ACF BETTER THAN GROWTH
etter work<br />
Policy Directions<br />
• Show government leadership by shifting government to a four-day work week.<br />
• Provide incentives to private employers that offer four-day work weeks that still<br />
pay a reasonable living wage.<br />
• Consider government support for periods of activity outside the formal paid<br />
economy for all workers, such as a one-year paid sabbatical for all <strong>Australian</strong>s<br />
after 15 years of work.<br />
• Recognise the importance of non-paid work by integrating non-paid child care,<br />
household work, carers’ work, volunteering, and the value of family and leisure<br />
time into National Accounts and into cost-benefit analysis frameworks.<br />
• Commission research and analysis on the economic, environmental and social<br />
implications of adopting a minimum income guarantee.<br />
• Explore options for discouraging overwork, such as tax disincentives for<br />
employers that regularly have employees working more <strong>than</strong> a specified<br />
benchmark.<br />
ACF BETTER THAN GROWTH 13
etter work<br />
14<br />
ACF BETTER THAN GROWTH
3 <strong>Better</strong> production<br />
making cradle-to-cradle manufacturing a reality<br />
› Every creative, manufacturing and building decision we make is intended to help us achieve<br />
zero environmental footprint by 2020 and give you the most fashionable, high performing<br />
and environmentally well-rounded products in the industry. ‹ interface ‘Mission Zero’ statement 23<br />
For the past 15 years, Ray Anderson, CEO of Interface carpets, has not been<br />
trying to reduce his company’s impact on the environment. He’s been trying<br />
to eliminate it. By using only renewable resources and cutting waste and<br />
pollution to zero, Interface is creating a ‘cradle-to-cradle’ manufacturing<br />
system that works with nature, rather <strong>than</strong> against it. As Anderson puts it:<br />
We want to drive the whole thing with sunlight, renewable energy,<br />
closing the loop on material flows so that you have not only the basic<br />
organic cycle we’re all familiar with – the dust-to-dust cycle – but in an<br />
analogous way, a technical cycle that takes used-up products and gives<br />
them life after life through the recycling process, so that no molecules<br />
are lost; everything stays in the flow, the material loop.<br />
Interface is not a bit player; it is the world’s largest manufacturer of<br />
modular carpets, and the company has seen dramatic financial as well<br />
as environmental returns so far. Since the mid-1990s, while increasing<br />
production, Interface has:<br />
• cut waste to landfill by two-thirds, saving US$400 million;<br />
• reduced energy use by half and greenhouse pollution by 71 per cent;<br />
• reduced water intake for modular carpet manufacturing by 74 per cent;<br />
• increased utilisation of recycled and bio-based materials to 25 per cent of<br />
FIGURE 5: PROFILE OF AN iPOD NANO – GREENHOUSE GAS AND<br />
MATERIAL USE PROFILES ILLUSTRATE THE LIFECYCLE IMPACTS<br />
OF AN ELECTRONIC PRODUCT, SUGGESTING PRIORITY AREAS<br />
FOR IMPROVEMENT 24<br />
Greenhouse gas emissions<br />
for iPod nano<br />
Recycling<br />
1%<br />
Transport<br />
6%<br />
Customer use<br />
39%<br />
Production<br />
54%<br />
Total greenhouse gas equivalent: 15kg CO 2e<br />
Material use for iPod nano<br />
Others<br />
1.4g<br />
Plastic<br />
1g<br />
Stainless<br />
steel<br />
3.5g<br />
Display<br />
4g<br />
Circuit<br />
boards<br />
4.2g<br />
Aluminum<br />
10.9g<br />
Battery<br />
5.7g<br />
Glass<br />
5.7g<br />
From 1991 to 2007, chemical company DuPont<br />
cut its emissions by 72%, leading to direct cost<br />
savings of US$3 billion. 25<br />
23. InterfaceFLOR, ‘Mission<br />
Zero‘,<br />
www.interfaceflor.com.<br />
au/Sustainability/<br />
Mission_Zero_.aspx<br />
24. Apple, ‘iPod nano<br />
product environment<br />
report‘,<br />
www.apple.com/<br />
environment/reports<br />
25. Du Pont, Climate Change<br />
Position Statement,<br />
www2.dupont.com/<br />
Media_Center/en_US/<br />
position_statements/<br />
global_climate_<br />
expanded.html<br />
ACF BETTER THAN GROWTH 15
etter production<br />
26. Interface, ‘Metrics: What<br />
Gets Measured Gets<br />
Managed‘,<br />
www.interfaceglobal.<br />
com/Newsroom/<br />
Ecometrics.aspx<br />
27. The Natural Edge Project,<br />
Figure 2,<br />
www.naturaledgeproject.<br />
net/Keynote.aspx<br />
28. Energy <strong>Conservation</strong><br />
Center, Japan, Top<br />
Runner Program,<br />
www.asiaeec-col.eccj.<br />
or.jp/top_runner/index.<br />
html<br />
29. International Institute<br />
for Sustainable<br />
Development, ‘The<br />
Nitrogen Oxide Charge<br />
on Energy Production in<br />
Sweden‘,<br />
www.iisd.org/greenbud/<br />
nitro.htm<br />
30. For more examples see<br />
www.cleanproduction.<br />
org/Producer.Resources.<br />
php<br />
31. ACT Government<br />
Department of Territory<br />
and Municipal Services,<br />
‘2009 Progress towards<br />
No Waste‘,<br />
www.tams.act.gov.au/<br />
live/Recycling_and_<br />
Waste/The_No_Waste_<br />
Strategy/statistics<br />
FIGURE 6: WAVES OF INNOVATION 27<br />
Innovation<br />
• Iron<br />
• Water power<br />
• Mechanisation<br />
• Textiles<br />
• Commerce<br />
1st Wave<br />
• Steam power<br />
• Railroad<br />
• Steel<br />
• Cotton<br />
2nd Wave<br />
3rd Wave<br />
• Electricity<br />
• Chemicals<br />
• Internal<br />
combustion<br />
engine<br />
4th Wave<br />
• Petrochemicals<br />
• Electronics<br />
• Aviation<br />
• Space<br />
5th Wave<br />
• Digital networks<br />
• Biotechnology<br />
• Software<br />
information<br />
technology<br />
1785 1845 1900 1950 1990 2020<br />
6th Wave<br />
• Sustainability<br />
• Radical resource<br />
productivity<br />
• Whole system<br />
design<br />
• Biomimicry<br />
• Green chemistry<br />
• Industrial ecology<br />
• Renewable energy<br />
• Green<br />
nanotechnology<br />
total material use; and<br />
• introduced a range of carbon-neutral and fully recycled and recyclable<br />
materials, among many other business innovations. 26<br />
Interface is one of the leading businesses in what has been called the<br />
“sixth wave” of industrial innovation 27 (see Figure 6).<br />
As with previous waves of innovation, countries and businesses<br />
that are ahead of the innovation curve will have substantial competitive<br />
advantages. Computer manufacturer Apple, for example, provides<br />
individual environmental reports for each of its products as part of its<br />
ongoing efforts to detoxify and improve the recyclability of its products.<br />
There are several good <strong>Australian</strong> cases of manufacturing redesign<br />
achieving real progress towards zero impact, including:<br />
• the Interface FLOR carpet manufacturing plant at Picton, NSW, which<br />
has reduced non-renewable energy use by 56 per cent while increasing<br />
production;<br />
• the Fuji-Xerox eco-manufacturing facility at Zetland, NSW, which<br />
disassembles used equipment and remanufactures from it rather <strong>than</strong><br />
discarding it, resulting in a 99 per cent resource recovery rate; and<br />
• the Kwinana Synergies Project, which has mapped inputs and outputs for<br />
35 industries in the Kwinana, Western Australia, industrial zone, leading<br />
to the identification of dozens of synergistic re-use possibilities.<br />
Strong government policy support can help encourage industrial<br />
ecology, moving ‘cradle to cradle’ processes from the exception to the rule.<br />
Regulatory approaches that take advantage of competitive drivers can work<br />
well. Japan’s ‘Top Runner’ program identifies the top environmentally<br />
performing product for a wide range of vehicles and appliances, and sets<br />
their performance as the minimum design benchmark for the future. 28 This<br />
approach creates strong but flexible drivers for ongoing innovation.<br />
Sweden’s use of ‘feebates’ to improve industrial performance is another<br />
useful initiative. By taxing power plants with high levels of nitrogen oxide<br />
emissions (a cause of acid rain) and redistributing those revenues to lowerpolluting<br />
facilities, Sweden succeeded in reducing pollution by 34 per<br />
cent in just two years from 1990–92. 29 Most examples of feebates are in<br />
the pollution context, but the idea could just as easily be adopted to drive<br />
resource productivity or biodiversity conservation.<br />
Extended producer responsibility (EPR) laws are another important<br />
part of the picture, with many countries now implementing or considering<br />
comprehensive EPR frameworks. Take-back mandates, advanced recycling<br />
fees, landfill bans and even ‘virgin materials’ taxes can all be useful<br />
EPR tools. 30<br />
The ACT increased its resource recovery rate<br />
from 22% in 1993 to 74% by 2007, and has<br />
committed to zero waste by 2010. 31<br />
Policy Directions<br />
• Initiate a ‘top runner’ program for appliances and other consumer goods whereby<br />
the environmental performance of the best product becomes the minimum design<br />
standard after a set transition period.<br />
• Introduce feebates on major pollutants and critical non-renewable resources to<br />
penalise waste while rewarding efficiency.<br />
• For all government procurement, require bidders to prepare ‘zero-impact’<br />
transition plans, with public funding available for both analysis and<br />
implementation of cradle-to-cradle initiatives for successful bidders.<br />
• Implement a comprehensive extended producer responsibility framework, with<br />
principles and policies that can be applied to increasing categories of products<br />
and services over time.<br />
• Ensure all products exported and imported also meet these high environmental<br />
performance standards.<br />
16<br />
ACF BETTER THAN GROWTH
etter consumption<br />
4 <strong>Better</strong> consumption<br />
stepping off the consumer treadmill<br />
› Having the fewest wants, I am nearest to the Gods. ‹ socrates, 469–399 BC<br />
Daily we are bombarded by messages to consume more things. Most<br />
obviously, advertising urges us to buy more stuff with overinflated<br />
promises of happiness. Governments encourage consumption – sometimes<br />
directly, but also through the constant recital of the importance of<br />
‘consumer confidence’ and ‘consumer price indices’.<br />
More subtly, social status in modern western societies is powerfully<br />
defined by material consumption. By wearing this season’s clothing,<br />
driving a luxury car, or possessing the latest iteration of mobile phone and<br />
mp3 player, we make implicit claims of success and social standing.<br />
These pervasive messages to consume more tap into deep-seated<br />
behavioural inclinations. As Edmund Burke put it:<br />
The great error of our nature is not to know where to stop; not to be<br />
satisfied with any reasonable acquirement; not to compound with<br />
our condition; but to lose all we have gained by an insatiable pursuit<br />
after more. 32<br />
Of the wealthiest fifth of <strong>Australian</strong>s,<br />
47% believe that they “cannot afford<br />
to buy everything they really need”. 33<br />
We are all consumers, of course, and satisfaction of basic needs as well<br />
as reasonable material comforts should be within everybody’s reach. Yet<br />
an excessive focus on our consumer aspect, at the cost of our identities<br />
as citizens, friends, parents, children and so forth, we risk the afflictions<br />
of affluenza: overwork, anxiety and depression, financial stress and<br />
indebtedness, disconnectedness from family and community, and a reduced<br />
FIGURE 7: AFFLUENZA – HIGH LEVELS OF MATERIAL CONSUMPTION<br />
LEAD TO HIGHER ENVIRONMENTAL IMPACTS IN WEALTHIER<br />
AREAS OF AUSTRALIA 34<br />
Greenhouse gas intensity<br />
(tonnes per capita per year)<br />
40<br />
35<br />
30<br />
25<br />
20<br />
15<br />
10<br />
5<br />
Water use intensity<br />
(ML per capita per year)<br />
3.0<br />
0<br />
0<br />
$10,000 $20,000 $30,000 $40,000<br />
Average per capita income<br />
GHG Water<br />
2.5<br />
2.0<br />
1.5<br />
1.0<br />
0.5<br />
32. Edmund Burke, A<br />
Vindication of Natural<br />
Society (1756)<br />
33. Clive Hamilton,<br />
‘Overconsumption in<br />
Australia: The rise of<br />
the middle-class battler‘<br />
The Australia Institute<br />
Discussion Paper No. 49<br />
(2002)<br />
34. <strong>Australian</strong> <strong>Conservation</strong><br />
<strong>Foundation</strong>, Consumption<br />
Atlas: Main findings report<br />
(2007), p.8,<br />
www.acfonline.org.au/<br />
uploads/res/res_atlas_<br />
main_findings.pdf<br />
ACF BETTER THAN GROWTH 17
etter consumption<br />
35. Blueprint for a Green<br />
Economy, note 3, p.49,<br />
www.qualityoflife<br />
challenge.com/<br />
documents/fullreport-1.<br />
pdf<br />
36. <strong>Australian</strong> <strong>Conservation</strong><br />
<strong>Foundation</strong>, Consumption<br />
Atlas: Main findings report<br />
(2007), pp.5-6,<br />
www.acfonline.org.au/<br />
uploads/res/res_atlas_<br />
main_findings.pdf<br />
37. Protecting Americans<br />
from Drug Marketing<br />
Act, S.1763 / H.R. 3979,<br />
www.opencongress.org/<br />
bill/111-s1763/text<br />
38. David Baker, Josh Fear<br />
and Richard Denniss,<br />
‘What a waste: An<br />
analysis of household<br />
expenditure on food‘,<br />
The Australia Institute<br />
Policy Brief 6 (2009),<br />
https://www.tai.org.<br />
au:443/file.php?file=/<br />
media_releases/PB%20<br />
6%20What%20a%20<br />
waste%20final.pdf<br />
Over the past 18 years, <strong>Australian</strong> households<br />
have increased total debt six-fold from<br />
$190 billion in 1990 to around $1.1 trillion in<br />
2008 (in real terms).<br />
sense of purpose and wellbeing.<br />
Overconsumption is one of the main pressures on the environment as<br />
well. As individuals and societies become wealthier and consume more,<br />
the amount of energy, water and other resources required to maintain<br />
a high-consumption lifestyle also increases. Analysis by the Centre for<br />
Integrated Sustainability Analysis at the University of Sydney shows that<br />
relatively affluent areas have increasingly high environmental impacts due<br />
to increased consumption of goods and services.<br />
Stepping off the consumer treadmill will result is greater wellbeing and<br />
lower environmental pressure through more sensible consumption patterns.<br />
Individuals, community groups, businesses and governments all have a role<br />
to play.<br />
Government policy should aim to empower smart consumption,<br />
rather <strong>than</strong> consumption at any price. Smart consumption means avoiding<br />
consumption that is unlikely to increase wellbeing, and choosing products<br />
and services that are ecologically sustainable and ethical. As the UK<br />
Conservative Party has expressed it:<br />
Empowering people involves giving them choice, but it does not mean<br />
that government should opt out of the process thereafter. Choices are<br />
not made in a vacuum. There are all kinds of influences at work – some<br />
benign, many malevolent. Government has a responsibility to ensure<br />
that choices are made within a context that makes it easier to choose<br />
well. 35<br />
Ethical consumerism has been a powerful agent for change, especially<br />
for particular niches such as free-range eggs or fair-trade coffee. But<br />
consumers working in isolation are not usually successful in changing<br />
mainstream markets – overconsumption is a collective problem requiring<br />
collective solutions that governments can coordinate.<br />
FIGURE 8: HIDDEN IMPACTS – THE PRODUCTION OF FOOD AND<br />
OTHER CONSUMER PRODUCTS ACCOUNTS FOR MOST OF<br />
AUSTRALIANS’ ENVIRONMENTAL FOOTPRINT 36<br />
AVERAGE HOUSEHOLD PROFILE:<br />
GREENHOUSE GAS PRODUCTION<br />
Goods and<br />
services<br />
29.4%<br />
Tobacco<br />
& alcohol<br />
Books &<br />
magazines<br />
Furniture &<br />
applicances<br />
Construction and<br />
renovations<br />
11.8%<br />
Other goods<br />
& services<br />
Personal care<br />
Clothing<br />
Other food<br />
Restaurants<br />
Household use<br />
20.0%<br />
Gas, coal, oil<br />
& firewood<br />
Food<br />
28.3%<br />
Electricity<br />
Beef<br />
Dairy<br />
Petrol<br />
Other<br />
household<br />
Transport<br />
10.5%<br />
Personal<br />
care<br />
Public Books &<br />
transport magazines<br />
Air<br />
travel<br />
Furniture &<br />
appliances<br />
Goods and<br />
services<br />
28.4%<br />
Construction and<br />
renovations<br />
2.7%<br />
Other food<br />
Any serious policy to foster more balanced consumption must also<br />
examine the role of advertising as a primary driver of unsustainable<br />
consumption patterns. Much advertising is designed to manufacture desire<br />
for a product, rather <strong>than</strong> to provide useful information. The constant<br />
barrage of advertising is a constant reminder not to be satisfied with what<br />
we have, but rather to consume more and more as the path to happiness.<br />
Restricting the tax deductibility of advertising expenses is one<br />
possible solution. In the US, a bill has been introduced that would<br />
eliminate tax deductions for direct-to-consumer advertising of prescription<br />
pharmaceuticals, for example. 37 Given that about $10 billion is spent<br />
on advertising every year in Australia, removing tax deductibility<br />
could generate significant revenue as well as reducing the pressure for<br />
unnecessary consumption that does little to improve our overall wellbeing.<br />
Each year <strong>Australian</strong>s discard at least<br />
$5 billion worth of food, or about $616<br />
per year per person. 38<br />
AVERAGE HOUSEHOLD PROFILE:<br />
WATER USE<br />
Tobacco &<br />
alcohol<br />
Clothing<br />
Other goods<br />
& services<br />
Household<br />
use<br />
23.0%<br />
Household water<br />
Restaurants<br />
Food<br />
45.9%<br />
Electricity<br />
Gardening<br />
Dairy<br />
Beef<br />
18<br />
ACF BETTER THAN GROWTH
etter consumption<br />
Policy Directions<br />
• Support consumer choices for environmentally sustainable products.<br />
• ‘Choice editing’ can cut out unnecessarily damaging products. Australia’s<br />
phase-out of incandescent light globes is an example of choice editing with<br />
widespread public support. Many other product categories could be addressed<br />
similarly (unsustainably harvested fish or appliances below a 3-star efficiency<br />
rating, for example).<br />
• Labelling of food and consumer goods can provide important information<br />
about location of origin and environmental impact.<br />
• A ‘sustainable products unit’ could be established, in consultation with<br />
consumers and business, to develop product roadmaps for priority consumer<br />
goods. These should include legally binding commitments for improving<br />
environmental performance.<br />
• Establish education and social marketing initiatives to highlight the personal,<br />
social and environmental costs of excessive consumption, and to encourage people<br />
to live a more balanced life.<br />
• A good example is the City of Kakagawa, Japan, which issued a ‘Slow Life<br />
Declaration’ in 2002 urging residents to “shift from a society of mass production<br />
and mass consumption, to a society that is not hectic and cherishes our<br />
possessions and things of the heart.”<br />
• Government should demonstrate leadership in sustainable procurement.<br />
• Catering at schools and other public and government facilities is often<br />
overlooked, but should be a priority given the heavy ecological cost of certain<br />
foods. Government preferences for organic, local, sustainable produce could<br />
have major flow-on benefits throughout society.<br />
• Remove tax deductibility for advertising expenditures.<br />
• Strengthen advertising standards. Restrictions already apply to a range of<br />
unhealthy or socially undesirable marketing practices, such as cigarettes and<br />
advertising targeted at children. Tougher rules around the location and content of<br />
advertising would lessen the constant pressure on consumers to buy more.<br />
ACF BETTER THAN GROWTH 19
etter consumption<br />
20<br />
ACF BETTER THAN GROWTH
5 <strong>Better</strong> markets<br />
aligning prices with social and environmental impacts<br />
› Markets without regulation would not have delivered unleaded gasoline, autocatalysts<br />
or seatbelts and airbags, nor would they in isolation have delivered clean air to<br />
London after the killer smogs of the ‘fifties. ‹<br />
sir Mark Moody-Smith, former CEO, Shell<br />
› Inefficient fossil fuel subsidies encourage wasteful consumption, distort markets,<br />
impede investment in clean energy sources and undermine efforts to deal with climate<br />
change. … We call on all nations to adopt policies that will phase out such subsidies<br />
worldwide. ‹ Leaders’ Statement, G20 Pittsburgh meeting, 25 September 2009 39<br />
Markets are an essential economic mechanism. It is crucial that they work<br />
well, reflecting ecological realities as well as the interplay of supply and<br />
demand.<br />
To accept the operation of free markets is not to preclude a wide range<br />
of regulatory strategies. It is neither possible nor desirable to place dollar<br />
values on all aspects of the natural world, and just as we don’t allow the<br />
buying and selling of votes, nor should we allow the buying and selling of<br />
rights to engage in activities that are ecologically unacceptable.<br />
Where markets do operate, they should be shaped and guided by<br />
overriding ‘rules of the game’ that ensure ecological sustainability of the<br />
economy as a whole. These rules of the game may include taxation or<br />
other pricing mechanisms as a way of more efficiently achieving desired<br />
environmental outcomes.<br />
Currently, however, the full ecological and social costs of goods and<br />
services are often not reflected in their market price. Inefficient markets<br />
frequently exclude the cost of environmental damage caused by production<br />
or consumption, leading us all to worse outcomes.<br />
15 out of 24 critical ecosystem services<br />
are currently being used unsustainably on<br />
a global basis. 40<br />
39. G20 Leaders’ Statement,<br />
note 10.<br />
40. Millennium Ecosystem<br />
Assessment, Ecosystems<br />
and Human Wellbeing:<br />
Synthesis (2005), p.1,<br />
www.<br />
millenniumassessment.<br />
org/documents/<br />
document.356.aspx.pdf<br />
ACF BETTER THAN GROWTH 21
etter markets<br />
41. <strong>Australian</strong> Academy of<br />
Technological Sciences<br />
and Engineering, The<br />
Hidden Costs of Electricity:<br />
Externalities of Power<br />
Generation in Australia<br />
(2009),<br />
www.atse.org.<br />
au/uploads/<br />
ATSEHiddenCosts<br />
Elecreport.pdf<br />
42. US Environment<br />
Protection Agency, The<br />
benefits and costs of the<br />
Clean Air Act: retrospective<br />
study, 1970 to 1990<br />
(October 1997),<br />
www.epa.gov/air/<br />
sect812/index.html<br />
43. Business Council of<br />
Australia, 2004 Annual<br />
Review (2004), p.7,<br />
www.bca.com.au/<br />
DownloadFile.<br />
aspx?FileName=BCA_<br />
Annual_Review_2004.pdf<br />
44. <strong>Australian</strong> Bureau of<br />
Statistics, Australia's<br />
Environment: Issues and<br />
Trends 2010, ABS 4613.0,<br />
p.47,<br />
www.abs.gov.au/<br />
AUSSTATS/abs@.nsf/<br />
DetailsPage/4613.0Jan%<br />
202010?OpenDocument<br />
45. Boris Worm et al.,<br />
‘Impacts of Biodiversity<br />
Loss on Ocean Ecosystem<br />
Services‘, Science<br />
(3 November 2006),<br />
pp.787–90<br />
FIGURE 9: ENVIRONMENTAL AND SOCIAL COSTS OF SOME<br />
ELECTRICITY GENERATION TECHNOLOGIES 41<br />
External cost (A$/MWh)<br />
60<br />
50<br />
40<br />
30<br />
20<br />
10<br />
0<br />
Brown coal<br />
Black coal<br />
Natural gas combined<br />
cycle (NGCC)<br />
Black coal post-combustion<br />
carbon capture and storage (CCS)<br />
Nuclear light water reactory<br />
(LWR)<br />
Black coal integrated gasification<br />
combined cycle (IGCC)-CCS<br />
Solar photovoltaic (PV)<br />
Solar thermal<br />
Electricity in Australia is an example where poorly designed markets<br />
can fail to serve either consumer or environmental interests. A study by the<br />
<strong>Australian</strong> Academy of Technological Sciences and Engineering assessed<br />
the ‘external’ costs of different power sources – those borne by society as a<br />
whole, not by the generating company. For every megawatt hour (MWh)<br />
produced by brown coal, a cost of more <strong>than</strong> $50 accrues to society in the<br />
form of greenhouse pollution and health impacts, compared with $1.50 for<br />
wind power. If these costs had to be paid by the generator, wind power<br />
would in fact become less expensive <strong>than</strong> coal (approximately $77 MWh<br />
compared with $90 MWh) 41 (see Figure 9).<br />
Thus, far from being a ‘cost’ to society, smart environmental regulation<br />
can ensure that markets work more effectively, driving innovation and<br />
genuine efficiency.<br />
Seen in this light, fears about the costs of environmental regulation<br />
have often proved to be misplaced. Prior to its endorsement, the US Clean<br />
Air Act was forecast by critics as likely to result in job losses of between<br />
20,000 and 4 million. In fact, employment in affected areas increased by<br />
22 per cent and the cumulative benefits resulting from the Act from 1970 to<br />
Wind<br />
1990 were $20 trillion – more <strong>than</strong> 40 times the costs. 42<br />
Natural resource pricing is another example where sufficient regard<br />
for the endowment to future generations needs to be made. A resource rent<br />
tax is one way of ensuring sufficient returns are made to the country on the<br />
exploitation of natural assets.<br />
As the Business Council of Australia has noted, “Australia’s resources<br />
are not infinite, they are highly limited if not from one year to the<br />
next, from one generation to the next.” 43 Using a highly conservative<br />
methodology, the <strong>Australian</strong> Bureau of Statistics found that depletion<br />
of Australia’s mineral resources is costing us around $4 billion per year<br />
– a loss of wealth that is not reflected in our National Accounts and not<br />
included in the market price of those resources. 44<br />
Many overseas jurisdictions have mechanisms for ensuring that the<br />
returns derived from exploitation of non-renewable resources are invested<br />
into creating a sustainable future. For example, the Government Pension<br />
Fund of Norway invests profits from the oil and gas industry in longterm<br />
investments for the benefit of all Norwegians, rather <strong>than</strong> simply<br />
distributing profits to shareholders. Similarly, the Alberta Heritage Savings<br />
Trust Fund invests returns from current exploitation of mineral resources<br />
for the benefit of future generations.<br />
The adoption of ‘depletion protocols’ for non-renewable resources<br />
would be another important innovation. Such protocols involve reductions<br />
in resource use in line with the pace at which they are depleted. For<br />
example, if Australia is extracting one per cent of its petroleum reserves per<br />
year, it should also reduce petroleum consumption by at least one per cent<br />
a year.<br />
As of 2003 29% of oceanic fisheries had<br />
suffered collapse, with catch falling to<br />
10% or less of peak abundance. 45<br />
22<br />
ACF BETTER THAN GROWTH
<strong>Better</strong> markets<br />
Policy Directions<br />
• Direct regulation of unsustainable activities should be undertaken to stimulate<br />
market innovation and reduce environmental damage. Direct regulation – such as<br />
minimum fuel and energy standards for products, fishing quotas and bans, and<br />
pollution standards – often has long-term economic benefits.<br />
• Government regulation is required ensure that prices for non-renewable resources<br />
include the full environmental and social costs of depletion, pollution and other<br />
social and environmental externalities.<br />
• National Competition Policy is a critical tool to ensure our natural resources are<br />
appropriately priced (for example, public forests)<br />
• Businesses should report on the full costs and benefits of their products and<br />
activities. Such costs should be included in financial reporting requirements.<br />
• Resource rents should be charged on the exploitation of Australia’s nonrenewable<br />
natural resources and based on the full cost of depleting these<br />
resources. Such rents should be placed in a national fund for investment in a<br />
sustainable future.<br />
• Australia should investigate adopting depletion protocols for critical nonrenewable<br />
resources, beginning with petroleum.<br />
ACF BETTER THAN GROWTH 23
etter markets<br />
24<br />
ACF BETTER THAN GROWTH
6 <strong>Better</strong> business<br />
matching private incentives with long-term<br />
public goals<br />
› Corporations and investors appear locked into mutually reinforcing expectations<br />
of highly visible short-term results – without necessarily factoring in whether these<br />
strategies are sustainable in the long term. ‹ Business Council of Australia, 2004 46<br />
The Business Council of Australia is hardly alone in its concern about the<br />
increasingly short-term focus of business organisations, and the financial<br />
sector in particular. As the financial crisis of 2008-09 so painfully reminded<br />
us, incentive systems that centre on monthly and quarterly profits are<br />
dangerous: they lead to volatility, destructive investment bubbles and a<br />
focus on ‘playing the market’ rather <strong>than</strong> long-term value creation.<br />
And if short-term horizons are bad for stability, they’re doubly bad<br />
for the environment. Businesses under pressure to deliver maximum<br />
profits each and every quarter are less likely to invest in technologies and<br />
practices with long-term environmental benefits, more likely to engage in<br />
environmentally risky activities, and inclined to actively oppose sensible<br />
public policies on environmental issues.<br />
64% of <strong>Australian</strong> company directors, CEOs<br />
and CFOs, and 85% of shareholders, agree that<br />
companies should be required to report on their<br />
social and environmental impacts. 47<br />
To address short-termism in the investment sector, a group of global<br />
business leaders, including former World Bank President James Wolfensohn<br />
and Warren Buffett, recently issued a powerful call for regulatory reform to<br />
encourage longer-term perspectives. Noting a need for “real changes in the<br />
focus of institutional investors and related intermediaries”, the statement<br />
called for governments and business to:<br />
• discourage excessive share trading and rewarding ‘patient capital’ by,<br />
for example, setting capital gains tax rates that are “positively and<br />
dramatically skewed toward longer-term holdings”; 48<br />
• ensure fiduciary duties and compensation systems are clearly aligned to<br />
long-term performance; and<br />
• increase transparency.<br />
Leading global investors are beginning to act on the realisation that<br />
ensuring the long-term health of economies (and the ecosystems and social<br />
structures upon which they depend) is a much better bet <strong>than</strong> trying to pick<br />
individual winners on the stock market. For example:<br />
• the California Public Employees’ Retirement System (CalPERS)<br />
specifically directs investment into renewable energy and has set energyefficiency<br />
targets across its property portfolio;<br />
46. BCA 2004 Annual Review,<br />
note 40, p.3<br />
47. CPA Australia, Confidence<br />
in Corporate Reporting<br />
2005, p.23,<br />
www.cpaaustralia.com.<br />
au/cps/rde/xbcr/cpasite/CICR2005.pdf<br />
48. Aspen Institute,<br />
Overcoming Shorttermism:<br />
A Call for a More<br />
Responsible Approach to<br />
Investment and Business<br />
Management (September<br />
2009),<br />
www.aspeninstitute.org/<br />
bsp/cvsg/policy2009.<br />
(ACF called for similar<br />
changes to capital gains<br />
taxation in Australia in<br />
2006, but a Parliamentary<br />
inquiry rejected the<br />
idea. See www.aph.<br />
gov.au/hansard/joint/<br />
commttee/J9061.pdf,<br />
p.77.)<br />
ACF BETTER THAN GROWTH 25
etter business<br />
49. Don Tapscott and<br />
David Ticoll, The Naked<br />
Corporation: How the<br />
Age of Transparency Will<br />
Revolutionize Business<br />
(2003)<br />
50. Goldman Sachs,<br />
‘Introducing GS Sustain‘<br />
(2007), p.9,<br />
www.unglobalcompact.<br />
org/docs/summit2007/<br />
gs_esg_embargoed_<br />
until030707pdf.pdf<br />
51. Tricia Holley Davis,<br />
‘Pension funds warned<br />
to invest in a low carbon<br />
future‘, Times Online<br />
(4 October 2009),<br />
http://business.<br />
timesonline.co.uk/tol/<br />
business/industry_<br />
sectors/banking_and_<br />
finance/article6860021.ece<br />
52. <strong>Australian</strong> <strong>Conservation</strong><br />
<strong>Foundation</strong>, ‘Responsible<br />
Public Investment in<br />
Australia‘ (2008),<br />
www.acfonline.org.au/<br />
uploads/res/govt_<br />
investment.pdf<br />
53. <strong>Australian</strong> Bureau of<br />
Statistics, <strong>Australian</strong><br />
National Accounts:<br />
Non-Profit Institutions<br />
Satellite Account, 2006-07<br />
ABS 5256.0,<br />
www8.abs.gov.au/<br />
AUSSTATS/abs@.nsf/<br />
DetailsPage/5256.02006-<br />
07?OpenDocument<br />
54. <strong>Australian</strong> <strong>Conservation</strong><br />
<strong>Foundation</strong>, ‘Responsible<br />
Public Investment in<br />
Australia‘ (2008),<br />
www.acfonline.org.au/<br />
uploads/res/govt_<br />
investment.pdf<br />
• the Government Pension Fund of Norway has a comprehensive ethical<br />
investment policy that has resulted in several very public decisions to<br />
divest from companies with poor environmental or human rights records;<br />
and<br />
• VicSuper allocates a portion of its investment in each asset class to<br />
sustainable investments, and reports on the “carbon efficiency” of each of<br />
its investment products over time.<br />
Don Tapscott and David Ticoll describe this shift well in their book<br />
The Naked Corporation:<br />
Responsible fund managers should not only ensure that corporations<br />
operate in peak form but that the economy does too. It makes sense to<br />
consider a company’s impact on the whole economy rather <strong>than</strong> on just<br />
its own bottom line. Corporations that capture short-term gain at the<br />
expense of heavy external costs shouldn’t be tolerated by the prudent<br />
universal owner. 49<br />
FIGURE 10: AVERAGE EARNINGS GROWTH (2008–09) VERSUS<br />
AVERAGE ENTERPRISE VALUE 50<br />
Earnings per share (EPS) <strong>growth</strong> 2009<br />
%<br />
100<br />
80<br />
60<br />
40<br />
20<br />
0<br />
0<br />
Solar<br />
Biofuels<br />
Wind<br />
Biotechnology<br />
Medical products<br />
Software<br />
Semiconducters<br />
Water<br />
Media<br />
Brokers<br />
Food<br />
Banks<br />
Pharmaceuticals<br />
Metals & Mining<br />
Multi-industry<br />
Energy: Oil<br />
20,000 40,000 60,000 80,000 100,000 120,000 140,000<br />
Average enterprise value, US$ million<br />
And indeed, leading environmental businesses are often good<br />
investments, even strictly gauged on financial returns. A study by Goldman<br />
Sachs in 2007 forecast strongest earnings per share <strong>growth</strong> in environmental<br />
technology companies, while oil, metals and mining were near the bottom<br />
of the list 50 (see Figure 10).<br />
The United Nations takes this one step further, concluding that<br />
investment funds are endangering the long-term value of their investments<br />
by continuing to pour money into environmentally unfriendly businesses. 51<br />
The UN Principles for Responsible Investment (UNPRI) acknowledges<br />
and seeks to redress this long-term risk. With more <strong>than</strong> 600 signatories<br />
managing more <strong>than</strong> US$18 trillion in assets, UNPRI investors have<br />
committed to assessing environmental, social and governance risks in their<br />
portfolio, and actively engaging companies to improve those risks.<br />
But <strong>Australian</strong> government investment funds are lagging far behind<br />
international leaders. A 2007 survey of 36 <strong>Australian</strong> government funds<br />
with more <strong>than</strong> $200 billion in assets found that many funds had no<br />
policies related to environmental and social issues, seldom engaged<br />
with the companies in which they invest on such issues, and directed far<br />
more funding to high-impact activities <strong>than</strong> to new technologies. 52 Our<br />
governments must do better <strong>than</strong> this.<br />
The global financial crisis should also prompt us to rethink whether the<br />
public stock corporation is the only, or necessarily the best, way of pursuing<br />
economic activity. Cooperatives, not-for-profit businesses, social enterprises<br />
and government-operated services all have a rich and successful history<br />
and continue to play an important role in our economy.<br />
For example, a quarter of <strong>Australian</strong>s currently procure some of their<br />
financial services needs through credit unions and building societies. Nonprofit<br />
organisations account for 4.1 per cent of Australia’s economy (more<br />
<strong>than</strong> twice the contribution of agriculture, forestry and fishing) and employ<br />
889,000 <strong>Australian</strong>s, or seven times the number employed in mining. 53<br />
36 <strong>Australian</strong> government investment<br />
funds are collectively investing $43 in<br />
fossil fuel companies for every $1 invested<br />
in renewable energy. 54<br />
26<br />
ACF BETTER THAN GROWTH
etter business<br />
Compared with private corporations, which are often advised that<br />
their overriding legal obligation is to maximise shareholder profits, 55 these<br />
other types of business organisations can more easily adopt ethical and<br />
community-oriented business approaches.<br />
It is surely no accident that successful non-profit and governmentowned<br />
businesses in Australia – such as VicSuper, mecu, <strong>Australian</strong><br />
Unity and many public water utilities – have led the way in innovative<br />
products and research to foster a sustainable future economy. Australia<br />
should celebrate and encourage such cooperative and government business<br />
enterprises.<br />
Policy Directions<br />
• Encourage long-term, active share ownership.<br />
• Introduce minimum holding periods for the exercise of shareholder rights –in<br />
the US the Securities and Exchange Commission has proposed a one-year<br />
minimum<br />
• Set capital gains tax rates on a sliding scale to reward long-term ownership<br />
• Lead by example – funds managed on behalf of <strong>Australian</strong> governments should<br />
be leading the way on active share ownership, rather <strong>than</strong> trailing the pack<br />
• Ensure compensation systems encourage long-term performance.<br />
• Require fund managers seeking government business to adopt long-term,<br />
focused compensation systems across the board<br />
• Require the remuneration of CEOs of major companies to be genuinely linked<br />
to long-term financial, social and environmental outcomes<br />
• Introduce ‘claw-back’ provisions to recapture executive compensation to cover<br />
significant environmental or social liabilities<br />
• Require major companies to disclose environmental and social performance and<br />
risks.<br />
• Amend directors’ and trustees’ duties to clarify that the interests of companies<br />
extend to the full range of stakeholder relationships, not just shareholders.<br />
• Support cooperative and non-profit business models, including by preferences in<br />
government procurement.<br />
• All government-managed funds should become signatories to the United Nations<br />
Principles for Responsible Investment and consider environmental, social and<br />
governance practices in their investment portfolios.<br />
55. See, for example,<br />
www.allbusiness.com/<br />
management-companiesenterprises/516029-1.html.<br />
Compare this with<br />
German law, for example,<br />
which provides that “the<br />
content of the company’s<br />
interests is ‘the<br />
upholding and ongoing<br />
functional fulfilment<br />
of the company’s<br />
duties to investors,<br />
workers, suppliers,<br />
customers, consumers,<br />
state and society’.”<br />
See Christoph Kuhner,<br />
‘Unternehmensinteresse<br />
vs. Shareholder<br />
Value als Leitmaxime<br />
kapitalmarktorientierter<br />
Aktiengesellschaften‘<br />
(Company Interest<br />
vs. Shareholder Value<br />
as central principle<br />
of capital marketoriented<br />
corporations),<br />
Presentation to Instituts<br />
für Arbeits- und<br />
Wirtschaftsrecht der<br />
Universität zu Köln,<br />
(21 July 2003), www.<br />
econbiz.de/archiv/k/<br />
uk/swpruefung/<br />
unternehmensinteresse_<br />
shareholder_value.<br />
pdf. (Citations omitted;<br />
translation by ACF.)<br />
ACF BETTER THAN GROWTH 27
etter business<br />
28<br />
ACF BETTER THAN GROWTH
7 <strong>Better</strong> taxation<br />
rewarding work, not waste<br />
› We will cut taxes on those things we all want more of such as income, investment<br />
and innovation. And we will shift those taxes to what we all want less of: pollution,<br />
greenhouse gas emissions and waste. … The Green Shift plan will be good for the environment<br />
and good for the economy. Good for the planet and good for your wallet. ‹<br />
stéphane Dion, Leader, Liberal Party of Canada, 2008 56<br />
› All tax systems are interventionist; the question is not whether to intervene but how to<br />
intervene. … A tax system should integrate cost with price. Currently, we dissociate the two.<br />
We know the price of everything but the cost of nothing. Price is what the buyer pays.<br />
Cost is what society pays. ‹ Paul Hawken, 1997 57<br />
In 2006, the Chinese Government resolved to impose a tax on disposable<br />
chopsticks. This initiative may seem trivial, until one realises that the<br />
production of 45 billion pairs of disposable chopsticks each year requires<br />
70 million cubic feet of timber – a dwindling resource in China.<br />
The chopsticks tax is a classic example of shifting the tax system so<br />
that it encourages efficiency (bring your own re-usable chopsticks!) and<br />
discourages needless resource use.<br />
By taxing throw-away chopsticks, China joins the growing list of<br />
environmental tax reform projects around the world. From congestion<br />
charges in London and Singapore to increased fuel taxes in many European<br />
nations to the comprehensive environmental tax shift proposal underway<br />
in the City of Winnipeg, governments around the world are seeking to align<br />
taxation with environmental goals.<br />
<strong>Australian</strong> governments raise revenue mostly by taxing productivity,<br />
56. Liberal Party of Canada,<br />
‘The Green Shift‘ (2008),<br />
www.cbc.ca/<br />
newsatsixns/pdf/<br />
liberalgreenplan.pdf<br />
57. Paul Hawken, ‘Natural<br />
Capitalism‘, Mother Jones,<br />
Mar–Apr 1997,<br />
http://motherjones.<br />
com/politics/1997/03/<br />
natural-capitalism<br />
ACF BETTER THAN GROWTH 29
etter taxation<br />
58. Worldwatch, State of the<br />
World: innovations for<br />
a Sustainable Economy<br />
(2008), pp.39-40,<br />
www.worldwatch.org/<br />
node/5568<br />
59. Steve Hatfield-Dodds,<br />
‘Beyond the Double<br />
Dividend: Modelling<br />
the impacts of achieving<br />
deep cuts in <strong>Australian</strong><br />
greenhouse gas<br />
emissions‘ (January 2007),<br />
http://climatesolutions.<br />
alp.org.au/download/<br />
now/shd_pa___impact_<br />
of_climate_policy_<br />
options___tax_efficiency_<br />
summary___aares_0701.<br />
pdf<br />
60. Michael Kohlhaas,<br />
‘Gesamtwirtschaftliche<br />
Effekte der ökologischen<br />
Steuerreform‘<br />
(Macroeconomic effects<br />
of the ecological tax<br />
reform) (August 2005),<br />
http://tiny.cc/keh03<br />
61. UK Green Fiscal<br />
Commission, The Case<br />
for Green Fiscal Reform<br />
(October 2009), p.5,<br />
www.greenfiscal<br />
commission.org.uk/<br />
images/uploads/GFC_<br />
FinalReport.pdf<br />
62. Liberal Party of Canada,<br />
‘The Green Shift‘,<br />
note 52.<br />
63. Review of Australia’s<br />
Future Tax System,<br />
Consultation paper,<br />
summary section 2 (2009),<br />
http://tiny.cc/48n7f<br />
work, employment, savings, sales and a few commodities such as fuel,<br />
alcohol and cigarettes. What if they instead taxed pollution, resource<br />
depletion, waste, inefficiency (such as congestion), advertising, short-term<br />
speculation and overwork?<br />
By taxing labour heavily, we discourage productivity and employment.<br />
By not taxing the use of most natural resources, we encourage businesses<br />
and individuals to squander them. Taken together, these distortions amount<br />
to a systematic and deeply embedded bias in favour of environmentally<br />
undesirable activities.<br />
As the Worldwatch Institute put it:<br />
The logic of capitalism, the greatest known system in human history for<br />
the creation of wealth, has not changed. But the relative scarcities have.<br />
In today’s world, the recipe for prosperity is to encourage the use of<br />
people … and to penalize the use of resources. 58<br />
There is growing evidence that environmental tax reform can increase<br />
employment at the same time that it reduces resource use and pollution.<br />
In Australia, economic modelling shows that using revenue raised from<br />
pricing carbon emissions to eliminate other inefficient taxes would actually<br />
increase employment above a business-as-usual baseline. 59<br />
This matches the actual experience of many European nations.<br />
Germany, for example, increased employment while reducing pollution by<br />
shifting taxes from pension contributions to fuel use. The Canadian Liberal<br />
Party proposed to use carbon revenue to lower income taxes.<br />
The UK Government’s official Green Fiscal Commission recently<br />
analysed the likely effects of a series of environmental tax reforms. The<br />
Commission concluded that “changing the price of polluting activities<br />
relative to clean ones is a vital element in any serious package of measures<br />
intended to reduce climate change emissions. Green Fiscal Reform is the<br />
By reducing pension taxes while increasing fuel<br />
taxes, Germany reduced greenhouse pollution<br />
by 2.6% while increasing employment by 0.5%. 60<br />
FIGURE 11: THE EFFECT OF GREEN FISCAL REFORM (GFR)<br />
ON GREENHOUSE GAS EMISSIONS 61<br />
% difference<br />
0<br />
–2<br />
–4<br />
–6<br />
–8<br />
1994 1997 2000 2003 2006 2009 2012<br />
Note: % difference is the difference between the base case and the counterfactual reference case.<br />
UK Netherlands Denmark Germany Finland Sweden<br />
The Canadian Liberal Party’s plan to establish a<br />
carbon tax while lowering income taxes would<br />
increase direct energy costs by $250 per year,<br />
while creating income tax benefits of between<br />
$1000 and $2000, for most average households. 62<br />
best way for a national economy to achieve this shift in prices.” 61 (see<br />
Figure 11).<br />
In Australia, the promise of environmental tax reform remains largely<br />
unrealised. However, the current Review of Australia’s Future Tax System<br />
has stated that “environmental sustainability is of such importance to<br />
Australia’s future that the Panel regards it as a principle against which the<br />
current system and potential reforms ought to be tested.” 63<br />
30<br />
ACF BETTER THAN GROWTH
etter taxation<br />
Policy Directions<br />
• Map out a 10- to 20-year program of phasing in greater taxation of resource<br />
use (including land), pollution and waste, while reducing taxes on income and<br />
productivity.<br />
• Appropriate border tax adjustments can be introduced to maintain the relative<br />
competitiveness of <strong>Australian</strong> businesses, as necessary<br />
• Remove concessions that encourage overinvestment in housing, unsustainable<br />
transport and urban sprawl, including<br />
• remove or cap land tax and capital gains tax concessions for principal<br />
residences, and limit negative gearing;<br />
• remove fossil fuel subsidies and increase taxation of fossil fuels to reflect full<br />
externality costs, while using revenue to offset other taxes; and<br />
• align fringe benefits tax (FBT) treatment of company cars to efficiency<br />
standards rather <strong>than</strong> distance travelled.<br />
• Use the taxation system to reward investment in best practice, greater innovation<br />
and green infrastructure through, for example, accelerated depreciation, tax<br />
increment financing and support for community financing.<br />
• Remove accelerated depreciation allowances from environmentally intensive<br />
investments such as aircraft and mineral exploration, and extend such concessions<br />
to sustainable technologies such as renewable energy and water systems.<br />
• Introduce a financial transaction tax and/or graduated capital gains tax system to<br />
discourage short-term market speculation and reward long-term share ownership.<br />
• Consider stripping tax deductibility of business advertising expenses, given the<br />
central role advertising plays in stimulating overconsumption.<br />
ACF BETTER THAN GROWTH 31
etter taxation<br />
32<br />
ACF BETTER THAN GROWTH
8 <strong>Better</strong> regulation<br />
fixing cost-benefit analysis<br />
› Our world will never be free from risk. However, a risk that is unnecessary, and not<br />
freely chosen, is never acceptable. … The costs of not taking precautionary action are<br />
often very high, as we’ve seen in the case of tobacco, lead and asbestos. Early scientific<br />
warnings about risks to health went unheeded by government agencies. As a result,<br />
billions of dollars have been spent to deal with the consequences of these problems. ‹<br />
Jared Blumenfeld, Director of San Francisco Department of the Environment, 2003 64<br />
› Let us take on directly the question of whether it could ever be reasonable to think<br />
that markets could reveal social values for use in discounting benefits into the far<br />
future. Our response is a clear ‘no’. We cannot and should not avoid taking on directly<br />
the basic ethical discussion. Market observations will not solve the problem for us. ‹<br />
lord Nicholas Stern, 2007 65<br />
Most major policy decisions in modern democracies are heavily shaped<br />
by utilitarian analysis. In Australia, government regulations are subject<br />
to cost-benefit analysis under guidelines developed by the Office of Best<br />
Practice Regulation (OBPR). Some private sector activity is subject to<br />
similar analysis, for example approvals for new major developments under<br />
planning and environment legislation.<br />
Inevitably, cost-benefit analysis is forced to grapple with heavily valueladen<br />
questions, such as:<br />
• How should the interests of future generations be valued today?<br />
• Do non-human species and natural systems have intrinsic worth, or are<br />
they valuable only insofar as they are useful to humans?<br />
• How much importance do we attach to distribution of wealth?<br />
• How comfortable are individuals and communities with risky outcomes?<br />
64. Jared Blumenfeld, ‘New<br />
Approaches to Safeguarding<br />
the Earth‘, San<br />
Francisco Chronicle (2003),<br />
http://articles.sfgate.<br />
com/2003-08-04/<br />
opinion/17503243_1_<br />
risk-environment-codeenvironmental<br />
ACF BETTER THAN GROWTH 33
etter regulation<br />
The US EPA estimated that permits under the<br />
acid rain program would cost $750 a tonne, but<br />
actual costs in 1997 were only $100 a tonne as a<br />
result of industry innovation. 66<br />
figure 12: Counting the future – the UK Treasury’s<br />
declining long-term discount rate takes more account<br />
of long-term environmental issues 67<br />
Period of<br />
years 0–30 31–75 76–125 126–200 201–300 301+<br />
discount<br />
rate 3.5% 3.0% 2.5% 2.0% 1.5% 1.0%<br />
65. Stern Review on the<br />
Economics of Climate<br />
Change, ‘Value<br />
judgements, welfare<br />
weights and discounting:<br />
issues and evidence‘<br />
(7 February 2007),<br />
www.occ.gov.uk/<br />
activities/stern_<br />
additional.htm<br />
66. Ruth Ruttenberg, ‘Not<br />
Too Costly, After All:<br />
An Examination of The<br />
Inflated Cost Estimates<br />
Of Health, Safety<br />
And Environmental<br />
Protections‘ (February<br />
2004),<br />
www.publiccitizen.org/<br />
documents/ACF187.pdf<br />
67. HM Treasury, The Green<br />
Book, Annex 6,<br />
www.hm-treasury.gov.<br />
uk/data_greenbook_<br />
index.htm<br />
67. Simon Dietz, Dennis<br />
Anderson, Nicholas Stern,<br />
Chris Taylor & Dimitri<br />
Zenghelis, ‘Right for<br />
the right reasons: a final<br />
rejoinder on the Stern<br />
review‘, World Economics<br />
Vol. 8, Issue 2 (2007),<br />
www.occ.gov.uk/<br />
activities/stern_papers/<br />
stern_worldeconomics<br />
091107.pdf<br />
68. Cameron Hepburn, ‘Use<br />
of Discount Rates in the<br />
Estimation of the Costs of<br />
Inaction with Respect to<br />
Selected Environmental<br />
Concerns‘, OECD<br />
Environment Directorate<br />
(19 February 2007), p.8,<br />
http://tiny.cc/eghme<br />
69. Peter Singer, Animal<br />
Liberation (1975)<br />
These are not questions with objective answers. Cost-benefit analysis is<br />
suffused with ethical judgments and we should always be clear about what<br />
those judgments are and whether they conform to the best sentiments of the<br />
community.<br />
Getting cost-benefit analysis right is of crucial importance for an<br />
ecologically sustainable economy. Bad analysis stymies sound regulation<br />
that can promote sustainable outcomes or, conversely, may lead to approval<br />
of projects and activities that leave us worse off.<br />
Cost-benefit analysis, as currently practised in Australia under the<br />
OBPR’s Best Practice Regulation Handbook, does not adequately deal with<br />
environmental and ethical issues. The following are examples of areas<br />
where improvements are needed.<br />
1. Allowing for changing values over time<br />
Cost-benefit analysis usually assumes the values of the future will be the<br />
same as the values of the present, but we know values shift over time.<br />
For example, <strong>Australian</strong>s in the 19th and early 20th century intentionally<br />
exterminated the thylacine (Tasmanian tiger), a decision that most<br />
Tasmanians today regard with deep regret and a sense of loss.<br />
‘Willingness to pay’ studies and other techniques for valuing nonmarket<br />
benefits do not capture the importance of changing values over<br />
time. A general principle of avoiding irreversible consequences – such as<br />
species extinction – is a better approach.<br />
2. Valuing our long-term future<br />
Cost-benefit analysis sharply discounts future costs and benefits. The OBPR<br />
recommends a seven per cent discount rate, based on present market rates<br />
of return – a practice Nicholas Stern and many others have criticised on<br />
the basis that market rates of return are not social rates of return and, in<br />
particular, do not typically reflect environmental or social externalities. 67<br />
The UK Treasury has recently adopted far lower recommended<br />
discount rates – 3.5 per cent and as low as one per cent for costs beyond<br />
a 300-year timeframe – which better reflect long-term environmental<br />
issues. The OECD has also noted that “the choice of social discount<br />
rate is extremely important to the valuation of … costs of inaction” on<br />
environmental issues. 68 (See Figure 12.)<br />
3. Taking account of fairness and equity<br />
Cost-benefit analysis as practised in Australia usually excludes any formal<br />
incorporation of distributional or equity concerns, even though it is well<br />
established that a benefit of $100 is worth more to a poor person <strong>than</strong> to a<br />
wealthy person. This is in contrast to best practice in other countries.<br />
In the UK, the use of distributional weighting explicitly incorporates<br />
the fact that the value of marginal additional consumption decreases as<br />
relative wealth increases. The <strong>Australian</strong> Best Practice Regulation Handbook<br />
devotes less <strong>than</strong> one page to equity, and provides no guidance on how to<br />
model distributional concerns.<br />
4. Recognising the intrinsic value of other species<br />
Cost-benefit analysis ignores costs and benefits to non-human species. Peter<br />
Singer, among others, has argued persuasively that the interests of some<br />
non-human species should have moral recognition on utilitarian grounds. 69<br />
34<br />
ACF BETTER THAN GROWTH
etter regulation<br />
Annual cost of environmental<br />
damage caused by the world’s<br />
3000 largest companies:<br />
US$2.2 trillion. 70<br />
For each 100 kilometres a commuter cyclist rides,<br />
the community benefits by more <strong>than</strong> $70 in<br />
avoided congestion and other road costs, as well<br />
as health improvements. 73<br />
5. Not reducing everything to money<br />
Cost-benefit analysis stresses monetisation of all costs and benefits,<br />
to ensure comparability of disparate costs and benefits. But reducing<br />
everything to a single metric is not always a useful approach. As the Stiglitz<br />
Commission put it:<br />
[W]hen driving a car, a meter that added up in one single number<br />
the current speed of the vehicle and the remaining level of gasoline<br />
would not be of any help to the driver. Both pieces of information are<br />
critical and need to be displayed in distinct, clearly visible areas of the<br />
dashboard. 71<br />
Cost-benefit analysis should avoid simplistic and misleading<br />
aggregated ‘net present value’ calculations in favour of a more nuanced,<br />
disaggregated approach where both monetised and non-monetised issues<br />
can be discussed on an equal footing.<br />
Furthermore, the excessive reliance on a final benefit-cost ratio as<br />
a deciding factor for projects excessively simplifies the complexity and<br />
subjectivity of values being assessed. As the Stiglitz Commission noted:<br />
Market prices are nonexistent for quite a large number of the assets that<br />
matter for future wellbeing. Even when they are available, there is no<br />
guarantee that they adequately reflect how these different assets will<br />
matter for future wellbeing. 72<br />
6. Involving affected communities directly in assessing<br />
costs and benefits<br />
Typically, cost-benefit analysis in Australia relies heavily on top-down<br />
economic modelling, rather <strong>than</strong> bottom-up assessments of costs and<br />
benefits by those actually affected and interested. Cost-benefit analysis<br />
is seldom used as a tool for engaging communities and helping people<br />
explore the desirability of particular decisions, rather it is often a technical<br />
exercise conducted by bureaucrats, academics and consultants several steps<br />
removed from affected communities.<br />
7. Taking a precautionary approach to risks<br />
Cost-benefit analysis frequently assumes risk neutrality, which is<br />
irreconcilable to a precautionary approach to environmental management.<br />
8. Broadening the toolkit for assessing costs and benefits<br />
In a practical sense, the tools available for assessing particular costs and<br />
benefits focus heavily on business costs. The OBPR provides a ‘business<br />
cost calculator’ that facilitates the identification of regulatory compliance<br />
costs. But there are no calculators or other tools provided to facilitate,<br />
for example, the assessment of the benefits of ecosystem services, or<br />
the benefits to business and the community of prudent management of<br />
natural resources. Furthermore, even the assessment of business costs often<br />
underestimates the innovation and resourcefulness of businesses once<br />
regulations are in place.<br />
70. Juliette Jowit, ‘World’s<br />
top firms cause $2.2tn of<br />
environmental damage,<br />
report estimates‘, The<br />
Guardian (18 February<br />
2010),<br />
www.guardian.co.uk/<br />
environment/2010/<br />
feb/18/worlds-topfirms-environmentaldamage<br />
71. Commission on the<br />
Measurement of<br />
Economic Performance<br />
and Social Progress, Final<br />
Report (2009), p.17,<br />
www.stiglitz-sen-fitoussi.<br />
fr/documents/rapport_<br />
anglais.pdf<br />
72. Ibid, p.266,<br />
73. Bauman A., Rissel C.,<br />
Garrard J., Ker I., Speidel<br />
R., Fishman E., Cycling:<br />
Getting Australia Moving:<br />
Barriers, facilitators and<br />
interventions to get more<br />
<strong>Australian</strong>s physically<br />
active through cycling<br />
Cycling Promotion Fund<br />
(2008),<br />
www.cyclingpromotion.<br />
com.au/images/stories/<br />
downloads/CPF_Hlth_<br />
Rprt_08_web.pdf<br />
ACF BETTER THAN GROWTH 35
etter regulation<br />
9. Improving environmental laws<br />
The assessment of major projects and new developments under<br />
environmental and planning legislation is another area where cost-benefit<br />
analysis and decision-making procedures are often inadequate to protect<br />
the environment.<br />
• While the ‘precautionary principle’ is sometimes incorporated into the<br />
law, in practise those opposing a particular proposal often bear the<br />
burden of proof to show unacceptable environmental risks, rather <strong>than</strong><br />
the onus being on project proponents to demonstrate that there will not be<br />
environmental damage.<br />
• Environmental impact assessments are often conducted by private<br />
consultants paid for by the proponent, leading to obvious conflicts of<br />
interest.<br />
• In some cases, as in the Federal Environment Protection and Biodiversity<br />
<strong>Conservation</strong> Act, all social and economic benefits of a proposal must be<br />
considered, against only a subset of the environmental impacts.<br />
• Assessments are often affected by ‘optimism bias’, defined as the<br />
“demonstrated systematic tendency for appraisers to be over-optimistic<br />
about key project parameters”. The UK Treasury recommends specific<br />
processes to address optimism bias in cost-benefit analysis. 74<br />
Policy Directions<br />
• Undertake a comprehensive review of the OBPR’s approach, including the<br />
Best Practice Regulation Handbook. Such a review should explore and improve<br />
the OBPR’s treatment of distributional concerns, intergenerational equity and<br />
ecological sustainability.<br />
• Develop tools to improve bottom-up analysis of social and environmental<br />
impacts, including the full inclusion of upstream and downstream externalities.<br />
• The Guide to Social Return on Investment 75 , produced by the UK Cabinet Office,<br />
is a useful tool for social impact analysis<br />
• The World Resource Institute’s Ecosystem Services: a Guide for Decisionmakers<br />
76 is an example of a tool that greatly improves how ecosystems are dealt<br />
with in cost-benefit analysis<br />
• Environmental economics provides well-established theories for the valuation<br />
of non-market impacts and externalities<br />
• Improve assessment of projects and developments under environmental and<br />
planning legislation by shifting to truly independent assessors and placing a clear<br />
burden of proof on proponents to demonstrate consistency with a precautionary<br />
approach, rather <strong>than</strong> on objectors to demonstrate risk or harm.<br />
74. HM Treasury, The Green<br />
Book, Annex 4,<br />
www.hm-treasury.gov.<br />
uk/data_greenbook_<br />
index.htm<br />
75. UK Cabinet Office, A<br />
Guide to Social Return on<br />
Investment,<br />
www.sroi-uk.org/<br />
component/option,com_<br />
docman/task,doc_<br />
download/gid,51/<br />
Itemid,38/<br />
76. World Resources<br />
Institute, Ecosystem<br />
Services: A Guide for<br />
Decision Makers (2008),<br />
www.wri.org/<br />
publication/ecosystemservices-a-guide-fordecision-makers<br />
36<br />
ACF BETTER THAN GROWTH
Conclusion<br />
towards a new economics<br />
› We must bring back into society a deeper sense of the purpose of living.<br />
The unhappiness in so many lives ought to tell us that success alone is not enough.<br />
<br />
Material success has brought us to a strange spiritual and moral bankruptcy. ‹<br />
› A macro-economy predicated on continual expansion of debt-driven materialistic<br />
consumption is unsustainable ecologically, problematic socially, and unstable<br />
Ben Okri<br />
economically. ‹<br />
We have described the changes proposed in this survey as the ‘new<br />
economics’, but they could also be seen as a reconnection with the best<br />
economic thinking of earlier generations.<br />
The first modern thinkers on economics – Adam Smith, Jeremy Bentham,<br />
John Stuart Mill and others – were deeply concerned with wellbeing and<br />
viewed economic systems as nothing more, and nothing less, <strong>than</strong> a means<br />
for achieving wellbeing. Indeed, these thinkers did not view themselves as<br />
technicians, describing immutable and mechanistic economic laws, but as<br />
moral philosophers, deeply involved with questions of purpose and ethics.<br />
Earlier still, Indigenous societies in Australia and around the<br />
world had a great diversity of economic and social relations. But never<br />
have human civilisations encouraged a preoccupation with material<br />
wellbeing at the expense of human relationships, ethical and spiritual<br />
development, and the natural world. And so much of the ‘new’<br />
economics described in this report, focusing on a holistic notion of<br />
wellbeing, is actually a return to a very ‘old’ economics as well.<br />
Prosperity Without Growth Report, UK Sustainable Development Commission<br />
We can improve the wellbeing of <strong>Australian</strong>s, but we cannot do it any<br />
longer by increasing the production and consumption of goods. Increases<br />
in material wealth have reached the point of vanishing returns for our<br />
quality of life. But if we have reached the end of a materialist development<br />
trajectory, we are only at the beginning of a richer and more balanced path.<br />
Governments have a central role to play in guiding Australia towards a<br />
future where progress is viewed as much more <strong>than</strong> <strong>growth</strong>. In this report,<br />
we have set out some signposts for what that role might entail.<br />
But governments seldom strike out on such ambitious programs<br />
of reform alone. For all of us – as individual citizens, as members of<br />
communities and through civil society organisations – we must demand<br />
such change if it is to become a reality.<br />
We can and must do better <strong>than</strong> mere economic <strong>growth</strong>. We can aim for<br />
a society that grows our opportunities – to pursue meaning and personal<br />
satisfaction, to live sustainably, to build vibrant relationships with the<br />
community and the natural world, and to live life to the fullest.<br />
ACF BETTER THAN GROWTH 37
38<br />
ACF BETTER THAN GROWTH
Further information<br />
General<br />
UK Sustainable Development Commission, Prosperity Without Growth:<br />
The Transition to a Sustainable Economy<br />
www.sd-commission.org.uk/publications.php?id=914<br />
UK Conservative Party, Blueprint for a Green Economy<br />
www.qualityoflifechallenge.com<br />
<strong>Better</strong> progress<br />
Commission on the Measurement of Economic Performance and Social<br />
Progress (‘Stiglitz Commission‘), Final Report<br />
www.stiglitz-sen-fitoussi.fr/documents/rapport_anglais.pdf<br />
New Economics <strong>Foundation</strong>, Happy Planet Index 2.0<br />
www.happyplanetindex.org<br />
OECD, ‘A Framework to Measure the Progress of Societies‘<br />
www.oecd.org/dataoecd/40/46/43631612.pdf<br />
<strong>Better</strong> work<br />
Orio Giarini and Patrick M. Liedtke, The Employment Dilemma<br />
and the Future of Work<br />
www.genevaassociation.org/PDF/BookandMonographs/<br />
The_Employment_Dilemma_2006.pdf<br />
(and critique of same by Anthony Judge at<br />
www.laetusinpraesens.org/docs/romework.php)<br />
<strong>Better</strong> production<br />
The Story of Stuff<br />
www.storyofstuff.com<br />
William McDonough and Michael Braungart, Cradle to Cradle: Remaking the<br />
Way We Make Things<br />
Worldwatch Institute, State of the World 2008: Innovations for a Sustainable<br />
Economy (Chapter 3)<br />
www.worldwatch.org/node/5568<br />
<strong>Better</strong> consumption<br />
UK Sustainable Development Commission, I Will if You Will: Towards<br />
Sustainable Consumption<br />
www.sd-commission.org.uk/publications.php?id=367<br />
ACF Consumption Atlas<br />
www.acfonline.org.au/consumptionatlas<br />
<strong>Better</strong> markets<br />
World Resources Institute, Ecosystem Services: A Guide for Decision Makers<br />
www.wri.org/publication/ecosystem-services-a-guide-for-decision-makers<br />
<strong>Better</strong> business<br />
Jonathon Porritt, Capitalism: As if the World Matters<br />
Bill McKibben, Deep Economy: the Wealth of Communities and the<br />
Durable Future<br />
<strong>Better</strong> taxation<br />
‘Towards an ecologically sound <strong>Australian</strong> tax system’, National<br />
Environmental Law Review<br />
www.acfonline.org.au/uploads/res/NELA0902_BERGER_paper.pdf<br />
Green Fiscal Commission, The Case for Green Fiscal Reform – Final Report<br />
www.greenfiscalcommission.org.uk/images/uploads/<br />
GFC_FinalReport.pdf<br />
<strong>Better</strong> regulation<br />
Stern Review on the Economics of Climate Change (Chapter 2 of main<br />
report and subsequent paper on ‘Value judgements, welfare weights and<br />
discounting: issues and evidence‘)<br />
www.hm-treasury.gov.uk/sternreview_index.htm<br />
UK Treasury, The Green Book (including supplementary guidance and<br />
departmental guidance on environmental issues)<br />
www.hm-treasury.gov.uk/data_greenbook_index.htm<br />
ACF BETTER THAN GROWTH 39
“<br />
Most <strong>Australian</strong>s don’t agree that their only goal in life is to increase<br />
their financial wealth and consumption – but too often our economic<br />
policy treats us as if we do. In reality, our quality of life depends on<br />
having time for family and friends, a strong sense of community, and<br />
a healthy natural environment. Our economy should help us achieve<br />
those goals.<br />
We can do better <strong>than</strong> a narrow vision of economic <strong>growth</strong>, and this<br />
report shows us how. <strong>Better</strong> <strong>than</strong> Growth explores the best practical<br />
thinking from around the world about how to improve economic<br />
measurements and align our economies to long-term environmental<br />
and social wellbeing.”<br />
<br />
– Don Henry<br />
ACF executive Director<br />
<strong>Australian</strong> <strong>Conservation</strong> <strong>Foundation</strong><br />
Floor 1, 60 Leicester Street<br />
Carlton VIC 3053<br />
Australia<br />
+61 3 9345 1111<br />
acf@acfonline.org.au<br />
www.acfonline.org.au<br />
<strong>Better</strong><br />
<strong>than</strong><br />
<strong>growth</strong>