Cannon Equity Fund Factsheet - Cannon Asset Managers
Cannon Equity Fund Factsheet - Cannon Asset Managers
Cannon Equity Fund Factsheet - Cannon Asset Managers

You also want an ePaper? Increase the reach of your titles
YUMPU automatically turns print PDFs into web optimized ePapers that Google loves.
CANNON EQUITY FUND<br />
FEBRUARY 2011<br />
CONTACT: Doug Turvey & Bella Shongwe +27-11-463-3140 unittrusts@cannonassets.co.za<br />
INVESTMENT OBJECTIVES<br />
The <strong>Cannon</strong> <strong>Equity</strong> <strong>Fund</strong> aims to deliver sustainable growth in capital<br />
through exposure to listed equities over a three-to-five year investment<br />
horizon. Recognising the relatively long-term horizon, we endeavour to<br />
outperform the JSE’s All Share Index (ALSI) on a rolling basis and, in so<br />
doing, deliver returns that ensure real growth in investors’ wealth. The<br />
portfolio manager does not make use of gearing or derivative instruments to<br />
achieve the investment objective. <strong>Asset</strong> class risk must be managed by<br />
investors outside of the fund.<br />
INVESTMENT COMMENT<br />
With the first month of the new year out of the way, volumes picked up over<br />
the course of February and the FTSE-JSE All Share Index made up for the lost<br />
ground over January by returning 2.8 percent. The <strong>Cannon</strong> <strong>Equity</strong> <strong>Fund</strong><br />
returned 2.6 percent. This slight underperformance is largely attributable to<br />
our overweight exposure to the construction sector, where we continue to see<br />
deep value in this unloved sector, especially amongst some of the higher<br />
quality businesses, including Aveng and Group 5. The political unrest in the<br />
Middle East and North African regions proved to be a positive influence on<br />
portfolio performance as the oil and gas sector was the top performing sector<br />
over February. This was driven chiefly by Sasol, which has a high weight in<br />
our investment portfolio and which returned 9.8 percent over the month.<br />
As the market continues in this upward trend a frequent question that is<br />
currently been raised is whether local equities remain the most prudent asset<br />
class to invest in?<br />
There are numerous methods for assessing the current valuation of a market.<br />
One such commonly used method is the price earnings (PE) ratio. A problem<br />
with the simple PE ratio, however, is that it is overly reliant on near term<br />
events, such as the current phase of the economic cycle, because the E part is<br />
determined only by recent earnings. For this reason we use a cyclically<br />
adjusted PE ratio which inflates earnings over the past 5 to 10 years to<br />
today’s prices, giving a cyclically adjusted earnings figure in the calculation<br />
of the PE ratio. Based on this valuation method, we are of the view that the<br />
local market is fairly valued, and hence opportunities for the active stock<br />
picker remain.<br />
PERFORMANCE METRICS<br />
<strong>Fund</strong> Benchmark<br />
Return Since Inception (% cumulative)<br />
Return Since Inception (% annualised)<br />
144.05<br />
17.06<br />
163.18<br />
18.59<br />
High Water Mark (cpu) 246.73 269.82<br />
Low Water Mark (cpu) 98.78 100.00<br />
% of Positive Months 64.18 62.69<br />
CANNON EQUITY FUND VS ALSI (J203T)<br />
Performance Annualised Benchmark Cumulative Benchmark<br />
1 Year 18.03% 23.57% 18.03% 23.57%<br />
2 Years<br />
3 Years<br />
33.99%<br />
3.54%<br />
35.37%<br />
4.58%<br />
79.54%<br />
10.99%<br />
83.26%<br />
14.37%<br />
Volatility<br />
1 Year 12.44% 16.92%<br />
2 Years<br />
3 Years<br />
15.51%<br />
21.00%<br />
19.36%<br />
26.19%<br />
Correlation<br />
1 Year 0.75 1.00<br />
2 Years<br />
3 Years<br />
0.74<br />
0.72<br />
1.00<br />
1.00<br />
FUND FACTS<br />
<strong>Fund</strong> Manager<br />
Dr Adrian Saville<br />
Classification<br />
Domestic <strong>Equity</strong> - General<br />
Universe (Benchmark)<br />
ALSI (J203T)<br />
Objective<br />
Capital Appreciation<br />
Risk<br />
Aggressive<br />
Year End<br />
December<br />
<strong>Fund</strong> Inception 01 July 2005<br />
Lump Sum (Minimum) R10 000<br />
Recurring (Minimum)<br />
R500<br />
Current Unit Price<br />
216.92cpu<br />
Total Expense Ratio 1.44<br />
Please note: the TER has been calculated using data from 1 st January 2010 till 31 st<br />
December 2010. The TER is disclosed as % of the average Net <strong>Asset</strong> Value of the<br />
portfolio that were incurred as charges, levies and fees related to the management<br />
of the portfolio and underlying portfolios.<br />
A higher TER ratio does not necessarily imply a poor return, nor does a low<br />
TER imply a good return. The current TER cannot be regarded as an indication<br />
of future TERs.<br />
Income Declarations 30 June & 31 December<br />
Income 7 July 2009 2.66cpu<br />
7 January 2010 1.83cpu<br />
7 July 2010 0.68cpu<br />
7 January 2011 2.25cpu<br />
FAIS CONFLICT OF INTEREST DISCLOSURE<br />
Please note that in most cases where the Broker is a related party to <strong>Cannon</strong> <strong>Asset</strong><br />
<strong>Managers</strong> (Pty) Ltd and /or Metropolitan, <strong>Cannon</strong> <strong>Asset</strong> <strong>Managers</strong> (Pty) Ltd<br />
and/or distributor earns additional fees apart from the Broker’s client advisory<br />
fees. It is the Broker’s responsibility to disclose additional fees to you as the client.<br />
Such fees are paid out of the portfolio’s service charge and ranges between (excl<br />
VAT)<br />
Annual<br />
Upfront<br />
Metropolitan Up to 0.35% Up to 0.25%<br />
<strong>Cannon</strong> <strong>Asset</strong> <strong>Managers</strong> (Pty) Ltd Up to 0.925% Nil<br />
Maximum Broker Fee Up to 0.50% Up to 3.00%<br />
Total Service Charge 1.25%<br />
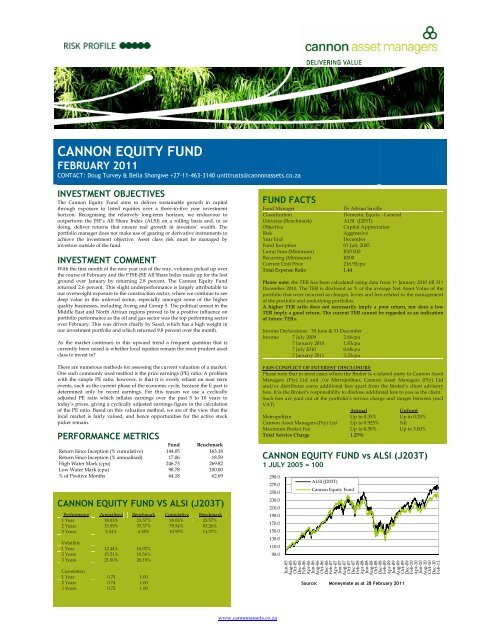
CANNON EQUITY FUND vs ALSI (J203T)<br />
1 JULY 2005 = 100<br />
290.0<br />
270.0<br />
250.0<br />
230.0<br />
210.0<br />
190.0<br />
170.0<br />
150.0<br />
130.0<br />
110.0<br />
90.0<br />
ALSI (J203T)<br />
<strong>Cannon</strong> <strong>Equity</strong> <strong>Fund</strong><br />
Jun-05<br />
Aug-05<br />
Oct-05<br />
Dec-05<br />
Feb-06<br />
Apr-06<br />
Jun-06<br />
Aug-06<br />
Oct-06<br />
Dec-06<br />
Feb-07<br />
Apr-07<br />
Jun-07<br />
Aug-07<br />
Oct-07<br />
Dec-07<br />
Feb-08<br />
Apr-08<br />
Jun-08<br />
Aug-08<br />
Oct-08<br />
Dec-08<br />
Feb-09<br />
Apr-09<br />
Jun-09<br />
Aug-09<br />
Oct-09<br />
Dec-09<br />
Feb-10<br />
Apr-10<br />
Jun-10<br />
Aug-10<br />
Oct-10<br />
Dec-10<br />
Feb-11<br />
Source: Moneymate as at 28 February 2011<br />
www.cannonassets.co.za
CANNON EQUITY FUND<br />
FEBRUARY 2011<br />
CONTACT: Doug Turvey & Bella Shongwe +27-11-463-3140 unittrusts@cannonassets.co.za<br />
SECTOR ALLOCATION<br />
TOP TEN HOLDINGS<br />
Basic Materials<br />
Financials<br />
Industrials<br />
Oil & Gas<br />
Consumer Goods<br />
Technology<br />
Consumer Services<br />
Telecommunications<br />
15.07<br />
10.22<br />
8.32<br />
6.72<br />
3.26<br />
2.05<br />
22.48<br />
31.21<br />
Anglo American Plc 12.62<br />
Sasol Ltd 10.22<br />
Old Mutual Plc 5.67<br />
Steinhoff Int Hld Ltd 4.97<br />
ArcelorMittal SA Ltd 4.25<br />
AECI Limited 4.10<br />
Grindrod Limited 3.57<br />
Aveng Limited 3.47<br />
Assore Limited 3.42<br />
Lewis Group Limited 3.25<br />
TOTAL 55.55<br />
Cash<br />
0.67<br />
ADMINISTRATION<br />
If your complaint has not been resolved to your<br />
satisfaction, kindly contact our Complaints<br />
Resolution Committee: Tel: (021) 940 5880,<br />
Fax:(021) 940 6205<br />
Email: emoruck@metropolitan.co.za or metunit@metropolitan.co.za<br />
Custodian: Standard Executors & Trustees: Tel (021) 401-2286. Metropolitan Collective<br />
Investments Limited PO Box 925 Bellville 7535 Tel (021) 940-5981 Fax (021) 940-5885 Call<br />
Centre, Tel: 0860 100 279 Registration No 1991/03741/06<br />
Collective Investments are generally medium to long term investments. The<br />
value of participating interests may go down as well as up and past<br />
performance is not necessarily a guide to the future. Collective Investments are<br />
traded at ruling prices and can engage in scrip lending. Forward pricing is<br />
used. A schedule of fees and charges and maximum commissions is available<br />
on request from <strong>Cannon</strong> <strong>Asset</strong> <strong>Managers</strong>. Commission and incentives may be<br />
paid and if so, are included in the overall cost. This fund may be closed to new<br />
investors. Graphs and performance figures are sourced from MoneyMate for<br />
lump sum investments including income distribution, at NAV to NAV basis<br />
and do not take any initial fees into account. Income is reinvested on the exdividend<br />
date. Actual investment performance will differ based on the initial<br />
fees applicable, the actual investment date and the date of reinvestment of<br />
income. Collective Investment prices are calculated on a net asset value basis<br />
and auditor’s fees, bank charges and trustee fees are levied against the<br />
portfolio. The portfolio manager may borrow up to 10% of portfolio NAV to<br />
bridge insufficient liquidity. The performance fee FAQ document is kept as a<br />
public document at Metropolitan Head office. The FSP holds professional<br />
indemnity cover and fidelity insurance cover. Metropolitan Collective<br />
Investments Ltd is an authorised Financial Services Provider and a Full<br />
member of the Association for Savings & Investments SA (ASISA).<br />
FURTHER CONTACT DETAILS<br />
<strong>Cannon</strong> <strong>Asset</strong> <strong>Managers</strong> (Pty) Ltd<br />
First Floor, Building B,<br />
Bryanston Corner,<br />
18 Ealing Crescent<br />
Bryanston, 2194.<br />
PO Box 70997,<br />
Bryanston, 2021<br />
Unit 2 Rydall Vale Crescent,<br />
Rydall Vale Park,<br />
La Lucia Ridge, 4019.<br />
PO Box 5200,<br />
Rydall Vale Park, 4019.<br />
Authorised Financial Services Provider #736.<br />
www.cannonassets.co.za