Mortality and Morbidity in Children - Ministry of Health
Mortality and Morbidity in Children - Ministry of Health
Mortality and Morbidity in Children - Ministry of Health

You also want an ePaper? Increase the reach of your titles
YUMPU automatically turns print PDFs into web optimized ePapers that Google loves.
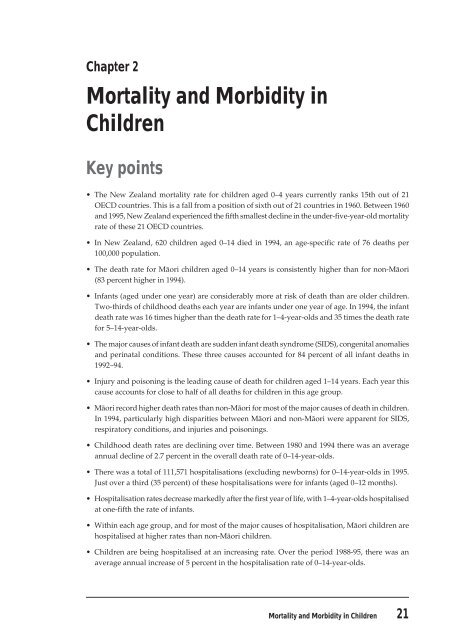
Chapter 2<br />
<strong>Mortality</strong> <strong>and</strong> <strong>Morbidity</strong> <strong>in</strong><br />
<strong>Children</strong><br />
Key po<strong>in</strong>ts<br />
• The New Zeal<strong>and</strong> mortality rate for children aged 0–4 years currently ranks 15th out <strong>of</strong> 21<br />
OECD countries. This is a fall from a position <strong>of</strong> sixth out <strong>of</strong> 21 countries <strong>in</strong> 1960. Between 1960<br />
<strong>and</strong> 1995, New Zeal<strong>and</strong> experienced the fifth smallest decl<strong>in</strong>e <strong>in</strong> the under-five-year-old mortality<br />
rate <strong>of</strong> these 21 OECD countries.<br />
• In New Zeal<strong>and</strong>, 620 children aged 0–14 died <strong>in</strong> 1994, an age-specific rate <strong>of</strong> 76 deaths per<br />
100,000 population.<br />
• The death rate for Mäori children aged 0–14 years is consistently higher than for non-Mäori<br />
(83 percent higher <strong>in</strong> 1994).<br />
• Infants (aged under one year) are considerably more at risk <strong>of</strong> death than are older children.<br />
Two-thirds <strong>of</strong> childhood deaths each year are <strong>in</strong>fants under one year <strong>of</strong> age. In 1994, the <strong>in</strong>fant<br />
death rate was 16 times higher than the death rate for 1–4-year-olds <strong>and</strong> 35 times the death rate<br />
for 5–14-year-olds.<br />
• The major causes <strong>of</strong> <strong>in</strong>fant death are sudden <strong>in</strong>fant death syndrome (SIDS), congenital anomalies<br />
<strong>and</strong> per<strong>in</strong>atal conditions. These three causes accounted for 84 percent <strong>of</strong> all <strong>in</strong>fant deaths <strong>in</strong><br />
1992–94.<br />
• Injury <strong>and</strong> poison<strong>in</strong>g is the lead<strong>in</strong>g cause <strong>of</strong> death for children aged 1–14 years. Each year this<br />
cause accounts for close to half <strong>of</strong> all deaths for children <strong>in</strong> this age group.<br />
• Mäori record higher death rates than non-Mäori for most <strong>of</strong> the major causes <strong>of</strong> death <strong>in</strong> children.<br />
In 1994, particularly high disparities between Mäori <strong>and</strong> non-Mäori were apparent for SIDS,<br />
respiratory conditions, <strong>and</strong> <strong>in</strong>juries <strong>and</strong> poison<strong>in</strong>gs.<br />
• Childhood death rates are decl<strong>in</strong><strong>in</strong>g over time. Between 1980 <strong>and</strong> 1994 there was an average<br />
annual decl<strong>in</strong>e <strong>of</strong> 2.7 percent <strong>in</strong> the overall death rate <strong>of</strong> 0–14-year-olds.<br />
• There was a total <strong>of</strong> 111,571 hospitalisations (exclud<strong>in</strong>g newborns) for 0–14-year-olds <strong>in</strong> 1995.<br />
Just over a third (35 percent) <strong>of</strong> these hospitalisations were for <strong>in</strong>fants (aged 0–12 months).<br />
• Hospitalisation rates decrease markedly after the first year <strong>of</strong> life, with 1–4-year-olds hospitalised<br />
at one-fifth the rate <strong>of</strong> <strong>in</strong>fants.<br />
• With<strong>in</strong> each age group, <strong>and</strong> for most <strong>of</strong> the major causes <strong>of</strong> hospitalisation, Mäori children are<br />
hospitalised at higher rates than non-Mäori children.<br />
• <strong>Children</strong> are be<strong>in</strong>g hospitalised at an <strong>in</strong>creas<strong>in</strong>g rate. Over the period 1988-95, there was an<br />
average annual <strong>in</strong>crease <strong>of</strong> 5 percent <strong>in</strong> the hospitalisation rate <strong>of</strong> 0–14-year-olds.<br />
<strong>Mortality</strong> <strong>and</strong> <strong>Morbidity</strong> <strong>in</strong> <strong>Children</strong><br />
21
<strong>Mortality</strong><br />
Childhood deaths totalled 620 <strong>in</strong> 1994. This represents an age-specific rate <strong>of</strong> 76 deaths per 100,000<br />
children aged 0–14 years (Table 2.1).<br />
More boys than girls die each year <strong>in</strong> New Zeal<strong>and</strong>, with boys account<strong>in</strong>g for 56 percent <strong>of</strong> childhood<br />
deaths <strong>in</strong> 1994. Mäori children are at higher risk <strong>of</strong> dy<strong>in</strong>g before the age <strong>of</strong> 15 years than are non-<br />
Mäori children. In 1994, Mäori children recorded a death rate that was 83 percent higher than non-<br />
Mäori children (125 <strong>and</strong> 68 per 100,000 children aged 0–14 years for Mäori <strong>and</strong> non-Mäori<br />
respectively)<br />
Table 2.1: Deaths from all causes, by sex <strong>and</strong> ethnicity, 0–14-year-olds, 1994<br />
Number Percentage Rate*<br />
Total 620 76<br />
Male 349 56% 83<br />
Female 271 44% 68<br />
Relative risk for males 1.22<br />
Mäori 134 22% 125<br />
Non-Mäori 486 78% 68<br />
Relative risk for Mäori 1.83<br />
*Age-specific rate per 100,000 population.<br />
Source <strong>of</strong> data:<br />
M<strong>in</strong>istry <strong>of</strong> <strong>Health</strong> 1998.<br />
Infants under one year are at much greater risk <strong>of</strong> dy<strong>in</strong>g than are older children (Table 2.2). In<br />
1994, two-thirds <strong>of</strong> all childhood deaths were <strong>in</strong>fants (a rate <strong>of</strong> seven <strong>in</strong>fant deaths per 1000<br />
livebirths).<br />
The risk <strong>of</strong> dy<strong>in</strong>g <strong>in</strong> childhood decreases rapidly after the first year. In 1994, the death rate for<br />
children aged 1–4 years was 44 per 100,000, a rate 16 times lower than for <strong>in</strong>fants, although still<br />
twice the rate recorded <strong>in</strong> the 5–9 <strong>and</strong> 10–14 year age groups.<br />
The disparity between Mäori <strong>and</strong> non-Mäori death rates <strong>in</strong> children is apparent <strong>in</strong> each <strong>of</strong> the age<br />
groups, shown <strong>in</strong> table 2.2.<br />
22 Our <strong>Children</strong>’s <strong>Health</strong>
Table 2.2: Deaths from all causes, by age group, 0–14-year-olds, 1994<br />
Total Mäori Non-Mäori<br />
Age group Number Rate* Number Rate* Number Rate*<br />
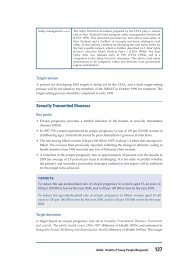
Figure 2.2: Major causes <strong>of</strong> death <strong>of</strong> 1–4-year-olds, 1992–94<br />
Other<br />
causes 19%<br />
Nervous system<br />
disorders 8%<br />
Injury <strong>and</strong><br />
poison<strong>in</strong>g 46%<br />
Cancer 11%<br />
Congenital<br />
anomalies 16%<br />
Source <strong>of</strong> data:<br />
M<strong>in</strong>istry <strong>of</strong> <strong>Health</strong> 1998.<br />
Injury <strong>and</strong> poison<strong>in</strong>g is also the most common cause <strong>of</strong> death <strong>in</strong> the 5–9 <strong>and</strong> 10–14 year age groups,<br />
account<strong>in</strong>g for nearly half <strong>of</strong> all deaths each year (47 percent <strong>in</strong> the 5–9 year age group <strong>and</strong> 48<br />
percent <strong>in</strong> the 10–14 year age group <strong>in</strong> 1992-94) (Figures 2.3 <strong>and</strong> 2.4).<br />
Cancer is also a common cause <strong>of</strong> death for children <strong>in</strong> the 5–9 <strong>and</strong> 10–14 year age groups,<br />
account<strong>in</strong>g for 21 percent <strong>and</strong> 14 percent <strong>of</strong> deaths respectively <strong>in</strong> these age groups <strong>in</strong> 1992–94.<br />
Figure 2.3: Major causes <strong>of</strong> death <strong>of</strong> 5–9-year-olds, 1992–94<br />
Other<br />
causes 13%<br />
Nervous system<br />
disorders 8%<br />
Cancer 21%<br />
Injury <strong>and</strong><br />
poison<strong>in</strong>g 47%<br />
Congenital<br />
anomalies 11%<br />
Source <strong>of</strong> data:<br />
M<strong>in</strong>istry <strong>of</strong> <strong>Health</strong> 1998.<br />
24 Our <strong>Children</strong>’s <strong>Health</strong>
Figure 2.4: Major causes <strong>of</strong> death <strong>of</strong> 10–14-year-olds, 1992–94<br />
Other<br />
causes 19%<br />
Nervous system<br />
disorders 12%<br />
Injury <strong>and</strong><br />
poison<strong>in</strong>g 48%<br />
Cancer 14%<br />
Source <strong>of</strong> data:<br />
M<strong>in</strong>istry <strong>of</strong> <strong>Health</strong> 1998.<br />
Congenital<br />
anomalies 7%<br />
Mäori children are at greater risk <strong>of</strong> death than non-Mäori children for most <strong>of</strong> the major causes<br />
(Table 2.3). Between 1992 <strong>and</strong> 1994, the greatest disparity <strong>in</strong> death rates between Mäori <strong>and</strong> non-<br />
Mäori children was recorded for SIDS <strong>and</strong> respiratory conditions. For SIDS, Mäori children recorded<br />
a rate 4.5 times the non-Mäori rate, while for respiratory conditions the Mäori death rate was 2.7<br />
times that for non-Mäori children. For road traffic <strong>in</strong>juries <strong>and</strong> for other <strong>in</strong>juries <strong>and</strong> poison<strong>in</strong>gs,<br />
Mäori children recorded death rates 1.5 times higher than non-Mäori children. Compared to non-<br />
Mäori children, death rates for Mäori were similar or lower for congenital anomalies, per<strong>in</strong>atal<br />
conditions, cancer, nervous system disorders, <strong>and</strong> <strong>in</strong>fectious diseases.<br />
Table 2.3: Major causes <strong>of</strong> death, by ethnicity, 0–14-year-olds, 1992–94<br />
Mäori Non-Mäori Relative risk<br />
for Mäori<br />
Number Rate* Number Rate*<br />
Congenital anomalies 50 15.5 392 18.7 0.8<br />
SIDS** 144 6.7 231 1.5 4.5<br />
Per<strong>in</strong>atal conditions** 50 2.3 301 2.0 1.2<br />
Injury <strong>and</strong> poison<strong>in</strong>g 43 13.4 182 8.7 1.5<br />
(other than road traffic <strong>in</strong>juries)<br />
Road traffic <strong>in</strong>juries 26 8.1 113 5.4 1.5<br />
Cancer 12 3.7 92 4.4 0.8<br />
Nervous system disorders 7 2.2 83 4.0 0.6<br />
Respiratory conditions 21 6.5 51 2.4 2.7<br />
Infectious diseases 7 2.2 35 1.7 1.3<br />
All other causes 13 4.0 84 4.0 1.0<br />
All causes 373 115.9 1564 74.7 1.6<br />
* Rate per 100,000 population.<br />
** Infant deaths only, rates per 1000 livebirths.<br />
Source <strong>of</strong> data:<br />
M<strong>in</strong>istry <strong>of</strong> <strong>Health</strong> 1998.<br />
<strong>Mortality</strong> <strong>and</strong> <strong>Morbidity</strong> <strong>in</strong> <strong>Children</strong><br />
25
Changes over time<br />
Childhood death rates are cont<strong>in</strong>u<strong>in</strong>g to decl<strong>in</strong>e <strong>in</strong> New Zeal<strong>and</strong>. Between 1980 <strong>and</strong> 1994, the<br />
death rate for the 0–14 year age group decreased from 115 to 76 per 100,000, an annual average<br />
decrease <strong>of</strong> 2.9 percent (Figure 2.5).<br />
This decrease was not evenly shared between Mäori <strong>and</strong> non-Mäori. For Mäori children, an annual<br />
average decrease <strong>of</strong> 1.7 percent was recorded between 1980 <strong>and</strong> 1994, compared to an annual<br />
average decrease <strong>of</strong> 3.3 percent for non-Mäori. Overall, dur<strong>in</strong>g this 15–year period the disparity<br />
between Mäori <strong>and</strong> non-Mäori rates <strong>of</strong> childhood deaths <strong>in</strong>creased.<br />
Figure 2.5: Deaths from all causes, by ethnicity, 0–14-year-olds, 1980–94<br />
Rate per 100,000 population<br />
160<br />
140<br />
120<br />
100<br />
80<br />
60<br />
40<br />
20<br />
0<br />
1980 1981 1982 1983 1984 1985 1986 1987 1988 1989 1990 1991 1992 1993 1994<br />
Year<br />
Source <strong>of</strong> data:<br />
M<strong>in</strong>istry <strong>of</strong> <strong>Health</strong> 1998.<br />
Total Maori Non-Maori<br />
Decreases <strong>in</strong> all-cause death rates have been recorded for all age groups under 15 years between<br />
1980 <strong>and</strong> 1994 (Table 2.4). For each age group, an annual average decrease <strong>of</strong> between 2.7 percent<br />
<strong>and</strong> 3.3 percent <strong>in</strong> the overall death rate was recorded dur<strong>in</strong>g this time.<br />
Table 2.4: Reduction <strong>in</strong> numbers <strong>and</strong> rates <strong>of</strong> death, by age group, 0–14-year-olds, 1980–94<br />
1980 1994 Total Annual<br />
reduction reduction<br />
No. *Rate No. *Rate<br />
<strong>Morbidity</strong><br />
This section summarises recent hospitalisation data from the National M<strong>in</strong>imum Dataset,<br />
ma<strong>in</strong>ta<strong>in</strong>ed by the New Zeal<strong>and</strong> <strong>Health</strong> Information Service. The data presented here are based<br />
on numbers <strong>of</strong> hospitalisation events, not numbers <strong>of</strong> unique <strong>in</strong>dividuals hospitalised. Both<br />
daypatient <strong>and</strong> <strong>in</strong>patient hospitalisations are <strong>in</strong>cluded. One unique <strong>in</strong>dividual may be represented<br />
<strong>in</strong> the data several times if they were hospitalised as a daypatient or <strong>in</strong>patient more than once.<br />
In 1995, hospitalisations totalled 111,571 for New Zeal<strong>and</strong> 0–14-year-olds (Table 2.5).<br />
Table 2.5: Hospitalisations from all causes, by sex <strong>and</strong> ethnicity, 0–14-year-olds, 1995<br />
Number Percentage Rate*<br />
Total 111,571 13,450<br />
Male 63,416 57% 14,890<br />
Female 48,155 43% 11,920<br />
Relative risk for males 1.25<br />
Mäori 24,259 22% 22,660<br />
Non- Mäori 87,312 78% 12,080<br />
Relative risk for Mäori 1.88<br />
* Age-specific rate per 100,000 population.<br />
Source <strong>of</strong> data:<br />
M<strong>in</strong>istry <strong>of</strong> <strong>Health</strong> 1998.<br />
Note:<br />
Sums <strong>of</strong> males <strong>and</strong> females, <strong>and</strong> Maori <strong>and</strong> non-Maori may be less than totals, as a small number <strong>of</strong> patients for<br />
whom sex <strong>and</strong> ethnicity were not recorded are <strong>in</strong>cluded <strong>in</strong> totals.<br />
In 1995, as is usually the case, a greater proportion <strong>of</strong> boys (57 percent) than girls (43 percent) were<br />
hospitalised. In addition, Mäori children were hospitalised at nearly twice the rate <strong>of</strong> non-Mäori<br />
children.<br />
Hospitalisation rates decrease with <strong>in</strong>creas<strong>in</strong>g age dur<strong>in</strong>g childhood (Table 2.6). Infants less than<br />
one year old record the highest rate <strong>of</strong> hospitalisation. In 1995, <strong>in</strong>fants were hospitalised at almost<br />
10 times the rate <strong>of</strong> any other childhood age group <strong>and</strong> accounted for 35 percent <strong>of</strong> all childhood<br />
hospitalisation events.<br />
Those aged 10–14 years are the least likely childhood group to be hospitalised. In 1995, 10–14-<br />
year-olds were hospitalised at one twentieth <strong>of</strong> the <strong>in</strong>fant hospitalisation rate <strong>and</strong> at half <strong>of</strong> the<br />
1–4-year-old hospitalisation rate.<br />
<strong>Mortality</strong> <strong>and</strong> <strong>Morbidity</strong> <strong>in</strong> <strong>Children</strong><br />
27
Table 2.6: Hospitalisations from all causes, by age group <strong>and</strong> ethnicity, 0–14-year-olds, 1995<br />
For children aged 1–4 years, respiratory conditions are the most common reason for hospitalisation.<br />
These conditions accounted for 26 percent <strong>of</strong> hospitalisations <strong>in</strong> this age group <strong>in</strong> 1995 (Figure<br />
2.7). Injury <strong>and</strong> poison<strong>in</strong>g was the second most common reason for hospitalisation.<br />
Figure 2.7: Major causes <strong>of</strong> hospitalisation <strong>of</strong> 1–4-year-olds, 1995<br />
Other<br />
causes 24%<br />
Respiratory<br />
conditions 26%<br />
Digestive system<br />
disorders 9%<br />
Infectious <strong>and</strong><br />
parasitic disorders<br />
9%<br />
Source <strong>of</strong> data:<br />
M<strong>in</strong>istry <strong>of</strong> <strong>Health</strong> 1998.<br />
Nervous system<br />
disorders 15%<br />
Injury <strong>and</strong><br />
poison<strong>in</strong>g 17%<br />
From age five years <strong>and</strong> older, more children are hospitalised due to an <strong>in</strong>jury or poison<strong>in</strong>g than<br />
for any other reason. In 1995, nearly one-quarter (24 percent) <strong>of</strong> hospitalisations for 5–9-year-olds<br />
<strong>and</strong> nearly one-third (31 percent) <strong>of</strong> hospitalisations for 10–14-year-olds were due to these causes<br />
(Figures 2.8 <strong>and</strong> 2.9).<br />
Figure 2.8: Major causes <strong>of</strong> hospitalisation <strong>of</strong> 5–9-year-olds, 1995<br />
Other<br />
causes 32%<br />
Injury <strong>and</strong><br />
poison<strong>in</strong>g 24%<br />
Symptoms* 5%<br />
Infectious <strong>and</strong><br />
parasitic disorders<br />
5%<br />
Nervous system<br />
disorders 16%<br />
Respiratory<br />
conditions 18%<br />
* Symptoms, signs, <strong>and</strong> ill-def<strong>in</strong>ed conditions (ICD-9 codes 780-799).<br />
Source <strong>of</strong> data:<br />
M<strong>in</strong>istry <strong>of</strong> <strong>Health</strong> 1998.<br />
<strong>Mortality</strong> <strong>and</strong> <strong>Morbidity</strong> <strong>in</strong> <strong>Children</strong><br />
29
Figure 2.9: Major causes <strong>of</strong> hospitalisation <strong>of</strong> 10–14-year-olds, 1995<br />
Other<br />
causes 30%<br />
Injury <strong>and</strong><br />
poison<strong>in</strong>g 31%<br />
Symptoms 8%<br />
Nervous system<br />
disorders 8%<br />
Source <strong>of</strong> data:<br />
M<strong>in</strong>istry <strong>of</strong> <strong>Health</strong> 1998.<br />
Digestive system<br />
disorders 9%<br />
Respiratory<br />
conditions 14%<br />
In 1995, respiratory conditions (<strong>in</strong>clud<strong>in</strong>g asthma, pneumonia, <strong>in</strong>fluenza, <strong>and</strong> bronchitis), were<br />
the second most common reason for the hospitalisation <strong>of</strong> children aged 5–14 years.<br />
Compared to non-Mäori, Mäori children have higher rates <strong>of</strong> hospitalisation for almost every<br />
group <strong>of</strong> conditions. The largest disparities between Mäori <strong>and</strong> non-Mäori hospitalisation rates<br />
are evident for nervous system conditions, respiratory conditions, <strong>and</strong> <strong>in</strong>juries <strong>and</strong> poison<strong>in</strong>gs.<br />
For each <strong>of</strong> these groups <strong>of</strong> causes, Mäori children are hospitalised at about twice the rate <strong>of</strong> non-<br />
Mäori children.<br />
Table 2.7: Major causes <strong>of</strong> hospitalisation, by ethnicity, 0–14-year-olds, 1995<br />
Cause Total Mäori Rate* Non-Mäori Rate* Relative<br />
No. No. No. risk for<br />
Mäori<br />
Respiratory conditions 20,709 5,613 5,244 15,096 2,089 2.5<br />
Injury <strong>and</strong> poison<strong>in</strong>g 15,492 3,348 3,128 12,144 1,680 1.9<br />
Per<strong>in</strong>atal conditions 15,907 3,107 2,903 12,800 1,771 1.6<br />
Nervous system diseases 10,848 2,700 2,522 8,148 1,127 2.2<br />
Digestive system disorders 8,279 1,735 1,621 6,544 906 1.8<br />
Symptoms** 6,931 1,375 1,285 5,556 769 1.7<br />
Infectious <strong>and</strong> parasitic<br />
diseases 6,829 1,343 1,255 5,486 759 1.7<br />
Congenital anomalies 5,712 1,113 1,040 4,599 636 1.6<br />
Genitour<strong>in</strong>ary disorders 3,019 459 429 2,560 354 1.2<br />
Musculoskeletal diseases 2,180 401 375 1,779 246 1.5<br />
All causes 111,571 24,259 22,660 87,312 12,080 1.9<br />
* Age-specific rate per 100,000 population.<br />
** Symptoms, signs, <strong>and</strong> ill-def<strong>in</strong>ed conditions (ICD-9 codes 780-799).<br />
Source <strong>of</strong> data:<br />
M<strong>in</strong>istry <strong>of</strong> <strong>Health</strong> 1998.<br />
Note:<br />
Columns do not sum to totals because totals <strong>in</strong>clude causes other than the ones shown.<br />
30 Our <strong>Children</strong>’s <strong>Health</strong>
Changes over time<br />
Changes <strong>in</strong> hospitalisation rates may be due to a number <strong>of</strong> factors <strong>in</strong>clud<strong>in</strong>g:<br />
• changes <strong>in</strong> hospital admission policy<br />
• changes <strong>in</strong> hospital record<strong>in</strong>g systems (for example, revised def<strong>in</strong>itions <strong>of</strong> daypatients <strong>and</strong><br />
outpatients)<br />
• changes <strong>in</strong> the case-mix <strong>of</strong> patients present<strong>in</strong>g for treatment (for example, more severe cases)<br />
• changes <strong>in</strong> the rate <strong>of</strong> disease <strong>in</strong> the community.<br />
Between 1988 <strong>and</strong> 1995, an <strong>in</strong>creas<strong>in</strong>g number <strong>of</strong> children aged 0–14 years were hospitalised. In<br />
1988, there were 77,817 childhood hospitalisations, ris<strong>in</strong>g to 111,571 <strong>in</strong> 1995 (Table 2.8). This<br />
translates to an average annual <strong>in</strong>crease <strong>in</strong> the childhood hospitalisation rate <strong>of</strong> 5 percent. The<br />
<strong>in</strong>fant hospitalisation rate <strong>in</strong>creased the most, with an overall <strong>in</strong>crease <strong>of</strong> 40 percent recorded<br />
between 1988 <strong>and</strong> 1995.<br />
Table 2.8: Increase <strong>in</strong> hospitalisation numbers <strong>and</strong> rates for 0–14-year-olds, 1988–95<br />
1988 1995 Total Annual<br />
<strong>in</strong>crease <strong>in</strong>crease<br />
AGE No. Rate* No. Rate*<br />
Figure 2.10: Total hospitalisation rates, by ethnicity, 0–14-year-olds, 1988–95<br />
Rate per 100,000 population<br />
25,000<br />
20,000<br />
15,000<br />
10,000<br />
5,000<br />
0<br />
1988 1989<br />
1990 1991 1992 1993 1994<br />
Year<br />
Total Maori Non-Maori<br />
1995<br />
Source <strong>of</strong> data:<br />
M<strong>in</strong>istry <strong>of</strong> <strong>Health</strong> 1998.<br />
International comparisons<br />
Under-five mortality<br />
The under-five mortality rate is a well-accepted <strong>in</strong>dicator <strong>of</strong> a country’s overall health status. New<br />
Zeal<strong>and</strong> ranks 15th out <strong>of</strong> the 21 OECD countries that have reliable child mortality data available<br />
for comparison (Figure 2.11). Sweden reported the lowest under-five mortality rate <strong>in</strong> 1995, with<br />
the United K<strong>in</strong>gdom <strong>and</strong> Australia ranked fourth <strong>and</strong> 10th respectively (UNICEF 1995).<br />
Figure 2.11: Under–5-year-old mortality rates, OECD countries<br />
Rate per 100,000 population<br />
12<br />
10<br />
8<br />
6<br />
4<br />
2<br />
0<br />
Portugal<br />
Greece<br />
Belgium<br />
USA<br />
Spa<strong>in</strong><br />
France<br />
New Zeal<strong>and</strong><br />
Italy<br />
Canada<br />
Netherl<strong>and</strong>s<br />
Norway<br />
Australia<br />
Irel<strong>and</strong><br />
Germany<br />
Austria<br />
Denmark<br />
Switzerl<strong>and</strong><br />
UK<br />
Japan<br />
F<strong>in</strong>l<strong>and</strong><br />
Sweden<br />
Source <strong>of</strong> data:<br />
UNICEF 1995.<br />
32 Our <strong>Children</strong>’s <strong>Health</strong>
New Zeal<strong>and</strong>’s <strong>in</strong>ternational rank<strong>in</strong>g <strong>in</strong> under-five mortality has worsened over the last 25 years.<br />
In 1960, New Zeal<strong>and</strong> ranked sixth out <strong>of</strong> 21 OECD countries with available data for this measure.<br />
Between 1960 <strong>and</strong> 1995, New Zeal<strong>and</strong> experienced the fifth lowest rate <strong>of</strong> change <strong>in</strong> under-five<br />
mortality out <strong>of</strong> these 21 OECD countries (Figure 2.12).<br />
Figure 2.12: Percentage fall <strong>in</strong> under–5-year-old mortality rates, OECD countries, 1960–95<br />
Percentage<br />
100<br />
90<br />
80<br />
70<br />
60<br />
50<br />
40<br />
30<br />
20<br />
10<br />
0<br />
Portugal<br />
Japan<br />
Greece<br />
Source <strong>of</strong> data:<br />
UNICEF 1995.<br />
Spa<strong>in</strong><br />
Italy<br />
Austria<br />
Germany<br />
F<strong>in</strong>l<strong>and</strong><br />
Irel<strong>and</strong><br />
Canada<br />
Sweden<br />
Switzerl<strong>and</strong><br />
UK<br />
France<br />
Denmark<br />
Belgium<br />
New Zeal<strong>and</strong><br />
USA<br />
Australia<br />
Norway<br />
Netherl<strong>and</strong>s<br />
References<br />
M<strong>in</strong>istry <strong>of</strong> <strong>Health</strong>. 1998. Unpublished data from the National M<strong>in</strong>imum Dataset, New Zeal<strong>and</strong><br />
<strong>Health</strong> Information Service. Well<strong>in</strong>gton: M<strong>in</strong>istry <strong>of</strong> <strong>Health</strong>.<br />
UNICEF. 1995. The State <strong>of</strong> the World’s <strong>Children</strong>. Oxford: Oxford University Press.<br />
<strong>Mortality</strong> <strong>and</strong> <strong>Morbidity</strong> <strong>in</strong> <strong>Children</strong><br />
33