Brand Success in Discounters - Business Insights
Brand Success in Discounters - Business Insights
Brand Success in Discounters - Business Insights

Create successful ePaper yourself
Turn your PDF publications into a flip-book with our unique Google optimized e-Paper software.
<strong>Brand</strong> <strong>Success</strong> <strong>in</strong> <strong>Discounters</strong><br />
Strategies for driv<strong>in</strong>g sales growth and<br />
new customer acquisition<br />
<strong>in</strong> association with...
1<br />
Bus<strong>in</strong>ess <strong>Insights</strong><br />
<strong>Brand</strong> <strong>Success</strong> <strong>in</strong> <strong>Discounters</strong><br />
Strategies for driv<strong>in</strong>g sales growth and new customer acquisition<br />
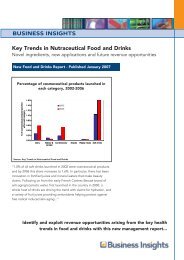
Lead<strong>in</strong>g discount fascias market share<br />
<strong>in</strong> the Netherlands<br />
% market share<br />
12<br />
10<br />
8<br />
6<br />
4<br />
2<br />
0<br />
2005<br />
Lidl<br />
The proliferation of private labels today<br />
Indulgent<br />
85.0%<br />
Rest of market<br />
2002<br />
89.7%<br />
Aldi<br />
Ethnic<br />
Luxury/Ultra<br />
premium<br />
Fair Trade<br />
Ethical<br />
Standard<br />
Value labels<br />
Organic<br />
Healthy<br />
Free-from<br />
Kids<br />
Health<br />
Cheap Lifestyle<br />
Source: <strong>Brand</strong> <strong>Success</strong> <strong>in</strong> <strong>Discounters</strong><br />
2002<br />
2005<br />
Aldi Lidl<br />
Source: <strong>Brand</strong> <strong>Success</strong> <strong>in</strong> <strong>Discounters</strong><br />
"Aldi had a significant market share <strong>in</strong> the Netherlands <strong>in</strong><br />
2005 of 10.2%, <strong>in</strong>creas<strong>in</strong>g from 8.2% <strong>in</strong> 2002. Lidl also<br />
experienced a significant <strong>in</strong>crease <strong>in</strong> market share between<br />
2002 and 2005, <strong>in</strong>creas<strong>in</strong>g from 2.1% to 4.7%. With such<br />
significant growth rates, the Netherlands obviously is an<br />
attractive market for discounters (and brand manufacturers<br />
that <strong>in</strong>tend to supply discounters)..."<br />
"S<strong>in</strong>ce the <strong>in</strong>itial response to the discounter threat of same<br />
or lower priced private labels, UK and European retailers<br />
have developed their private label portfolios extensively to<br />
<strong>in</strong>clude a number of l<strong>in</strong>es. The proliferation of l<strong>in</strong>es helps to<br />
build brand image and loyalty and improve marg<strong>in</strong>s, as well<br />
as allow<strong>in</strong>g supermarkets to become more competitive on<br />
price..."<br />
Exclusive gold standard data from over 80,000<br />
Europanel households and expert analysis from<br />
AiMark and Bus<strong>in</strong>ess <strong>Insights</strong>...<br />
S<strong>in</strong>ce 2002, discounters have added 7,000 stores and <strong>in</strong> Europe alone have seen total<br />
revenues rise to €78bn, creat<strong>in</strong>g both a threat and an opportunity for brand owners.<br />
<strong>Brand</strong> entry <strong>in</strong>to discounters offers manufacturers the chance to fight private label<br />
growth, acquire wholly new customers and benefit from the grow<strong>in</strong>g discounter channel.<br />
There are benefits for discounters too: a more attractive brand offer<strong>in</strong>g and a move away<br />
from pure price-based competition. But the key questions are what actually drives brand<br />
success <strong>in</strong> discounters? And what determ<strong>in</strong>es whether a brand list<strong>in</strong>g br<strong>in</strong>gs new<br />
customers or cannibalizes exist<strong>in</strong>g sales?<br />
<strong>Brand</strong> <strong>Success</strong> <strong>in</strong> <strong>Discounters</strong>: Strategies for driv<strong>in</strong>g sales growth and new customer<br />
acquisition is a new strategic report analyz<strong>in</strong>g the performance of over 300 brands <strong>in</strong><br />
discounters across five countries. The report identifies which types of brands show the<br />
highest growth, who benefits most - the retailer or the manufacturer, and what the<br />
optimum pric<strong>in</strong>g levels are. Us<strong>in</strong>g gold standard data from GfK and TNS' panel of 80,000<br />
households <strong>in</strong> France, Germany, Great Brita<strong>in</strong>, Spa<strong>in</strong> and The Netherlands, it provides the<br />
def<strong>in</strong>itive analysis of the factors driv<strong>in</strong>g brand success <strong>in</strong> discounters.<br />
This new report will provide you with:<br />
• Detailed, case-by-case data on performance of 300 brands listed <strong>in</strong> discounters<br />
across five key countries across France, Germany, Great Brita<strong>in</strong>, Spa<strong>in</strong> and and The<br />
Netherlands.<br />
• Quantification of the risk of cannibalization of sales for manufacturers and<br />
discounters.<br />
• An assessment of the brand opportunity us<strong>in</strong>g Aimark's proprietary model for<br />
forecast<strong>in</strong>g <strong>in</strong>cremental sales.<br />
• In-depth <strong>in</strong>sight <strong>in</strong>to the key drivers of brand sales <strong>in</strong> discounters and their impact<br />
on brand success and failure.<br />
• Actionable recommendations on the best product categories for brands to list,<br />
optimum pric<strong>in</strong>g levels and the best fit with different types of discounters.
<strong>Brand</strong> <strong>Success</strong> <strong>in</strong> <strong>Discounters</strong><br />
Strategies for driv<strong>in</strong>g sales growth and new customer acquisition<br />
Key f<strong>in</strong>d<strong>in</strong>gs of this new report:<br />
• In Europe the total discounter market for FMCG (CPG) <strong>in</strong> 2006 was €78<br />
billion. Discounter turnover is <strong>in</strong>creas<strong>in</strong>g <strong>in</strong> every European country and market<br />
share is also <strong>in</strong>creas<strong>in</strong>g <strong>in</strong> all European countries with the exception of Spa<strong>in</strong>.<br />
• The number of discounter stores has <strong>in</strong>creased around the world from<br />
28,000 <strong>in</strong> 2002 to 35,000 <strong>in</strong> 2007. Aldi and Lidl had 11,000 stores <strong>in</strong> Europe<br />
between them <strong>in</strong> 2002. This had <strong>in</strong>creased to 14,000 <strong>in</strong> 2005 and is forecast to<br />
grow further to 16,000 <strong>in</strong> the next three years.<br />
• Great Brita<strong>in</strong> has the lowest levels of cannibalization from the manufacturers<br />
perspective, with 84% of brands studied experienc<strong>in</strong>g cannibalization of under<br />
25%. This <strong>in</strong>dicates that list<strong>in</strong>g a brand at discounters <strong>in</strong> the country will allow a<br />
manufacturer to reach mostly new buyers.<br />
• <strong>Brand</strong>s with a large market share experience substantially more<br />
cannibalization than small brands for the manufacturer. Specifically, the<br />
average cannibalization rate <strong>in</strong> the group with the largest brands reaches 37%,<br />
mean<strong>in</strong>g that 63% of sales are derived new buyers of the brand.<br />
• Both suppliers and discounters can benefit from sell<strong>in</strong>g manufacturer brands<br />
at discount stores. However, manufacturers tend to experience much less<br />
cannibalization than discounters. On average, more than three quarters of brand<br />
revenues at discounters are not cannibalized, i.e. they come from buyers who<br />
have not purchased the brand before the list<strong>in</strong>g.<br />
This new report will enable you to:<br />
• Benchmark the performance of over 300 brands listed <strong>in</strong> discounters,<br />
<strong>in</strong>clud<strong>in</strong>g Gillette, Danone Actimel, Kit Kat and Stella across 17 product<br />
categories.<br />
• Forecast sales growth from list<strong>in</strong>g <strong>in</strong> discounters, the risk of cannibalization<br />
from customer migration and potential levels of customer acquisition.<br />
• Understand the key drivers of brand success <strong>in</strong> discounters and how they are<br />
<strong>in</strong>fluenced by type of brand, pric<strong>in</strong>g levels and discounter strategy.<br />
• Build effective arguments for brand list<strong>in</strong>g to fast track your entry <strong>in</strong>to the<br />
discount channel.<br />
• Plan an effective market<strong>in</strong>g strategy for list<strong>in</strong>g your brand, f<strong>in</strong>d<strong>in</strong>g the<br />
optimum pric<strong>in</strong>g level and the best retailer partner.<br />
Average price per volume unit (pence)<br />
0.40<br />
0.35<br />
0.30<br />
0.25<br />
0.20<br />
0.15<br />
0.10<br />
0.05<br />
0.00<br />
Source: <strong>Brand</strong> <strong>Success</strong> <strong>in</strong> <strong>Discounters</strong><br />
Bus<strong>in</strong>ess <strong>Insights</strong><br />
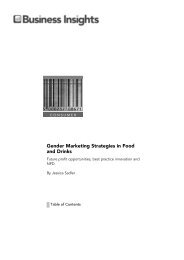
Price comparison of baked beans <strong>in</strong> lead<strong>in</strong>g<br />
ma<strong>in</strong>stream retailers and discounter <strong>in</strong> the UK,<br />
average price per volume unit, 2006<br />
Tesco Asda Aldi Lidl<br />
Source: <strong>Brand</strong> <strong>Success</strong> <strong>in</strong> <strong>Discounters</strong><br />
Kraft L<strong>in</strong>denberger - Leicht<br />
"Kraft has significantly benefited from list<strong>in</strong>g its hard<br />
cheese at Penny <strong>in</strong> Germany, experienc<strong>in</strong>g low levels of<br />
cannibalization and high <strong>in</strong>cremental sales. Kraft had a<br />
0.2% brand market share <strong>in</strong> the hard cheese category <strong>in</strong><br />
Germany one year before the list<strong>in</strong>g. One year after list<strong>in</strong>g<br />
at Penny, market share <strong>in</strong>creased to 0.3%..."<br />
2<br />
Total baked beans category<br />
<strong>Brand</strong>ed<br />
Standard PL<br />
Budget PL<br />
"The average price per volume unit of budget private label<br />
baked beans is similar across ma<strong>in</strong>stream retailers and hard<br />
discounters <strong>in</strong> the UK. However, discounters do not<br />
necessarily offer the lowest price. In fact, the average price<br />
per volume unit of budget private label baked beans <strong>in</strong><br />
Tesco and Asda is slightly lower at 0.16p, compared with<br />
0.17p at Aldi and Lidl. Tesco and Asda are also lower <strong>in</strong><br />
price per volume unit of budget private labels <strong>in</strong> diet<br />
lemonade and soft toilet rolls..."
3<br />
Bus<strong>in</strong>ess <strong>Insights</strong><br />
<strong>Brand</strong> <strong>Success</strong> <strong>in</strong> <strong>Discounters</strong><br />
Strategies for driv<strong>in</strong>g sales growth and new customer acquisition<br />
Levels of cannibalization<br />
Always brands launched by Procter & Gamble<br />
<strong>in</strong> Germany<br />
Source: <strong>Brand</strong> <strong>Success</strong> <strong>in</strong> <strong>Discounters</strong><br />
"Procter & Gamble experienced significant levels of<br />
cannibalization and relatively low <strong>in</strong>cremental sales after<br />
list<strong>in</strong>g the Always brand at Lidl <strong>in</strong> Germany, when<br />
compar<strong>in</strong>g it to the average of all brands studied. Always<br />
had a 47.7% brand market share <strong>in</strong> the sanitary pads<br />
category <strong>in</strong> Germany one year before the list<strong>in</strong>g. One year<br />
after list<strong>in</strong>g at Lidl, brand share <strong>in</strong>creased to 49.2%..."<br />
100%<br />
90%<br />
80%<br />
70%<br />
60%<br />
50%<br />
40%<br />
30%<br />
20%<br />
10%<br />
0%<br />
Levels of manufacturer cannibalization<br />
across key European countries<br />
>75%<br />
50-75%<br />
25-50%<br />
Bus<strong>in</strong>ess <strong>Insights</strong><br />
Table of contents<br />
<strong>Brand</strong> <strong>Success</strong> <strong>in</strong> <strong>Discounters</strong>: Strategies for driv<strong>in</strong>g sales growth and new customer acquisition<br />
EXECUTIVE SUMMARY<br />
CHAPTER 1: THE DISCOUNTER MARKET<br />
OVERVIEW<br />
• Discounter success formulae: the<br />
traditional perspective<br />
- Retail proposition of discounters<br />
- Hard and soft discount<strong>in</strong>g<br />
- The lead<strong>in</strong>g global discounters<br />
- Discounter market share<br />
- Penetration<br />
- Frequency<br />
- Spend<br />
- Discount fascias<br />
• Ma<strong>in</strong>stream retail counter strategies<br />
- Private label<br />
- Case study: the UK<br />
- Acquisition/launch of discount fascias<br />
• Discounter success formulae: a new era<br />
- Drivers of change<br />
- Case study: the evolution of Aldi and<br />
Lidl<br />
• Conclusions<br />
CHAPTER 2: OPPORTUNITIES AND<br />
BARRIERS OF LISTING BRANDS IN<br />
DISCOUNTERS<br />
• Coopetition: a feasible mode of existence?<br />
- Opportunities and barriers for the<br />
manufacturer<br />
- Opportunities of supply<strong>in</strong>g brands to<br />
discounters<br />
- Threats of supply<strong>in</strong>g brands to<br />
discounters<br />
- Opportunities and barriers for the<br />
discounter<br />
- Opportunities of add<strong>in</strong>g manufacturer<br />
brands to the product offer<br />
- Threats of add<strong>in</strong>g manufacturer brands<br />
to product offer<br />
- Conclusions<br />
• The study<br />
- Def<strong>in</strong><strong>in</strong>g success for a brand at a<br />
discounter<br />
- Key variables of <strong>in</strong>terest<br />
- The research approach<br />
CHAPTER 3: BRAND CANNIBALIZATION<br />
AND INCREMENTAL SALES: THE<br />
MANUFACTURER’S PERSPECTIVE<br />
• Results from the manufacturer’s<br />
perspective<br />
- Overview of cannibalization across the<br />
countries<br />
- Overview of <strong>in</strong>cremental sales levels<br />
across the countries<br />
- Country focus<br />
- France<br />
- Germany<br />
- Netherlands<br />
- Spa<strong>in</strong><br />
- Great Brita<strong>in</strong><br />
CHAPTER 4: BRAND CANNIBALIZATION<br />
AND INCREMENTAL SALES: THE<br />
DISCOUNTER’S PERSPECTIVE<br />
• Results from the discounter’s perspective<br />
- Overview of cannibalization across the<br />
countries<br />
- Overview of <strong>in</strong>cremental sales across<br />
the countries<br />
- Country focus<br />
- France<br />
- Germany<br />
- Netherlands<br />
- Spa<strong>in</strong><br />
- Great Brita<strong>in</strong><br />
CHAPTER 5: DRIVERS OF BRAND<br />
SUCCESS AT DISCOUNTERS<br />
• <strong>Brand</strong> strength<br />
- Why would brand strength matter?<br />
- Impact of brand strength on<br />
cannibalization and <strong>in</strong>cremental sales for<br />
the manufacturer<br />
- Impact of brand strength on<br />
cannibalization and <strong>in</strong>cremental sales for<br />
the discounter<br />
- Conclusions<br />
• Case studies: high market share brands<br />
- Danone yogurts <strong>in</strong> Lidl <strong>in</strong> Spa<strong>in</strong><br />
- Always sanitary protection pads <strong>in</strong> Lidl<br />
<strong>in</strong> Germany<br />
• Case study: low market share brand<br />
- Kraft hard cheese <strong>in</strong> Penny <strong>in</strong> Germany<br />
• Discounter category strength<br />
- Why would discounter category<br />
strength matter?<br />
- Impact of discounter category strength<br />
on cannibalization and <strong>in</strong>cremental sales<br />
for the manufacturer<br />
- Impact of discounter category strength<br />
on cannibalization and <strong>in</strong>cremental sales<br />
for the discounter<br />
- Conclusions<br />
• Case studies: high category market<br />
share discounters<br />
- Cuetara sweet biscuits <strong>in</strong> Plus <strong>in</strong> Spa<strong>in</strong><br />
- Mars Bar multi-countl<strong>in</strong>es <strong>in</strong> Kwik Save<br />
<strong>in</strong> Great Brita<strong>in</strong><br />
• Case studies: low category market share<br />
discounters<br />
- Gillette shav<strong>in</strong>g foam <strong>in</strong> Lidl <strong>in</strong><br />
Germany<br />
- Müller Vitality yogurt dr<strong>in</strong>ks <strong>in</strong> Netto <strong>in</strong><br />
Great Brita<strong>in</strong><br />
• Price levels<br />
- Why would the price premium over<br />
private labels matter?<br />
- Impact of price premium on<br />
cannibalization and <strong>in</strong>cremental sales for<br />
the manufacturer<br />
- Impact of price premium on<br />
cannibalization and <strong>in</strong>cremental sales for<br />
the discounter<br />
- Conclusions<br />
• Product type<br />
- Why would product type matter?<br />
- Perishable / non-perishable<br />
- Impulse / planned<br />
• Case study: a perishable brand<br />
- Müller Yogz Corner yogurts <strong>in</strong> Netto <strong>in</strong><br />
Great Brita<strong>in</strong><br />
• Case study: an impulse brand<br />
- Toblerone chocolate tablets <strong>in</strong> Lidl <strong>in</strong><br />
Germany<br />
• Case study: a planned and non-perishable<br />
brand<br />
- Carl<strong>in</strong>g beer <strong>in</strong> Netto <strong>in</strong> Great Brita<strong>in</strong><br />
CHAPTER 6: CONCLUSIONS<br />
• Summary<br />
• Introduction<br />
• Conclusions<br />
4
5<br />
Bus<strong>in</strong>ess <strong>Insights</strong><br />
Table of contents cont<strong>in</strong>ued...<br />
<strong>Brand</strong> <strong>Success</strong> <strong>in</strong> <strong>Discounters</strong>: Strategies for driv<strong>in</strong>g sales growth and new customer acquisition<br />
FIGURES AND TABLES<br />
• Hard and soft discounters<br />
• Global discount retailers ranked <strong>in</strong> terms of store numbers, 2005<br />
• Discount fascias of ma<strong>in</strong>stream retailers <strong>in</strong> Europe and the US<br />
• Advertis<strong>in</strong>g spend of ma<strong>in</strong>stream retailers and discounters <strong>in</strong> the<br />
UK, £m, 2001-2005<br />
• <strong>Discounters</strong> used <strong>in</strong> the study by country<br />
• Number of brand list<strong>in</strong>gs studied <strong>in</strong> each country<br />
• Manufacturer cannibalization<br />
- France<br />
- Germany<br />
- Netherlands<br />
- Spa<strong>in</strong><br />
- Great Brita<strong>in</strong><br />
• Manufacturer <strong>in</strong>cremental sales<br />
- France<br />
- Germany<br />
- Netherlands<br />
- Spa<strong>in</strong><br />
- Great Brita<strong>in</strong><br />
• Manufacturer cannibalization and <strong>in</strong>cremental sales<br />
- <strong>in</strong> Netto, Penny, Plus and Lidl <strong>in</strong> Germany<br />
- by category <strong>in</strong> Germany<br />
- <strong>in</strong> Dia <strong>in</strong> Spa<strong>in</strong><br />
- <strong>in</strong> Kwik Save and Netto <strong>in</strong> Great Brita<strong>in</strong><br />
- by category, <strong>in</strong> Great Brita<strong>in</strong><br />
• Retailer cannibalization<br />
- France<br />
- Germany<br />
- Netherlands<br />
- Spa<strong>in</strong><br />
- Great Brita<strong>in</strong><br />
• Retailer <strong>in</strong>cremental sales<br />
- France<br />
- Germany<br />
- Netherlands<br />
- Spa<strong>in</strong><br />
- Great Brita<strong>in</strong><br />
• Retailer cannibalization and <strong>in</strong>cremental sales<br />
- <strong>in</strong> Netto, Penny, Plus and Lidl <strong>in</strong> Germany<br />
- <strong>in</strong> Kwik Save and Netto <strong>in</strong> Great Brita<strong>in</strong><br />
- <strong>in</strong> Dia <strong>in</strong> Spa<strong>in</strong><br />
- by category, <strong>in</strong> Germany<br />
- by category, <strong>in</strong> Great Brita<strong>in</strong><br />
• Cannibalization and <strong>in</strong>cremental sales <strong>in</strong> Spa<strong>in</strong><br />
- <strong>in</strong> the yogurt category for Danone and Lidl<br />
- <strong>in</strong> the sweet biscuit category for Cuetara and Plus <strong>in</strong> Spa<strong>in</strong><br />
• Cannibalization and <strong>in</strong>cremental sales <strong>in</strong> Germany<br />
- <strong>in</strong> the sanitary protection pad category for Always and Lidl<br />
- <strong>in</strong> the hard cheese category for Kraft and Penny<br />
- <strong>in</strong> the shav<strong>in</strong>g foams category for Gillette and Lidl<br />
- <strong>in</strong> the chocolate tablets category for Toblerone and Lidl<br />
• Cannibalization and <strong>in</strong>cremental sales <strong>in</strong> Great Brita<strong>in</strong><br />
- <strong>in</strong> the multi-countl<strong>in</strong>es category for Mars Bar and Kwik Save<br />
- <strong>in</strong> the shav<strong>in</strong>g foams category for Müller Vitality and Netto<br />
- <strong>in</strong> the yogurt category for Müller Yogz Corner and Netto<br />
- <strong>in</strong> the low alcohol beer category for Carl<strong>in</strong>g and Netto<br />
• A variety of forces are push<strong>in</strong>g discounters to new strategies<br />
• Hard discounter market share, 2002 and 2005<br />
• Penetration of hard discounters, 2002 and 2005<br />
• Frequency of shopp<strong>in</strong>g at hard discounters, 2002 and 2005<br />
• Spend per shopper, (€), 2002 and 2005<br />
• Market share of lead<strong>in</strong>g discount fascias<br />
- <strong>in</strong> France, 2002 and 2005<br />
- <strong>in</strong> GB, 2004 and 2005<br />
- <strong>in</strong> Germany, 2002 and 2005<br />
- <strong>in</strong> the Netherlands, 2002 and 2005<br />
- <strong>in</strong> Spa<strong>in</strong>, 2002 and 2005<br />
• Ma<strong>in</strong> growth strategies of the lead<strong>in</strong>g discounters <strong>in</strong> 2007<br />
• Early Tesco Value advertis<strong>in</strong>g<br />
• The proliferation of private labels today<br />
• Tesco’s private label ranges<br />
• Price comparison <strong>in</strong> the UK, average price per volume unit, 2006<br />
- baked beans <strong>in</strong> lead<strong>in</strong>g ma<strong>in</strong>stream retailers and discounter<br />
- diet lemonade <strong>in</strong> lead<strong>in</strong>g ma<strong>in</strong>stream retailers and discounter<br />
- soft toilet rolls <strong>in</strong> lead<strong>in</strong>g ma<strong>in</strong>stream retailers and discounter<br />
• Premium l<strong>in</strong>es at Aldi and Lidl<br />
• Italian private label ranges<br />
• Fresh produce at Aldi and Lidl<br />
• Lidl’s private label organic and Fair Trade l<strong>in</strong>es<br />
• Transfair logo on Lidl’s FairGlobe products<br />
• Non-food <strong>in</strong> Aldi and Lidl<br />
• Lidl’s promotion of brands <strong>in</strong> store<br />
• New and old Aldi advertis<strong>in</strong>g <strong>in</strong> the UK<br />
• Key categories at Aldi and Lidl <strong>in</strong> 5 key countries, 2003-2005<br />
- percentage po<strong>in</strong>t change <strong>in</strong> the share of total spend<br />
- percentage po<strong>in</strong>t change <strong>in</strong> penetration<br />
• Average manufacturer cannibalization and <strong>in</strong>cremental sales<br />
- effect of perishable or non-perishable brands<br />
- effect of impulse or planned brands<br />
- effect of brand market share<br />
- effect of discounter category market share<br />
- effect of price premium over private label<br />
• Average retailer cannibalization and <strong>in</strong>cremental sales<br />
- effect of perishable or non-perishable brands<br />
- effect of impulse or planned brands<br />
- effect of brand market share<br />
- effect of discounter category market share<br />
- effect of price premium over private label<br />
• Müller Little Stars yogurts launched <strong>in</strong> GB<br />
• Toblerone Pral<strong>in</strong>es<br />
• Carl<strong>in</strong>g C2 Beer<br />
• Yogurt brands launched by Danone <strong>in</strong> Spa<strong>in</strong><br />
• Lidl organic yogurt<br />
• Always brands launched by Procter & Gamble <strong>in</strong> Germany<br />
• Kraft L<strong>in</strong>denberger - Leicht<br />
• Cuetara Mas Sanas Biscuits<br />
• Mars Delight<br />
• Gillette brands launched by Procter & Gamble <strong>in</strong> Germany<br />
• Müller Vitality products launched <strong>in</strong> GB<br />
• Four sources of brand sales at discounters<br />
• Factors that drive brand success at discounters<br />
• Factors that might impact the success of manufacturer brand<br />
list<strong>in</strong>gs at discounters
Sample Information<br />
Chapter 5: Drivers of brand success at discounters<br />
Why would brand strength matter?<br />
This report looks at the brand's market share (as it turned out to be a significant predictor and its level is usually well-known to<br />
management) to understand how brand strength is related to a brand's cannibalization levels and <strong>in</strong>cremental sales, from the<br />
manufacturer and discounter perspective respectively. For each of these analyses all cases were first sorted based on the criterion<br />
market share and then split <strong>in</strong>to four equally sized groups (thus each compris<strong>in</strong>g of about 93 brands). The top group conta<strong>in</strong>s the<br />
largest brands <strong>in</strong> our sample, whereas the bottom group conta<strong>in</strong>s the smallest brands.<br />
By compar<strong>in</strong>g average levels of cannibalization and <strong>in</strong>cremental sales for each group one can evaluate whether the market share of a<br />
brand has an impact on these measures or not. Assume that <strong>in</strong> each group the cannibalization rates were identical; then it could be<br />
assumed that brand strength does not have an impact on cannibalization.<br />
Impact of brand strength on cannibalization and <strong>in</strong>cremental sales for the manufacturer<br />
Compar<strong>in</strong>g the degree of manufacturer cannibalization <strong>in</strong> the four groups shows a very consistent pattern. Large brands experience<br />
substantially more cannibalization than small brands. Specifically, the average cannibalization rate <strong>in</strong> the group with the largest<br />
brands reached 37%, mean<strong>in</strong>g that 63% of the sales came from new buyers of the brand, but 37% of sales were generated by<br />
exist<strong>in</strong>g brand buyers. This figure dropped to s<strong>in</strong>gle-digits <strong>in</strong> the groups with small brand market shares, where by def<strong>in</strong>ition few<br />
current buyers exist - therefore most of the sales at the discounter will be generated by new brand buyers. However, given the size<br />
of these brands, one wonders whether they are attractive enough to new buyers to generate much <strong>in</strong> terms of <strong>in</strong>cremental sales.<br />
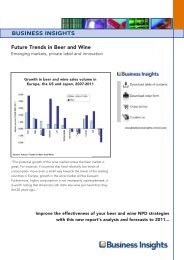
Figure 5.45 shows a consistent pattern with<br />
respect to <strong>in</strong>cremental sales as well: small<br />
brands (23% and 30% respectively of the<br />
two groups) ga<strong>in</strong>ed substantially more <strong>in</strong><br />
<strong>in</strong>cremental sales than large brands. This is<br />
not surpris<strong>in</strong>g because:<br />
• A higher percentage of sales come from<br />
new buyers and cannibalized sales<br />
obviously do not help;<br />
• But more importantly these brands are<br />
very small and their growth starts at a<br />
very low basel<strong>in</strong>e.<br />
One can imag<strong>in</strong>e that a brand with a small<br />
market share can only ga<strong>in</strong> when listed at a<br />
discounter: its exposure to potential buyers<br />
multiplies, the danger of cannibalization is<br />
very low, and current retail partners will be<br />
less concerned about the availability of the<br />
brand <strong>in</strong> the discount channel given its size.<br />
However, one must also take <strong>in</strong>to<br />
consideration that a 2% <strong>in</strong>crease may be a<br />
considerable success for manufacturers of<br />
small brands.<br />
% of cannibalization & <strong>in</strong>cremental sales<br />
40%<br />
35%<br />
30%<br />
25%<br />
20%<br />
15%<br />
10%<br />
5%<br />
0%<br />
Average manufacturer manufacturer cannibalization<br />
cannibalization<br />
Average manufacturer <strong>in</strong>cremental sales<br />
Bus<strong>in</strong>ess <strong>Insights</strong><br />
Figure 5.45: Average manufacturer cannibalization and <strong>in</strong>cremental<br />
sales - effect of brand market share<br />
Top quartile * Second** Third quartile*** Bottom****<br />
quartile<br />
<strong>Brand</strong> market share<br />
quartile<br />
Large brands, <strong>in</strong> contrast, face the opposite Source: Europanel<br />
situation: they have to grow from an<br />
already large basel<strong>in</strong>e, most likely their<br />
distribution coverage before the list<strong>in</strong>g was high already, <strong>in</strong>creas<strong>in</strong>g the odds that exist<strong>in</strong>g buyers switch channels and contribute to<br />
cannibalization (but not to <strong>in</strong>cremental sales) and that exist<strong>in</strong>g partners will be unhappy. However, given the average level of<br />
<strong>in</strong>cremental sales of 7% for the biggest brand <strong>in</strong> our study, brand managers may be quite will<strong>in</strong>g to face these issues.<br />
37%<br />
7%<br />
15% 17%<br />
15% 17%<br />
9%<br />
23%<br />
Note:<br />
*Top quartile = brands with a market share between 1.9-52%.<br />
**Second quartile = brands with a market share between 0.4-1.9%.<br />
***Third quartile = brands with a market share between 0.1-0.4%.<br />
****Bottom quartile = brands with a market share less than 0.1%.<br />
2%<br />
30%<br />
Cannibalization refers to the percentage of brand sales at the discounter to people who have<br />
purchased the brand at ma<strong>in</strong>stream retailers <strong>in</strong> the year before.<br />
Incremental sales are the sales of to new buyers (those that are not cannibalized), relative to the<br />
total brand sales the year before.<br />
6
About Bus<strong>in</strong>ess <strong>Insights</strong><br />
Bus<strong>in</strong>ess <strong>Insights</strong> appreciate the importance of accurate, up-to-date <strong>in</strong>cisive<br />
market and company analysis and our aim therefore is to provide a s<strong>in</strong>gle,<br />
off-the-shelf, objective source of data, analysis and market <strong>in</strong>sight.<br />
www.globalbus<strong>in</strong>ess<strong>in</strong>sights.com<br />
Recipient details (If different from Payor)<br />
Title: Mr/Mrs/Ms (Please use BLOCK CAPITALS)<br />
First Name: Last Name:<br />
Email<br />
I would like to order the follow<strong>in</strong>g report(s)... 1<br />
(Please use BLOCK CAPITALS)<br />
1.____________________________________________________<br />
2.____________________________________________________<br />
3.____________________________________________________<br />
Order<strong>in</strong>g Multiple reports:<br />
Multiple report discounts<br />
Job Title<br />
Department<br />
Address<br />
City State/Prov<strong>in</strong>ce<br />
Country Post Code/ZIP<br />
Tel Fax<br />
�<br />
�<br />
�<br />
Hard Copy<br />
Please fill out recipient derails below if you wish<br />
to order a pr<strong>in</strong>ted version of your report(s).<br />
- Add £50/€75/$95per report<br />
- Please allow 28 days for delivery<br />
�<br />
Enter total price below<br />
1 report ___________________________<br />
2 reports - save 15% ___________________________<br />
3 reports - save 20% ___________________________<br />
1. Price is for a ‘S<strong>in</strong>gle User’ licence<br />
2. Discount applied to sum of total list price. Cannot be used <strong>in</strong> conjunction with other offers.<br />
3. Contact market<strong>in</strong>g@globalbus<strong>in</strong>ess<strong>in</strong>sights.com for more <strong>in</strong>formation on regional/global licences<br />
‘Interactive’ Version<br />
A new, <strong>in</strong>novative way to view our publications<br />
Customize, search, translate, contrast,<br />
manipulate and extract report content.<br />
- Add £50/€75/$95per report<br />
Communications Feedback<br />
Please let us know if any of the follow<strong>in</strong>g factors <strong>in</strong>fluenced your purchase...<br />
Email/Fax/Postal promotion Trade Press<br />
Brochure<br />
My Account Manager<br />
Table of Contents<br />
Conference materials<br />
Colleague Recommendation Website/web search<br />
2<br />
FAX BACK TO:<br />
+44 (0) 207 900 6688<br />
Company details 3<br />
Company name: ________________________________________________________<br />
EU companies (except UK) must supply VAT / BTW / MOMS / MWST / IVA / FPA number:<br />
_____________________________________________________________________________________________<br />
Purchase Order Number (if required)_____________________________________<br />
Payment method<br />
Please <strong>in</strong>dicate your preferred currency: GB£ EUR� US$<br />
Total order value is ____________________________<br />
I will forward a check payable to Bus<strong>in</strong>ess <strong>Insights</strong> Limited.<br />
Please <strong>in</strong>voice my company (please complete <strong>in</strong>voice address below)<br />
I would like to pay by bank transfer (email address required)<br />
Debit my credit/charge card: Amex Visa Mastercard<br />
Card No________________________________________________________________________<br />
Expiry Date _________ / _________ Signature ______________________________<br />
Title: Mr/Mrs/Ms (Please use BLOCK CAPITALS)<br />
First Name: Last Name:<br />
Email<br />
Job Title<br />
Department<br />
Address<br />
City State/Prov<strong>in</strong>ce<br />
Country Post Code/ZIP<br />
Tel<br />
Fax<br />
Payor details 5<br />
Sign here to confirm your order:<br />
or scan and e-mail to<br />
market<strong>in</strong>g@globalbus<strong>in</strong>ess<strong>in</strong>sights.com<br />
ORDERS WITHOUT A SIGNATURE CANNOT BE PROCESSED<br />
4