Long-Term National Trends in Outdoor Recreation Activity ...
Long-Term National Trends in Outdoor Recreation Activity ...
Long-Term National Trends in Outdoor Recreation Activity ...

You also want an ePaper? Increase the reach of your titles
YUMPU automatically turns print PDFs into web optimized ePapers that Google loves.
*****************************************************<br />
IRIS<br />
Internet Research<br />
Information Series<br />
*****************************************************<br />
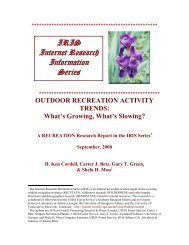
<strong>Long</strong>-<strong>Term</strong> <strong>National</strong> <strong>Trends</strong> <strong>in</strong><br />
<strong>Outdoor</strong> <strong>Recreation</strong> <strong>Activity</strong><br />
Participation---1980 to Now<br />
A RECREATION Research Report <strong>in</strong> the IRIS Series 1<br />
May, 2009<br />
H. Ken Cordell 2 , Gary T. Green 3 and Carter J. Betz<br />
1 The Internet Research Information Series (IRIS) is an <strong>in</strong>ternet accessible science report series cover<strong>in</strong>g<br />
outdoor recreation statistics (RECSTATS), wilderness research (WILDERNESS) and other humandimension<br />
and demographics research (DEMOSTATS) related to natural resources. This research is a<br />
collaborative effort between the USDA Forest Service’s Southern Research Station and its Forestry<br />
Sciences Laboratory <strong>in</strong> Athens, Georgia; the University of Georgia <strong>in</strong> Athens; and the University of<br />
Tennessee <strong>in</strong> Knoxville, Tennessee. http://warnell.forestry.uga.edu/nrrt/nsre/IrisReports.html<br />
2 The authors are H. Ken Cordell, Pioneer<strong>in</strong>g Scientist, and Carter J. Betz, <strong>Outdoor</strong> <strong>Recreation</strong> Planner,<br />
USDA Forest Service, Athens, GA. Iris photo is courtesy of Jessica Mou.<br />
3 Gary T. Green is Assistant Professor, University of Georgia, Athens, GA.
<strong>Long</strong>-<strong>Term</strong> <strong>National</strong> <strong>Trends</strong> from the 1980s to Now<br />
The NSRE.—Nationwide <strong>Recreation</strong> Surveys (NRS) were conducted <strong>in</strong> the United States <strong>in</strong><br />
1960, 1965 and <strong>in</strong> 1982-83 (USDI 1986). Results from those surveys have provided the<br />
opportunity to view trends <strong>in</strong> American’s outdoor recreation activity participation because the<br />
survey data were collected <strong>in</strong> a consistent way over those years. In 1994 the name of the<br />
Nationwide <strong>Recreation</strong> Survey was changed to the <strong>National</strong> Survey on <strong>Recreation</strong> and the<br />
Environment (NSRE). <strong>Recreation</strong> activity participation data has cont<strong>in</strong>ued to be collected <strong>in</strong> a<br />
consistent and comparable way as was done with the former Nationwide <strong>Recreation</strong> Survey (the<br />
way questions are worded, etc.). Thus, by compar<strong>in</strong>g participation estimates between the NRS<br />
and the NSRE, we are able to track trends up to the present time.<br />
For this paper we start with the 1982-83 NRS. The list<strong>in</strong>g of activities <strong>in</strong> that earlier survey was<br />
much shorter than is found <strong>in</strong> the current NSRE. As well, some activity def<strong>in</strong>itional changes<br />
have occurred, often because of new activities people have taken up, or because of the<br />
emergence of components of a former activity group<strong>in</strong>g as major activities <strong>in</strong> themselves. A<br />
good example of the latter is the activity called “Bird watch<strong>in</strong>g and other nature study activities”<br />
<strong>in</strong> the 1982-83 NRS, which now has been split <strong>in</strong>to bird watch<strong>in</strong>g, wildlife view<strong>in</strong>g, and other<br />
nature activities.<br />
F<strong>in</strong>d<strong>in</strong>gs.—Table 1 shows percentages of the U. S. population and number of participants <strong>in</strong> 33<br />
outdoor recreation activities which could be compared over time (start<strong>in</strong>g <strong>in</strong> 1982-83). These<br />
activities are <strong>in</strong> descend<strong>in</strong>g order accord<strong>in</strong>g to change <strong>in</strong> total number of participants (shown <strong>in</strong><br />
the last column of the table). These statistics are for the U.S. population 16 or older. The<br />
population numbers from the 1982-83 survey were for people 12 or older, but were adjusted to<br />
be comparable with the more recent surveys by reduc<strong>in</strong>g estimates of number of participants<br />
proportionate to the number of people between 12 and 15 years old from the 1982-83 NRS.<br />
At the top of the list, as it typically has been over the years, is the activity of walk<strong>in</strong>g outdoors.<br />
Both the percentage of population and number of participants have steadily <strong>in</strong>creased over time<br />
s<strong>in</strong>ce 1982-83. Follow<strong>in</strong>g <strong>in</strong> terms of growth of number of participants is view<strong>in</strong>g or<br />
photograph<strong>in</strong>g wild birds, attend<strong>in</strong>g outdoor sports events, day hik<strong>in</strong>g, attend<strong>in</strong>g outdoor<br />
concerts/plays/other events, and visit<strong>in</strong>g outdoor nature centers. The next activities <strong>in</strong> terms of<br />
growth of number of participants are swimm<strong>in</strong>g <strong>in</strong> natural waters, sightsee<strong>in</strong>g, bicycl<strong>in</strong>g, runn<strong>in</strong>g<br />
or jogg<strong>in</strong>g and picnick<strong>in</strong>g. The next three activities <strong>in</strong>volve use of motors and <strong>in</strong>clude boat<strong>in</strong>g,<br />
driv<strong>in</strong>g for pleasure, and driv<strong>in</strong>g off road. Four activities decl<strong>in</strong>ed between 1982-83 and 2005-<br />
09---tennis, ice skat<strong>in</strong>g, cross-country ski<strong>in</strong>g, and snowmobil<strong>in</strong>g.<br />
As with all social phenomena, there are cycles. Cycles can be driven by economic conditions,<br />
technology changes, population growth, cultural evolution, and other changes. This can be seen<br />
<strong>in</strong> long-term trend <strong>in</strong> hunt<strong>in</strong>g and fish<strong>in</strong>g, which now shows short-term decl<strong>in</strong>es <strong>in</strong> some forms of<br />
these activities. Where these activities were once viewed as the primary recreational pursuits,<br />
now view<strong>in</strong>g and photograph<strong>in</strong>g birds has become the fastest long-term grow<strong>in</strong>g activity,<br />
grow<strong>in</strong>g 287 percent s<strong>in</strong>ce 1982-83 and hav<strong>in</strong>g more participants now than both hunt<strong>in</strong>g and<br />
fish<strong>in</strong>g comb<strong>in</strong>ed. Next fastest grow<strong>in</strong>g <strong>in</strong> terms of percentage <strong>in</strong>crease is day hik<strong>in</strong>g at almost<br />
210 percent s<strong>in</strong>ce 1982-83. The next four fastest percentage growth activities <strong>in</strong>clude<br />
1
ackpack<strong>in</strong>g (+161%), off-road motor vehicle driv<strong>in</strong>g (+142%), walk<strong>in</strong>g outdoors (+111%), and<br />
canoe<strong>in</strong>g/kayak<strong>in</strong>g (+106%).<br />
Table 1.—<strong>Trends</strong> <strong>in</strong> percentage of population and number participat<strong>in</strong>g <strong>in</strong> 33 outdoor<br />
recreation activities by activity and period <strong>in</strong> the U.S.<br />
1982-1983 1994-1995 1999-2001 2005-2009 Trend<br />
<strong>Activity</strong><br />
Walk for<br />
pleasure<br />
View/<br />
photograph<br />
birds<br />
Attend outdoor<br />
sports events<br />
Percent<br />
of<br />
population<br />
participat<strong>in</strong>g<br />
Total<br />
participants<br />
(millions)<br />
Percent<br />
participat<strong>in</strong>g<br />
Total<br />
participants<br />
(millions)<br />
Percent<br />
participat<strong>in</strong>g<br />
Total<br />
participants<br />
(millions)<br />
Percent<br />
participat<strong>in</strong>g<br />
Total<br />
participants<br />
(millions)<br />
Percent<br />
change <strong>in</strong><br />
participants,<br />
1982-1983<br />
to<br />
2005-2009<br />
Change <strong>in</strong><br />
number<br />
of participants<br />
(millions),<br />
'82-'83 to<br />
'05-'09<br />
53.0 91.9 68.8 138.5 82.4 176.4 84.1 194.2 111.3 102.3<br />
12.0 20.8 27.0 54.3 31.8 68.0 34.9 80.5 287.0 59.7<br />
40.0 69.4 49.0 98.6 50.8 108.7 52.4 121.0 74.4 51.6<br />
Day hik<strong>in</strong>g 14.0 24.3 26.6 53.6 32.4 69.3 32.6 75.3 209.9 51.0<br />
<strong>Outdoor</strong><br />
concerts, plays,<br />
etc.<br />
Visit nature<br />
centers, etc.<br />
Swimm<strong>in</strong>g <strong>in</strong><br />
lakes, streams,<br />
etc.<br />
25.0 43.4 35.2 70.9 40.9 87.6 36.5 84.3 94.2 40.9<br />
50.0 86.7 55.1 110.9 56.7 121.3 55.1 127.2 46.7 40.5<br />
32.0 55.5 43.4 87.4 41.4 88.6 40.7 94.0 69.4 38.5<br />
Sightsee<strong>in</strong>g 46.0 79.8 58.4 117.5 50.8 108.7 50.5 116.6 46.1 36.8<br />
Bicycl<strong>in</strong>g 32.0 55.5 38.7 77.8 39.6 84.7 39.2 90.4 62.9 34.9<br />
Runn<strong>in</strong>g or<br />
jogg<strong>in</strong>g<br />
26.0 45.1 28.2 56.7 32.9 70.5 34.5 79.6 76.5 34.5<br />
Picnick<strong>in</strong>g 48.0 83.3 55.7 112.1 54.9 117.5 50.9 117.5 41.1 34.2<br />
Boat<strong>in</strong>g 28.0 48.6 37.8 76.2 36.3 77.6 35.6 82.1 68.9 33.5<br />
Driv<strong>in</strong>g for<br />
pleasure<br />
48.0 83.3 . . 50.3 107.7 48.8 112.7 35.3 29.4<br />
Drive off-road 11.0 19.1 17.8 35.9 17.4 37.3 20.0 46.2 141.9 27.1<br />
Developed<br />
camp<strong>in</strong>g<br />
Swimm<strong>in</strong>g <strong>in</strong> an<br />
outdoor pool<br />
17.0 29.5 23.1 46.5 26.4 56.5 24.1 55.7 88.8 26.2<br />
43.0 74.6 49.2 99.1 41.7 89.1 43.1 99.5 33.4 24.9<br />
Motorboat<strong>in</strong>g 19.0 33.0 29.6 59.5 24.3 52.1 23.3 53.8 63.0 20.8<br />
<strong>Outdoor</strong> team<br />
sports<br />
24.0 41.6 29.1 58.6 22.9 48.9 26.9 62.1 49.3 20.5<br />
2
<strong>Activity</strong><br />
Percent<br />
of<br />
population<br />
participat<strong>in</strong>g<br />
1982-1983 1994-1995 1999-2001 2005-2009 Trend<br />
Total<br />
participants<br />
(millions)<br />
Percent<br />
participat<strong>in</strong>g<br />
Total<br />
participants<br />
(millions)<br />
Percent<br />
participat<strong>in</strong>g<br />
Total<br />
participants<br />
(millions)<br />
Percent<br />
participat<strong>in</strong>g<br />
Total<br />
participants<br />
(millions)<br />
Percent<br />
change <strong>in</strong><br />
participants,<br />
1982-1983<br />
to<br />
2005-2009<br />
Change <strong>in</strong><br />
number<br />
of participants<br />
(millions),<br />
'82-'83 to<br />
'05-'09<br />
Fish<strong>in</strong>g 34.0 59.0 35.0 70.4 34.2 73.1 33.8 78.0 32.2 19.0<br />
Primitive<br />
camp<strong>in</strong>g<br />
Canoe<strong>in</strong>g or<br />
kayak<strong>in</strong>g<br />
10.0 17.3 15.6 31.4 15.9 34.0 14.2 32.8 89.6 15.5<br />
8.0 13.9 9.5 19.2 11.5 24.6 12.4 28.6 105.8 14.7<br />
Backpack<strong>in</strong>g 5.0 8.7 8.4 17.0 10.4 22.2 9.8 22.7 160.9 14.0<br />
Golf 13.0 22.6 17.3 34.9 16.7 35.8 14.3 33.1 46.5 10.5<br />
Sledd<strong>in</strong>g 10.0 17.3 13.7 27.7 15.1 32.3 11.6 26.8 54.9 9.5<br />
Horseback<br />
rid<strong>in</strong>g<br />
9.0 15.6 10.3 20.7 9.7 20.7 9.7 22.4 43.6 6.8<br />
Hunt<strong>in</strong>g 12.0 20.8 12.5 25.3 11.1 23.9 11.5 26.6 27.9 5.8<br />
Downhill ski<strong>in</strong>g 6.0 10.4 11.3 22.8 8.6 18.3 6.4 14.8 42.3 4.4<br />
Waterski<strong>in</strong>g 9.0 15.6 11.3 22.7 8.0 17.1 8.3 19.2 23.1 3.6<br />
Snowmobil<strong>in</strong>g 3.0 5.2 4.8 9.6 5.5 11.8 3.8 8.7 67.3 3.5<br />
Sail<strong>in</strong>g 6.0 10.4 6.0 12.1 5.1 10.9 4.5 10.3 -1.0 -0.1<br />
Cross country<br />
ski<strong>in</strong>g<br />
Ice skat<strong>in</strong>g<br />
outdoors<br />
3.0 5.2 4.4 8.8 3.8 8.2 2.1 4.9 -5.8 -0.3<br />
6.0 10.4 7.1 14.2 6.7 14.3 4.2 9.6 -7.7 -0.8<br />
Tennis outdoors 17.0 29.5 14.0 28.2 10.5 22.5 9.7 22.3 -24.4 -7.2<br />
(Source: <strong>National</strong> Survey on <strong>Recreation</strong> and the Environment, USDA Forest Service and University of Georgia,<br />
Athens GA. Participation numbers and percentages reflect the population numbers estimated by the Bureau of<br />
Census for the years shown.)<br />
Table 2 provides estimates of the number of days on which activity participants did each activity<br />
as reported <strong>in</strong> the 1982-83 Nationwide <strong>Recreation</strong> Survey and <strong>in</strong> the 2005-09 NSRE. <strong>Trends</strong> <strong>in</strong><br />
annual activity days are provided for those activities which appeared <strong>in</strong> Table 7 of the 1982-1983<br />
NRS report (USDI 1986), and for which annual days was also asked <strong>in</strong> NSRE 2005-09. Annual<br />
activity days for sports-related activities, such as golf and tennis, were not asked <strong>in</strong> the 2005-09<br />
survey.<br />
Activities listed <strong>in</strong> Table 2 are ordered <strong>in</strong> descend<strong>in</strong>g order by percent report<strong>in</strong>g more than 25<br />
days of participation <strong>in</strong> 2005-09. Apparent changes for each activity are highlighted <strong>in</strong> yellow.<br />
For bird<strong>in</strong>g, pool swimm<strong>in</strong>g, motor boat<strong>in</strong>g, and developed camp<strong>in</strong>g, the percentages of<br />
participants by number of days of participation were pretty much consistent from the early 1980s<br />
to now (2005-09). For day hik<strong>in</strong>g and backpack<strong>in</strong>g, there was an <strong>in</strong>crease <strong>in</strong> percentages of<br />
3
activity participants spend<strong>in</strong>g more days per year participat<strong>in</strong>g. The same was true for driv<strong>in</strong>g<br />
motor vehicles off road, horseback rid<strong>in</strong>g on trails, sail<strong>in</strong>g, primitive camp<strong>in</strong>g, and cross country<br />
ski<strong>in</strong>g. For Snowmobil<strong>in</strong>g, there was an <strong>in</strong>crease <strong>in</strong> percentage spend<strong>in</strong>g 3 to 10 days and slight<br />
decreases <strong>in</strong> all the other categories of number of days.<br />
Table 2.—Trend <strong>in</strong> percent of population 16 and older report<strong>in</strong>g number of days of<br />
participation by activity for the U.S., 1982-83 and 2005-09<br />
More than 25<br />
1 to 2 days 3 to 10 days 11 to 25 days days<br />
<strong>Activity</strong><br />
'82-'83 '05-'09 '82-'83 '05-'09 '82-'83 '05-'09 '82-'83 '05-'09<br />
View or photograph birds 15 13 29 31 14 12 42 44<br />
Swimm<strong>in</strong>g <strong>in</strong> outdoor pool 14 11 38 38 19 21 29 30<br />
Drive off-road 23 23 39 38 21 16 17 24<br />
Day hik<strong>in</strong>g 28 19 47 44 14 17 12 20<br />
Horseback rid<strong>in</strong>g on trails 47 41 27 34 8 10 17 16<br />
Motorboat<strong>in</strong>g 33 30 39 40 17 16 12 14<br />
Swimm<strong>in</strong>g <strong>in</strong> lakes, ponds, etc 19 18 42 50 20 19 19 14<br />
Backpack<strong>in</strong>g 39 28 47 46 9 15 6 10<br />
Snowmobil<strong>in</strong>g 40 39 36 42 14 10 10 8<br />
Sail<strong>in</strong>g 56 43 30 43 6 8 8 6<br />
Developed camp<strong>in</strong>g 26 28 51 52 16 14 7 6<br />
Canoe<strong>in</strong>g or kayak<strong>in</strong>g 51 44 39 42 8 9 3 5<br />
Primitive camp<strong>in</strong>g 36 29 47 52 12 14 6 5<br />
Downhill ski<strong>in</strong>g 34 35 44 52 16 11 7 3<br />
Cross country ski<strong>in</strong>g 51 43 35 42 10 12 4 3<br />
(Source: <strong>National</strong> Survey on <strong>Recreation</strong> and the Environment, USDA Forest Service and University of Georgia,<br />
Athens GA. Participation numbers and percentages reflect the population numbers estimated by the Bureau of<br />
Census for the years shown.)<br />
Reference<br />
USDI <strong>National</strong> Park Service. 1986. 1982-83 Nationwide <strong>Recreation</strong> Survey. U.S. Government<br />
Pr<strong>in</strong>t<strong>in</strong>g Office publication 1986-491-070/40078. Retrieved on May 12, 2009, from<br />
http://warnell.forestry.uga.edu/nrrt/nsre/Nsre/nsre8283.html<br />
Return to the IRIS Reports Ma<strong>in</strong> Menu --<br />
http://warnell.forestry.uga.edu/nrrt/nsre/IrisReports.html<br />
4