Outdoor Recreation Activity Trends - University of Georgia
Outdoor Recreation Activity Trends - University of Georgia
Outdoor Recreation Activity Trends - University of Georgia

Create successful ePaper yourself
Turn your PDF publications into a flip-book with our unique Google optimized e-Paper software.
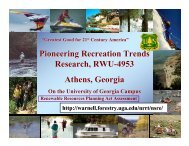
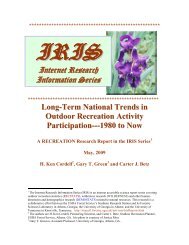
***************************************************IRISInternet ResearchInformationSeries*************************************************OUTDOOR RECREATION ACTIVITYTRENDS:What’s Growing, What’s Slowing?A RECREATION Research Report in the IRIS Series 1September, 2008H. Ken Cordell, Carter J. Betz, Gary T. Green,& Shela H. Mou 21 The Internet Research Information Series (IRIS) is an internet accessible science report series coveringoutdoor recreation statistics (RECSTATS), wilderness research (WILDERNESS) and other humandimensionand demographics research (DEMOSTATS) related to natural resources. This research is acollaborative effort between the USDA Forest Service’s Southern Research Station and its ForestrySciences Laboratory in Athens, <strong>Georgia</strong>; the <strong>University</strong> <strong>of</strong> <strong>Georgia</strong> in Athens; and the <strong>University</strong> <strong>of</strong>Tennessee in Knoxville, Tennessee. http://warnell.forestry.uga.edu/nrrt/nsre/IrisReports.html2 The authors are H. Ken Cordell, Pioneering Scientist & Project Leader, USDA Forest Service; Carter J.Betz, <strong>Outdoor</strong> <strong>Recreation</strong> Planner, USDA Forest Service; Gary T. Green, Assistant Pr<strong>of</strong>essor, <strong>University</strong> <strong>of</strong><strong>Georgia</strong>; and Shela H. Mou, Computer Assistant, USDA Forest Service, all <strong>of</strong> Athens, GA. Iris photo iscourtesy <strong>of</strong> Jessica Mou.
IntroductionThis report looks at national trends in outdoor recreation activities in the United States.The estimates <strong>of</strong> numbers <strong>of</strong> people who participate and total days <strong>of</strong> activityparticipation are the same as those partially reported in two recent articles (Cordell, Betz,& Green 2008, & Cordell 2008). The source <strong>of</strong> data is the National Survey on <strong>Recreation</strong>and the Environment (NSRE).MethodsThe NSRE is a nationwide survey <strong>of</strong> outdoor recreation activities conducted by the ForestService research group in Athens, <strong>Georgia</strong>. Partners in this survey are the Universities <strong>of</strong><strong>Georgia</strong> and Tennessee. The Athens Forest Service research group has been collectingand reporting data about outdoor recreation activities since the 1980s. The NSRE is arandom-digit-dialed household telephone survey <strong>of</strong> a cross section <strong>of</strong> noninstitutionalizedU.S. residents 16 years <strong>of</strong> age and older. The most recent rounds <strong>of</strong>NSRE surveying were conducted between the summer <strong>of</strong> 2005 and spring <strong>of</strong> 2008 as part<strong>of</strong> a long-term data collection effort that began in the fall <strong>of</strong> 1999.Across all versions <strong>of</strong> the survey since 1999, more than 100,000 people were asked,“During the past 12 months, did you go [hiking, etc.] outdoors?” If the answer was yes,the person being interviewed on the phone was then asked, “On how many different daysdid you go [hiking, etc.] in the last 12 months?” Any amount <strong>of</strong> time spent on an activitywas counted, whether or not the activity was the primary reason for being outdoors. Thetrend in total number <strong>of</strong> people responding “yes” to any <strong>of</strong> the activities listed and thetotal number <strong>of</strong> days on which they participated between 1999 and 2008 are the twoprimary statistics reported in this paper.FindingsFrom 1999 to 2008, the total number <strong>of</strong> people who participated in one or more <strong>of</strong> 60outdoor activities grew by 4.4 percent, from an estimated 208 million to 217 million(Cordell 2008). At the same time, the number <strong>of</strong> days <strong>of</strong> participation across allparticipants and activities increased from 67 billion to 84 billion, growth <strong>of</strong>approximately 25 percent (see bottom line in Table 1).Shown in Table 1 are trends in the number <strong>of</strong> people participating and total number <strong>of</strong>activity days for 60 individual activities. For a few <strong>of</strong> these activities, only the trend innumber <strong>of</strong> people is shown because days <strong>of</strong> activity participation was not asked in eitherthe earlier survey versions, or in the later ones included in the trend analysis. The trendsfor some activities show strong growth, for some others there are declines. A majorfinding from this analysis is that the activities people are choosing as outdoor recreationis changing over time. There is strong evidence from the data in this table that some <strong>of</strong>the more traditional activities, such as picnicking, visiting historic sites, hunting,downhill skiing (not snowboarding), horseback riding on trails, sailing, snowmobiling,
cross-country skiing, and diving, are becoming less popular than in times past. At thesame time, there is strong evidence that walking, family gatherings,viewing/photographing nature, visiting beaches, visiting farms, driving motor vehicles <strong>of</strong>froad, kayaking, and snowboarding are becoming more popular. These trends have verysignificant implications for both public and private providers <strong>of</strong> outdoor recreationopportunities. In some ways they may represent an ordering <strong>of</strong> priorities.Table 1.—<strong>Trends</strong> in number <strong>of</strong> people participating and number <strong>of</strong> participationdays for 60 outdoor recreation activities in the United States, 1999 – 2008.<strong>Activity</strong>Total U.S.participants(1,000s),2005-2008Percentchange inparticipants,1999-2001to2005-2008Totalannualparticipantdays(millions),2005-2008Percentchange intotal days,1999-2001to2005-2008Visited farm or agric. setting 71,327.7 20.2 3,531.4 100.2View/photograph flowers, etc. 118,370.7 25.8 10,231.9 77.8View/photograph naturalscenery145,489.2 14.1 11,482.3 60.5Drive <strong>of</strong>f-road 44,231.3 18.6 1,349.6 56.1View/photograph otherwildlife114,792.0 21.3 5,341.6 46.9View or photograph birds 81,119.9 19.3 8,039.0 37.6Kayaking 12,480.5 63.1 76.1 29.4Visit waterside besides beach 55,514.8 1.6 1,077.3 28.1Backpacking 22,077.0 -0.6 277.7 24.0Snowboarding 11,273.9 7.3 114.6 23.9Rock climbing 8,662.0 -5.5 63.0 23.8Visit nature centers, etc 127,406.5 5.0 1,044.0 23.2Big game hunting 20,209.8 12.8 320.3 21.2Mountain climbing 11,811.2 -12.5 104.1 20.5Visit a beach 95,882.7 10.4 1,424.1 16.3Sightseeing 113,166.0 4.1 2,352.3 14.0Walk for pleasure 193,411.7 9.6 20,363.3 13.9Family gatherings outdoors 164,841.4 4.2 1,330.2 13.7Visit a wilderness 70,591.9 3.0 1,108.6 12.8Primitive camping 33,330.2 -2.0 310.4 12.1
<strong>Activity</strong>Total U.S.participants(1,000s),2005-2008Percentchange inparticipants,1999-2001to2005-2008Totalannualparticipantdays(millions),2005-2008Percentchange intotal days,1999-2001to2005-2008Developed camping 58,021.3 2.7 532.3 9.3Anadromous fishing 9,161.8 -0.4 89.1 7.6Motorboating 54,124.4 3.9 740.6 7.3Warmwater fishing 51,924.6 7.3 900.1 5.6Caving 9,871.0 8.9 21.6 3.3Swimming in lakes, ponds,etc.Gather mushrooms, berries,etc.92,140.1 4.0 1,333.0 2.271,023.3 16.1 869.3 1.9Small game hunting 15,006.7 -0.3 236.9 -0.7Rafting 17,166.3 -16.8 91.6 -1.0Driving for pleasure 111,069.0 3.1 2,637.3 -1.1Surfing 4,801.9 29.9 94.9 -1.1Waterskiing 18,048.9 5.5 150.8 -3.9Use personal watercraft 19,483.5 -4.1 179.1 -4.3Rowing 8,517.9 -6.3 60.5 -6.5Coldwater fishing 28,218.7 -2.1 366.6 -7.0Visit prehistoric sites 44,938.0 2.4 199.5 -7.3Cross-country skiing 4,970.7 -39.2 58.8 -7.8Saltwater fishing 24,543.5 9.9 251.9 -11.0Snorkeling 15,066.1 5.1 92.1 -12.4Visit historic sites 92,920.8 -4.5 590.8 -15.2Downhill skiing 15,615.4 -14.8 126.4 -15.7Picnicking 115,836.2 -1.4 779.7 -17.2Canoeing 21,043.8 2.3 117.7 -17.9Sailing 10,241.9 -6.5 70.6 -18.1Migratory bird hunting 4,148.9 -16.2 50.6 -18.8Day hiking 74,032.5 6.8 1,993.4 -20.9
<strong>Activity</strong>Total U.S.participants(1,000s),2005-2008Percentchange inparticipants,1999-2001to2005-2008Totalannualparticipantdays(millions),2005-2008Percentchange intotal days,1999-2001to2005-2008Snowmobiling 8,328.2 -29.7 92.7 -27.4Scuba diving 3,639.8 -9.0 25.4 -31.0Mountain biking 41,910.1 -8.0 911.7 -32.7Horseback riding on trails 15,262.6 -8.2 278.3 -35.2Snowshoeing 3,908.9 -11.8 21.5 -36.6Windsurfing 1,343.3 -19.1 7.5 -39.5Bicycling 91,222.5 7.7 . .Boat tours or excursions 45,525.7 10.7 . .Horseback riding 21,678.5 4.9 . .Ice fishing 4,854.0 -14.5 . .Ice skating outdoors 11,254.4 -21.3 . .Orienteering 5,952.7 58.6 . .Sledding 30,197.2 -6.5 . .View or photograph fish 61,135.5 16.8 . .217,694.0 4.4 83,914.4 25.1Source: NSRE 1999-2001 (n=52,607) and 2005-2008 (n=19,186). Note: 1999-2001 participantsbased on 214.0 million people age 16+ (2000 Census). 2005-2008 participants based on 230.0million people age 16+ (2006 Census estimate). Missing data indicate that either participation orannual days were not collected during that time period.ReferencesCordell, H. Ken, Betz, Carter J., and Green, Gary T. (2008). Nature-based outdoorrecreation trends and wilderness. International Journal <strong>of</strong> Wilderness, 14(2), 7-13.Cordell, H. Ken. (2008). The latest on trends in nature-based outdoor recreation. ForestHistory Today, Spring 2008, 4-10.Return to the IRIS Reports Main Menu --http://warnell.forestry.uga.edu/nrrt/nsre/IrisReports.html