John_Yudkin_-_Pure_White_and_Deadly_revised_1986_OCR
John_Yudkin_-_Pure_White_and_Deadly_revised_1986_OCR
John_Yudkin_-_Pure_White_and_Deadly_revised_1986_OCR

Create successful ePaper yourself
Turn your PDF publications into a flip-book with our unique Google optimized e-Paper software.
<strong>Pure</strong>, <strong>White</strong> <strong>and</strong> <strong>Deadly</strong><br />
years; some of the poorer countries are now achieving it very much<br />
more rapidly.<br />
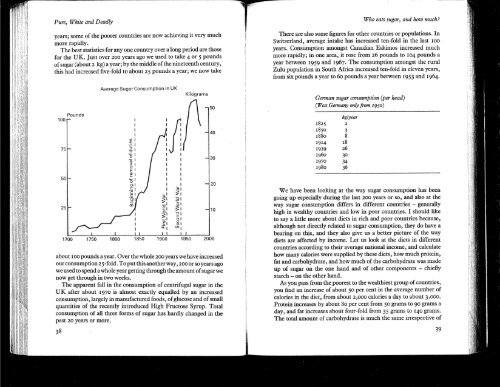
The best statistics for anyone country over a long period are those<br />
for the UK. Just over 200 years ago we used to take 4 or 5 pounds<br />
of sugar (about 2 kg) a year; by the middle of the nineteenth century,<br />
this had increased five-fold to about 25 pounds a year; we now take<br />
Pounds<br />
100<br />
Average Sugar Consumption in UK<br />
Kilograms<br />
50<br />
:f 1 1<br />
40<br />
II)<br />
1 1<br />
OJ<br />
'';:; 1 1<br />
::l<br />
1 1<br />
-" 0<br />
1 1<br />
(ij 1<br />
30<br />
><br />
0<br />
1<br />
E 1<br />
~ 1<br />
1<br />
1 20<br />
:01<br />
~I :5:1<br />
~I 321<br />
~I<br />
"I<br />
;:1 ~I<br />
10<br />
~I -gl<br />
... 1 01<br />
,~I ~I<br />
LJ..I (1)1<br />
1900 1950 2000<br />
about 100 pounds a year. Over the whole 200 years we have increased<br />
our consumption 25-fold. To put this another way, 200 or so years ago<br />
we used to spend a whole year getting through the amount of sugar we<br />
now get through in two weeks.<br />
The apparent fall in the consumption of centrifugal sugar in the<br />
UK after about 1970 is almost exactly equalled by an increased<br />
consumption, largely in manufactured foods, of glucose <strong>and</strong> of small<br />
quantities of the recently introduced High Fructose Syrup. Total<br />
consumption of all three forms of sugar has hardly changed in the<br />
past 20 years or more.<br />
Who eats sugar, <strong>and</strong> how much?<br />
There are also some figures for other countries or populations. In<br />
Switzerl<strong>and</strong>, average intake has increased ten-fold in the last 100<br />
years. Consumption amongst Canadian Eskimos increased much<br />
more rapidly; in one area, it rose from 26 pounds to 104 pounds a<br />
year between 1959 <strong>and</strong> 1967. The consumption amongst the rural<br />
Zulu population in South Africa increased ten-fold in eleven years,<br />
from six pounds a year to 60 pounds a year between 1953 <strong>and</strong> 1964.<br />
German sugar consumption (per head)<br />
(West Germany only from 1950)<br />
kg/year<br />
1825 2<br />
1850<br />
1880<br />
3<br />
8<br />
1914 18<br />
1939 26<br />
1960 30<br />
1970<br />
1980<br />
34<br />
36<br />
We have been looking at the way sugar consumption has been<br />
going up especially during the last 200 years or so, <strong>and</strong> also at the<br />
way sugar consumption differs in different countries - generally<br />
high in wealthy countries <strong>and</strong> low in poor countries. I should like<br />
to say a little more about diets in rich <strong>and</strong> poor countries because,<br />
although not directly related to sugar consumption, they do have a<br />
bearing on this, <strong>and</strong> they also give us a better picture of the way<br />
diets are affected by income. Let us look at the diets in different<br />
countries according to their average national income, <strong>and</strong> calculate<br />
how many calories were supplied by these diets, how much protein,<br />
fat <strong>and</strong> carbohydrate, <strong>and</strong> how much of the carbohydrate was made<br />
up of sugar on the one h<strong>and</strong> <strong>and</strong> of other components - chiefly<br />
starch - on the other h<strong>and</strong>.<br />
As you pass from the poorest to the wealthiest group of countries,<br />
you find an increase of about 50 per cent in the average number of<br />
calories in the diet, from about 2,000 calories a day to about 3,000.<br />
Protein increases by about 80 per cent from 50 grams to 90 grams a<br />
day, <strong>and</strong> fat increases about four-fold from 35 grams to 140 grams.<br />
The total amount of carbohydrate is much the same irrespective of<br />
39