
You also want an ePaper? Increase the reach of your titles
YUMPU automatically turns print PDFs into web optimized ePapers that Google loves.
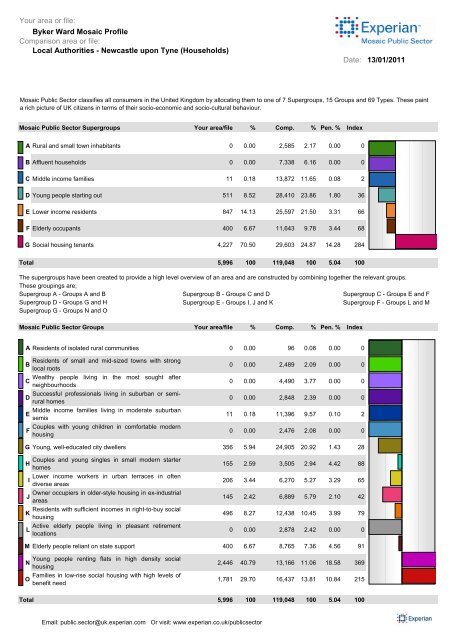
Your area or file:<br />
<strong>Byker</strong> Ward Mosaic Profile<br />
Comparison area or file:<br />
Local Authorities - <strong>Newcastle</strong> upon Tyne (Households)<br />
Date:<br />
13/01/2011<br />
Mosaic Public Sector classifies all consumers in the United Kingdom by allocating them to one of 7 Supergroups, 15 Groups and 69 Types. These paint<br />
a rich picture of UK citizens in terms of their socio-economic and socio-cultural behaviour.<br />
Mosaic Public Sector Supergroups Your area/file % Comp. % Pen. % Index<br />
A Rural and small town inhabitants 0 0.00 2,585 2.17 0.00 0<br />
B Affluent households 0 0.00 7,338 6.16 0.00 0<br />
C Middle income families 11 0.18 13,872 11.65 0.08 2<br />
D Young people starting out 511 8.52 28,410 23.86 1.80 36<br />
E Lower income residents 847 14.13 25,597 21.50 3.31 66<br />
F Elderly occupants 400 6.67 11,643 9.78 3.44 68<br />
G Social housing tenants 4,227 70.50 29,603 24.87 14.28 284<br />
Total 5,996 100 119,048 100 5.04 100<br />
The supergroups have been created to provide a high level overview of an area and are constructed by combining together the relevant groups.<br />
These groupings are;<br />
Supergroup A - Groups A and B Supergroup B - Groups C and D Supergroup C - Groups E and F<br />
Supergroup D - Groups G and H Supergroup E - Groups I, J and K Supergroup F - Groups L and M<br />
Supergroup G - Groups N and O<br />
Mosaic Public Sector Groups Your area/file % Comp. % Pen. % Index<br />
A Residents of isolated rural communities 0 0.00 96 0.08 0.00 0<br />
Residents of small and mid-sized towns with strong<br />
B<br />
local roots<br />
Wealthy people living in the most sought after<br />
C<br />
neighbourhoods<br />
Successful professionals living in suburban or semirural<br />
homes<br />
D<br />
Middle income families living in moderate suburban<br />
E<br />
semis<br />
Couples with young children in comfortable modern<br />
F<br />
housing<br />
0 0.00 2,489 2.09 0.00 0<br />
0 0.00 4,490 3.77 0.00 0<br />
0 0.00 2,848 2.39 0.00 0<br />
11 0.18 11,396 9.57 0.10 2<br />
0 0.00 2,476 2.08 0.00 0<br />
G Young, well-educated city dwellers 356 5.94 24,905 20.92 1.43 28<br />
Couples and young singles in small modern starter<br />
H<br />
homes<br />
Lower income workers in urban terraces in often<br />
I<br />
diverse areas<br />
Owner occupiers in older-style housing in ex-industrial<br />
J<br />
areas<br />
Residents with sufficient incomes in right-to-buy social<br />
K<br />
housing<br />
Active elderly people living in pleasant retirement<br />
L<br />
locations<br />
155 2.59 3,505 2.94 4.42 88<br />
206 3.44 6,270 5.27 3.29 65<br />
145 2.42 6,889 5.79 2.10 42<br />
496 8.27 12,438 10.45 3.99 79<br />
0 0.00 2,878 2.42 0.00 0<br />
M Elderly people reliant on state support 400 6.67 8,765 7.36 4.56 91<br />
Young people renting flats in high density social<br />
N<br />
housing<br />
Families in low-rise social housing with high levels of<br />
O<br />
benefit need<br />
2,446 40.79 13,166 11.06 18.58 369<br />
1,781 29.70 16,437 13.81 10.84 215<br />
Total 5,996 100 119,048 100 5.04 100<br />
Email: public.sector@uk.experian.com Or visit: www.experian.co.uk/publicsector
Your area or file:<br />
<strong>Byker</strong> Ward Mosaic Profile<br />
Comparison area or file:<br />
Local Authorities - <strong>Newcastle</strong> upon Tyne (Households)<br />
This page ranks the Mosaic Public Sector Groups in your area by percentage. Following this is a description of the top two groups.<br />
Rank Mosaic Public Sector Groups Your area/file % Comp. % Pen. % Index<br />
1 N<br />
2 O<br />
3 K<br />
Young people renting flats in high density social<br />
housing<br />
Families in low-rise social housing with high levels<br />
of benefit need<br />
Residents with sufficient incomes in right-to-buy<br />
social housing<br />
2,446 40.79 13,166 11.06 18.58 369<br />
1,781 29.70 16,437 13.81 10.84 215<br />
496 8.27 12,438 10.45 3.99 79<br />
14<br />
15<br />
11<br />
4 M Elderly people reliant on state support 400 6.67 8,765 7.36 4.56 91<br />
5 G Young, well-educated city dwellers 356 5.94 24,905 20.92 1.43 28<br />
6 I<br />
7 H<br />
8 J<br />
9 E<br />
Lower income workers in urban terraces in often<br />
diverse areas<br />
Couples and young singles in small modern starter<br />
homes<br />
Owner occupiers in older-style housing in exindustrial<br />
areas<br />
Middle income families living in moderate<br />
suburban semis<br />
206 3.44 6,270 5.27 3.29 65<br />
155 2.59 3,505 2.94 4.42 88<br />
145 2.42 6,889 5.79 2.10 42<br />
11 0.18 11,396 9.57 0.10 2<br />
10 A Residents of isolated rural communities 0 0.00 96 0.08 0.00 0<br />
11 B<br />
12 C<br />
13 D<br />
14 F<br />
15 L<br />
Residents of small and mid-sized towns with<br />
strong local roots<br />
Wealthy people living in the most sought after<br />
neighbourhoods<br />
Successful professionals living in suburban or<br />
semi-rural homes<br />
Couples with young children in comfortable<br />
modern housing<br />
Active elderly people living in pleasant retirement<br />
locations<br />
0 0.00 2,489 2.09 0.00 0<br />
0 0.00 4,490 3.77 0.00 0<br />
0 0.00 2,848 2.39 0.00 0<br />
0 0.00 2,476 2.08 0.00 0<br />
0 0.00 2,878 2.42 0.00 0<br />
13<br />
7<br />
9<br />
8<br />
10<br />
5<br />
1<br />
2<br />
3<br />
4<br />
6<br />
12<br />
Total 5,996 100 119,048 100 5.04 100<br />
N<br />
Young people renting flats in high density social housing<br />
a<br />
Key Features b Communication Preferences<br />
Young singles<br />
Low incomes<br />
Renting small public flats<br />
High unemployment<br />
Low qualifications<br />
Urban<br />
Low car ownership<br />
High rise buildings<br />
High ethnic diversity<br />
Na<br />
Nb<br />
Na<br />
Nb<br />
Access Information<br />
SMS Text and National Papers<br />
Not Internet, Telephone, Interactive TV or Local<br />
Papers<br />
Service Channels<br />
None<br />
Not Internet, Telephone, Mobile Phone or Post<br />
O<br />
Families in low-rise social housing with high levels of benefit need<br />
a<br />
Key Features b Communication Preferences<br />
Disadvantaged<br />
Low incomes<br />
Unemployment<br />
Long term illness<br />
Low rise council housing<br />
One parent families<br />
High TV watching<br />
Dependent on state<br />
Oa<br />
Ob<br />
Oa<br />
Ob<br />
Access Information<br />
Local Papers and Face to Face<br />
Not Internet<br />
Service Channels<br />
Face to Face<br />
Not Internet, Telephone, Mobile Phone or Post<br />
Email: public.sector@uk.experian.com Or visit: www.experian.co.uk/publicsector
Your area or file:<br />
<strong>Byker</strong> Ward Mosaic Profile<br />
Comparison area or file:<br />
Local Authorities - <strong>Newcastle</strong> upon Tyne (Households)<br />
Mosaic Public Sector Types Your area/file % Comp. % Pen. % Index<br />
Group A - Residents of isolated rural communities<br />
A01 Rural families with high incomes, often from city jobs 0 0.00 29 0.02 0.00 0<br />
0 100 200<br />
A02<br />
A03<br />
A04<br />
Retirees electing to settle in environmentally attractive<br />
localities<br />
Remote communities with poor access to public and<br />
commercial services<br />
Villagers with few well paid alternatives to agricultural<br />
employment<br />
0 0.00 17 0.01 0.00 0<br />
0 0.00 35 0.03 0.00 0<br />
0 0.00 15 0.01 0.00 0<br />
B05<br />
B06<br />
B07<br />
B08<br />
Group B - Residents of small and mid-sized towns with strong local roots<br />
Better off empty nesters in low density estates on town<br />
fringes<br />
Self employed trades people living in smaller<br />
communities<br />
Empty nester owner occupiers making little use of public<br />
services<br />
Mixed communities with many single people in the<br />
centres of small towns<br />
0 0.00 1,283 1.08 0.00 0<br />
0 0.00 250 0.21 0.00 0<br />
0 0.00 648 0.54 0.00 0<br />
0 0.00 308 0.26 0.00 0<br />
0 100 200<br />
C09<br />
C10<br />
C11<br />
C12<br />
Group C -Wealthy people living in the most sought after neighbourhoods<br />
Successful older business leaders living in sought-after<br />
suburbs<br />
Wealthy families in substantial houses with little<br />
community involvement<br />
Creative professionals seeking involvement in local<br />
communities<br />
Residents in smart city centre flats who make little use<br />
of public services<br />
0 0.00 315 0.26 0.00 0<br />
0 0.00 1,405 1.18 0.00 0<br />
0 0.00 2,770 2.33 0.00 0<br />
0 0.00 0 0.00 0.00 0<br />
0 100 200<br />
Group D - Successful professionals living in suburban or semi-rural homes<br />
0 100 200<br />
D13 Higher income older champions of village communities 0 0.00 495 0.42 0.00 0<br />
D14 Older people living in large houses in mature suburbs 0 0.00 1,327 1.11 0.00 0<br />
D15<br />
D16<br />
Well off commuters living in spacious houses in semi<br />
rural settings<br />
Higher income families concerned with education and<br />
careers<br />
0 0.00 415 0.35 0.00 0<br />
0 0.00 611 0.51 0.00 0<br />
E17<br />
E18<br />
E19<br />
E20<br />
E21<br />
Group E - Middle income families living in moderate suburban semis<br />
Comfortably off suburban families weakly tied to their<br />
local community<br />
Industrial workers living comfortably in owner occupied<br />
semis<br />
Self reliant older families in suburban semis in industrial<br />
towns<br />
Up<strong>ward</strong>ly mobile South Asian families living in inter war<br />
suburbs<br />
Middle aged families living in less fashionable inter war<br />
suburban semis<br />
0 0.00 2,025 1.70 0.00 0<br />
0 0.00 1,169 0.98 0.00 0<br />
0 0.00 3,948 3.32 0.00 0<br />
0 0.00 829 0.70 0.00 0<br />
11 0.18 3,425 2.88 0.32 6<br />
0 100 200<br />
F22<br />
F23<br />
F24<br />
F25<br />
Group F - Couples with young children in comfortable modern housing<br />
Busy executives in town houses in dormitory<br />
settlements<br />
Early middle aged parents likely to be involved in their<br />
children's education<br />
Young parents new to their neighbourhood, keen to put<br />
down roots<br />
Personnel reliant on the Ministry of Defence for public<br />
services<br />
0 0.00 1,124 0.94 0.00 0<br />
0 0.00 951 0.80 0.00 0<br />
0 0.00 379 0.32 0.00 0<br />
0 0.00 22 0.02 0.00 0<br />
0 100 200<br />
Email: public.sector@uk.experian.com Or visit: www.experian.co.uk/publicsector
Your area or file:<br />
<strong>Byker</strong> Ward Mosaic Profile<br />
Comparison area or file:<br />
Local Authorities - <strong>Newcastle</strong> upon Tyne (Households)<br />
Mosaic Public Sector Types Your area/file % Comp. % Pen. % Index<br />
Group G - Young, well-educated city dwellers<br />
G26 Well educated singles living in purpose built flats 248 4.14 2,593 2.18 9.56 190<br />
0 100 200<br />
G27 <strong>City</strong> dwellers owning houses in older neighbourhoods 12 0.20 137 0.12 8.76 174<br />
G28<br />
G29<br />
G30<br />
G31<br />
Singles and sharers occupying converted Victorian<br />
houses<br />
Young professional families settling in better quality<br />
older terraces<br />
Diverse communities of well educated singles living in<br />
smart, small flats<br />
Owners in smart purpose built flats in prestige locations,<br />
many newly built<br />
0 0.00 1 0.00 0.00 0<br />
41 0.68 2,438 2.05 1.68 33<br />
0 0.00 405 0.34 0.00 0<br />
0 0.00 1,496 1.26 0.00 0<br />
G32 Students and other transient singles in multi-let houses 0 0.00 10,216 8.58 0.00 0<br />
G33<br />
Transient singles, poorly supported by family and<br />
neighbours<br />
55 0.92 1,931 1.62 2.85 57<br />
G34 Students involved in college and university communities 0 0.00 5,688 4.78 0.00 0<br />
Group H - Couples and young singles in small modern starter homes<br />
0 100 200<br />
H35 Childless new owner occupiers in cramped new homes 0 0.00 1,420 1.19 0.00 0<br />
Young singles and sharers renting small purpose built<br />
H36<br />
flats<br />
Young owners and rented developments of<br />
H37 mixed<br />
tenure<br />
48 0.80 1,138 0.96 4.22 84<br />
0 0.00 451 0.38 0.00 0<br />
H38 People living in brand new residential developments 107 1.78 496 0.42 21.57 428<br />
Group I - Lower income workers in urban terraces in often diverse areas<br />
I39 Young owners and private renters in inner city terraces 0 0.00 9 0.01 0.00 0<br />
0 100 200<br />
I40<br />
I41<br />
I42<br />
I43<br />
I44<br />
Multi-ethnic communities in newer suburbs away from<br />
the inner city<br />
Renters of older terraces in ethnically diverse<br />
communities<br />
South Asian communities experiencing social<br />
deprivation<br />
Older town centres terraces with transient, single<br />
populations<br />
Low income families occupying poor quality older<br />
terraces<br />
0 0.00 35 0.03 0.00 0<br />
0 0.00 54 0.05 0.00 0<br />
0 0.00 1,380 1.16 0.00 0<br />
47 0.78 2,407 2.02 1.95 39<br />
159 2.65 2,385 2.00 6.67 132<br />
J45<br />
J46<br />
J47<br />
Group J - Owner occupiers in older-style housing in ex-industrial areas<br />
Low income communities reliant on low skill industrial<br />
jobs<br />
Residents in blue collar communities revitalised by<br />
commuters<br />
Comfortably off industrial workers owning their own<br />
homes<br />
66 1.10 2,427 2.04 2.72 54<br />
0 0.00 1,563 1.31 0.00 0<br />
79 1.32 2,899 2.44 2.73 54<br />
0 100 200<br />
Group K - Residents with sufficient incomes in right-to-buy council houses<br />
K48 Middle aged couples and families in right-to-buy homes 133 2.22 2,814 2.36 4.73 94<br />
0 100 200<br />
K49<br />
K50<br />
Low income older couples long established in former<br />
council estates<br />
Older families in low value housing in traditional<br />
industrial areas<br />
61 1.02 3,281 2.76 1.86 37<br />
287 4.79 5,147 4.32 5.58 111<br />
K51 Often indebted families living in low rise estates 15 0.25 1,196 1.00 1.25 25<br />
Email: public.sector@uk.experian.com Or visit: www.experian.co.uk/publicsector
Your area or file:<br />
<strong>Byker</strong> Ward Mosaic Profile<br />
Comparison area or file:<br />
Local Authorities - <strong>Newcastle</strong> upon Tyne (Households)<br />
Mosaic Public Sector Types Your area/file % Comp. % Pen. % Index<br />
L52<br />
L53<br />
L54<br />
L55<br />
Group L - Active elderly people living in pleasant retirement locations<br />
Communities of wealthy older people living in large<br />
seaside houses<br />
Residents in retirement, second home and tourist<br />
communities<br />
Retired people of modest means commonly living in<br />
seaside bungalows<br />
Capable older people leasing / owning flats in purpose<br />
built blocks<br />
0 0.00 379 0.32 0.00 0<br />
0 0.00 0 0.00 0.00 0<br />
0 0.00 1,761 1.48 0.00 0<br />
0 0.00 738 0.62 0.00 0<br />
0 100 200<br />
M56<br />
Groups M - Elderly people reliant on state support<br />
Older people living on social housing estates with<br />
limited budgets<br />
0 0.00 1,926 1.62 0.00 0<br />
0 100 200<br />
M57 Old people in flats subsisting on welfare payments 259 4.32 3,511 2.95 7.38 146<br />
M58 Less mobile older people requiring a degree of care 0 0.00 646 0.54 0.00 0<br />
M59<br />
People living in social accommodation designed for<br />
older people<br />
141 2.35 2,682 2.25 5.26 104<br />
N60<br />
N61<br />
Groups N - Young people renting flats in high density social housing<br />
Tenants in social housing flats on estates at risk of<br />
serious social problems<br />
Childless tenants in social housing flats with modest<br />
social needs<br />
204 3.40 1,160 0.97 17.59 349<br />
2,242 37.39 8,310 6.98 26.98 536<br />
0 100 200<br />
N62 Young renters in flats with a cosmopolitan mix 0 0.00 58 0.05 0.00 0<br />
N63<br />
N64<br />
N65<br />
Multicultural tenants renting flats in areas of social<br />
housing<br />
Diverse homesharers renting small flats in densely<br />
populated areas<br />
Young singles in multi-ethnic communities, many in high<br />
rise flats<br />
0 0.00 77 0.06 0.00 0<br />
0 0.00 0 0.00 0.00 0<br />
0 0.00 87 0.07 0.00 0<br />
N66 Childless, low income tenants in high rise flats 0 0.00 3,474 2.92 0.00 0<br />
O67<br />
O68<br />
O69<br />
Group O - Families in low-rise council housing with high levels of benefit need<br />
Older tenants on low rise social housing estates where<br />
jobs are scarce<br />
Families with varied structures living on low rise social<br />
housing estates<br />
Vulnerable young parents needing substantial state<br />
support<br />
905 15.09 8,243 6.92 10.98 218<br />
0 0.00 306 0.26 0.00 0<br />
876 14.61 7,888 6.63 11.11 220<br />
0 100 200<br />
Total 5,996 100 119,048 100 5.04 100<br />
Email: public.sector@uk.experian.com Or visit: www.experian.co.uk/publicsector
Your area or file:<br />
<strong>Byker</strong> Ward Mosaic Profile<br />
Comparison area or file:<br />
Local Authorities - <strong>Newcastle</strong> upon Tyne (Households)<br />
This page identifies the top ten Mosaic Public Sector types in your area ranked on percentage. Following this is a description of the top three types<br />
Rank Mosaic Public Sector Types Your area/file % Comp. % Pen. % Index<br />
1 61<br />
2 67<br />
3 69<br />
4 50<br />
5 57<br />
6 26<br />
7 60<br />
8 44<br />
9 59<br />
10 48<br />
Childless tenants in social housing flats with<br />
modest social needs<br />
Older tenants on low rise social housing estates<br />
where jobs are scarce<br />
Vulnerable young parents needing substantial<br />
state support<br />
Older families in low value housing in traditional<br />
industrial areas<br />
Old people in flats subsisting on welfare<br />
payments<br />
Well educated singles living in purpose built<br />
flats<br />
Tenants in social housing flats on estates at risk<br />
of serious social problems<br />
Low income families occupying poor quality<br />
older terraces<br />
People living in social accommodation designed<br />
for older people<br />
Middle aged couples and families in right-to-buy<br />
homes<br />
2,242 37.39 8,310 6.98 26.98 536<br />
905 15.09 8,243 6.92 10.98 218<br />
876 14.61 7,888 6.63 11.11 220<br />
287 4.79 5,147 4.32 5.58 111<br />
259 4.32 3,511 2.95 7.38 146<br />
248 4.14 2,593 2.18 9.56 190<br />
204 3.40 1,160 0.97 17.59 349<br />
159 2.65 2,385 2.00 6.67 132<br />
141 2.35 2,682 2.25 5.26 104<br />
133 2.22 2,814 2.36 4.73 94<br />
61 Childless tenants in social housing flats with modest social needs<br />
a<br />
Key Features b Communication Preferences<br />
Young singles<br />
Access Information<br />
Low incomes<br />
61a SMS Text, Face to Face, National Papers,<br />
Difficulty holding down a job<br />
61b Local Papers<br />
Manual work<br />
Small blocks of flats<br />
Local orientation 61a<br />
Not Telephone<br />
Service Channels<br />
Low car ownership<br />
61b Face to Face<br />
Cash transactions<br />
Not Internet, Telephone, Mobile Phone or Post<br />
67 Older tenants on low rise social housing estates where jobs are scarce<br />
a<br />
Key Features b Communication Preferences<br />
Low rise municipal housing<br />
Older people<br />
Low incomes<br />
Anti social behaviour problems<br />
Lack of community facilities<br />
Semi skilled and routine work<br />
Minimum wage<br />
Limited aspirations<br />
67a<br />
67b<br />
67a<br />
67b<br />
Access Information<br />
Face to Face and Local Papers<br />
Not Internet, Telephone, Interactive TV,<br />
Magazines<br />
Service Channels<br />
Face to Face<br />
Not Internet, Telephone, Mobile Phone or Post<br />
69 Vulnerable young parents needing substantial state support<br />
a<br />
Key Features b Communication Preferences<br />
Vulnerable households<br />
Unemployment<br />
Single parent<br />
Young people<br />
Bus<br />
Alcohol and tobacco<br />
Second hand goods<br />
TV<br />
69a<br />
69b<br />
69a<br />
69b<br />
Access Information<br />
SMS Text, Face to Face, National Papers,<br />
Local Papers<br />
Not Internet, Magazines<br />
Service Channels<br />
Face to Face<br />
Not Internet, Telephone, Mobile Phone or Post<br />
Email: public.sector@uk.experian.com Or visit: www.experian.co.uk/publicsector
Profile Reports Explained:<br />
A profile report allows you to understand the characteristics of a citizen / prospect file or a geographical catchment, compared to a comparison<br />
file or area.<br />
For more information on profiles please refer to the knowledge base at http://www.publicsectorknowledgebase.co.uk<br />
Your area/file:<br />
The number of<br />
records in your<br />
chosen area that<br />
fall within each<br />
Mosaic group.<br />
Comparison area/file:<br />
The number of records in your<br />
chosen comparison area that<br />
fall within each Mosaic group.<br />
Penetration Percentage:<br />
Shows the proportion of the comparison area that is made up of your<br />
area's population for each Mosaic group. For example, if the<br />
penetration of group A was 10%, then your area represents 10% of<br />
all group A's living within the comparison area.<br />
Index:<br />
Shows how close your area<br />
% is to the comparison area<br />
%.<br />
An index of 100 means your<br />
area % is equal to the<br />
comparison area %.<br />
Below 100 means your area<br />
% is lower than the<br />
comparison area %.<br />
Above 100 means<br />
your area % is higher than<br />
the comparison area %.<br />
Your area/file<br />
percentage:<br />
The number of<br />
records in your<br />
chosen area that fall<br />
within each Mosaic<br />
group as a<br />
percentage of the<br />
total in your area.<br />
Comparison area/file<br />
percentage:<br />
The number of records in<br />
your chosen comparison<br />
area that fall within each<br />
Mosaic group as a<br />
percentage of the total in<br />
the comparison area.<br />
Index Value Graph:<br />
Shows the index value visually.<br />
The centre line is 100, where your area % and the comparison area % are equal.<br />
Left of centre means that the Mosaic Group is underrepresented in your area/profile compared to the<br />
comparison area/profile.<br />
Right of centre means that the Mosaic Group is overrepresented in your area/profile compared to the<br />
comparison area/profile.<br />
Email: public.sector@uk.experian.com Or visit: www.experian.co.uk/publicsector
Mosaic Public Sector Data Sources<br />
Data Sources<br />
A total of 440 data elements have been used to build this latest version of Mosaic Public Sector. These have been selected as inputs to the classification<br />
on the basis of their volume, quality, consistency and sustainability.<br />
62 percent of the information used to build Mosaic Mosaic Public Sector is sourced from a combination of data that includes Experian’s UK Consumer<br />
Dynamics Database, which provides consumer demographic information for the UK’s 47 million adults and 24 million households. This database is built<br />
from an unrivalled variety of privacy-compliant public and Experian proprietary data and statistical models. These include the edited Electoral Roll,<br />
<strong>Council</strong> Tax property valuations, house sale prices, selfreported lifestyle surveys and other compiled consumer data.<br />
The remaining 38 percent of the data is sourced from Census current year estimates that Experian has produced by utilising its wealth of<br />
data assets to track change in key 2001 Census variables. All of the information used to build Mosaic Public Sector is continuously updated. This<br />
enables Experian to verify and update the classification twice a year.<br />
The Mosaic Family Tree<br />
The Mosaic Family Tree illustrates the major<br />
demographic and lifestyle polarities between the<br />
Types and Groups, and shows how the Mosaic<br />
Types relate to each other.<br />
Mosaic Migration helps to determine the<br />
probable location paths of different Mosaic Types<br />
and how households might move through the<br />
Mosaic Family Tree over time. This is useful for<br />
understanding the origin, stability and aspirations<br />
of the people within each Mosaic Type.<br />
Email: public.sector@uk.experian.com Or visit: www.experian.co.uk/publicsector