Shop Space Available - Paynter Realty and Investments, Inc.
Shop Space Available - Paynter Realty and Investments, Inc.
Shop Space Available - Paynter Realty and Investments, Inc.

Create successful ePaper yourself
Turn your PDF publications into a flip-book with our unique Google optimized e-Paper software.
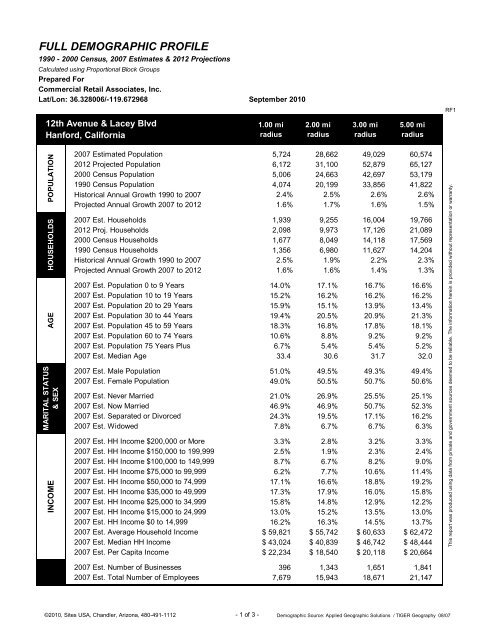
FULL DEMOGRAPHIC PROFILE<br />
1990 - 2000 Census, 2007 Estimates & 2012 Projections<br />
Calculated using Proportional Block Groups<br />
Prepared For<br />
Commercial Retail Associates, <strong>Inc</strong>.<br />
Lat/Lon: 36.328006/-119.672968<br />
September 2010<br />
RF1<br />
12th Avenue & Lacey Blvd<br />
Hanford, California<br />
1.00 mi<br />
radius<br />
2.00 mi<br />
radius<br />
3.00 mi<br />
radius<br />
5.00 mi<br />
radius<br />
POPULATION<br />
MARITAL STATUS<br />
INCOME AGE<br />
HOUSEHOLDS<br />
& SEX<br />
2007 Estimated Population 5,724 28,662 49,029 60,574<br />
2012 Projected Population 6,172 31,100 52,879 65,127<br />
2000 Census Population 5,006 24,663 42,697 53,179<br />
1990 Census Population 4,074 20,199 33,856 41,822<br />
Historical Annual Growth 1990 to 2007 2.4% 2.5% 2.6% 2.6%<br />
Projected Annual Growth 2007 to 2012 1.6% 1.7% 1.6% 1.5%<br />
2007 Est. Households 1,939 9,255 16,004 19,766<br />
2012 Proj. Households 2,098 9,973 17,126 21,089<br />
2000 Census Households 1,677 8,049 14,118 17,569<br />
1990 Census Households 1,356 6,980 11,627 14,204<br />
Historical Annual Growth 1990 to 2007 2.5% 1.9% 2.2% 2.3%<br />
Projected Annual Growth 2007 to 2012 1.6% 1.6% 1.4% 1.3%<br />
2007 Est. Population 0 to 9 Years 14.0% 17.1% 16.7% 16.6%<br />
2007 Est. Population 10 to 19 Years 15.2% 16.2% 16.2% 16.2%<br />
2007 Est. Population 20 to 29 Years 15.9% 15.1% 13.9% 13.4%<br />
2007 Est. Population 30 to 44 Years 19.4% 20.5% 20.9% 21.3%<br />
2007 Est. Population 45 to 59 Years 18.3% 16.8% 17.8% 18.1%<br />
2007 Est. Population 60 to 74 Years 10.6% 8.8% 9.2% 9.2%<br />
2007 Est. Population 75 Years Plus 6.7% 5.4% 5.4% 5.2%<br />
2007 Est. Median Age 33.4 30.6 31.7 32.0<br />
2007 Est. Male Population 51.0% 49.5% 49.3% 49.4%<br />
2007 Est. Female Population 49.0% 50.5% 50.7% 50.6%<br />
2007 Est. Never Married 21.0% 26.9% 25.5% 25.1%<br />
2007 Est. Now Married 46.9% 46.9% 50.7% 52.3%<br />
2007 Est. Separated or Divorced 24.3% 19.5% 17.1% 16.2%<br />
2007 Est. Widowed 7.8% 6.7% 6.7% 6.3%<br />
2007 Est. HH <strong>Inc</strong>ome $200,000 or More 3.3% 2.8% 3.2% 3.3%<br />
2007 Est. HH <strong>Inc</strong>ome $150,000 to 199,999 2.5% 1.9% 2.3% 2.4%<br />
2007 Est. HH <strong>Inc</strong>ome $100,000 to 149,999 8.7% 6.7% 8.2% 9.0%<br />
2007 Est. HH <strong>Inc</strong>ome $75,000 to 99,999 6.2% 7.7% 10.6% 11.4%<br />
2007 Est. HH <strong>Inc</strong>ome $50,000 to 74,999 17.1% 16.6% 18.8% 19.2%<br />
2007 Est. HH <strong>Inc</strong>ome $35,000 to 49,999 17.3% 17.9% 16.0% 15.8%<br />
2007 Est. HH <strong>Inc</strong>ome $25,000 to 34,999 15.8% 14.8% 12.9% 12.2%<br />
2007 Est. HH <strong>Inc</strong>ome $15,000 to 24,999 13.0% 15.2% 13.5% 13.0%<br />
2007 Est. HH <strong>Inc</strong>ome $0 to 14,999 16.2% 16.3% 14.5% 13.7%<br />
2007 Est. Average Household <strong>Inc</strong>ome $ 59,821 $ 55,742 $ 60,633 $ 62,472<br />
2007 Est. Median HH <strong>Inc</strong>ome $ 43,024 $ 40,839 $ 46,742 $ 48,444<br />
2007 Est. Per Capita <strong>Inc</strong>ome $ 22,234 $ 18,540 $ 20,118 $ 20,664<br />
2007 Est. Number of Businesses 396 1,343 1,651 1,841<br />
2007 Est. Total Number of Employees 7,679 15,943 18,671 21,147<br />
This report was produced using data from private <strong>and</strong> government sources deemed to be reliable. The information herein is provided without representation or warranty.<br />
©2010, Sites USA, Ch<strong>and</strong>ler, Arizona, 480-491-1112 - 1 of 3 - Demographic Source: Applied Geographic Solutions / TIGER Geography 08/07