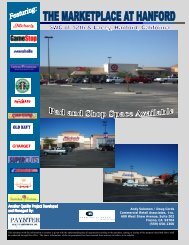
Shop Space Available - Paynter Realty and Investments, Inc.
Shop Space Available - Paynter Realty and Investments, Inc.
Shop Space Available - Paynter Realty and Investments, Inc.

Create successful ePaper yourself
Turn your PDF publications into a flip-book with our unique Google optimized e-Paper software.
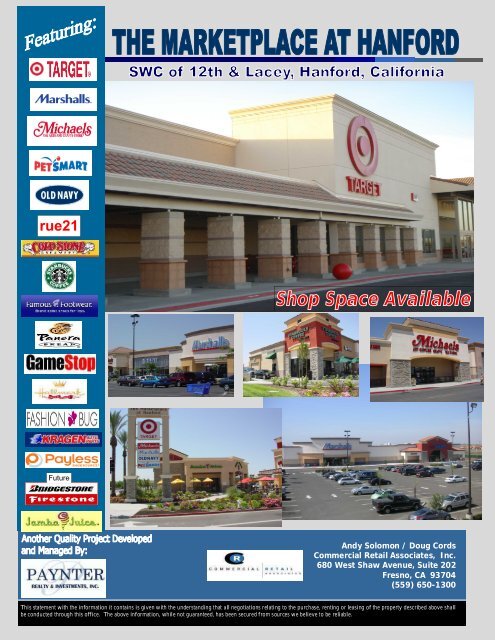
Andy Solomon / Doug Cords<br />
Commercial Retail Associates, <strong>Inc</strong>.<br />
680 West Shaw Avenue, Suite 202<br />
Fresno, CA 93704<br />
(559) 650-1300<br />
This statement with the information it contains is given with the underst<strong>and</strong>ing that all negotiations relating to the purchase, renting or leasing of the property described above shall<br />
be conducted through this office. The above information, while not guaranteed, has been secured from sources we believe to be reliable.
PROPERTY SUMMARY<br />
LOCATION:<br />
GROSS<br />
LEASBLE AREA:<br />
LAND AREA:<br />
DEMOGRAPHICS:<br />
Southwest quadrant of 12 th Avenue <strong>and</strong> Lacey Boulevard<br />
Hanford, CA<br />
± 318,000 square feet<br />
± 35 Acres<br />
1 mile 2 mile 3 mile 10 mile<br />
2007 Estimated<br />
Population 5,724 28,662 49,029 60,574<br />
2007 Estimated<br />
Average HH <strong>Inc</strong>ome $59,821 $55,742 $60,633 $62,472<br />
Source: Sites USA, 2010<br />
Trade Area Population (see map enclosed):<br />
Source: Sites USA, 2011<br />
2007 Estimated Population: 175,124<br />
2012 Project Population: 189,788<br />
TRAFFIC COUNTS:<br />
Lacey Boulevard<br />
12th Avenue<br />
Highway 198<br />
Source: City of Hanford 2003; Caltrans 2003<br />
21,559ADT<br />
18,044 ADT<br />
30,000 ADT<br />
69,603 Total Cars Per Day<br />
OVERVIEW:<br />
٭<br />
Hanford Mall (anchored by Sears, JC Penney, Forever 21 <strong>and</strong> Kohl’s Department Store) is across the street.<br />
{Kohl’s opened October 2010}<br />
٭<br />
Super Wal-Mart at this intersection ٭<br />
Immediate Availability CONTACT INFORMATION:<br />
Andy Solomon / Doug Cords<br />
Commercial Retail Associates, <strong>Inc</strong>.<br />
680 West Shaw Avenue, Suite 202<br />
Fresno, California 93704<br />
(559) 650-1300
San Benito<br />
Monterey<br />
101<br />
Merced<br />
Merced<br />
5<br />
Madera<br />
Fresno<br />
Kings<br />
5<br />
99<br />
n<br />
Visalia<br />
Tulare<br />
99<br />
198<br />
Porterville<br />
Tulare<br />
Lat: 36.1798 Lon: -119.815 Zoom: 150.5 mi Logos are for identification purposes only <strong>and</strong> may be trademarks of their respective companies.<br />
San Luis Obispo<br />
San Luis Obispo<br />
Bakersfield<br />
Kern<br />
Hanford Marketplace<br />
Hanford, California<br />
January 2011<br />
©2011, SITES USA <strong>Inc</strong>., Ch<strong>and</strong>ler, AZ (480) 491-1112. All Rights Reserved.<br />
This map was produced using data from private <strong>and</strong> government sources deemed to be reliable. The information herein is provided without representation or warranty.<br />
THIS MAP CANNOT BE DUPLICATED WITHOUT THE EXPRESS WRITTEN CONSENT OF COMMERCIAL RETAIL ASSOCIATES, INC.
This aerial was produced using data from private <strong>and</strong> governmental sources deemed to be reliable. The information herein is provided without representation or warranty.<br />
THIS AERIAL CANNOT BE DUPLICATED WITHOUT THE EXPRESS WRITTEN CONSENT OF COMMERCIAL RETAIL ASSOCIATES, INC.
FULL DEMOGRAPHIC PROFILE<br />
1990 - 2000 Census, 2007 Estimates & 2012 Projections<br />
Calculated using Proportional Block Groups<br />
Prepared For<br />
Commercial Retail Associates, <strong>Inc</strong>.<br />
Lat/Lon: 36.150745/-120.124619<br />
Hanford Marketplace<br />
Hanford, California<br />
January 2011<br />
Trade Area<br />
RF1<br />
POPULATION<br />
MARITAL STATUS<br />
INCOME AGE<br />
HOUSEHOLDS<br />
& SEX<br />
2007 Estimated Population 175,124<br />
2012 Projected Population 189,788<br />
2000 Census Population 152,565<br />
1990 Census Population 119,479<br />
Historical Annual Growth 1990 to 2007 2.7%<br />
Projected Annual Growth 2007 to 2012 1.7%<br />
2007 Est. Households 47,511<br />
2012 Proj. Households 51,195<br />
2000 Census Households 41,752<br />
1990 Census Households 35,278<br />
Historical Annual Growth 1990 to 2007 2.0%<br />
Projected Annual Growth 2007 to 2012 1.6%<br />
2007 Est. Population 0 to 9 Years 16.7%<br />
2007 Est. Population 10 to 19 Years 16.0%<br />
2007 Est. Population 20 to 29 Years 17.1%<br />
2007 Est. Population 30 to 44 Years 23.4%<br />
2007 Est. Population 45 to 59 Years 15.9%<br />
2007 Est. Population 60 to 74 Years 7.3%<br />
2007 Est. Population 75 Years Plus 3.5%<br />
2007 Est. Median Age 29.6<br />
2007 Est. Male Population 55.6%<br />
2007 Est. Female Population 44.4%<br />
2007 Est. Never Married 24.7%<br />
2007 Est. Now Married 46.2%<br />
2007 Est. Separated or Divorced 24.5%<br />
2007 Est. Widowed 4.6%<br />
2007 Est. HH <strong>Inc</strong>ome $200,000 or More 2.5%<br />
2007 Est. HH <strong>Inc</strong>ome $150,000 to 199,999 2.1%<br />
2007 Est. HH <strong>Inc</strong>ome $100,000 to 149,999 8.4%<br />
2007 Est. HH <strong>Inc</strong>ome $75,000 to 99,999 10.6%<br />
2007 Est. HH <strong>Inc</strong>ome $50,000 to 74,999 18.9%<br />
2007 Est. HH <strong>Inc</strong>ome $35,000 to 49,999 16.5%<br />
2007 Est. HH <strong>Inc</strong>ome $25,000 to 34,999 13.9%<br />
2007 Est. HH <strong>Inc</strong>ome $15,000 to 24,999 13.4%<br />
2007 Est. HH <strong>Inc</strong>ome $0 to 14,999 13.9%<br />
2007 Est. Average Household <strong>Inc</strong>ome $ 58,011<br />
2007 Est. Median HH <strong>Inc</strong>ome $ 45,115<br />
2007 Est. Per Capita <strong>Inc</strong>ome $ 19,417<br />
2007 Est. Number of Businesses 3,463<br />
2007 Est. Total Number of Employees 49,032<br />
This report was produced using data from private <strong>and</strong> government sources deemed to be reliable. The information herein is provided without representation or warranty.<br />
©2011, Sites USA, Ch<strong>and</strong>ler, Arizona, 480-491-1112 - 1 of 3 - Demographic Source: Applied Geographic Solutions / TIGER Geography 08/07
FULL DEMOGRAPHIC PROFILE<br />
1990 - 2000 Census, 2007 Estimates & 2012 Projections<br />
Calculated using Proportional Block Groups<br />
Prepared For<br />
Commercial Retail Associates, <strong>Inc</strong>.<br />
Lat/Lon: 36.150745/-120.124619<br />
Hanford Marketplace<br />
Hanford, California<br />
January 2011<br />
Trade Area<br />
RF1<br />
RACE<br />
HISPANIC<br />
EDUCATION<br />
(Adults 25 or Older)<br />
HOMES BUILT BY<br />
HOME VALUES HOUSING<br />
YEAR<br />
2007 Est. White Population 73.4%<br />
2007 Est. Black Population 3.4%<br />
2007 Est. Asian & Pacific Isl<strong>and</strong>er 4.2%<br />
2007 Est. American Indian & Alaska Native 1.4%<br />
2007 Est. Other Races Population 17.7%<br />
2007 Est. Hispanic Population 90,789<br />
2007 Est. Hispanic Population Percent 51.8%<br />
2012 Proj. Hispanic Population Percent 53.9%<br />
2000 Hispanic Population Percent 47.9%<br />
2007 Est. Adult Population (25 Years or Older) 103,249<br />
2007 Est. Elementary (0 to 8) 22.0%<br />
2007 Est. Some High School (9 to 11) 8.5%<br />
2007 Est. High School Graduate (12) 27.0%<br />
2007 Est. Some College (13 to 16) 20.4%<br />
2007 Est. Associate Degree Only 10.5%<br />
2007 Est. Bachelor Degree Only 8.5%<br />
2007 Est. Graduate Degree 3.1%<br />
2007 Est. Total Housing Units 50,199<br />
2007 Est. Owner Occupied Percent 51.8%<br />
2007 Est. Renter Occupied Percent 42.8%<br />
2007 Est. Vacant Housing Percent 5.4%<br />
2000 Homes Built 1999 to 2000 2.4%<br />
2000 Homes Built 1995 to 1998 10.0%<br />
2000 Homes Built 1990 to 1994 10.7%<br />
2000 Homes Built 1980 to 1989 18.3%<br />
2000 Homes Built 1970 to 1979 18.9%<br />
2000 Homes Built 1960 to 1969 15.6%<br />
2000 Homes Built 1950 to 1959 11.2%<br />
2000 Homes Built Before 1949 13.0%<br />
2000 Home Value $1,000,000 or More 0.1%<br />
2000 Home Value $500,000 to $999,999 0.1%<br />
2000 Home Value $400,000 to $499,999 0.1%<br />
2000 Home Value $300,000 to $399,999 0.7%<br />
2000 Home Value $200,000 to $299,999 3.8%<br />
2000 Home Value $150,000 to $199,999 10.1%<br />
2000 Home Value $100,000 to $149,999 30.3%<br />
2000 Home Value $50,000 to $99,999 49.0%<br />
2000 Home Value $25,000 to $49,999 4.4%<br />
2000 Home Value $0 to $24,999 1.4%<br />
2000 Median Home Value $ 101,433<br />
2000 Median Rent $ 357<br />
This report was produced using data from private <strong>and</strong> government sources deemed to be reliable. The information herein is provided without representation or warranty.<br />
©2011, Sites USA, Ch<strong>and</strong>ler, Arizona, 480-491-1112 - 2 of 3 - Demographic Source: Applied Geographic Solutions / TIGER Geography 08/07
FULL DEMOGRAPHIC PROFILE<br />
1990 - 2000 Census, 2007 Estimates & 2012 Projections<br />
Calculated using Proportional Block Groups<br />
Prepared For<br />
Commercial Retail Associates, <strong>Inc</strong>.<br />
Lat/Lon: 36.150745/-120.124619<br />
Hanford Marketplace<br />
Hanford, California<br />
January 2011<br />
Trade Area<br />
RF1<br />
TRANSPORTATION<br />
TRAVEL TIME OCCUPATION LABOR FORCE<br />
TO WORK<br />
CONSUMER EXPENDITURE<br />
2007 Est. Labor: Population Age 16+ 129,033<br />
2007 Est. Civilian Employed 52.1%<br />
2007 Est. Civilian Unemployed 9.1%<br />
2007 Est. in Armed Forces 3.3%<br />
2007 Est. not in Labor Force 35.4%<br />
2007 Labor Force: Males 56.9%<br />
2007 Labor Force: Females 43.1%<br />
2000 Occupation: Population Age 16+ 48,804<br />
2000 Mgmt, Business, & Financial Operations 9.5%<br />
2000 Professional <strong>and</strong> Related 14.6%<br />
2000 Service 19.6%<br />
2000 Sales <strong>and</strong> Office 21.7%<br />
2000 Farming, Fishing, <strong>and</strong> Forestry 12.9%<br />
2000 Construction, Extraction, & Maintenance 8.5%<br />
2000 Production, Transport, & Material Moving 13.2%<br />
2000 Percent White Collar Workers 45.8%<br />
2000 Percent Blue Collar Workers 54.2%<br />
2000 Drive to Work Alone 70.9%<br />
2000 Drive to Work in Carpool 18.4%<br />
2000 Travel to Work by Public Transportation 1.9%<br />
2000 Drive to Work on Motorcycle 0.3%<br />
2000 Walk or Bicycle to Work 4.4%<br />
2000 Other Means 1.5%<br />
2000 Work at Home 2.6%<br />
2000 Travel to Work in 14 Minutes or Less 42.2%<br />
2000 Travel to Work in 15 to 29 Minutes 31.3%<br />
2000 Travel to Work in 30 to 59 Minutes 21.9%<br />
2000 Travel to Work in 60 Minutes or More 4.7%<br />
2000 Average Travel Time to Work 19.8<br />
2007 Est. Total Household Expenditure (in Millions) $ 2,289.8<br />
2007 Est. Apparel $ 110.6<br />
2007 Est. Contributions & Gifts $ 137.1<br />
2007 Est. Education & Reading $ 59.6<br />
2007 Est. Entertainment $ 127.2<br />
2007 Est. Food, Beverages & Tobacco $ 375.0<br />
2007 Est. Furnishings And Equipment $ 97.1<br />
2007 Est. Health Care & Insurance $ 165.4<br />
2007 Est. Household Operations & Shelter & Utilities $ 684.6<br />
2007 Est. Miscellaneous Expenses $ 38.5<br />
2007 Est. Personal Care $ 33.4<br />
2007 Est. Transportation $ 461.4<br />
This report was produced using data from private <strong>and</strong> government sources deemed to be reliable. The information herein is provided without representation or warranty.<br />
©2011, Sites USA, Ch<strong>and</strong>ler, Arizona, 480-491-1112 - 3 of 3 - Demographic Source: Applied Geographic Solutions / TIGER Geography 08/07
FULL DEMOGRAPHIC PROFILE<br />
1990 - 2000 Census, 2007 Estimates & 2012 Projections<br />
Calculated using Proportional Block Groups<br />
Prepared For<br />
Commercial Retail Associates, <strong>Inc</strong>.<br />
Lat/Lon: 36.328006/-119.672968<br />
September 2010<br />
RF1<br />
12th Avenue & Lacey Blvd<br />
Hanford, California<br />
1.00 mi<br />
radius<br />
2.00 mi<br />
radius<br />
3.00 mi<br />
radius<br />
5.00 mi<br />
radius<br />
POPULATION<br />
MARITAL STATUS<br />
INCOME AGE<br />
HOUSEHOLDS<br />
& SEX<br />
2007 Estimated Population 5,724 28,662 49,029 60,574<br />
2012 Projected Population 6,172 31,100 52,879 65,127<br />
2000 Census Population 5,006 24,663 42,697 53,179<br />
1990 Census Population 4,074 20,199 33,856 41,822<br />
Historical Annual Growth 1990 to 2007 2.4% 2.5% 2.6% 2.6%<br />
Projected Annual Growth 2007 to 2012 1.6% 1.7% 1.6% 1.5%<br />
2007 Est. Households 1,939 9,255 16,004 19,766<br />
2012 Proj. Households 2,098 9,973 17,126 21,089<br />
2000 Census Households 1,677 8,049 14,118 17,569<br />
1990 Census Households 1,356 6,980 11,627 14,204<br />
Historical Annual Growth 1990 to 2007 2.5% 1.9% 2.2% 2.3%<br />
Projected Annual Growth 2007 to 2012 1.6% 1.6% 1.4% 1.3%<br />
2007 Est. Population 0 to 9 Years 14.0% 17.1% 16.7% 16.6%<br />
2007 Est. Population 10 to 19 Years 15.2% 16.2% 16.2% 16.2%<br />
2007 Est. Population 20 to 29 Years 15.9% 15.1% 13.9% 13.4%<br />
2007 Est. Population 30 to 44 Years 19.4% 20.5% 20.9% 21.3%<br />
2007 Est. Population 45 to 59 Years 18.3% 16.8% 17.8% 18.1%<br />
2007 Est. Population 60 to 74 Years 10.6% 8.8% 9.2% 9.2%<br />
2007 Est. Population 75 Years Plus 6.7% 5.4% 5.4% 5.2%<br />
2007 Est. Median Age 33.4 30.6 31.7 32.0<br />
2007 Est. Male Population 51.0% 49.5% 49.3% 49.4%<br />
2007 Est. Female Population 49.0% 50.5% 50.7% 50.6%<br />
2007 Est. Never Married 21.0% 26.9% 25.5% 25.1%<br />
2007 Est. Now Married 46.9% 46.9% 50.7% 52.3%<br />
2007 Est. Separated or Divorced 24.3% 19.5% 17.1% 16.2%<br />
2007 Est. Widowed 7.8% 6.7% 6.7% 6.3%<br />
2007 Est. HH <strong>Inc</strong>ome $200,000 or More 3.3% 2.8% 3.2% 3.3%<br />
2007 Est. HH <strong>Inc</strong>ome $150,000 to 199,999 2.5% 1.9% 2.3% 2.4%<br />
2007 Est. HH <strong>Inc</strong>ome $100,000 to 149,999 8.7% 6.7% 8.2% 9.0%<br />
2007 Est. HH <strong>Inc</strong>ome $75,000 to 99,999 6.2% 7.7% 10.6% 11.4%<br />
2007 Est. HH <strong>Inc</strong>ome $50,000 to 74,999 17.1% 16.6% 18.8% 19.2%<br />
2007 Est. HH <strong>Inc</strong>ome $35,000 to 49,999 17.3% 17.9% 16.0% 15.8%<br />
2007 Est. HH <strong>Inc</strong>ome $25,000 to 34,999 15.8% 14.8% 12.9% 12.2%<br />
2007 Est. HH <strong>Inc</strong>ome $15,000 to 24,999 13.0% 15.2% 13.5% 13.0%<br />
2007 Est. HH <strong>Inc</strong>ome $0 to 14,999 16.2% 16.3% 14.5% 13.7%<br />
2007 Est. Average Household <strong>Inc</strong>ome $ 59,821 $ 55,742 $ 60,633 $ 62,472<br />
2007 Est. Median HH <strong>Inc</strong>ome $ 43,024 $ 40,839 $ 46,742 $ 48,444<br />
2007 Est. Per Capita <strong>Inc</strong>ome $ 22,234 $ 18,540 $ 20,118 $ 20,664<br />
2007 Est. Number of Businesses 396 1,343 1,651 1,841<br />
2007 Est. Total Number of Employees 7,679 15,943 18,671 21,147<br />
This report was produced using data from private <strong>and</strong> government sources deemed to be reliable. The information herein is provided without representation or warranty.<br />
©2010, Sites USA, Ch<strong>and</strong>ler, Arizona, 480-491-1112 - 1 of 3 - Demographic Source: Applied Geographic Solutions / TIGER Geography 08/07
FULL DEMOGRAPHIC PROFILE<br />
1990 - 2000 Census, 2007 Estimates & 2012 Projections<br />
Calculated using Proportional Block Groups<br />
Prepared For<br />
Commercial Retail Associates, <strong>Inc</strong>.<br />
Lat/Lon: 36.328006/-119.672968<br />
September 2010<br />
RF1<br />
12th Avenue & Lacey Blvd<br />
Hanford, California<br />
1.00 mi<br />
radius<br />
2.00 mi<br />
radius<br />
3.00 mi<br />
radius<br />
5.00 mi<br />
radius<br />
RACE<br />
HISPANIC<br />
EDUCATION<br />
(Adults 25 or Older)<br />
HOUSING<br />
HOMES BUILT BY<br />
YEAR<br />
HOME VALUES<br />
2007 Est. White Population 81.9% 80.5% 82.0% 82.6%<br />
2007 Est. Black Population 2.5% 2.3% 2.1% 2.1%<br />
2007 Est. Asian & Pacific Isl<strong>and</strong>er 3.9% 3.6% 3.6% 3.6%<br />
2007 Est. American Indian & Alaska Native 1.8% 1.5% 1.3% 1.3%<br />
2007 Est. Other Races Population 10.0% 12.1% 11.0% 10.5%<br />
2007 Est. Hispanic Population 2,514 14,456 22,350 26,327<br />
2007 Est. Hispanic Population Percent 43.9% 50.4% 45.6% 43.5%<br />
2012 Proj. Hispanic Population Percent 46.4% 52.5% 48.0% 46.0%<br />
2000 Hispanic Population Percent 39.7% 46.7% 41.5% 39.1%<br />
2007 Est. Adult Population (25 Years or Older) 3,582 16,992 29,666 36,849<br />
2007 Est. Elementary (0 to 8) 16.4% 20.1% 18.1% 17.6%<br />
2007 Est. Some High School (9 to 11) 8.4% 7.9% 7.1% 6.8%<br />
2007 Est. High School Graduate (12) 31.8% 28.0% 27.4% 27.2%<br />
2007 Est. Some College (13 to 16) 22.8% 21.4% 22.5% 22.6%<br />
2007 Est. Associate Degree Only 8.6% 11.7% 12.1% 12.6%<br />
2007 Est. Bachelor Degree Only 8.1% 8.0% 9.5% 9.9%<br />
2007 Est. Graduate Degree 4.0% 3.0% 3.3% 3.3%<br />
2007 Est. Total Housing Units 2,058 9,753 16,816 20,755<br />
2007 Est. Owner Occupied Percent 45.5% 49.9% 55.9% 57.9%<br />
2007 Est. Renter Occupied Percent 48.7% 45.0% 39.3% 37.3%<br />
2007 Est. Vacant Housing Percent 5.8% 5.1% 4.8% 4.8%<br />
2000 Homes Built 1999 to 2000 3.2% 2.9% 2.7% 2.4%<br />
2000 Homes Built 1995 to 1998 9.1% 8.1% 9.1% 9.5%<br />
2000 Homes Built 1990 to 1994 7.6% 6.3% 9.5% 11.2%<br />
2000 Homes Built 1980 to 1989 24.6% 15.7% 17.1% 18.0%<br />
2000 Homes Built 1970 to 1979 30.0% 19.3% 19.0% 18.6%<br />
2000 Homes Built 1960 to 1969 11.9% 14.2% 16.0% 15.0%<br />
2000 Homes Built 1950 to 1959 8.4% 14.6% 12.6% 11.7%<br />
2000 Homes Built Before 1949 5.3% 18.9% 14.0% 13.6%<br />
2000 Home Value $1,000,000 or More - 0.1% 0.1% 0.1%<br />
2000 Home Value $500,000 to $999,999 - - 0.0% 0.1%<br />
2000 Home Value $400,000 to $499,999 - - 0.0% 0.0%<br />
2000 Home Value $300,000 to $399,999 2.1% 0.8% 0.7% 0.8%<br />
2000 Home Value $200,000 to $299,999 4.2% 2.5% 3.4% 4.3%<br />
2000 Home Value $150,000 to $199,999 11.1% 7.9% 10.2% 11.9%<br />
2000 Home Value $100,000 to $149,999 25.2% 23.8% 30.4% 32.0%<br />
2000 Home Value $50,000 to $99,999 52.1% 57.2% 50.4% 46.3%<br />
2000 Home Value $25,000 to $49,999 4.0% 6.1% 3.6% 3.3%<br />
2000 Home Value $0 to $24,999 1.3% 1.6% 1.1% 1.2%<br />
2000 Median Home Value $ 99,434 $ 93,065 $ 101,876 $ 106,182<br />
2000 Median Rent $ 352 $ 337 $ 370 $ 385<br />
This report was produced using data from private <strong>and</strong> government sources deemed to be reliable. The information herein is provided without representation or warranty.<br />
©2010, Sites USA, Ch<strong>and</strong>ler, Arizona, 480-491-1112 - 2 of 3 - Demographic Source: Applied Geographic Solutions / TIGER Geography 08/07
FULL DEMOGRAPHIC PROFILE<br />
1990 - 2000 Census, 2007 Estimates & 2012 Projections<br />
Calculated using Proportional Block Groups<br />
Prepared For<br />
Commercial Retail Associates, <strong>Inc</strong>.<br />
Lat/Lon: 36.328006/-119.672968<br />
September 2010<br />
RF1<br />
12th Avenue & Lacey Blvd<br />
Hanford, California<br />
1.00 mi<br />
radius<br />
2.00 mi<br />
radius<br />
3.00 mi<br />
radius<br />
5.00 mi<br />
radius<br />
OCCUPATION LABOR FORCE<br />
TRANSPORTATION<br />
TO WORK<br />
TRAVEL TIME<br />
CONSUMER EXPENDITURE<br />
2007 Est. Labor: Population Age 16+ 4,430 20,931 35,945 44,392<br />
2007 Est. Civilian Employed 54.4% 54.4% 56.8% 57.4%<br />
2007 Est. Civilian Unemployed 8.2% 10.8% 9.7% 9.6%<br />
2007 Est. in Armed Forces 1.5% 1.3% 1.3% 1.5%<br />
2007 Est. not in Labor Force 35.9% 33.5% 32.2% 31.6%<br />
2007 Labor Force: Males 50.5% 48.9% 48.7% 48.9%<br />
2007 Labor Force: Females 49.5% 51.1% 51.3% 51.1%<br />
2000 Occupation: Population Age 16+ 1,745 8,443 15,700 19,887<br />
2000 Mgmt, Business, & Financial Operations 12.5% 9.8% 10.1% 10.4%<br />
2000 Professional <strong>and</strong> Related 19.2% 16.4% 18.0% 18.0%<br />
2000 Service 21.6% 23.5% 22.0% 21.2%<br />
2000 Sales <strong>and</strong> Office 25.3% 21.2% 23.1% 23.7%<br />
2000 Farming, Fishing, <strong>and</strong> Forestry 2.2% 4.9% 4.4% 4.7%<br />
2000 Construction, Extraction, & Maintenance 5.3% 8.5% 7.8% 7.9%<br />
2000 Production, Transport, & Material Moving 13.8% 15.7% 14.6% 14.0%<br />
2000 Percent White Collar Workers 57.0% 47.4% 51.1% 52.1%<br />
2000 Percent Blue Collar Workers 43.0% 52.6% 48.9% 47.9%<br />
2000 Drive to Work Alone 77.6% 73.2% 76.9% 77.7%<br />
2000 Drive to Work in Carpool 13.8% 16.5% 14.9% 14.3%<br />
2000 Travel to Work by Public Transportation 2.2% 1.6% 1.1% 1.1%<br />
2000 Drive to Work on Motorcycle - 0.3% 0.5% 0.4%<br />
2000 Walk or Bicycle to Work 2.7% 4.4% 2.9% 2.7%<br />
2000 Other Means 1.2% 1.7% 1.3% 1.3%<br />
2000 Work at Home 2.5% 2.4% 2.3% 2.5%<br />
2000 Travel to Work in 14 Minutes or Less 46.9% 49.3% 46.7% 45.5%<br />
2000 Travel to Work in 15 to 29 Minutes 28.7% 27.7% 28.3% 29.3%<br />
2000 Travel to Work in 30 to 59 Minutes 20.3% 19.1% 20.9% 21.3%<br />
2000 Travel to Work in 60 Minutes or More 4.1% 3.9% 4.0% 3.9%<br />
2000 Average Travel Time to Work 19.5 18.4 19.5 19.5<br />
2007 Est. Total Household Expenditure (in Millions) $ 95.2 $ 433.3 $ 793.6 $ 1,001.3<br />
2007 Est. Apparel $ 4.6 $ 20.9 $ 38.3 $ 48.3<br />
2007 Est. Contributions & Gifts $ 5.9 $ 26.1 $ 48.6 $ 61.5<br />
2007 Est. Education & Reading $ 2.5 $ 11.3 $ 21.0 $ 26.5<br />
2007 Est. Entertainment $ 5.3 $ 24.0 $ 44.1 $ 55.8<br />
2007 Est. Food, Beverages & Tobacco $ 15.5 $ 71.1 $ 129.1 $ 162.6<br />
2007 Est. Furnishings And Equipment $ 4.0 $ 18.2 $ 33.9 $ 43.0<br />
2007 Est. Health Care & Insurance $ 6.9 $ 31.6 $ 57.3 $ 72.1<br />
2007 Est. Household Operations & Shelter & Utilities $ 28.5 $ 129.8 $ 237.3 $ 299.4<br />
2007 Est. Miscellaneous Expenses $ 1.6 $ 7.3 $ 13.3 $ 16.7<br />
2007 Est. Personal Care $ 1.4 $ 6.3 $ 11.5 $ 14.6<br />
2007 Est. Transportation $ 18.9 $ 86.5 $ 159.0 $ 201.0<br />
This report was produced using data from private <strong>and</strong> government sources deemed to be reliable. The information herein is provided without representation or warranty.<br />
©2010, Sites USA, Ch<strong>and</strong>ler, Arizona, 480-491-1112 - 3 of 3 - Demographic Source: Applied Geographic Solutions / TIGER Geography 08/07