Shop Space Available - Paynter Realty and Investments, Inc.
Shop Space Available - Paynter Realty and Investments, Inc.
Shop Space Available - Paynter Realty and Investments, Inc.

Create successful ePaper yourself
Turn your PDF publications into a flip-book with our unique Google optimized e-Paper software.
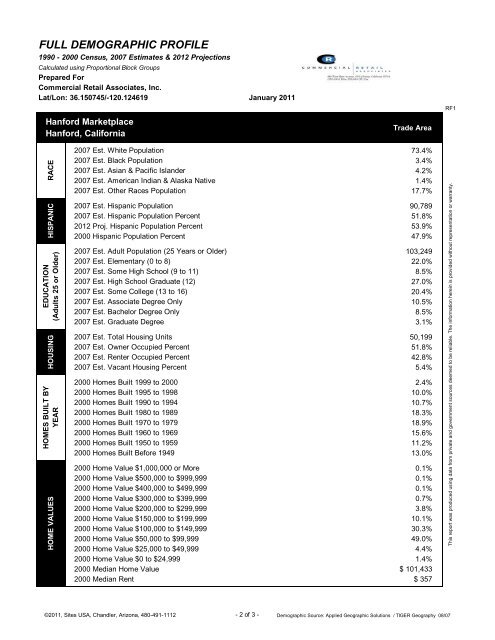
FULL DEMOGRAPHIC PROFILE<br />
1990 - 2000 Census, 2007 Estimates & 2012 Projections<br />
Calculated using Proportional Block Groups<br />
Prepared For<br />
Commercial Retail Associates, <strong>Inc</strong>.<br />
Lat/Lon: 36.150745/-120.124619<br />
Hanford Marketplace<br />
Hanford, California<br />
January 2011<br />
Trade Area<br />
RF1<br />
RACE<br />
HISPANIC<br />
EDUCATION<br />
(Adults 25 or Older)<br />
HOMES BUILT BY<br />
HOME VALUES HOUSING<br />
YEAR<br />
2007 Est. White Population 73.4%<br />
2007 Est. Black Population 3.4%<br />
2007 Est. Asian & Pacific Isl<strong>and</strong>er 4.2%<br />
2007 Est. American Indian & Alaska Native 1.4%<br />
2007 Est. Other Races Population 17.7%<br />
2007 Est. Hispanic Population 90,789<br />
2007 Est. Hispanic Population Percent 51.8%<br />
2012 Proj. Hispanic Population Percent 53.9%<br />
2000 Hispanic Population Percent 47.9%<br />
2007 Est. Adult Population (25 Years or Older) 103,249<br />
2007 Est. Elementary (0 to 8) 22.0%<br />
2007 Est. Some High School (9 to 11) 8.5%<br />
2007 Est. High School Graduate (12) 27.0%<br />
2007 Est. Some College (13 to 16) 20.4%<br />
2007 Est. Associate Degree Only 10.5%<br />
2007 Est. Bachelor Degree Only 8.5%<br />
2007 Est. Graduate Degree 3.1%<br />
2007 Est. Total Housing Units 50,199<br />
2007 Est. Owner Occupied Percent 51.8%<br />
2007 Est. Renter Occupied Percent 42.8%<br />
2007 Est. Vacant Housing Percent 5.4%<br />
2000 Homes Built 1999 to 2000 2.4%<br />
2000 Homes Built 1995 to 1998 10.0%<br />
2000 Homes Built 1990 to 1994 10.7%<br />
2000 Homes Built 1980 to 1989 18.3%<br />
2000 Homes Built 1970 to 1979 18.9%<br />
2000 Homes Built 1960 to 1969 15.6%<br />
2000 Homes Built 1950 to 1959 11.2%<br />
2000 Homes Built Before 1949 13.0%<br />
2000 Home Value $1,000,000 or More 0.1%<br />
2000 Home Value $500,000 to $999,999 0.1%<br />
2000 Home Value $400,000 to $499,999 0.1%<br />
2000 Home Value $300,000 to $399,999 0.7%<br />
2000 Home Value $200,000 to $299,999 3.8%<br />
2000 Home Value $150,000 to $199,999 10.1%<br />
2000 Home Value $100,000 to $149,999 30.3%<br />
2000 Home Value $50,000 to $99,999 49.0%<br />
2000 Home Value $25,000 to $49,999 4.4%<br />
2000 Home Value $0 to $24,999 1.4%<br />
2000 Median Home Value $ 101,433<br />
2000 Median Rent $ 357<br />
This report was produced using data from private <strong>and</strong> government sources deemed to be reliable. The information herein is provided without representation or warranty.<br />
©2011, Sites USA, Ch<strong>and</strong>ler, Arizona, 480-491-1112 - 2 of 3 - Demographic Source: Applied Geographic Solutions / TIGER Geography 08/07