Australian Production of Ceramic Tiles - Infotile
Australian Production of Ceramic Tiles - Infotile
Australian Production of Ceramic Tiles - Infotile

You also want an ePaper? Increase the reach of your titles
YUMPU automatically turns print PDFs into web optimized ePapers that Google loves.
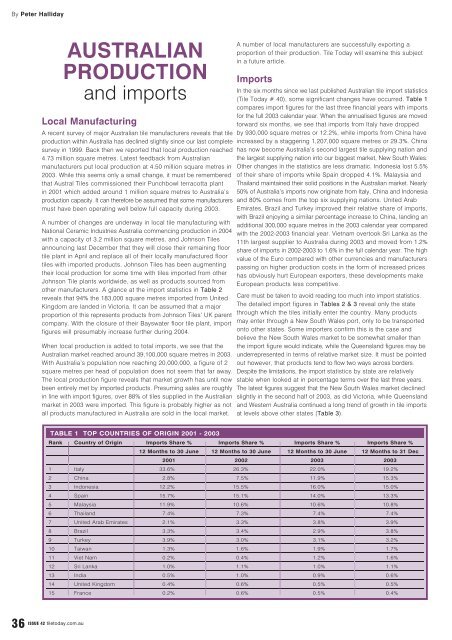
By Peter Halliday<br />
AUSTRALIAN<br />
PRODUCTION<br />
and imports<br />
Local Manufacturing<br />
A recent survey <strong>of</strong> major <strong>Australian</strong> tile manufacturers reveals that tile<br />
production within Australia has declined slightly since our last complete<br />
survey in 1999. Back then we reported that local production reached<br />
4.73 million square metres. Latest feedback from <strong>Australian</strong><br />
manufacturers put local production at 4.50 million square metres in<br />
2003. While this seems only a small change, it must be remembered<br />
that Austral <strong>Tiles</strong> commissioned their Punchbowl terracotta plant<br />
in 2001 which added around 1 million square metres to Australia’s<br />
production capacity. It can therefore be assumed that some manufacturers<br />
must have been operating well below full capacity during 2003.<br />
A number <strong>of</strong> changes are underway in local tile manufacturing with<br />
National <strong>Ceramic</strong> Industries Australia commencing production in 2004<br />
with a capacity <strong>of</strong> 3.2 million square metres, and Johnson <strong>Tiles</strong><br />
announcing last December that they will close their remaining floor<br />
tile plant in April and replace all <strong>of</strong> their locally manufactured floor<br />
tiles with imported products. Johnson <strong>Tiles</strong> has been augmenting<br />
their local production for some time with tiles imported from other<br />
Johnson Tile plants worldwide, as well as products sourced from<br />
other manufacturers. A glance at the import statistics in Table 2<br />
reveals that 94% the 183,000 square metres imported from United<br />
Kingdom are landed in Victoria. It can be assumed that a major<br />
proportion <strong>of</strong> this represents products from Johnson <strong>Tiles</strong>’ UK parent<br />
company. With the closure <strong>of</strong> their Bayswater floor tile plant, import<br />
figures will presumably increase further during 2004.<br />
When local production is added to total imports, we see that the<br />
<strong>Australian</strong> market reached around 39,100,000 square metres in 2003.<br />
With Australia’s population now reaching 20,000,000, a figure <strong>of</strong> 2<br />
square metres per head <strong>of</strong> population does not seem that far away.<br />
The local production figure reveals that market growth has until now<br />
been entirely met by imported products. Presuming sales are roughly<br />
in line with import figures, over 88% <strong>of</strong> tiles supplied in the <strong>Australian</strong><br />
market in 2003 were imported. This figure is probably higher as not<br />
all products manufactured in Australia are sold in the local market.<br />
A number <strong>of</strong> local manufacturers are successfully exporting a<br />
proportion <strong>of</strong> their production. Tile Today will examine this subject<br />
in a future article.<br />
Imports<br />
In the six months since we last published <strong>Australian</strong> tile import statistics<br />
(Tile Today # 40), some significant changes have occurred. Table 1<br />
compares import figures for the last three financial years with imports<br />
for the full 2003 calendar year. When the annualised figures are moved<br />
forward six months, we see that imports from Italy have dropped<br />
by 930,000 square metres or 12.2%, while imports from China have<br />
increased by a staggering 1,207,000 square metres or 29.3%. China<br />
has now become Australia’s second largest tile supplying nation and<br />
the largest supplying nation into our biggest market, New South Wales.<br />
Other changes in the statistics are less dramatic. Indonesia lost 5.5%<br />
<strong>of</strong> their share <strong>of</strong> imports while Spain dropped 4.1%. Malaysia and<br />
Thailand maintained their solid positions in the <strong>Australian</strong> market. Nearly<br />
50% <strong>of</strong> Australia’s imports now originate from Italy, China and Indonesia<br />
and 80% comes from the top six supplying nations. United Arab<br />
Emirates, Brazil and Turkey improved their relative share <strong>of</strong> imports,<br />
with Brazil enjoying a similar percentage increase to China, landing an<br />
additional 300,000 square metres in the 2003 calendar year compared<br />
with the 2002-2003 financial year. Vietnam overtook Sri Lanka as the<br />
11th largest supplier to Australia during 2003 and moved from 1.2%<br />
share <strong>of</strong> imports in 2002-2003 to 1.6% in the full calendar year. The high<br />
value <strong>of</strong> the Euro compared with other currencies and manufacturers<br />
passing on higher production costs in the form <strong>of</strong> increased prices<br />
has obviously hurt European exporters, these developments make<br />
European products less competitive.<br />
Care must be taken to avoid reading too much into import statistics.<br />
The detailed import figures in Tables 2 & 3 reveal only the state<br />
through which the tiles initially enter the country. Many products<br />
may enter through a New South Wales port, only to be transported<br />
onto other states. Some importers confirm this is the case and<br />
believe the New South Wales market to be somewhat smaller than<br />
the import figure would indicate, while the Queensland figures may be<br />
underrepresented in terms <strong>of</strong> relative market size. It must be pointed<br />
out however, that products tend to flow two ways across borders.<br />
Despite the limitations, the import statistics by state are relatively<br />
stable when looked at in percentage terms over the last three years.<br />
The latest figures suggest that the New South Wales market declined<br />
slightly in the second half <strong>of</strong> 2003, as did Victoria, while Queensland<br />
and Western Australia continued a long trend <strong>of</strong> growth in tile imports<br />
at levels above other states (Table 3).<br />
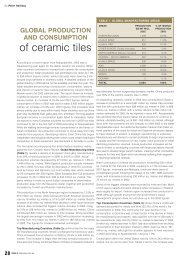
TABLE 1 TOP COUNTRIES OF ORIGIN 2001 - 2003<br />
Rank Country <strong>of</strong> Origin Imports Share % Imports Share % Imports Share % Imports Share %<br />
12 Months to 30 June 12 Months to 30 June 12 Months to 30 June 12 Months to 31 Dec<br />
2001 2002 2003 2003<br />
1 Italy 33.6% 26.3% 22.0% 19.2%<br />
2 China 2.8% 7.5% 11.9% 15.3%<br />
3 Indonesia 12.2% 15.5% 16.0% 15.0%<br />
4 Spain 15.7% 15.1% 14.0% 13.3%<br />
5 Malaysia 11.9% 10.6% 10.6% 10.8%<br />
6 Thailand 7.4% 7.3% 7.4% 7.4%<br />
7 United Arab Emirates 2.1% 3.3% 3.8% 3.9%<br />
8 Brazil 3.3% 3.4% 2.9% 3.8%<br />
9 Turkey 3.9% 3.0% 3.1% 3.2%<br />
10 Taiwan 1.3% 1.6% 1.9% 1.7%<br />
11 Viet Nam 0.2% 0.4% 1.2% 1.6%<br />
12 Sri Lanka 1.0% 1.1% 1.0% 1.1%<br />
13 India 0.5% 1.0% 0.9% 0.6%<br />
14 United Kingdom 0.4% 0.6% 0.5% 0.5%<br />
15 France 0.2% 0.6% 0.5% 0.4%<br />
36<br />
ISSUE 42 tiletoday.com.au
TABLE 2 AUSTRALIAN IMPORTS JAN-DEC 2003<br />
COUNTRY OF ORIGIN NSW NT QLD SA TAS VIC WA TOTAL M 2<br />
ARGENTINA 94,127 1,440 1,535 97,102<br />
BELIZE 1,520 1,520<br />
BRAZIL 455,127 2,574 393,939 106,496 9,231 275,542 76,688 1,319,596<br />
CANADA 39 10,498 10,537<br />
CHILE 30 30<br />
CHINA 2,372,504 3,644 1,347,298 290,911 2,206 1,076,005 230,176 5,322,743<br />
CZECH REPUBLIC 8,201 1,840 10,041<br />
EAST TIMOR, DEM REP OF 1,819 1,819<br />
EGYPT 2,569 1,166 3,736<br />
FIJI 100 100<br />
FRANCE 64,978 49,423 6,127 1,616 17,340 11,393 150,877<br />
GERMANY 14,737 6,413 1 16,277 1,340 38,769<br />
GREECE 699 47,547 10 48,256<br />
HONG KONG (SAR OF CHINA) 39,132 3 8,419 3,799 3,622 54,975<br />
HUNGARY 660 122 8,179 8,961<br />
INDIA 104,537 1,419 112,048 31 218,034<br />
INDONESIA 1,699,830 92,780 1,553,394 162,988 81,297 1,000,269 620,996 5,211,553<br />
IRAN 22,363 13,217 35,580<br />
IRELAND 1,364 1 1,365<br />
ISRAEL 414 5,330 5,744<br />
ITALY 2,296,532 44,318 1,333,315 393,128 25,063 1,209,747 1,376,943 6,679,047<br />
JAPAN 15,527 119,733 11,517 1,695 148,472<br />
KOREA, REPUBLIC OF 37,534 2,822 3,663 2,918 46,937<br />
LEBANON 90 90<br />
MALAYSIA 1,121,704 40,747 1,257,376 248,239 14,046 842,305 248,979 3,773,395<br />
MEXICO 15,484 5 2,190 17,679<br />
MOROCCO 20 20<br />
NEW ZEALAND 2,808 135 23 1,417 160 4,543<br />
PAKISTAN 6 6<br />
PHILIPPINES 63,003 3,881 1,260 11,340 79,484<br />
PORTUGAL 57,550 8,749 1,146 42,569 15,619 125,633<br />
SAUDI ARABIA 5,855 41 5,896<br />
SINGAPORE 9,835 502 18,816 23 2,095 333 31,604<br />
SOUTH AFRICA 6,905 4,700 420 2,837 12 14,874<br />
SPAIN 2,141,185 11,211 983,577 218,734 46,892 525,187 720,444 4,647,230<br />
SRI LANKA 85,961 105,766 36,078 144,952 372,757<br />
TAIWAN 113,212 4,034 281,882 9,669 137,242 29,655 575,695<br />
THAILAND 1,186,298 679,012 46,876 444,217 222,441 2,578,843<br />
TURKEY 473,424 192,295 155,047 223,506 67,819 1,112,092<br />
UNITED ARAB EMIRATES 661,608 5,401 307,381 63,422 9,058 273,521 25,915 1,346,305<br />
UNITED KINGDOM 7,183 23 77 173,625 2,376 183,285<br />
UNITED STATES OF AMERICA 1,256 117 39 1,364 2,776<br />
VIET NAM 69,890 293,722 45,500 102,151 32,391 543,654<br />
GRAND TOTAL M 2 13,248,328 212,889 8,956,421 1,755,370 189,411 6,610,999 3,858,236 34,831,653<br />
STATE SHARE 38.0% 0.6% 25.7% 5.0% 0.5% 19.0% 11.1% 100.0%<br />
TABLE 3 STATE SHARE OF IMPORTS 2001 - 2003<br />
Financial Year NSW NT QLD SA TAS VIC WA Grand Total<br />
2000-2001 11,251,294 206,112 5,588,429 1,401,704 119,307 4,858,969 2,525,215 25,951,030<br />
2001-2002 11,563,548 189,029 6,741,828 1,456,191 155,748 5,868,667 2,984,995 28,960,005<br />
2002-2003 13,515,022 201,080 8,367,514 1,765,137 186,127 6,708,740 3,858,832 34,602,453<br />
2000-2001 43.4% 0.8% 21.5% 5.4% 0.5% 18.7% 9.7% 100.0%<br />
2001-2002 39.9% 0.7% 23.3% 5.0% 0.5% 20.3% 10.3% 100.0%<br />
2002-2003 39.1% 0.6% 24.2% 5.1% 0.5% 19.4% 11.2% 100.0%<br />
<strong>Australian</strong> import figures were compiled from ABS data.<br />
tiletoday.com.au ISSUE 42<br />
37