Distributor Survey FINAL REPORT.pdf - PPAI
Distributor Survey FINAL REPORT.pdf - PPAI
Distributor Survey FINAL REPORT.pdf - PPAI

Create successful ePaper yourself
Turn your PDF publications into a flip-book with our unique Google optimized e-Paper software.
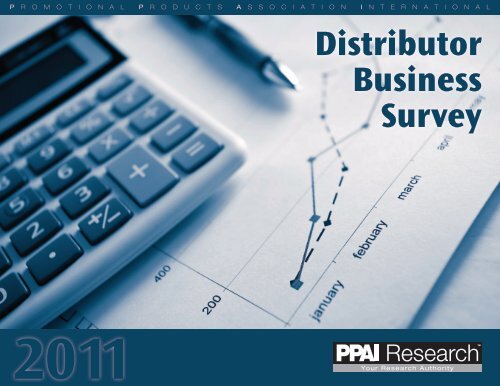
P R O M O T I O N A L P R O D U C T S A S S O C I A T I O N I N T E R N A T I O N A L<br />
<strong>Distributor</strong><br />
Business<br />
<strong>Survey</strong><br />
2011<br />
Research<br />
Your Research Authority
Dear <strong>Distributor</strong> Member-Owner:<br />
The 2011 <strong>Distributor</strong>s Business <strong>Survey</strong> is a comprehensive, up-to-date compilation of data<br />
about how distributor members of Promotional Products Association International conduct<br />
their business. This survey is the result of information supplied by member companies and is<br />
intended to provide other <strong>PPAI</strong> members with comparable statistics about how companies of<br />
similar size perform in many business categories.<br />
Methodology... The 2011 <strong>Distributor</strong>s Business <strong>Survey</strong> was e-mailed to 6,124 distributor<br />
members of <strong>PPAI</strong> at the end of September 2011. Of those, 790 member companies responded<br />
with completed questionnaires for a return rate of 12.90 which is a representative sample of<br />
the membership. The margin of error for the survey is +/-3.25% at the 95% confidence level.<br />
The survey consisted of 115 questions and features thirteen major parts: In 2008, we got 446<br />
responses for a return rate 11.02%.<br />
Business Organization.............................................................................. Page 2<br />
Business Practices................................................................................... Page 4<br />
Imports, Exports and Products................................................................ Page 8<br />
Sales Organization................................................................................... Page 14<br />
Orders, Rebates, Policies and Practices with Suppliers............................Page 20<br />
Client Sources........................................................................................... Page 23<br />
Other Business Practices.......................................................................... Page 25<br />
Promotion................................................................................................ Page 26<br />
Meetings,Training & Recruitment............................................................ Page 30<br />
Special Services........................................................................................ Page 34<br />
Commissions............................................................................................ Page 38<br />
Financial................................................................................................... Page 40<br />
Key Metrics.............................................................................................. Page 44<br />
* <strong>PPAI</strong> released a seperate Technology Report in November 2011. <strong>PPAI</strong> will also release a<br />
Compensation and Benefits study in 2012 . These two components were previously part of this<br />
report but are now seperate studies.<br />
How to Use This Report... This report, as it is designed, is a tool for you to compare your<br />
methods of operation with the methods of others of similar size, as well as with the industry as<br />
a whole. It is not our intention by publication of this report to suggest that all distributors should<br />
run their businesses in a like manner or attempt to maintain uniformity of policy.<br />
This report is to be used only by individual member companies. Because of<br />
the antitrust restrictions concerning discussions about price and related<br />
topics, this information should not be the subject of joint discussions<br />
between members. Each distributor should decide singly how, and if, the<br />
data should be utilized in reference to his or her own company operations<br />
and procedures.<br />
Responses Shown as Percentages... <strong>Survey</strong> responses are presented as<br />
percentages. Some respondents did not answer every question, and the<br />
missing responses were not counted as a part of the calculations. Also,<br />
questions that allowed a respondent to check more than one answer do not<br />
total 100 percent.<br />
Responses Classified by Company Size... <strong>Survey</strong> results have been<br />
compiled by sales volume classification for comparison purposes. The<br />
ranges of each category and the number of responses in each category are<br />
listed below. Categories have been grouped together to get valid results for<br />
each group.<br />
Confidentiality... Completed questionnaires were sent directly to the <strong>PPAI</strong><br />
Research Department. Individual responses are not identifiable and the<br />
report is presented here only in aggregate form.<br />
Thank you... The association would like to extend a personal thank you to<br />
everyone who took the time to respond to the survey. Only with your<br />
support, were we able to put together such valuable information about<br />
distributors in our industry.<br />
For more information contact:<br />
Saritha Kuruvilla<br />
Manager of Research, <strong>PPAI</strong><br />
E-mail: SarithaK@ppai.org or Research@ppai.org<br />
Phone: 972-258-3043<br />
D00 - D-2 D-3 - D-04 D-5 - D-6 D-7- D-16<br />
Under $250,001- $1,000,001- Over Total<br />
$250,000 $1,000,000 $5,000,000 $5,000,000<br />
361 283 106 40 790<br />
<strong>PPAI</strong> Page 1 of 49 December 2011
BUSINESS ORGANIZATION<br />
D00 - D-2 D-3 - D-04 D-5 - D-6 D-7- D-16<br />
Under $250,001- $1,000,001- Over Total<br />
$250,000 $1,000,000 $5,000,000 $5,000,000<br />
1. Is your distributorship a: Proprietorship 33% 32% 6% 3% 28%<br />
C-corporation 18% 20% 27% 48% 21%<br />
Partnership 4% 3% 8% 3% 4%<br />
S-corporation 21% 23% 40% 33% 25%<br />
LLC 23% 21% 20% 15% 22%<br />
2. What is the primary industry UPIC 1% 3% 1% 5% 2%<br />
identifier that your company ASI 17% 28% 48% 55% 27%<br />
uses when conducting <strong>PPAI</strong> 50% 43% 27% 18% 42%<br />
day to day business SAGE 25% 23% 18% 15% 23%<br />
Other 7% 4% 7% 8% 6%<br />
3. How many employees (other 1 17% 19% 7% 0% 16%<br />
than sales people) do 2 30% 37% 7% 0% 28%<br />
you have (Count 2 3 to 4 32% 32% 37% 3% 31%<br />
part-time employees as 1 5 to 7 8% 6% 29% 8% 10%<br />
full time.) Select the 7 to 10 6% 3% 7% 25% 6%<br />
number of emplyees below: 11 to 49 5% 2% 12% 45% 7%<br />
50+ 2% 1% 2% 20% 2%<br />
<strong>PPAI</strong> Page 2 of 49 December 2011
D00 - D-2 D-3 - D-04 D-5 - D-6 D-7- D-16<br />
Under $250,001- $1,000,001- Over Total<br />
$250,000 $1,000,000 $5,000,000 $5,000,000<br />
4. How long has this 1 to 5 years 36% 26% 10% 3% 27%<br />
distributorship (not you as an 6 to 10 years 19% 22% 15% 8% 19%<br />
individual) been in business 11 to 15 years 15% 15% 24% 15% 16%<br />
16 to 20 years 8% 12% 18% 10% 11%<br />
21 + years 23% 25% 33% 65% 27%<br />
5. In how many states does 1 state 76% 76% 64% 36% 72%<br />
your firm have a presence (an 2 to 3 states 17% 15% 18% 18% 16%<br />
office or salespeople 4+ states 8% 9% 18% 46% 12%<br />
that generate sales)<br />
6. Is the majority owner (at A woman 46% 48% 37% 30% 45%<br />
least 51% owned, controlled A minority 12% 7% 7% 0% 9%<br />
and managed) of your company: Neither 47% 47% 60% 70% 50%<br />
*Total may be greater than 100% because this is a multiple response question.<br />
7. Is your main/primary office: Rented space 28% 25% 51% 48% 31%<br />
Company owned space 12% 9% 15% 20% 12%<br />
Principal owned space<br />
leased to the company 6% 6% 22% 30% 9%<br />
Part of your residence 53% 59% 11% 0% 47%<br />
Other 1% 1% 1% 3% 1%<br />
<strong>PPAI</strong> Page 3 of 49 December 2011
BUSINESS PRACTICES<br />
8. Does your company operate<br />
from a formal/written business<br />
plan (Please check one.)<br />
D00 - D-2 D-3 - D-04 D-5 - D-6 D-7- D-16<br />
Under $250,001- $1,000,001- Over Total<br />
$250,000 $1,000,000 $5,000,000 $5,000,000<br />
Reviewed and revised<br />
monthly 3% 1% 2% 13% 2%<br />
Reviewed and revised<br />
quarterly 6% 6% 9% 20% 7%<br />
Reviewed and revised<br />
semi-annually 3% 5% 10% 13% 5%<br />
Reviewed and revised<br />
annually<br />
No - do not operate from<br />
21% 23% 18% 25% 22%<br />
a formal business plan 67% 65% 60% 30% 63%<br />
9. How often is a profit and Monthly 31% 34% 60% 93% 39%<br />
loss statement or statement Quarterly 22% 24% 21% 5% 22%<br />
of income prepared for your Semi-annually 8% 5% 2% 0% 6%<br />
business (Please check one.) Annually 34% 30% 17% 3% 28%<br />
Never 6% 6% 0% 0% 5%<br />
10. What types of insurance do Product liability 23% 27% 50% 63% 31%<br />
you carry (Check all that apply.) General liability 90% 93% 95% 100% 92%<br />
Errors & omissions insurance 11% 13% 14% 38% 14%<br />
*Total may be greater than 100% because this is a multiple response question.<br />
Legal insurance 13% 13% 14% 33% 14%<br />
Key Man insurance 9% 13% 19% 53% 15%<br />
Other 7% 5% 5% 5% 6%<br />
<strong>PPAI</strong> Page 4 of 49 December 2011
D00 - D-2 D-3 - D-04 D-5 - D-6 D-7- D-16<br />
Under $250,001- $1,000,001- Over Total<br />
$250,000 $1,000,000 $5,000,000 $5,000,001<br />
11. Do you belong to a group<br />
We belong industry<br />
affiliated affinity group 5% 3% 5% 3% 4%<br />
providing employee benefit<br />
We belong to an out of<br />
industry group 20% 23% 21% 24% 21%<br />
or insurance services<br />
We have an individual<br />
plan 61% 57% 66% 74% 61%<br />
(Please check one.) Other 14% 17% 7% 0% 13%<br />
12. What are your prompt Discount under 10 days 9% 7% 7% 10% 8%<br />
payment terms Discount under 15 days 2% 1% 1% 0% 2%<br />
(Please check one.) Discount under 30 days 5% 3% 5% 10% 4%<br />
No prompt payment terms 78% 84% 83% 72% 80%<br />
Other 6% 5% 5% 8% 6%<br />
13. What are your standard C.O.D.- receipt 20% 14% 11% 5% 16%<br />
prepayment terms of sale Deposit with order 48% 49% 42% 51% 48%<br />
(Please check one.) Upfront full payment 14% 13% 18% 5% 13%<br />
Credit card guarantee on order 19% 24% 28% 38% 23%<br />
14. What are your standard terms Net 10 days 14% 17% 6% 13% 14%<br />
of sale (Please check one.) Net 15 days 15% 15% 13% 5% 14%<br />
Net 20 days 4% 4% 4% 5% 4%<br />
Net 30 days 55% 51% 67% 78% 56%<br />
Other 13% 12% 10% 0% 11%<br />
<strong>PPAI</strong> Page 5 of 49 December 2011
D00 - D-2 D-3 - D-04 D-5 - D-6 D-7- D-16<br />
Under $250,001- $1,000,001- Over Total<br />
$250,000 $1,000,000 $5,000,000 $5,000,000<br />
15. Do you charge a monthly 1%-2% 25% 24% 30% 23% 25%<br />
finance charge on delinquent More than 2% 4% 2% 4% 0% 3%<br />
account(s) No charge 71% 74% 66% 77% 71%<br />
16. Who collects delinquent Office staff 41% 42% 59% 69% 46%<br />
accounts (Please check all Salespeople 12% 20% 31% 46% 19%<br />
that apply) Principal 52% 56% 45% 21% 50%<br />
*Total may be greater than 100% because this is a multiple response question.<br />
17. What payment methods do<br />
you accept (Please check<br />
Attorney 2% 3% 5% 10% 3%<br />
Collection agency 6% 5% 8% 23% 7%<br />
Small claims court 2% 3% 6% 8% 3%<br />
Dedicated collections dept. 1% 1% 2% 13% 2%<br />
Other 5% 3% 2% 5% 4%<br />
Bank cards (Visa,<br />
MasterCard) 73% 73% 90% 95% 77%<br />
Credit cards (AmEx,<br />
Discover) 59% 56% 82% 88% 63%<br />
all that apply.) ACH transfers 28% 27% 47% 63% 32%<br />
*Total may be greater than 100% because this is a multiple response question.<br />
Wire transfers 25% 24% 41% 80% 30%<br />
Paypal type online<br />
electronic transfers 30% 23% 28% 40% 27%<br />
Do not accept electronic<br />
or card payments 15% 15% 5% 0% 13%<br />
Other 18% 19% 7% 8% 16%<br />
18. Do you use an industry affinity Bank 37% 35% 49% 67% 40%<br />
service or your bank for credit<br />
Industry related affinity<br />
service 28% 25% 34% 26% 28%<br />
card processing (Please<br />
Do not accept electronic<br />
or card payments 20% 22% 5% 3% 18%<br />
check all that apply.) Other 18% 19% 14% 5% 17%<br />
*Total may be greater than 100% because this is a multiple response question.<br />
<strong>PPAI</strong> Page 6 of 49 December 2011
D00 - D-2 D-3 - D-04 D-5 - D-6 D-7- D-16<br />
Under $250,001- $1,000,001- Over Total<br />
$250,000 $1,000,000 $5,000,000 $5,000,000<br />
19. Do you charge a processing or Yes 9% 8% 17% 25% 11%<br />
handling charge for credit No 91% 92% 83% 75% 89%<br />
card orders<br />
20. How often do you take Never 23% 18% 6% 8% 18%<br />
discounts on supplier invoice Rarely 27% 28% 40% 15% 28%<br />
payments Occasionally 25% 23% 23% 28% 24%<br />
Fairly often 7% 10% 8% 5% 8%<br />
Most of the time 8% 10% 11% 15% 10%<br />
Always 9% 12% 13% 30% 12%<br />
21. Do you have a certified Yes 9% 7% 10% 38% 10%<br />
accountant on staff No 91% 93% 90% 62% 90%<br />
22. Do you use an outside Yes, for bookkeeping 25% 25% 24% 8% 24%<br />
bookkeeping or accounting firm Yes, for taxes 72% 77% 86% 75% 76%<br />
for the following: (Please No, Yes, do for not audit/review use ouside 24% 25% 44% 65% 30%<br />
check those that apply.)<br />
bookkeeping or<br />
accounting firm 23% 18% 11% 15% 19%<br />
Other 2% 4% 3% 3% 3%<br />
*Total may be greater than 100% because this is a multiple response question.<br />
23. Does your firm belong to a Yes 37% 41% 51% 65% 42%<br />
regional promotional product No 63% 59% 49% 35% 58%<br />
association<br />
<strong>PPAI</strong> Page 7 of 49 December 2011
IMPORTS, EXPORTS AND PRODUCT<br />
D00 - D-2 D-3- D-4 D-5 - D-6 D-7- D-16<br />
Under $250,001- $1,000,001- Over Total<br />
$250,000 $1,000,000 $5,000,000 $5,000,000<br />
24. Do you sell and ship to Yes 25% 25% 44% 80% 31%<br />
customers located outside No 75% 75% 56% 20% 69%<br />
the U.S.<br />
25. What percentage of your sales 1% 55% 42% 41% 45% 47%<br />
do these exports that you 2-3% 14% 25% 22% 33% 22%<br />
refer to above amount to 4-5% 11% 12% 20% 18% 14%<br />
6% or more 20% 22% 18% 3% 18%<br />
26. Do you buy products that are Yes 36% 44% 55% 60% 43%<br />
shipped directly from supplier No 64% 56% 45% 40% 57%<br />
factories located outside the<br />
U.S.<br />
27. What types of products that Wearables 35% 37% 47% 56% 40%<br />
you buy are shipped directly Bags 45% 31% 56% 67% 44%<br />
from overseas (Please check Games/Toys 13% 11% 11% 22% 13%<br />
all that apply.) Recognition Awards/Jewelry 12% 20% 18% 26% 17%<br />
Stickers/Decals 6% 2% 5% 7% 5%<br />
Drinkware 19% 8% 19% 37% 16%<br />
Texiles 13% 7% 13% 26% 12%<br />
Electronic Devices 23% 31% 31% 33% 28%<br />
Writing Instruments 19% 17% 31% 37% 22%<br />
Desk Accessories 11% 9% 16% 22% 12%<br />
Sporting Goods 8% 7% 3% 7% 7%<br />
Buttons/Badges 11% 12% 6% 11% 10%<br />
Automotive Accessories 5% 1% 5% 7% 4%<br />
Housewares 7% 6% 6% 11% 7%<br />
Other 19% 18% 11% 15% 17%<br />
<strong>PPAI</strong> Page 8 of 49 December 2011
28. What percentage of your sales U.S. based suppliers<br />
D00 - D-2 D-3- D-4 D-5 - D-6 D-7- D-16<br />
Under $250,001- $1,000,001- Over Total<br />
$250,000 $1,000,000 $5,000,000 $5,000,000<br />
is attributed to products 0% 3% 1% 1% 0% 2%<br />
sourced from the following 1-10% 0% 1% 0% 0% 0%<br />
Please enter a number for 11-20% 0% 2% 2% 5% 1%<br />
each: 21-30% 1% 2% 2% 3% 2%<br />
31-40% 2% 2% 2% 0% 2%<br />
41-50% 5% 4% 7% 5% 5%<br />
51-60% 1% 2% 2% 5% 2%<br />
61-70% 2% 3% 5% 5% 3%<br />
71-80% 9% 11% 12% 25% 11%<br />
81-90% 13% 18% 12% 18% 15%<br />
91-100% 62% 54% 55% 35% 56%<br />
US based non-industry<br />
suppliers<br />
0% 42% 37% 33% 9% 36%<br />
1-10% 36% 43% 45% 54% 41%<br />
11-20% 12% 9% 8% 20% 11%<br />
21-30% 5% 5% 4% 6% 5%<br />
31-40% 1% 3% 1% 3% 2%<br />
41-50% 2% 2% 4% 6% 3%<br />
51-60% 2% 1% 3% 0% 1%<br />
61-70% 1% 0% 0% 0% 0%<br />
71-80% 0% 2% 0% 3% 1%<br />
81-90% 1% 0% 0% 0% 0%<br />
91-100% 1% 1% 1% 0% 1%<br />
<strong>PPAI</strong> Page 9 of 49 December 2011
28. What percentage of your sales U.S. based brokers<br />
D00 - D-2 D-3 - D-04 D-5 - D-6 D-7- D-16<br />
Under $250,001- $1,000,001- Over Total<br />
$250,000 $1,000,000 $5,000,000 $5,000,000<br />
is attributed to products 0% 64% 56% 73% 40% 61%<br />
sourced from the following 1-10% 26% 27% 21% 56% 28%<br />
Please enter a number for 11-20% 4% 8% 2% 0% 5%<br />
each: (continued) 21-30% 2% 6% 0% 0% 3%<br />
Overseas based brokers<br />
31-40% 0% 0% 2% 0% 0%<br />
41-50% 2% 2% 0% 4% 2%<br />
51-60% 0% 1% 0% 0% 1%<br />
61-70% 0% 0% 2% 0% 0%<br />
71-80% 0% 0% 0% 0% 0%<br />
81-90% 0% 0% 0% 0% 0%<br />
91-100% 2% 0% 0% 0% 1%<br />
0% 62% 66% 58% 41% 62%<br />
1-10% 31% 27% 31% 53% 31%<br />
11-20% 1% 7% 8% 6% 5%<br />
21-30% 2% 1% 2% 0% 1%<br />
31-40% 0% 0% 0% 0% 0%<br />
41-50% 2% 0% 0% 0% 1%<br />
51-60% 0% 0% 0% 0% 0%<br />
61-70% 1% 0% 0% 0% 0%<br />
71-80% 0% 0% 0% 0% 0%<br />
81-90% 0% 0% 0% 0% 0%<br />
91-100% 1% 0% 0% 0% 0%<br />
<strong>PPAI</strong> Page 10 of 49 December 2011
28. What percentage of your sales<br />
Overseas factory w/o a<br />
middleman<br />
D00 - D-2 D-3 - D-04 D-5 - D-6 D-7- D-16<br />
Under $250,001- $1,000,001- Over Total<br />
$250,000 $1,000,000 $5,000,000 $5,000,000<br />
is attributed to products 0% 56% 64% 31% 25% 53%<br />
sourced from the following 1-10% 28% 23% 44% 58% 31%<br />
Please enter a number for 11-20% 5% 8% 14% 0% 7%<br />
each: (continued) 21-30% 4% 5% 11% 0% 5%<br />
Other<br />
31-40% 0% 0% 0% 8% 0%<br />
41-50% 4% 0% 0% 0% 1%<br />
51-60% 1% 0% 0% 0% 0%<br />
61-70% 0% 0% 0% 0% 0%<br />
71-80% 0% 0% 0% 0% 0%<br />
81-90% 0% 0% 0% 8% 0%<br />
91-100% 1% 1% 0% 0% 1%<br />
0% 56% 55% 44% 25% 53%<br />
1-10% 32% 29% 38% 75% 33%<br />
11-20% 0% 0% 0% 0% 0%<br />
21-30% 0% 2% 6% 0% 2%<br />
31-40% 0% 4% 0% 0% 2%<br />
41-50% 5% 0% 6% 0% 3%<br />
51-60% 0% 0% 0% 0% 0%<br />
61-70% 0% 2% 0% 0% 1%<br />
71-80% 2% 8% 0% 0% 5%<br />
81-90% 0% 0% 6% 0% 1%<br />
91-100% 5% 0% 0% 0% 2%<br />
<strong>PPAI</strong> Page 11 of 49 December 2011
D00 - D-2 D-3 - D-04 D-5 - D-6 D-7- D-16<br />
Under $250,001- $1,000,001- Over Total<br />
$250,000 $1,000,000 $5,000,000 $5,000,000<br />
29. In addition to your awards and trophies 37% 36% 38% 50% 38%<br />
promotional embroidery 60% 64% 64% 53% 62%<br />
products, do you sell any of Fund-raising programs 15% 11% 13% 10% 13%<br />
the following products/ office supplies 19% 11% 18% 18% 16%<br />
services sourced from printing 47% 54% 46% 50% 50%<br />
outside the promotional premiums 14% 14% 17% 38% 16%<br />
products industry silk-screening 51% 57% 64% 45% 55%<br />
(Please check all that apply.) sporting goods 13% 11% 9% 23% 12%<br />
*Total may be greater than 100% because this is a multiple response question.<br />
stationery/gift shop/souvenirs 12% 18% 18% 10% 15%<br />
incentives 17% 24% 16% 30% 20%<br />
business gifts 31% 36% 32% 48% 34%<br />
custom packaging 14% 19% 28% 48% 20%<br />
None of the above 13% 13% 13% 5% 13%<br />
Other 6% 6% 10% 5% 7%<br />
30. Please estimate the 1-10% 13% 4% 8% 13% 9%<br />
percentage of your 11-20% 12% 5% 8% 5% 8%<br />
total gross sales from 21-30% 13% 4% 6% 10% 8%<br />
promotional products 31-40% 5% 8% 8% 3% 7%<br />
(excluding premiums) 41-50% 7% 10% 8% 3% 8%<br />
51-60% 3% 7% 9% 8% 5%<br />
61-70% 6% 9% 6% 3% 7%<br />
71-80% 5% 9% 10% 3% 7%<br />
81-90% 12% 13% 11% 18% 13%<br />
91-100% 25% 31% 29% 38% 28%<br />
<strong>PPAI</strong> Page 12 of 49 December 2011
D00 - D-2 D-3 - D-04 D-5 - D-6 D-7- D-16<br />
Under $250,001- $1,000,001- Over Total<br />
$250,000 $1,000,000 $5,000,000 $5,000,000<br />
31. Does your firm have any None 74% 77% 69% 49% 73%<br />
proprietary product lines 1 6% 5% 5% 13% 6%<br />
2 5% 3% 9% 18% 6%<br />
3-4 6% 7% 9% 5% 7%<br />
5 or more 9% 7% 8% 15% 9%<br />
32. Please estimate the 0% 33% 31% 29% 13% 31%<br />
percentage of your 1-10% 35% 41% 41% 68% 40%<br />
total gross sales from 11-20% 12% 11% 10% 5% 11%<br />
premiums. 21-30% 5% 6% 5% 3% 5%<br />
31-40% 3% 3% 4% 8% 3%<br />
41-50% 3% 1% 4% 0% 2%<br />
51-60% 2% 1% 2% 0% 2%<br />
61-70% 2% 1% 1% 3% 1%<br />
71-80% 0% 2% 1% 0% 1%<br />
81-90% 3% 1% 1% 3% 2%<br />
91-100% 3% 2% 3% 0% 2%<br />
33. If your company handles invoice as normal 87% 93% 94% 94% 91%<br />
premium programs, what is factory direct invoice 3% 2% 1% 6% 3%<br />
your invoicing policy other 10% 5% 4% 0% 6%<br />
34. If your company handles client 50% 62% 63% 53% 57%<br />
premium programs, who distributor 39% 30% 29% 28% 33%<br />
owns the inventory (prior other 11% 8% 9% 19% 10%<br />
to fulfillment)<br />
35. Do you work with yes 32% 37% 41% 71% 38%<br />
premium reps no 68% 63% 59% 29% 62%<br />
<strong>PPAI</strong> Page 13 of 49 December 2011
SALES ORGANIZATION<br />
D00 - D-2 D-3- D-4 D-5 - D-6 D-7- D-16<br />
Under $250,001- $1,000,001- Over Total<br />
$250,000 $1,000,000 $5,000,000 $5,000,000<br />
36. How many full-time 1 53% 49% 13% 3% 43%<br />
salespeople do you 2 26% 31% 28% 5% 27%<br />
have including owners and 3-4 13% 15% 32% 21% 17%<br />
management 5-10 7% 4% 24% 33% 10%<br />
11 or more 1% 0% 3% 38% 3%<br />
37. If you have salespeople Primarily:<br />
other than company independent contractors 38% 41% 34% 16% 36%<br />
principals, how are they commissioned employees 32% 33% 47% 54% 37%<br />
classified salaried employees 15% 15% 13% 22% 15%<br />
other 15% 11% 7% 8% 11%<br />
38. Please estimate average sales Under $50,000 49% 30% 10% 3% 30%<br />
revenue per salesperson $50,001 - $75,000 17% 16% 11% 3% 14%<br />
$75,001-$100,000 8% 16% 16% 13% 13%<br />
$100,001 - $200,000 14% 21% 18% 8% 17%<br />
$200,001 - $300,000 13% 11% 19% 8% 13%<br />
$300,001 - $400,000 0% 3% 9% 16% 4%<br />
$400,001 - $500,000 0% 2% 6% 5% 2%<br />
$500,001 - $750,000 0% 2% 4% 32% 4%<br />
$750,001 - $1,000,000 0% 1% 3% 11% 2%<br />
Over $1,000,000 0% 0% 3% 3% 1%<br />
<strong>PPAI</strong> Page 14 of 49 December 2011
D00 - D-2 D-3- D-4 D-5 - D-6 D-7- D-16<br />
Under $250,001- $1,000,001- Over Total<br />
$250,000 $1,000,000 $5,000,000 $5,000,000<br />
39. Do you have a full-time yes 17% 11% 21% 29% 16%<br />
sales manager(s) no 83% 89% 79% 71% 84%<br />
39a. If yes, how many sales 1 96% 100% 92% 50% 90%<br />
managers 2-3 4% 0% 8% 13% 5%<br />
4 or more 0% 0% 0% 38% 5%<br />
40. Does the sales manager yes 91% 92% 100% 73% 91%<br />
also sell no 0% 8% 0% 27% 5%<br />
Have selling and nonselling<br />
sales managers 9% 0% 0% 0% 3%<br />
41. Does your distributorship No minimum 55% 56% 45% 53% 54%<br />
have a required minimum 15-19% 5% 4% 6% 5% 5%<br />
gross profit margin for 20-24% 7% 7% 9% 8% 7%<br />
accepting a standard order 25-29% 9% 8% 5% 3% 7%<br />
30-35% 12% 15% 23% 20% 15%<br />
36-40% 8% 7% 10% 5% 8%<br />
41% or higher 3% 3% 2% 0% 2%<br />
other 2% 1% 2% 8% 2%<br />
<strong>PPAI</strong> Page 15 of 49 December 2011
42. Generally, what Independent Contractors<br />
D00 - D-2 D-3- D-4 D-5 - D-6 D-7- D-16<br />
Under $250,001- $1,000,001- Over Total<br />
$250,000 $1,000,000 $5,000,000 $5,000,000<br />
percentage of the gross 45% or lower 15% 13% 10% 3% 13%<br />
profit does each of the 46-50% 13% 20% 33% 36% 20%<br />
following receive 51-54% 2% 1% 4% 6% 2%<br />
55% or higher 1% 1% 3% 6% 2%<br />
sliding percentage based<br />
on volume 5% 2% 6% 3% 4%<br />
percentage based on<br />
gross sales 4% 4% 6% 9% 5%<br />
No independent<br />
contractors 61% 59% 36% 36% 55%<br />
Commissioned salespeople<br />
45% or lower 15% 12% 21% 41% 17%<br />
46-50% 10% 13% 21% 18% 13%<br />
51-54% 0% 2% 3% 3% 2%<br />
55% or higher 0% 5% 2% 3% 2%<br />
sliding percentage based<br />
on volume 5% 4% 5% 6% 5%<br />
percentage based on<br />
gross sales 5% 6% 9% 9% 6%<br />
No commissioned<br />
salaried salespeople 64% 59% 38% 21% 55%<br />
Salaried Employees<br />
45% or lower 14% 12% 21% 23% 15%<br />
46-50% 3% 4% 13% 7% 5%<br />
51-54% 1% 1% 0% 0% 1%<br />
55% or higher 0% 0% 0% 0% 0%<br />
sliding percentage based<br />
on volume 8% 6% 5% 3% 6%<br />
percentage based on<br />
gross sales 4% 3% 8% 13% 5%<br />
No salaried salespeople 69% 72% 54% 53% 67%<br />
<strong>PPAI</strong> Page 16 of 49 December 2011
D00 - D-2 D-3- D-4 D-5 - D-6 D-7- D-16<br />
Under $250,001- $1,000,001- Over Total<br />
$250,000 $1,000,000 $5,000,000 $5,000,000<br />
43. What is your minimum no minimum order 71% 71% 73% 72% 71%<br />
order size for a catalog minimum 10% 12% 6% 3% 10%<br />
commission payment up to $49 0% 0% 0% 0% 0%<br />
$50-$99 3% 4% 1% 0% 3%<br />
$100-$149 4% 3% 7% 10% 5%<br />
$150-$249 2% 2% 1% 5% 2%<br />
$250 or more 4% 5% 7% 3% 5%<br />
Other 6% 3% 5% 8% 5%<br />
44. What is your policy Percentage of commission 5% 3% 3% 8% 4%<br />
concerning salespersons' Percentage of cost 6% 5% 8% 15% 7%<br />
errors<br />
error is put into the cost<br />
of the order 15% 24% 30% 28% 22%<br />
They are charged: salesperson receives<br />
no penalty 6% 2% 9% 5% 5%<br />
split cost of error with<br />
salesperson 10% 12% 18% 23% 13%<br />
no set policy 46% 45% 22% 13% 40%<br />
other 12% 8% 9% 8% 10%<br />
45. Please indicate Sample Kits<br />
how you normally 100% 6% 11% 7% 13% 9%<br />
charge your split cost 12% 12% 15% 16% 13%<br />
salesperson(s) for no charge 54% 55% 67% 58% 57%<br />
the following: don't use 28% 22% 11% 13% 22%<br />
Catalogs<br />
100% 1% 5% 2% 5% 3%<br />
split costs 4% 2% 4% 8% 4%<br />
no charge 72% 79% 85% 82% 78%<br />
don't use 23% 13% 8% 5% 15%<br />
<strong>PPAI</strong> Page 17 of 49 December 2011
45. Please indicate Random samples<br />
D00 - D-2 D-3- D-4 D-5 - D-6 D-7- D-16<br />
Under $250,001- $1,000,001- Over Total<br />
$250,000 $1,000,000 $5,000,000 $5,000,000<br />
how you normally 100% 7% 13% 13% 15% 11%<br />
charge your split costs 12% 9% 23% 26% 14%<br />
salesperson(s) for no charge 63% 65% 58% 54% 63%<br />
the following: (continued) don't use 19% 12% 6% 5% 13%<br />
Personalized samples<br />
100% 16% 25% 30% 26% 23%<br />
split costs 21% 19% 23% 41% 22%<br />
no charge 33% 35% 35% 18% 33%<br />
don't use 30% 20% 11% 15% 22%<br />
Samples with dist imprint<br />
only<br />
Business gifts<br />
Speculative samples<br />
Mailings<br />
100% 3% 9% 7% 8% 6%<br />
split costs 9% 7% 14% 15% 10%<br />
no charge 58% 66% 69% 74% 64%<br />
don't use 29% 18% 9% 3% 20%<br />
100% 15% 21% 21% 23% 19%<br />
split costs 19% 22% 34% 41% 24%<br />
no charge 40% 39% 35% 28% 38%<br />
don't use 26% 19% 9% 8% 19%<br />
100% 9% 18% 18% 13% 14%<br />
split costs 22% 20% 27% 38% 23%<br />
no charge 44% 46% 42% 44% 44%<br />
don't use 25% 17% 13% 5% 18%<br />
100% 8% 14% 6% 10% 10%<br />
split costs 12% 16% 19% 28% 16%<br />
no charge 51% 46% 58% 56% 51%<br />
don't use 29% 24% 17% 5% 23%<br />
<strong>PPAI</strong> Page 18 of 49 December 2011
46. Do you utilize a written independent contractors<br />
D00 - D-2 D-3 - D-04 D-5 - D-6 D-7- D-16<br />
Under $250,001- $1,000,001- Over Total<br />
$250,000 $1,000,000 $5,000,000 $5,000,000<br />
contract with your: No contracts are utilized 74% 72% 59% 44% 69%<br />
The contract will restrict<br />
his/her future<br />
employment 12% 14% 23% 29% 16%<br />
The contract will NOT<br />
restrict his/her future<br />
employment 15% 14% 18% 26% 16%<br />
employee salespeople<br />
No contracts are utilized 69% 74% 54% 32% 66%<br />
The contract will restrict<br />
his/her future<br />
employment 16% 15% 37% 57% 22%<br />
The contract will NOT<br />
restrict his/her future<br />
employment 15% 10% 10% 11% 12%<br />
sales managers<br />
No contracts are utilized 74% 79% 62% 58% 73%<br />
The contract will restrict<br />
his/her future<br />
employment 11% 12% 29% 29% 16%<br />
The contract will NOT<br />
restrict his/her future<br />
employment 15% 8% 9% 13% 11%<br />
<strong>PPAI</strong> Page 19 of 49 December 2011
ORDERS, REBATES, POLICIES AND PRACTICES WITH SUPPLIERS<br />
D00 - D-2 D-3- D-4 D-5 - D-6 D-7- D-16<br />
Under $250,001- $1,000,001- Over Total<br />
$250,000 $1,000,000 $5,000,000 $5,000,000<br />
47. How many orders did fewer than 100 39% 17% 4% 0% 22%<br />
you process last year 100-249 22% 39% 8% 5% 26%<br />
250-499 16% 23% 15% 8% 18%<br />
500-999 8% 12% 24% 13% 12%<br />
1,000-2,499 9% 6% 33% 16% 12%<br />
2,500-4,999 3% 2% 10% 16% 5%<br />
5,000-9,999 2% 0% 4% 18% 2%<br />
10,000 or more 1% 0% 3% 24% 2%<br />
48. How many prime 1 to 5 42% 22% 4% 5% 26%<br />
suppliers (five or more 6 to 10 25% 39% 24% 10% 30%<br />
orders a year) do you 11 to 20 19% 24% 26% 13% 22%<br />
work with 21 to 30 7% 8% 18% 13% 9%<br />
31 to 40 4% 5% 11% 8% 6%<br />
41 to 50 0% 1% 7% 8% 2%<br />
51 or more 3% 1% 11% 44% 6%<br />
49. Of all the suppliers you work 0% 62% 56% 25% 15% 51%<br />
with, what percentage of 1% -10% 28% 39% 61% 59% 39%<br />
of then give you rebates 11% - 20% 5% 2% 4% 3% 3%<br />
21% - 30% 1% 2% 6% 3% 2%<br />
31% - 40% 0% 0% 1% 5% 1%<br />
41% - 50% 2% 0% 1% 5% 1%<br />
51% - 60% 1% 1% 0% 0% 1%<br />
61% or more 1% 0% 3% 10% 2%<br />
50. By what means do you No rebates 49% 43% 21% 10% 40%<br />
monitor supplier rebate Order management system 6% 6% 11% 33% 9%<br />
programs Manually 19% 23% 33% 36% 24%<br />
Do not monitor 25% 28% 35% 21% 28%<br />
<strong>PPAI</strong> Page 20 of 49 December 2011
D00 - D-2 D-3- D-4 D-5 - D-6 D-7- D-16<br />
Under $250,001- $1,000,001- Over Total<br />
$250,000 $1,000,000 $5,000,000 $5,000,000<br />
51. How many suppliers 1 to 5 73% 61% 40% 15% 59%<br />
provide products for the 6 to 10 19% 30% 34% 41% 27%<br />
TOP 20% of your orders 11 to 20 7% 6% 21% 15% 9%<br />
21 to 30 1% 2% 2% 10% 2%<br />
31 to 40 0% 0% 1% 3% 0%<br />
41 to 50 0% 0% 1% 8% 1%<br />
51 or more 1% 1% 1% 8% 1%<br />
52. Do you try to No specific extra support 26% 16% 16% 5% 19%<br />
use/order/show their<br />
support your preferred<br />
products first 64% 74% 78% 87% 72%<br />
suppliers over other advertise/put on website 25% 29% 38% 49% 30%<br />
suppliers when possible prominent placement 14% 14% 25% 44% 18%<br />
*Total may not equal 100% because this is a multiple response question.<br />
extend special pricing 19% 27% 34% 46% 26%<br />
email flyer 20% 24% 26% 38% 24%<br />
Commission incentives on<br />
preferred lines 2% 2% 2% 18% 3%<br />
other 2% 1% 0% 0% 1%<br />
53. Do you have a No showrooms 69% 71% 43% 21% 63%<br />
showroom 1 showroom 31% 28% 53% 67% 35%<br />
2 showrooms 0% 1% 2% 10% 1%<br />
3 showrooms 0% 0% 2% 0% 0%<br />
4 showrooms 0% 0% 0% 3% 0%<br />
Have one in all of our offices 0% 0% 0% 0% 0%<br />
<strong>PPAI</strong> Page 21 of 49 December 2011
D00 - D-2 D-3- D-4 D-5 - D-6 D-7- D-16<br />
Under $250,001- $1,000,001- Over Total<br />
$250,000 $1,000,000 $5,000,000 $5,000,000<br />
54. If yes, how often is the less than 5 times 60% 66% 43% 53% 57%<br />
showroom used for client 5-10 times 21% 18% 23% 41% 23%<br />
presentations (per month) 11-15 times 6% 3% 11% 3% 6%<br />
16-20 times 3% 5% 7% 3% 4%<br />
more than 20 times 10% 8% 16% 0% 10%<br />
55. What percent of gross No house accounts 62% 59% 37% 28% 55%<br />
sales is attributed to house 1%-2% 3% 5% 5% 10% 5%<br />
accounts 3%-5% 3% 2% 10% 13% 4%<br />
6%-10% 4% 3% 9% 10% 5%<br />
11% plus 28% 30% 40% 38% 32%<br />
56. What period of time do 1 year or less 15% 13% 19% 23% 15%<br />
you specify for account 18 months 2% 5% 6% 15% 5%<br />
protection 2 years or more 5% 5% 7% 10% 5%<br />
as long as original<br />
salesperson calls on client 8% 13% 27% 23% 14%<br />
no account protection<br />
offered 20% 14% 8% 10% 15%<br />
no specific policy 50% 51% 33% 18% 45%<br />
<strong>PPAI</strong> Page 22 of 49 December 2011
CLIENT SOURCES<br />
D00 - D-2 D-3- D-4 D-5 - D-6 D-7- D-16<br />
Under $250,001- $1,000,001- Over Total<br />
$250,000 $1,000,000 $5,000,000 $5,000,000<br />
57. What are your main Yellow Pages ad 12% 8% 6% 8% 9%<br />
sources of new clients cold calling 50% 48% 52% 57% 50%<br />
for your salesforce referrals from clients 81% 90% 81% 97% 86%<br />
internet/e-mail/website<br />
inquiries 42% 30% 42% 54% 38%<br />
business<br />
organizations/clubs 51% 55% 46% 46% 51%<br />
*Total may be greater than 100% because this is a multiple response question.<br />
networking 68% 73% 71% 92% 72%<br />
telemarketing 7% 11% 13% 19% 10%<br />
direct mail 13% 20% 13% 27% 17%<br />
advertising 16% 14% 16% 24% 16%<br />
trade shows 22% 25% 22% 32% 24%<br />
Inherited from peer 9% 19% 23% 35% 18%<br />
Other 2% 2% 4% 5% 3%<br />
58. What are your main Yellow Pages ad 9% 7% 10% 0% 8%<br />
sources of new clients cold calling 36% 37% 34% 38% 36%<br />
for your distributorship referrals from clients 85% 89% 90% 86% 87%<br />
internet e-mail/website<br />
inquiries 35% 39% 49% 51% 40%<br />
business<br />
organizations/clubs 46% 56% 47% 43% 50%<br />
networking 65% 76% 62% 78% 70%<br />
telemarketing 5% 9% 9% 16% 8%<br />
direct mail 14% 22% 22% 30% 19%<br />
advertising 15% 17% 22% 19% 17%<br />
trade shows 21% 24% 24% 24% 23%<br />
business acquisition 5% 5% 10% 22% 6%<br />
via salesperson acquisition 7% 11% 24% 46% 13%<br />
Other 2% 3% 2% 5% 3%<br />
<strong>PPAI</strong> Page 23 of 49 December 2011
D00 - D-2 D-3- D-4 D-5 - D-6 D-7- D-16<br />
Under $250,001- $1,000,001- Over Total<br />
$250,000 $1,000,000 $5,000,000 $5,000,000<br />
59. What percentage of your 1-5% 23% 16% 19% 16% 19%<br />
business comes from 6-10% 27% 34% 35% 34% 32%<br />
new clients in a year 11-20% 25% 28% 34% 39% 29%<br />
21-30% 11% 13% 10% 8% 11%<br />
over 30% 15% 8% 3% 3% 9%<br />
60. For your salesforce, which of Chamber of Commerce 53% 60% 52% 24% 54%<br />
the following are important special events 50% 50% 48% 59% 50%<br />
networking events to prospect public speaking 7% 5% 9% 9% 7%<br />
for new clients<br />
leads grps (BNI, Le Tip,<br />
etc) 24% 35% 17% 29% 28%<br />
services clubs like Rotary,<br />
Kiwanis, etc 22% 24% 22% 18% 22%<br />
trade associations 34% 27% 31% 26% 30%<br />
marketing associations 21% 20% 27% 35% 23%<br />
other 5% 4% 6% 12% 5%<br />
61. For your distributorship, which Chamber of Commerce 50% 54% 52% 30% 51%<br />
of the following are important special events 56% 52% 60% 52% 54%<br />
networking events to prospect public speaking 6% 8% 14% 21% 9%<br />
for new clients<br />
leads grps (BNI, Le Tip,<br />
etc) 20% 34% 16% 15% 25%<br />
services clubs like Rotary,<br />
Kiwanis, etc 22% 23% 18% 12% 21%<br />
trade associations 32% 28% 31% 30% 30%<br />
marketing associations 18% 22% 26% 33% 22%<br />
other 6% 6% 4% 15% 6%<br />
*Total may be greater than 100% because this is a multiple response question.<br />
<strong>PPAI</strong> Page 24 of 49 December 2011
OTHER BUSINESS PRACTICES<br />
D00 - D-2 D-3- D-4 D-5 - D-6 D-7- D-16<br />
Under $250,001- $1,000,001- Over Total<br />
$250,000 $1,000,000 $5,000,000 $5,000,000<br />
62. Regarding allowing sales- encourage 61% 62% 75% 89% 67%<br />
people to contact suppliers restrict 24% 25% 17% 6% 21%<br />
directly, do you generally . . prohibit 16% 13% 8% 6% 12%<br />
63. How often is the No sales manual 85% 87% 79% 47% 83%<br />
sales manual revised updated annually 10% 7% 13% 29% 10%<br />
or updated pdated bienially 1% 1% 1% 5% 1%<br />
updated continually 4% 4% 7% 18% 5%<br />
64. Does your firm mark- freight/std order shipping 56% 66% 75% 79% 65%<br />
up the following: overnight shipping 44% 35% 49% 64% 42%<br />
*Total may be greater than 100% because this is a multiple response question.<br />
artwork 86% 81% 84% 82% 83%<br />
other 5% 3% 3% 6% 4%<br />
65. Does your firm have a No 82% 78% 71% 50% 77%<br />
standard handling charge By average dollar amount 15% 16% 21% 32% 18%<br />
per order By average percent of sale 1% 3% 0% 11% 2%<br />
Other 3% 3% 7% 7% 4%<br />
66. Do you pass freight discounts yes 51% 62% 63% 49% 57%<br />
along to your customers no 49% 38% 37% 51% 43%<br />
67. Is you company part of yes 10% 16% 13% 29% 14%<br />
a distributor network no 90% 84% 88% 71% 86%<br />
Note: 91 respondents said their company was part of a distributor network. Responses included AIA, Premier Group, SAGE, Press-A-Print and various buying groups.<br />
<strong>PPAI</strong> Page 25 of 49 December 2011
PROMOTION<br />
D00 - D-2 D-3- D-4 D-5 - D-6 D-7- D-16<br />
Under $250,001- $1,000,001- Over Total<br />
$250,000 $1,000,000 $5,000,000 $5,000,000<br />
68. For your salesforce, what retail display advertising 16% 8% 16% 6% 12%<br />
self-promotion methods do broadcast e-mails 31% 36% 43% 67% 39%<br />
you use internet 48% 39% 51% 61% 46%<br />
yellow pages ads (not<br />
listings) 7% 7% 15% 11% 9%<br />
promotional products (to<br />
promote yourself) 80% 88% 84% 94% 85%<br />
advertising in<br />
business/trade<br />
publications 9% 14% 17% 17% 13%<br />
*Total may be greater than 100% because this is a multiple response question.<br />
your website 71% 73% 82% 81% 75%<br />
publicity/local press 13% 12% 11% 17% 13%<br />
exhibiting at trade<br />
shows/fairs 21% 29% 34% 44% 29%<br />
direct mail 22% 32% 34% 53% 31%<br />
customer shows 13% 15% 17% 39% 17%<br />
Birthday/holiday gifts/<br />
anniversary gifts 15% 19% 17% 25% 18%<br />
telemarketing 6% 8% 9% 11% 8%<br />
open house 14% 10% 17% 22% 14%<br />
industry-prepared direct<br />
mail publications 12% 4% 6% 11% 8%<br />
ads in local newspapers 12% 7% 4% 3% 8%<br />
random or spec samples 36% 43% 47% 58% 43%<br />
social media 33% 31% 34% 50% 34%<br />
<strong>PPAI</strong> Page 26 of 49 December 2011
D00 - D-2 D-3- D-4 D-5 - D-6 D-7- D-16<br />
Under $250,001- $1,000,001- Over Total<br />
$250,000 $1,000,000 $5,000,000 $5,000,000<br />
69. For your distributorship, what retail display advertising 14% 9% 16% 3% 12%<br />
self-promotion methods do broadcast e-mails 31% 40% 46% 51% 38%<br />
you use internet 47% 55% 63% 70% 54%<br />
yellow pages ads (not<br />
listings) 9% 8% 26% 8% 11%<br />
promotional products (to<br />
promote yourself) 79% 90% 87% 84% 85%<br />
advertising in<br />
business/trade<br />
publications 10% 14% 20% 19% 14%<br />
*Total may be greater than 100% because this is a multiple response question.<br />
your website 76% 78% 81% 86% 78%<br />
publicity/local press 13% 12% 18% 16% 14%<br />
exhibiting at trade<br />
shows/fairs 24% 32% 37% 38% 30%<br />
direct mail 19% 35% 39% 43% 30%<br />
customer shows 16% 15% 20% 38% 17%<br />
Birthday/holiday gifts/<br />
anniversary gifts 23% 21% 16% 22% 21%<br />
telemarketing 7% 10% 9% 8% 8%<br />
open house 7% 8% 18% 27% 11%<br />
industry-prepared direct<br />
mail publications 8% 7% 9% 14% 8%<br />
ads in local newspapers 9% 6% 5% 0% 7%<br />
random or spec samples 34% 48% 43% 41% 42%<br />
social media 31% 39% 33% 38% 35%<br />
<strong>PPAI</strong> Page 27 of 49 December 2011
For your salesforce<br />
D00 - D-2 D-3- D-4 D-5 - D-6 D-7- D-16<br />
Under $250,001- $1,000,001- Over Total<br />
$250,000 $1,000,000 $5,000,000 $5,000,000<br />
70. Which of the above retail display advertising 1% 1% 0% 0% 1%<br />
would you consider the broadcast e-mails 6% 7% 11% 9% 8%<br />
one most successful yellow pages ads internet (not 10% 5% 4% 6% 6%<br />
promotional medium:<br />
listings) 2% 0% 1% 3% 1%<br />
promotional products (to<br />
promote yourself) 34% 41% 43% 36% 39%<br />
advertising in<br />
business/trade<br />
publications 1% 0% 1% 0% 1%<br />
your website 14% 12% 14% 12% 13%<br />
publicity/local press 2% 2% 1% 0% 2%<br />
exhibiting at trade<br />
shows/fairs 5% 5% 7% 0% 5%<br />
direct mail 2% 7% 5% 6% 5%<br />
customer shows 1% 1% 0% 6% 1%<br />
birthday gifts/holiday<br />
gifts/anniversary gifts 0% 0% 0% 0% 0%<br />
telemarketing 2% 2% 0% 0% 1%<br />
open house 6% 2% 3% 0% 3%<br />
industry-prepared direct<br />
mail publications 0% 1% 0% 0% 0%<br />
ads in local newspapers 1% 0% 0% 0% 0%<br />
random or spec samples 7% 13% 7% 21% 11%<br />
social media 7% 3% 3% 0% 4%<br />
<strong>PPAI</strong> Page 28 of 49 December 2011
For your distributorship<br />
D00 - D-2 D-3- D-4 D-5 - D-6 D-7- D-16<br />
Under $250,001- $1,000,001- Over Total<br />
$250,000 $1,000,000 $5,000,000 $5,000,000<br />
70. Which of the above retail display advertising 1% 1% 0% 0% 1%<br />
would you consider the broadcast e-mails 6% 6% 6% 15% 7%<br />
one most successful internet 8% 5% 5% 3% 6%<br />
promotional medium: yellow pages ads (not listings) 2% 0% 2% 3% 1%<br />
(continued)<br />
promotional products (to<br />
promote yourself) 33% 38% 36% 27% 35%<br />
advertising in<br />
business/trade<br />
publications 1% 2% 0% 0% 1%<br />
your website 19% 15% 17% 27% 18%<br />
publicity/local press 2% 0% 0% 0% 1%<br />
exhibiting at trade<br />
shows/fairs 5% 7% 12% 3% 7%<br />
direct mail 3% 7% 10% 0% 5%<br />
customer shows 2% 3% 2% 6% 3%<br />
birthday gifts/holiday<br />
gifts/anniversary gifts 1% 0% 0% 0% 0%<br />
telemarketing 2% 2% 0% 0% 2%<br />
open house 2% 1% 2% 0% 2%<br />
industry-prepared direct<br />
mail publications 0% 1% 0% 0% 0%<br />
ads in local newspapers 2% 0% 0% 0% 1%<br />
random or spec samples 7% 8% 5% 12% 7%<br />
social media 5% 3% 2% 3% 4%<br />
71. If you send broadcast e-mail weekly 9% 9% 17% 22% 11%<br />
specials to your monthly 19% 23% 26% 39% 23%<br />
customers, how often do quarterly 7% 7% 9% 6% 7%<br />
you send them occasionally 29% 36% 20% 19% 30%<br />
never 35% 25% 28% 14% 29%<br />
<strong>PPAI</strong> Page 29 of 49 December 2011
MEETINGS, TRAINING AND RECRUITMENT<br />
72. What type of formal or<br />
standard training methods<br />
D00 - D-2 D-3- D-4 D-5 - D-6 D-7- D-16<br />
Under $250,001- $1,000,001- Over Total<br />
$250,000 $1,000,000 $5,000,000 $5,000,000<br />
Owner/principal of the<br />
company does the<br />
training 46% 51% 63% 61% 52%<br />
Internal sales manager<br />
does the training 6% 4% 13% 26% 7%<br />
do you employ Peer salesperson training 7% 10% 15% 53% 12%<br />
Outside training<br />
consultant 4% 6% 5% 21% 6%<br />
Industry sponsored<br />
seminars, workshops,<br />
audio visuals, etc. 22% 29% 29% 39% 27%<br />
*Total may not equal 100% because this is a multiple response question.<br />
Industry suppliers come in<br />
to train salespeople 6% 8% 12% 45% 10%<br />
We do not conduct formal<br />
sales training 41% 39% 24% 8% 35%<br />
Other 0% 2% 3% 0% 1%<br />
<strong>PPAI</strong> Page 30 of 49 December 2011
D00 - D-2 D-3- D-4 D-5 - D-6 D-7- D-16<br />
Under $250,001- $1,000,001- Over Total<br />
$250,000 $1,000,000 $5,000,000 $5,000,000<br />
73. How do you recruit Social Media 16% 17% 16% 31% 18%<br />
salespeople Trade publications 3% 2% 3% 11% 4%<br />
*Total may not equal 100% because this is a multiple response question.<br />
Newspapers 15% 8% 11% 8% 11%<br />
Social media networking 9% 12% 7% 28% 11%<br />
Referrals 72% 78% 83% 81% 78%<br />
Recruiter/employment 6% 7% 5% 17% 8%<br />
Industry job banks 3% 1% 1% 6% 2%<br />
Through internet job<br />
banks 13% 3% 4% 11% 7%<br />
Through multiline supplier<br />
reps 6% 3% 11% 31% 9%<br />
Paid referrals from our<br />
salespeople 4% 2% 7% 14% 5%<br />
Unpaid referrals from our<br />
salespeople 4% 12% 16% 17% 11%<br />
Government hiring<br />
programs 1% 0% 1% 0% 1%<br />
By business acquisition 3% 2% 4% 33% 6%<br />
Networking groups 15% 17% 16% 28% 17%<br />
Paid referrals from reps in<br />
the market 0% 2% 1% 3% 1%<br />
other 4% 6% 4% 11% 6%<br />
74. How often do you hold weekly 13% 18% 25% 41% 19%<br />
sales meetings monthly 9% 11% 15% 22% 12%<br />
*Total may not equal 100% because this is a multiple response question.<br />
quarterly 11% 7% 10% 8% 9%<br />
annually 2% 1% 10% 11% 4%<br />
do not conduct 63% 62% 41% 19% 56%<br />
<strong>PPAI</strong> Page 31 of 49 December 2011
75~77. Please indicate <strong>PPAI</strong> Expo<br />
D00 - D-2 D-3- D-4 D-5 - D-6 D-7- D-16<br />
Under $250,001- $1,000,001- Over Total<br />
$250,000 $1,000,000 $5,000,000 $5,000,000<br />
which meetings are office staff 48% 54% 40% 49% 49%<br />
attended by which principal(s) 63% 75% 74% 81% 71%<br />
type(s) of personnel: sales reps 46% 51% 54% 75% 53%<br />
Traveling shows<br />
Regional shows<br />
Premium/incentive shows<br />
ASI Shows<br />
Your company sales meetings<br />
Customer/Enduser shows<br />
Supplier Rep/MLR visits<br />
office staff 40% 45% 37% 42% 41%<br />
principal(s) 52% 62% 45% 43% 54%<br />
sales reps 48% 50% 48% 69% 51%<br />
office staff 53% 59% 62% 64% 58%<br />
principal(s) 63% 71% 75% 54% 68%<br />
sales reps 60% 63% 80% 75% 67%<br />
office staff 10% 11% 13% 15% 11%<br />
principal(s) 18% 21% 14% 22% 19%<br />
sales reps 15% 14% 15% 36% 17%<br />
office staff 39% 29% 31% 30% 33%<br />
principal(s) 44% 38% 43% 49% 42%<br />
sales reps 41% 32% 38% 50% 38%<br />
office staff 29% 26% 45% 55% 33%<br />
principal(s) 21% 21% 39% 70% 27%<br />
sales reps 33% 30% 44% 64% 37%<br />
office staff 11% 6% 15% 24% 11%<br />
principal(s) 13% 10% 17% 27% 13%<br />
sales reps 12% 10% 20% 33% 15%<br />
office staff 15% 27% 42% 52% 28%<br />
principal(s) 19% 31% 42% 59% 30%<br />
sales reps 21% 27% 43% 58% 32%<br />
<strong>PPAI</strong> Page 32 of 49 December 2011
75~77. Please indicate Supplier Webinars<br />
D00 - D-2 D-3- D-4 D-5 - D-6 D-7- D-16<br />
Under $250,001- $1,000,001- Over Total<br />
$250,000 $1,000,000 $5,000,000 $5,000,000<br />
which meetings are office staff 32% 30% 21% 27% 29%<br />
attended by which principal(s) 40% 45% 19% 32% 38%<br />
type(s) of personnel: sales reps 26% 28% 17% 44% 26%<br />
(continued)<br />
Industry education events<br />
Other Shows<br />
office staff 23% 25% 17% 18% 22%<br />
principal(s) 24% 32% 22% 22% 27%<br />
sales reps 18% 23% 16% 25% 20%<br />
office staff 3% 1% 4% 0% 2%<br />
principal(s) 4% 2% 6% 0% 3%<br />
sales reps 3% 1% 4% 0% 2%<br />
78. Do you have a customer yes 7% 7% 21% 39% 11%<br />
or client show no 93% 93% 79% 61% 89%<br />
*Note: Most respondents stated that they had an open house mostly assisted by suppliers or factory reps. Other resposnes were too varied to compute.<br />
<strong>PPAI</strong> Page 33 of 49 December 2011
SPECIAL SERVICES<br />
D00 - D-2 D-3- D-4 D-5 - D-6 D-7- D-16<br />
Under $250,001- $1,000,001- Over Total<br />
$250,000 $1,000,000 $5,000,000 $5,000,000<br />
79. Does your company use Random samples 89% 93% 95% 92% 92%<br />
the following samples Virtual random samples 51% 58% 67% 68% 57%<br />
*Total may not equal 100% because this is a multiple response question.<br />
Virtual speculative samples 48% 57% 68% 84% 57%<br />
Speculative samples 38% 57% 71% 82% 54%<br />
None of the above 6% 2% 3% 3% 4%<br />
80. How frequently do Actual Specs<br />
orders result from rarely 8% 5% 2% 0% 5%<br />
the following samples occasionally 30% 30% 22% 8% 27%<br />
Virtual Specs<br />
fairly often 37% 45% 52% 68% 45%<br />
most of the time 25% 20% 24% 24% 23%<br />
rarely 10% 8% 7% 6% 8%<br />
occasionally 43% 46% 44% 47% 45%<br />
fairly often 34% 37% 37% 44% 36%<br />
most of the time 14% 10% 11% 3% 11%<br />
<strong>PPAI</strong> Page 34 of 49 December 2011
D00 - D-2 D-3- D-4 D-5 - D-6 D-7- D-16<br />
Under $250,001- $1,000,001- Over Total<br />
$250,000 $1,000,000 $5,000,000 $5,000,000<br />
81. Which of these are the catalogs 57% 51% 57% 32% 53%<br />
three most important sample kits 24% 14% 23% 5% 19%<br />
sales aids to your random samples 46% 44% 33% 21% 42%<br />
distributorship personalized samples 21% 16% 17% 11% 18%<br />
speculative samples 11% 21% 30% 42% 20%<br />
display/showroom 10% 11% 19% 13% 12%<br />
direct mail 3% 6% 6% 5% 5%<br />
your own website 39% 37% 40% 53% 39%<br />
Electronic posting on<br />
social media sites (i.e.<br />
Facebook, etc.) 1% 4% 1% 8% 3%<br />
*Total may not equal 100% because this is a multiple response question.<br />
Electronic posting on<br />
buyer/sourcing websites<br />
(i.e. Alibaba) 0% 0% 0% 0% 0%<br />
e-mail 27% 36% 30% 29% 32%<br />
supplier website 14% 15% 10% 18% 14%<br />
virtual samples 17% 19% 14% 29% 18%<br />
Industry research or<br />
presentation tool 12% 20% 10% 21% 15%<br />
82. What types of marketing free samples 84% 82% 86% 89% 84%<br />
support do you receive virtual samples 62% 67% 71% 89% 67%<br />
from suppliers free flyers 73% 78% 80% 76% 76%<br />
*Total may be greater than 100% because this is a multiple response question.<br />
dedicated inside reps 32% 34% 49% 73% 38%<br />
specials 64% 72% 70% 78% 69%<br />
Full artwork presentation 15% 10% 20% 51% 16%<br />
Website or web pages 42% 39% 31% 41% 39%<br />
Joint sales calls with<br />
supplier reps or multi-line<br />
reps 11% 11% 18% 51% 15%<br />
other 1% 2% 1% 3% 1%<br />
<strong>PPAI</strong> Page 35 of 49 December 2011
D00 - D-2 D-3- D-4 D-5 - D-6 D-7- D-16<br />
Under $250,001- $1,000,001- Over Total<br />
$250,000 $1,000,000 $5,000,000 $5,000,000<br />
83. Do you prefer to work with yes 31% 34% 43% 68% 37%<br />
supplier rep groups/multi- no 69% 66% 57% 32% 63%<br />
line reps in your area<br />
84. Which special services artwork 79% 78% 76% 89% 79%<br />
do you offer in-house to imprinting 25% 18% 24% 19% 21%<br />
your clients layout/paste-up 42% 47% 49% 59% 46%<br />
*Total may be greater than 100% because this is a multiple response question.<br />
copywriting 21% 26% 20% 35% 24%<br />
screen printing 25% 23% 20% 27% 23%<br />
online company stores 22% 26% 40% 76% 30%<br />
printing 24% 19% 15% 22% 20%<br />
warehousing 21% 23% 43% 78% 29%<br />
fulfillment 24% 29% 41% 81% 33%<br />
gift wrapping 15% 18% 14% 38% 18%<br />
packaging 19% 25% 25% 62% 25%<br />
embroidery 27% 20% 27% 30% 24%<br />
engraving 15% 11% 10% 24% 13%<br />
other 8% 3% 4% 3% 5%<br />
<strong>PPAI</strong> Page 36 of 49 December 2011
D00 - D-2 D-3- D-4 D-5 - D-6 D-7- D-16<br />
Under $250,001- $1,000,001- Over Total<br />
$250,000 $1,000,000 $5,000,000 $5,000,000<br />
85. Which of the above artwork 58% 62% 57% 39% 59%<br />
special services do imprinting 67% 72% 61% 61% 68%<br />
you outsource to layout/paste-up 15% 20% 22% 26% 19%<br />
other companies to copywriting 13% 17% 25% 45% 18%<br />
provide for you screen printing 81% 87% 78% 74% 82%<br />
*Total may be greater than 100% because this is a multiple response question.<br />
online company stores 12% 14% 13% 21% 14%<br />
printing 59% 68% 53% 55% 62%<br />
warehousing 18% 20% 19% 24% 19%<br />
fulfillment 21% 23% 21% 26% 22%<br />
gift wrapping 11% 15% 20% 26% 15%<br />
packaging 18% 24% 28% 32% 23%<br />
embroidery 73% 83% 73% 82% 78%<br />
engraving 59% 64% 71% 68% 63%<br />
other 1% 1% 0% 0% 1%<br />
86. Do you charge a fee to yes 22% 22% 27% 21% 23%<br />
clients for creative no 45% 39% 45% 32% 42%<br />
services/idea generation<br />
only if client uses our<br />
idea but does not place<br />
order with us 7% 15% 8% 18% 11%<br />
in addition to the cost of sometimes 25% 23% 19% 29% 24%<br />
merchandise other 0% 1% 1% 0% 1%<br />
87. Do you sell: co-op programs 18% 25% 33% 47% 25%<br />
*Total may not equal 100% because this is a multiple response question.<br />
a company store 19% 32% 47% 84% 33%<br />
sales programs 17% 22% 32% 61% 24%<br />
Incentive/safety programs 19% 32% 44% 63% 31%<br />
Fulfillment programs 17% 24% 42% 74% 27%<br />
None of the above 61% 45% 29% 13% 46%<br />
<strong>PPAI</strong> Page 37 of 49 December 2011
COMMISSIONS<br />
D00 - D-2 D-3- D-4 D-5 - D-6 D-7- D-16<br />
Under $250,001- $1,000,001- Over Total<br />
$250,000 $1,000,000 $5,000,000 $5,000,000<br />
88. Total commissions are the order is sold (booked) 6% 1% 8% 8% 5%<br />
primarily paid when: the order is billed 6% 8% 22% 25% 11%<br />
the order is paid for 88% 91% 71% 67% 84%<br />
89. What is your minimum A dollar amount 4% 2% 3% 3% 3%<br />
commission payment: No minimum 63% 70% 60% 62% 65%<br />
percentage of gross margin 20% 19% 26% 32% 21%<br />
percentage of gross sales 14% 9% 10% 3% 10%<br />
90. If you pay your sales every quarter 6% 5% 15% 19% 8%<br />
representatives an advance or every six months 2% 0% 0% 11% 1%<br />
a draw against commission, annually 2% 1% 5% 11% 3%<br />
how often is it adjusted N/A 88% 90% 75% 47% 84%<br />
other 3% 4% 4% 11% 4%<br />
91. Do you pay commissions on Yes 43% 64% 77% 83% 61%<br />
overruns No 57% 36% 23% 17% 39%<br />
92. What percentage of net sales 0% 54% 48% 31% 38% 47%<br />
did you write off last year 1% 24% 23% 35% 38% 26%<br />
as bad debt 2% 10% 10% 19% 11% 12%<br />
3% 3% 6% 5% 8% 5%<br />
4-5% 4% 9% 6% 3% 6%<br />
more than 5% 5% 4% 5% 3% 4%<br />
<strong>PPAI</strong> Page 38 of 49 December 2011
D00 - D-2 D-3- D-4 D-5 - D-6 D-7- D-16<br />
Under $250,001- $1,000,001- Over Total<br />
$250,000 $1,000,000 $5,000,000 $5,000,000<br />
93. If you charge back commission Commissions only 11% 14% 27% 24% 16%<br />
Commissions plus split<br />
on bad debts, how do you do it<br />
total loss 8% 10% 19% 38% 13%<br />
Total loss 9% 12% 12% 16% 11%<br />
N/A (Do not charge back<br />
commission on bad debts) 69% 62% 38% 19% 57%<br />
other 4% 2% 3% 3% 3%<br />
94. Do you have a bonus or<br />
incentive plan for your sales<br />
force<br />
Yes for independent<br />
contractors 7% 6% 7% 5% 7%<br />
Yes for commission only<br />
salespeople 8% 6% 12% 24% 9%<br />
Yes, for<br />
salary+commission<br />
salespeople 5% 8% 13% 24% 9%<br />
No 80% 81% 68% 46% 76%<br />
95. Is the bonus paid to a As percent of sales 38% 32% 23% 14% 30%<br />
salesperson: As percent of earnings 8% 18% 21% 38% 18%<br />
On sales volume increase 14% 16% 21% 5% 15%<br />
On gross margin increase 6% 13% 10% 14% 10%<br />
Other 34% 21% 26% 29% 27%<br />
96. How often do you conduct Monthly 4% 3% 7% 0% 4%<br />
sales contests Quarterly 4% 2% 4% 19% 4%<br />
Semi-annually 2% 2% 8% 11% 4%<br />
Annually 1% 3% 2% 3% 2%<br />
Do not conduct sales contests 85% 88% 76% 62% 83%<br />
Other 3% 2% 2% 5% 2%<br />
97. Do you pass on special supplier Yes 57% 73% 82% 92% 71%<br />
pricing or offers to your No 28% 15% 7% 0% 17%<br />
salespeople Sometimes 15% 13% 11% 8% 13%<br />
<strong>PPAI</strong> Page 39 of 49 December 2011
FINANCIAL<br />
D00 - D-2 D-3- D-4 D-5 - D-6 D-7- D-16<br />
Under $250,001- $1,000,001- Over Total<br />
$250,000 $1,000,000 $5,000,000 $5,000,000<br />
98. What is the average age less than 30 days 60% 50% 38% 25% 50%<br />
of your promotional 30-45 days 35% 44% 55% 67% 45%<br />
products accounts 46-60 days 5% 5% 6% 8% 5%<br />
receivable more than 60 days 0% 0% 1% 0% 0%<br />
99. What is the average age of less than 30 days 68% 64% 58% 43% 63%<br />
your promotional products 30-45 days 27% 34% 37% 51% 33%<br />
accounts payable 46-60 days 4% 2% 6% 5% 3%<br />
more than 60 days 1% 1% 0% 0% 1%<br />
100. What is the dollar amount $1 - $250 13% 4% 5% 3% 7%<br />
of your average $251-$500 40% 31% 20% 17% 31%<br />
promotional product $501-$750 16% 28% 22% 20% 23%<br />
order $751-$1,000 13% 21% 29% 26% 20%<br />
$1,001-$1,500 9% 8% 14% 11% 9%<br />
$1,501 to $2,500 5% 6% 6% 14% 6%<br />
$2,501 to $3,500 2% 2% 1% 6% 2%<br />
$3,501 to $5,000 1% 0% 2% 0% 1%<br />
more than $5,000 0% 0% 1% 3% 1%<br />
<strong>PPAI</strong> Page 40 of 49 December 2011
D00 - D-2 D-3- D-4 D-5 - D-6 D-7- D-16<br />
Under $250,001- $1,000,001- Over Total<br />
$250,000 $1,000,000 $5,000,000 $5,000,000<br />
101. What percentage of your 0% 4% 3% 5% 14% 5%<br />
distributorship's total 1-10% 5% 2% 7% 30% 5%<br />
dollar volume of sales is 11-20% 3% 3% 10% 16% 5%<br />
contributed by the owner 21-30% 3% 1% 8% 8% 3%<br />
or chief executive 31-40% 2% 5% 7% 5% 4%<br />
41-50% 3% 5% 12% 11% 6%<br />
51-60% 4% 5% 10% 3% 6%<br />
61-70% 8% 4% 10% 5% 6%<br />
71-80% 4% 10% 15% 5% 9%<br />
81-90% 9% 14% 7% 3% 10%<br />
91-100% 54% 48% 12% 0% 41%<br />
102. What is your firm's 1% or less 21% 14% 18% 30% 18%<br />
marketing and promotion 2-3% 24% 25% 28% 33% 26%<br />
expense (Specified as a 4-5% 19% 23% 24% 27% 22%<br />
percentage of net sales) 6-8% 14% 10% 15% 0% 11%<br />
9% - 10% 11% 17% 7% 3% 12%<br />
11% - 15% 4% 5% 5% 3% 5%<br />
16% - 20% 4% 3% 3% 3% 3%<br />
more than 20% 4% 3% 1% 0% 3%<br />
103. What is your firm's cost less than 40% 36% 22% 32% 34% 29%<br />
of goods sold 40-50% 26% 28% 22% 6% 25%<br />
(Specified as a 50-60% 17% 22% 11% 16% 18%<br />
percentage of net 61-65% 15% 17% 20% 22% 17%<br />
sales) 66-70% 4% 9% 14% 13% 9%<br />
More than 70% 1% 1% 2% 9% 2%<br />
<strong>PPAI</strong> Page 41 of 49 December 2011
D00 - D-2 D-3- D-4 D-5 - D-6 D-7- D-16<br />
Under $250,001- $1,000,001- Over Total<br />
$250,000 $1,000,000 $5,000,000 $5,000,000<br />
104. What are your firm's less than 12% 66% 54% 52% 33% 55%<br />
commission and selling 12-20% 23% 35% 34% 48% 32%<br />
expenses (Specified 21% or more 11% 12% 14% 18% 12%<br />
as a percentage of net<br />
sales)<br />
105. What are your firm's less than 3% 41% 28% 18% 6% 28%<br />
general and admin- 3-10% 35% 40% 42% 41% 39%<br />
istrative expenses 11-20% 13% 19% 32% 41% 22%<br />
(Specified as a per- 21 or more 11% 12% 7% 13% 11%<br />
centage of net sales)<br />
106. What is your firm's net 0 or less 12% 5% 4% 0% 6%<br />
income or loss before taxes 0.01 8% 6% 10% 13% 8%<br />
(Specified as a percentage 2-6% 34% 31% 27% 41% 31%<br />
of net sales) 7-10% 27% 27% 31% 34% 28%<br />
11% or more 20% 31% 29% 13% 26%<br />
107. What is your active 25% or less 31% 17% 20% 10% 21%<br />
customer ratio 26%-50% 31% 33% 32% 39% 33%<br />
(# of active customers / 51%-75% 22% 31% 29% 26% 28%<br />
total number of customers) More than 75% 16% 19% 19% 26% 18%<br />
<strong>PPAI</strong> Page 42 of 49 December 2011
KEY METRICS<br />
D00 - D-2 D-3- D-4 D-5 - D-6 D-7- D-16<br />
Under $250,001- $1,000,001- Over Total<br />
$250,000 $1,000,000 $5,000,000 $5,000,000<br />
108. How has your gross margin 21% or more 7% 5% 2% 0% 5%<br />
changed since 2010 11%-20% 13% 8% 10% 6% 10%<br />
6%-10% 12% 15% 8% 8% 12%<br />
1% to 5% 22% 22% 29% 44% 25%<br />
-1% to -5% 5% 12% 17% 19% 11%<br />
-6% to -10% 8% 7% 5% 3% 7%<br />
-11% to -20% 2% 1% 2% 3% 2%<br />
-21% or more 3% 2% 0% 0% 2%<br />
no change 28% 29% 27% 17% 27%<br />
CHANGE IN GROSS MARGIN SINCE 2010 - ALL COMPANIES<br />
<strong>PPAI</strong> Page 43 of 49 December 2011
D00 - D-2 D-3- D-4 D-5 - D-6 D-7- D-16<br />
Under $250,001- $1,000,001- Over Total<br />
$250,000 $1,000,000 $5,000,000 $5,000,000<br />
109. How has your gross revenue 21% or more 11% 13% 9% 8% 11%<br />
changed since 2010 11%-20% 16% 14% 19% 39% 17%<br />
6%-10% 16% 16% 19% 14% 16%<br />
1% to 5% 18% 17% 15% 11% 17%<br />
-1% to -5% 9% 9% 19% 6% 10%<br />
-6% to -10% 9% 10% 4% 6% 8%<br />
-11% to -20% 3% 4% 4% 0% 3%<br />
-21% or more 4% 5% 3% 0% 4%<br />
no change 14% 13% 08% 17% 13%<br />
CHANGE IN GROSS REVENUE SINCE 2010 - ALL COMPANIES<br />
<strong>PPAI</strong> Page 44 of 49 December 2011
D00 - D-2 D-3- D-4 D-5 - D-6 D-7- D-16<br />
Under $250,001- $1,000,001- Over Total<br />
$250,000 $1,000,000 $5,000,000 $5,000,000<br />
110. How has your order count 21% or more 8% 8% 3% 6% 7%<br />
changed since 2010 11%-20% 14% 12% 13% 6% 12%<br />
6%-10% 20% 14% 19% 33% 18%<br />
1% to 5% 18% 24% 21% 25% 22%<br />
-1% to -5% 10% 12% 21% 3% 13%<br />
-6% to -10% 7% 8% 5% 6% 7%<br />
-11% to -20% 1% 4% 1% 0% 3%<br />
-21% or more 3% 2% 0% 0% 2%<br />
no change 19% 15% 17% 22% 17%<br />
CHANGE IN ORDER COUNT SINCE 2010 - ALL COMPANIES<br />
<strong>PPAI</strong> Page 45 of 49 December 2011
D00 - D-2 D-3- D-4 D-5 - D-6 D-7- D-16<br />
Under $250,001- $1,000,001- Over Total<br />
$250,000 $1,000,000 $5,000,000 $5,000,000<br />
111. How has your advertising/ 21% or more 5% 5% 0% 3% 4%<br />
marketing budget changed 11%-20% 5% 4% 4% 6% 4%<br />
since 2010 6%-10% 10% 8% 6% 8% 8%<br />
1% to 5% 20% 16% 23% 17% 19%<br />
-1% to -5% 6% 6% 9% 6% 6%<br />
-6% to -10% 3% 4% 1% 0% 3%<br />
-11% to -20% 1% 2% 0% 0% 1%<br />
-21% or more 2% 2% 0% 0% 1%<br />
no change 49% 53% 56% 61% 53%<br />
CHANGE IN ADVERTISING AND MARKETING BUDGET SINCE 2010 - ALL COMPANIES<br />
<strong>PPAI</strong> Page 46 of 49 December 2011
D00 - D-2 D-3- D-4 D-5 - D-6 D-7- D-16<br />
Under $250,001- $1,000,001- Over Total<br />
$250,000 $1,000,000 $5,000,000 $5,000,000<br />
112. Have your company's stayed the same 10% 9% 10% 16% 10%<br />
promotional products sales grown 1% - 5% 21% 12% 13% 8% 15%<br />
grown or decreased in the grown 6% - 10% 17% 15% 13% 8% 15%<br />
past three years grown 11% - 20% 10% 13% 13% 32% 13%<br />
grown 21% - 30% 7% 8% 11% 3% 8%<br />
grown 31% - 50% 4% 5% 7% 8% 5%<br />
grown 50% or more 5% 7% 4% 5% 6%<br />
declined 1% - 5% 4% 6% 4% 3% 5%<br />
declined 6% -10% 5% 8% 11% 5% 7%<br />
declined 11% - 20% 8% 5% 10% 5% 7%<br />
declined 21% - 30% 5% 6% 4% 3% 5%<br />
declined 31% - 50% 4% 6% 3% 3% 5%<br />
declined 50% or more 2% 2% 0% 0% 1%<br />
CHANGES IN PROMOTIONAL PRODUCT SALES IN PAST THREE YEAR PERIOD: -ALL COMPANIES<br />
<strong>PPAI</strong> Page 47 of 49 December 2011
D00 - D-2 D-3- D-4 D-5 - D-6 D-7- D-16<br />
Under $250,001- $1,000,001- Over Total<br />
$250,000 $1,000,000 $5,000,000 $5,000,000<br />
113. Has your company's stayed the same 25% 26% 21% 40% 26%<br />
non-promotional products grown 1% - 5% 16% 18% 13% 17% 16%<br />
sales channel grown or grown 6% - 10% 10% 12% 19% 11% 12%<br />
decreased in the past three grown 11% - 20% 8% 9% 8% 9% 9%<br />
years grown 21% - 30% 4% 8% 11% 3% 7%<br />
grown 31% - 50% 7% 3% 2% 6% 5%<br />
grown 50% or more 5% 3% 4% 3% 4%<br />
declined 1% - 5% 5% 4% 5% 3% 5%<br />
declined 6% -10% 10% 7% 3% 0% 7%<br />
declined 11% - 20% 3% 3% 5% 6% 4%<br />
declined 21% - 30% 2% 2% 4% 0% 2%<br />
declined 31% - 50% 2% 3% 4% 0% 3%<br />
declined 50% or more 2% 2% 0% 3% 2%<br />
CHANGES IN NON-PROMOTIONAL PRODUCT SALES CHANNEL IN PAST THREE YEAR PERIOD: -ALL COMPANIES<br />
<strong>PPAI</strong> Page 48 of 49 December 2011
D00 - D-2 D-3- D-4 D-5 - D-6 D-7- D-16<br />
Under $250,001- $1,000,001- Over Total<br />
$250,000 $1,000,000 $5,000,000 $5,000,000<br />
114. Are you considering more Get more acquisitions 25% 22% 19% 47% 24%<br />
acquisitions in 2012 Are Stay the same 74% 76% 78% 53% 74%<br />
the plans to: Sell out 1% 2% 3% 0% 2%<br />
<strong>PPAI</strong> Page 49 of 49 December 2011
Research<br />
Your Research Authority<br />
3125 Skyway Circle North • Irving, Texas 75038-3526<br />
www.ppai.org • research@ppai.org<br />
888-I-AM-<strong>PPAI</strong> (426-7724)<br />
© 2011 Promotional Products Association International. All rights reserved. Subject to change without notice.