Grimstad Renewable Energy Park - Hydrogen Implementing ...
Grimstad Renewable Energy Park - Hydrogen Implementing ...
Grimstad Renewable Energy Park - Hydrogen Implementing ...

You also want an ePaper? Increase the reach of your titles
YUMPU automatically turns print PDFs into web optimized ePapers that Google loves.
5. OPERATIONAL EXPERIENCE<br />
Due to the complexity of the system, a large effort has been required to test the system and get<br />
it in operation. The PV cells and the solar collectors are now working well. An example of data<br />
that can be obtained from the system is shown below:<br />
One-third of the PV system, i.e., 36 m 2 of the crystalline cells and 37.2 m 2 of the amorphous<br />
cells, has been connected to the main grid via the four “Sunny Boy” SWR 2000 converters.<br />
These converters are maximum power point trackers, which convert the DC current to 50 Hz<br />
AC current. The total converter system produces a maximum of 8 kW of power, with 2 kW from<br />
each converter.<br />
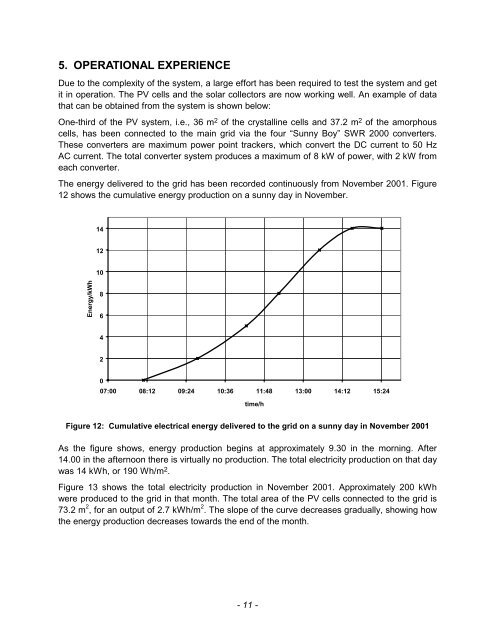
The energy delivered to the grid has been recorded continuously from November 2001. Figure<br />
12 shows the cumulative energy production on a sunny day in November.<br />
<strong>Energy</strong>/kWh<br />
14<br />
12<br />
10<br />
8<br />
6<br />
4<br />
2<br />
0<br />
07:00 08:12 09:24 10:36 11:48 13:00 14:12 15:24<br />
time/h<br />
Figure 12: Cumulative electrical energy delivered to the grid on a sunny day in November 2001<br />
As the figure shows, energy production begins at approximately 9.30 in the morning. After<br />
14.00 in the afternoon there is virtually no production. The total electricity production on that day<br />
was 14 kWh, or 190 Wh/m 2 .<br />
Figure 13 shows the total electricity production in November 2001. Approximately 200 kWh<br />
were produced to the grid in that month. The total area of the PV cells connected to the grid is<br />
73.2 m 2 , for an output of 2.7 kWh/m 2 . The slope of the curve decreases gradually, showing how<br />
the energy production decreases towards the end of the month.<br />
- 11 -