YAMAHA CORPORATION ANNUAL REPORT 2000
YAMAHA CORPORATION ANNUAL REPORT 2000
YAMAHA CORPORATION ANNUAL REPORT 2000

You also want an ePaper? Increase the reach of your titles
YUMPU automatically turns print PDFs into web optimized ePapers that Google loves.
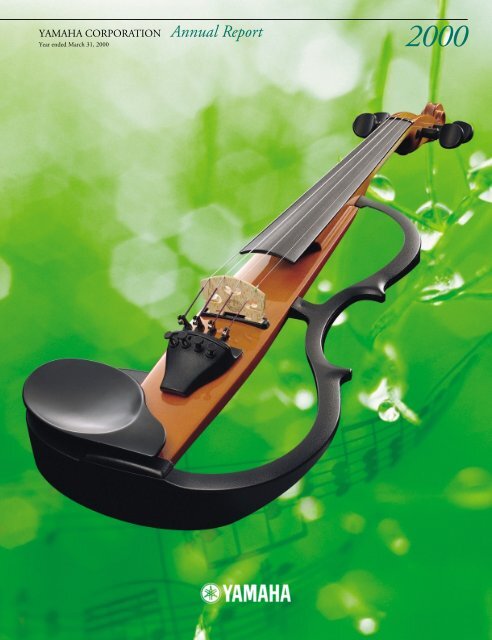
<strong>YAMAHA</strong> <strong>CORPORATION</strong> Annual Report<br />
Year ended March 31, <strong>2000</strong><br />
<strong>2000</strong>
T he forerunner of <strong>YAMAHA</strong> COR-<br />
PORATION was founded in 1887 by<br />
Torakusu Yamaha. On October 12, 1897,<br />
Nippon Gakki Co., Ltd., was incorporated<br />
(the corporate name was changed to<br />
<strong>YAMAHA</strong> <strong>CORPORATION</strong> on occasion<br />
of its 100th anniversary), and <strong>YAMAHA</strong><br />
celebrates its 100th year of manufacturing<br />
pianos in <strong>2000</strong>.<br />
<strong>YAMAHA</strong> is one of the world’s leading<br />
manufacturers of pianos, digital musical<br />
instruments, and wind, string, and percussion<br />
instruments. At the same time, the<br />
Company has grown through a broad<br />
spectrum of business activities, including<br />
electronic devices and equipment, professional<br />
audio equipment, and audiovisual<br />
equipment.<br />
To continue growing in the 21st century,<br />
the <strong>YAMAHA</strong> Group will make a concerted<br />
effort to become a truly global enterprise<br />
that fulfills its corporate mission of contributing<br />
to enriching the quality of life of<br />
people worldwide.<br />
CONTENTS<br />
1 Financial Highlights<br />
2 A Message from the President<br />
4 An Interview with the President<br />
6 Review of Operations<br />
6 Musical Instruments and Audio Products<br />
9 Lifestyle Related Products<br />
10 Electronic Equipment and Metal Products<br />
11 Recreation<br />
12 Others<br />
13 Five-Year Summary<br />
14 Management’s Discussion and Analysis<br />
16 Consolidated Balance Sheets<br />
18 Consolidated Statements of Operations<br />
19 Consolidated Statements of Shareholders’ Equity<br />
20 Consolidated Statements of Cash Flows<br />
21 Notes to Consolidated Financial Statements<br />
31 Report of Independent Auditors<br />
32 Worldwide Network<br />
33 Corporate Data<br />
Board of Directors and Corporate Auditors<br />
Investor Information<br />
SVC-200 (Silent Cello)<br />
In fiscal <strong>2000</strong>, <strong>YAMAHA</strong><br />
was the recipient of the<br />
Highest Design Quality<br />
Award in the Leisure<br />
and Hobby category<br />
of Germany’s Roter<br />
Punkt Awards.<br />
Roter Punkt Awards:<br />
One of Germany’s most prestigious<br />
design awards, Roter<br />
Punkt Awards are awarded<br />
based on nine criteria, including<br />
design innovation and<br />
functionality. The Highest<br />
Design Quality Award is<br />
bestowed upon outstanding<br />
entries.<br />
SV-100 (Silent Violin)<br />
(Cover)<br />
In fiscal 1999, <strong>YAMAHA</strong><br />
was the recipient of the<br />
Most Sought After Design<br />
Award in the Leisure<br />
category of Germany’s<br />
iF Awards.<br />
Germany’s iF Awards:<br />
One of Germany’s most prestigious<br />
design awards, the iF<br />
Awards consist of three divisions:<br />
Product, Ecology, and<br />
Interaction. The Product<br />
Design Awards comprise 10<br />
subcategories, each of which is<br />
ranked into three awards: Top<br />
10 Award, Best of Category<br />
(Most Sought After Design<br />
Award), and Top Three<br />
Award.
FINANCIAL HIGHLIGHTS<br />
Millions of Yen<br />
Millions of<br />
U.S. Dollars<br />
(Note 2)<br />
<strong>2000</strong> 1999 1998 <strong>2000</strong><br />
For the year:<br />
Net sales............................................................................................. ¥527,897 ¥563,751 ¥608,990 $4,973.12<br />
Operating income (loss) ..................................................................... 8,082 (97) 24,103 76.14<br />
Net income (loss) ............................................................................... (40,777) (15,879) 13,475 (384.15)<br />
At year-end:<br />
Total shareholders’ equity................................................................... ¥221,750 ¥214,896 ¥231,940 $2,089.03<br />
Total assets......................................................................................... 543,088 532,852 544,465 5,116.23<br />
U.S. Dollars<br />
Yen (Note 2)<br />
Amounts per share:<br />
Shareholders’ equity........................................................................... ¥1,073.75 ¥1,040.56 ¥1,123.09 $10.12<br />
Net income (loss)<br />
Primary.......................................................................................... (197.45) (76.89) 65.25 (1.86)<br />
After full dilution........................................................................... — — 62.86 —<br />
Notes: 1. Figures for net sales do not include national consumption tax.<br />
2. U.S. dollar amounts are translated from yen, for convenience only, at the rate of ¥106.15=U.S.$1.00, the approximate rate of exchange on<br />
March 31, <strong>2000</strong>.<br />
3. Net income per share after full dilution (yen) for the fiscal years ended March 31, <strong>2000</strong> and 1999 is not presented because net losses for the<br />
years then ended were recorded.<br />
Net Sales<br />
(Billions of Yen)<br />
531.2<br />
’96<br />
604.7<br />
’97<br />
609.0<br />
’98<br />
563.8<br />
’99<br />
527.9<br />
’00<br />
650<br />
0<br />
<strong>YAMAHA</strong> <strong>CORPORATION</strong> and Consolidated Subsidiaries<br />
Years ended March 31<br />
Net Income (Loss)<br />
(Billions of Yen)<br />
9.4<br />
’96<br />
14.1<br />
’97<br />
13.5<br />
’98<br />
-15.9<br />
’99<br />
-40.8<br />
’00<br />
20<br />
0<br />
Total Assets<br />
(Billions of Yen)<br />
513.9<br />
’96<br />
549.2<br />
’97<br />
544.5<br />
’98<br />
532.9<br />
’99<br />
543.1<br />
’00<br />
600<br />
0<br />
1
A MESSAGE FROM THE PRESIDENT<br />
In fiscal <strong>2000</strong>, ended March 31, <strong>2000</strong>, consolidated<br />
net sales for the <strong>YAMAHA</strong> <strong>CORPORATION</strong><br />
and its consolidated subsidiaries (collectively “the<br />
Company”) declined 6.4%, to ¥527.9 billion, owing to<br />
a decrease in net receipts caused by the appreciation of<br />
the yen and a decline in the storage heads business,<br />
which are components that write on and read from<br />
hard disks, the withdrawal from which was determined<br />
at fiscal year-end.<br />
In spite of declining revenues and adverse exchange<br />
rates, Group companies, most notably overseas subsidiaries,<br />
produced strong results, and the Company<br />
succeeded in recording ¥8.1 billion in operating<br />
income.<br />
However, the Company incurred extra retirement<br />
benefit disbursements due to the implementation of<br />
special early retirement initiatives; suffered losses related<br />
to its withdrawal from the storage heads business;<br />
and conducted lump-sum payments of past service<br />
benefits. As a result, operations for the term under<br />
review resulted in a net loss of ¥40.8 billion.<br />
Accomplishments and Initiatives for a Return<br />
to Profitability<br />
During the term, although improvements were seen<br />
in stock prices and housing investments, the Japanese<br />
economy overall remained stagnant as private-sector<br />
capital investment declined and personal spending<br />
failed to achieve a genuine recovery. Overseas, although<br />
the U.S. economy remained strong and recoveries were<br />
witnessed in both Europe and Asia, the strong yen represented<br />
an uphill struggle for exporters.<br />
Against this backdrop, in addition to the continuation<br />
of its musical instruments and audio products sales<br />
enhancement initiatives, <strong>YAMAHA</strong> proactively developed<br />
and introduced exciting new products to meet the<br />
up-to-date needs of its users. At the same time, in the<br />
2<br />
high growth potential field of multimedia networks, in<br />
addition to supplying ringing tones for mobile phones,<br />
the Company established a new Digital Media<br />
Business R&D Division, through which it will configure<br />
a new business model for the 21st century.<br />
With “selection and concentration” of business in<br />
mind, the Company has endeavored to achieve the following<br />
drastic reorganization goals, human resource<br />
initiatives, and financial structure enhancements:<br />
• Withdrawal from the storage heads business<br />
• Sale of the Tenryu semiconductor plant and<br />
realignment toward “sound” business content<br />
• Implementation of special concessions for<br />
early retirement<br />
• Lump-sum payments of past service benefits<br />
• Restructuring initiatives for nonperforming<br />
Group companies<br />
Medium-Term Management Plan<br />
In December 1999, <strong>YAMAHA</strong> drew up its mediumterm<br />
management plan for fiscal 2001 through fiscal<br />
2003, which will see the finalization of <strong>YAMAHA</strong>’s<br />
New Values 21 Strategy (NV21).<br />
The aim of NV21 is the creation and maximization<br />
of corporate value. Hence, the Company will concentrate<br />
its managerial resources on its core businesses of<br />
sound and music as well as pursue new growth and<br />
development.<br />
While implementing competitive growth strategies<br />
in its existing businesses, <strong>YAMAHA</strong> will propose a new<br />
business model through the recombination of its principal<br />
assets—hardware technologies, music information<br />
(the Company’s forte), entertainment, education<br />
software, and Internet content—and strive for<br />
renewed growth.<br />
At the same time, the Company will enhance the<br />
value of the <strong>YAMAHA</strong> brand and maximize Group
A MESSAGE FROM THE PRESIDENT<br />
consolidated results through the strengthening of consolidated<br />
Group operations. <strong>YAMAHA</strong>’s goals to be<br />
accomplished by March 31, 2003, are consolidated net<br />
sales of ¥600.0 billion, recurring profit of ¥30.0 billion,<br />
operating income of ¥32.0 billion, net income of<br />
¥18.0 billion, a 9% return on equity (ROE), and a free<br />
cash flow of ¥13.0 billion.<br />
Recovering Profitability<br />
Over the coming fiscal year, the Company will push<br />
through the following operational objectives.<br />
First and foremost, the Company’s main objective<br />
is to return to profitability. To achieve this, <strong>YAMAHA</strong><br />
will strive to swiftly generate results from restructuring<br />
measures implemented in the previous term as well as<br />
further strengthen its core sound and music businesses.<br />
Second, we will undertake the securing of growth<br />
in the medium term as well as achieve the earliest<br />
3<br />
possible solidification of our new business model for<br />
long-term growth.<br />
Third, the Company will augment its manufacturing<br />
ability—the cornerstone of operations as a manufacturer.<br />
To achieve this, the Company will adopt<br />
initiatives for the acceleration of product development<br />
time, firm market establishment, thorough cost reduction<br />
measures, boosting of overseas manufacturing,<br />
and maintaining levels of product quality.<br />
<strong>YAMAHA</strong> will also promote management that<br />
emphasizes current value accounting compatibility,<br />
cash flows, and balance sheets, and fortify its financial<br />
structure.<br />
Furthermore, the Company will concentrate its efforts<br />
on augmenting the profit bases of its Group affiliates.<br />
Moreover, <strong>YAMAHA</strong> will proactively engage in<br />
environmental conservation activities. The Company<br />
will strive for ISO 14001 certification at all business<br />
facilities and push through preparations for environmental<br />
accounting.<br />
At this delicate time, when full-fledged economic<br />
recovery is most crucial, concerns are being voiced over<br />
a further rise in the value of the yen, creating a less<br />
than optimistic outlook for the business environment.<br />
The <strong>YAMAHA</strong> Group will work to lay the cornerstone<br />
for new growth in the 21st century and at the same<br />
time unite all Group companies to fulfill its management<br />
goals. I look forward to the continued guidance<br />
and support of our valued shareholders and colleagues.<br />
June <strong>2000</strong><br />
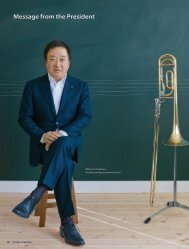
Shuji Ito<br />
President and Representative Director
AN INTERVIEW WITH THE PRESIDENT<br />
FOCUSING MANAGERIAL RESOURCES ON SOUND AND MUSIC<br />
You have declared two bold principles that will guide the entire <strong>YAMAHA</strong> Group in boosting value<br />
and achieving its medium-term managerial goals.<br />
ITO: We have set directions for managerial action and made them clear to both the<br />
domestic and overseas markets. First, we will focus our managerial resources on<br />
our businesses that include musical instruments and audiovisual groups. Second,<br />
we will focus on better and more-thorough coordination of our individual efforts<br />
in an attempt to achieve concerted business expansion across the entire Group.<br />
Rather than setting up and carrying out business plans independent of each<br />
other, as our Group affiliates and subsidiaries currently do, we must introduce<br />
synergy-based corporate management. This will be accomplished by shifting to<br />
consolidated Group management.<br />
For corporate growth, our new Digital Media Business Strategy will help us<br />
shore up our combined resource base, encompassing software, hardware, and<br />
content. Our growth will be driven by the synergistic effects of our existing lines<br />
of business as well as the formation of new business lines.<br />
Could you elaborate on some specific business models?<br />
ITO: We are prepared to implement several specific models. I will briefly describe how<br />
they will affect each line of business.<br />
� Mobile Phone and Related Business<br />
We supply sound chips for mobile communications equipment and develop and<br />
deliver related digital content. In addition, we began the production of casings<br />
for handheld devices.<br />
� Formation of a New Record Company—Yamaha Music Communications<br />
Such prominent popular music artists in Japan as Chage & Aska and Miyuki<br />
Nakajima, among others, have already signed up with this new company. Plans<br />
for future expansion include talent searches and training, as well as on-line<br />
downloading of music content. (The company was established May 1, <strong>2000</strong>.)<br />
� Talent Searches<br />
We plan to hold auditions on-line, to be named “MusicFront.” Internet auditions<br />
will provide us with a flow of promising artists, who will receive training and<br />
other assistance for on-line and CD debuts. (This was announced April 18, <strong>2000</strong>.)<br />
� Formation of Music e Club<br />
This is a completely new type of music instruction, since it is designed specifically<br />
to deal with the very topics that are most difficult to teach in conventional<br />
classroom situations. The new music education system will utilize a mixture of<br />
virtual and real elements, aided by Internet technologies and classroom instruction<br />
at remote locations. It will provide ideal solutions for those who wish to<br />
4
AN INTERVIEW WITH THE PRESIDENT<br />
MUSIC �e TAINMENT<br />
study at home as well as students in remote locations who wish to receive serious<br />
music instruction.<br />
� Development of New Network-Enabled Equipment<br />
We plan to develop musical instruments and equipment that can be used in conjunction<br />
with digital networks. Here too, we seek to achieve synergies by synchronizing<br />
our efforts in instrument development with our efforts to strengthen<br />
a variety of network-related business lines.<br />
� Strengthening of Subsidiaries in Preparation for the New Content Business<br />
Additional funding will be invested in Yamaha Music Media Corporation in<br />
Japan, and a new organization called Yamaha Music InterActive Corporation<br />
in New York has been formed. We will give priority to content development,<br />
including publications and software development.<br />
Is there a catchphrase to serve as a common platform for all the new business models that comprise the<br />
core of the Digital Media Business Strategy?<br />
ITO: Yes there is, Music �e Tainment. Let me explain this new term. It stands for<br />
e-commerce and e-business as well as entertainment and education.<br />
In other words, <strong>YAMAHA</strong> is entering the brave new world of cutting-edge business projects. Could you<br />
describe some of the common goals that <strong>YAMAHA</strong> as a whole is trying to achieve?<br />
ITO: I believe that it is most crucial to improve the image of the <strong>YAMAHA</strong> brand. We<br />
must add “sparkle” to it. This will be accomplished by increasing synergies on<br />
every level of the entire organization, across subsidiaries and affiliates as well as<br />
business and merchandise groups. This process will be supported by the creation<br />
of new values to be associated with our name.<br />
We must begin by reconditioning the fundamental ground of our business.<br />
We must make it fertile so as to nurture genuine talent and professionalism. In<br />
this way, I hope we will be able to cultivate new qualitative characteristics that<br />
can be classified as distinctively <strong>YAMAHA</strong>.<br />
To this purpose, I ask each one of our staff to be forward-looking and outgoing.<br />
As a start, I ask them to act on their own initiative and strive to serve as role<br />
models. Our mission is to add luster to the <strong>YAMAHA</strong> brand and make it a creative<br />
force for many more years to come.<br />
We are experiencing a period of change that requires us to continuously renew<br />
ourselves. One way of doing this is to listen to our customers and the marketplace,<br />
whose voices and opinions are valued very highly and reflected in our<br />
decision making.<br />
5
REVIEW OF OPERATIONS<br />
Net Sales<br />
(Billions of Yen)<br />
332.5<br />
’96<br />
385.0<br />
’97<br />
395.9<br />
’98<br />
408.0<br />
’99<br />
Operating Income<br />
(Billions of Yen)<br />
11.3<br />
’96<br />
15.8<br />
’97<br />
19.8<br />
’98<br />
30.7<br />
’99<br />
387.0<br />
’00<br />
27.1<br />
’00<br />
500<br />
0<br />
40<br />
0<br />
Musical Instruments and Audio Products<br />
Although sales of musical instruments in Japan during the term under<br />
review were generally low, overseas sales produced favorable results. However,<br />
overall sales declined owing to the effects of the appreciation of the yen.<br />
In domestic sales of pianos, <strong>YAMAHA</strong>’s new lineup of grand pianos, which<br />
includes the top-of-the-line CFIIIS concert grand piano, helped boost sales, sales<br />
of upright pianos fell slightly, and sales of electronic pianos also declined. Overseas,<br />
although sales in Europe and Central America and South America stagnated,<br />
sales in North America remained favorable, and recovery was seen in Asia as well.<br />
In digital musical instruments, although growth was seen in electronic<br />
portable keyboards and such computer music products as “Hello Music,” overall<br />
domestic results were lackluster, due to the current slow sales period for<br />
Electones ® and Clavinovas ® . Overseas, electronic keyboards and Clavinovas ®<br />
increased in sales volumes.<br />
In wind, string, and percussion instruments, healthy results were seen both in<br />
Japan and overseas in wind instruments, drums, and acoustic guitars.<br />
In Yamaha music schools in Japan, although revenues from adult students<br />
increased, the number of child students decreased, resulting in a slight decline in<br />
tuition income.<br />
In audio products, <strong>YAMAHA</strong>’s flagship home theater amplifier and receiver,<br />
the DSP-AX1/RX-V1, immediately won high praise worldwide upon its release<br />
for its high sound quality and helped boost sales in this segment both in Japan<br />
and overseas. The Company also strove to augment its lineup of products that<br />
combine audiovisual technologies and IT and released such new products as the<br />
RP-100—the world’s first genuine audio<br />
amplifier to employ USB interface.<br />
The Junior Original<br />
Concert was held in<br />
Eisenach, Germany, to<br />
commemorate the 250th<br />
anniversary of Johann<br />
Sebastian Bach’s death.<br />
The 100th-anniversary edition upright piano<br />
The S-80 music synthesizer is the resounding success of <strong>YAMAHA</strong>’s<br />
devotion to technology and sound, achieved over long years of<br />
development in voicing.<br />
6
The CVP-109 Clavinova ® features high<br />
quality sound and auto-accompaniment<br />
functions.<br />
The CFIIIS top-of-the-line concert<br />
grand piano represents the pinnacle<br />
of artistic expression.<br />
<strong>YAMAHA</strong>’s DTXPRESS enables an individual<br />
user to experience a music session<br />
with a full band on their own in a<br />
compact space of 1m 2 .<br />
<strong>YAMAHA</strong>’s handmade wooden flute is gaining popularity in orchestras worldwide.<br />
<strong>YAMAHA</strong>’s acoustic violins provide a sharp response<br />
to the player’s sensitivities and a crisp, brilliant<br />
timbre. (Available only in Japan.)<br />
7
REVIEW OF OPERATIONS<br />
Major Products & Services<br />
•Pianos (upright pianos, grand<br />
pianos, etc.)<br />
•Digital musical instruments<br />
(Clavinovas ® , Electones ® , portable<br />
keyboards, synthesizers)<br />
•Wind instruments (trumpets, flutes,<br />
saxophones, etc.)<br />
•String instruments (guitars and violins)<br />
•Percussion instruments (drums, vibraphones,<br />
etc.)<br />
•Educational musical instruments<br />
(recorders, pianicas (part piano and part<br />
harmonica), etc.)<br />
•Audio equipment (mixers, power amplifiers,<br />
speaker systems, etc.)<br />
•CD-R/RW, remote routers<br />
•Soundproof room: Avitecs<br />
•Music schools, English schools<br />
Major Subsidiaries<br />
•Yamaha Music Tokyo Co., Ltd., and<br />
16 other domestic musical instruments<br />
sales subsidiaries<br />
•Yamaha Music Trading Corporation<br />
•Yamaha Music Media Corporation<br />
•Yamaha Sound Technologies Inc.<br />
•Yamaha Corporation of America<br />
•Yamaha Electronics Corporation, U.S.A.<br />
•Yamaha Europa G.m.b.H.<br />
•Yamaha Elektronik Europa G.m.b.H.<br />
•Yamaha Musique France S.A.<br />
•Yamaha-Kemble Music (U.K.) Ltd.<br />
•Taiwan Yamaha Musical Inst. Mfg.<br />
Co., Ltd.<br />
•Tianjin Yamaha Electronic Musical<br />
Instruments, Inc.<br />
•Yamaha Elektronics Manufacturing (M)<br />
Sdn. Bhd.<br />
•P.T. Yamaha Indonesia<br />
•Yamaha Music Australia Pty., Ltd.<br />
Musical Instruments and Audio Products<br />
However, sales declined for the term, owing to the effects of the appreciation of the<br />
yen and the decline in demand for digital karaoke machines.<br />
In IT equipment, although sales volumes of CD recorders (CD-Rs) increased<br />
substantially, low selling prices caused sales revenues to stagnate. Benefiting<br />
from the spread of the Internet, ISDN routers continued to produce healthy<br />
sales results.<br />
As a result of these factors, net sales for the segment decreased 5.2% for the<br />
term, to ¥387.0 billion (US$3.65 billion), and operating income declined<br />
11.8%, to ¥27.1 billion (US$0.26 billion).<br />
In fiscal 2001, <strong>YAMAHA</strong> will strive to increase earnings in this segment<br />
through growth in its existing businesses backed by its 100th-anniversary campaign<br />
for <strong>YAMAHA</strong> pianos and by pursuing new Internet and digital media<br />
related business.<br />
At the forefront of the new digital age, the <strong>YAMAHA</strong> DSP-AX1 is highly acclaimed<br />
around the world as an AV amplifier with DSP.<br />
<strong>YAMAHA</strong>’s high-performance CD-R/RW<br />
Drive: the result of leading-edge LSI<br />
technology<br />
All-in-one recording solution with<br />
AW4416 Professional Audio<br />
Station<br />
8
REVIEW OF OPERATIONS<br />
Net Sales<br />
(Billions of Yen)<br />
62.7<br />
’96<br />
74.7<br />
’97<br />
60.7<br />
’98<br />
46.4<br />
’99<br />
48.1<br />
’00<br />
Operating Income (Loss)<br />
(Billions of Yen)<br />
0.4<br />
’96<br />
5.6<br />
’97<br />
0.4<br />
’98<br />
-2.5<br />
’99<br />
-1.0<br />
’00<br />
100<br />
Major Products & Services<br />
•System kitchens, bathtubs, washstands,<br />
furniture, parts for housing facilities,<br />
sound equipment for residential use<br />
Major Subsidiaries<br />
•Yamaha Livingtec Corporation<br />
•Yamaha Living Products Corporation<br />
Transcending mere culinary functions,<br />
<strong>YAMAHA</strong>’s system kitchens make<br />
an interior decorating statement<br />
with unique materials, color schemes,<br />
and designs.<br />
0<br />
6<br />
0<br />
Lifestyle Related Products<br />
Benefiting from the revival of the housing market, <strong>YAMAHA</strong> succeed-<br />
ed in expanding sales of its mainstay system kitchens and bathtubs by developing<br />
new sales routes through such channels as building contractors. However, sales<br />
revenues increased only slightly due to the decline in prices. Sales of wooden<br />
front doors for houses also performed well due to the Company’s efforts at promoting<br />
the benefits of wood over aluminum.<br />
On the profit side, the Company succeeded in decreasing its loss in the segment<br />
through increased revenues, production streamlining, and the reduction of<br />
labor expenses.<br />
As a result, net sales for the segment increased 3.7%, to ¥48.1 billion (US$0.45<br />
billion), and the operating loss amounted to ¥1.0 billion, an improvement from<br />
a ¥2.5 billion loss in the previous term.<br />
<strong>YAMAHA</strong>’s industry-leading new products, which were released in February<br />
<strong>2000</strong>, have produced steady results thus far. In the next fiscal year, the Company<br />
will concentrate on the development of new sales routes and sales promotion initiatives.<br />
At the same time, it will strive to regain profitability in this segment<br />
through further production streamlining and restructuring efforts.<br />
<strong>YAMAHA</strong>’s system bathtubs turn an ordinary bathtub into a soothing exuberant space.<br />
9
REVIEW OF OPERATIONS<br />
Net Sales<br />
(Billions of Yen)<br />
108.8<br />
’96<br />
120.5<br />
’97<br />
130.0<br />
’98<br />
79.9<br />
’99<br />
60.8<br />
’00<br />
Operating Income (Loss)<br />
(Billions of Yen)<br />
18.8<br />
’96<br />
12.3<br />
’97<br />
5.4<br />
’98<br />
-28.4<br />
’99<br />
-18.1<br />
’00<br />
150<br />
Major Products & Services<br />
•Electronic devices<br />
•Semiconductors, specialty metals<br />
Major Subsidiaries<br />
•Yamaha Kagoshima Semiconductor Inc.<br />
•Yamaha Metanix Corporation<br />
A display of mobile phones and a<br />
YMU757 sound generator IC with<br />
4-note polyphony for mobile phones<br />
0<br />
30<br />
0<br />
Electronic Equipment and Metal Products<br />
In semiconductors, sales of <strong>YAMAHA</strong>’s large-scale integrations (LSIs)<br />
10<br />
increased due to expanded use in home video game unit and arcade game<br />
machine applications. The Company also created a major hit product with the<br />
release of its LSI YMU757, a four-note polyphony FM chip for mobile phones<br />
that produces high-quality ringing tones.<br />
Although we attempted to remedy the ailing storage heads business through<br />
restructuring initiatives, owing to plummeting sales prices and the high capital<br />
investment burden, we determined that we were unlikely to achieve future<br />
improvement in earnings. Withdrawal from the business was decided upon in<br />
November 1999, and production was halted in March <strong>2000</strong>. This action resulted<br />
in a substantial decline in sales.<br />
In electronic metallic products, demand for copper and nickel lead frames<br />
increased due to the spread of PCs and mobile phones. Sales also increased<br />
accordingly.<br />
As a result of these factors, net sales for the segment declined 23.9%, to<br />
¥60.8 billion (US$0.57 billion); however, operating loss improved ¥10.3 billion,<br />
to ¥18.1 billion (US$0.17 billion).<br />
Over the next term, considering the enormous demand for mobile phone<br />
melody devices and amusement-related products, we anticipate our LSI semiconductor<br />
products to continue to produce favorable results. The alloy and mobile<br />
markets for electronic metallic materials and lead frames are also expected to<br />
remain strong, and <strong>YAMAHA</strong> will strive to roll out its cathode-ray tube (CRT)<br />
inverter materials, which it will position as its next mainstay product.<br />
Lead frames for semiconductors
REVIEW OF OPERATIONS<br />
Net Sales<br />
(Billions of Yen)<br />
22.6<br />
’96<br />
23.8<br />
’97<br />
23.7<br />
’98<br />
Operating Loss<br />
(Billions of Yen)<br />
-1.9<br />
’96<br />
-1.9<br />
’97<br />
-1.8<br />
’98<br />
23.3<br />
’99<br />
-1.2<br />
’99<br />
23.5<br />
’00<br />
-0.8<br />
’00<br />
30<br />
Major Products & Services<br />
•Sightseeing facilities and accommodation<br />
facilities (Tsumagoi, Nemunosato,<br />
Haimurubushi, Sunza Villa, Kiroro,<br />
Toba-kokusai, Kitanomaru)<br />
•Ski resort (Kiroro Recreation Resort)<br />
•Golf courses (Katsuragi Golf Club,<br />
Kiroro Golf Club, Nemunosato Golf<br />
Club)<br />
Major Subsidiaries<br />
•Yamaha Resort Corporation<br />
•Kiroro Development Corporation<br />
•Haimurubushi Inc.<br />
0<br />
0<br />
Recreation<br />
Although all the Company’s resort facilities recorded increases in<br />
patronage during fiscal <strong>2000</strong>, decreases in prices necessitated by the lackluster<br />
economic conditions in Japan resulted in a decline in sales, and business conditions<br />
remained severe. However, the sale of lots at the Nemunosato resort<br />
proceeded favorably, and overall sales slightly exceeded those of the previous<br />
fiscal year.<br />
<strong>YAMAHA</strong> promoted improvement on the profit side as well as through<br />
reductions in labor expenses and fixed costs. It also increased capital and strove<br />
to strengthen financial content.<br />
As a result, net sales for the segment edged up 0.7%, to ¥23.5 billion<br />
(US$0.22 billion), and operating loss improved ¥0.4 billion year-on-year, to<br />
¥0.8 billion (US$7.36 million).<br />
We expect similar results in the coming term and plan to further decrease our<br />
losses in this segment.<br />
The emerald green ocean of Haimurubushi in Okinawa, Japan’s<br />
southernmost resort spot<br />
The Katsuragi Golf Club is highly acclaimed for its strategically designed golf courses.<br />
11
REVIEW OF OPERATIONS<br />
Net Sales<br />
(Billions of Yen)<br />
14.7<br />
’96<br />
20.3<br />
’97<br />
23.1<br />
’98<br />
22.4<br />
’99<br />
18.4<br />
’00<br />
Operating Income (Loss)<br />
(Billions of Yen)<br />
-0.8<br />
’96<br />
-0.9<br />
’97<br />
0.7<br />
’98<br />
1.5<br />
’99<br />
0.2<br />
’00<br />
30<br />
Major Products & Services<br />
•Golf and archery gear<br />
•Automobile interior components<br />
•Industrial robots<br />
Major Subsidiaries<br />
•Yamaha Insurance Service Co., Ltd.<br />
•Yamaha Fine Technologies Co., Ltd.<br />
0<br />
2<br />
0<br />
Others<br />
In other business, sales of automobile interior components increased. In<br />
golf equipment, the new Power Magic series lineup, which now includes<br />
women’s models, received high praise. Yet overall sales declined owing to the<br />
adverse state of the Japanese economy.<br />
As a result, net sales for the segment declined 17.8%, to ¥18.4 billion<br />
(US$0.17 billion), and operating income amounted to ¥0.2 billion (US$1.92<br />
million).<br />
Over the coming term, we anticipate automobile interior components operations<br />
to continue to produce healthy results, benefiting from enormous market<br />
demand.<br />
<strong>YAMAHA</strong>’s automobile components are widely used in<br />
luxury cars both in Japan and overseas.<br />
<strong>YAMAHA</strong>’s AW-30 aluminum wheel leakage-inspection<br />
system for automobiles<br />
Power Magic 730GT delivers<br />
gentle shots. Power Magic<br />
703GT provides power and<br />
accuracy.<br />
12
FIVE-YEAR SUMMARY<br />
<strong>YAMAHA</strong> <strong>CORPORATION</strong> and Consolidated Subsidiaries<br />
Years ended March 31<br />
Millions of Yen<br />
SELECTED FINANCIAL DATA <strong>2000</strong> 1999 1998 1997 1996<br />
For the year:<br />
Net sales.................................................................................... ¥527,897 ¥563,751 ¥608,990 ¥604,746 ¥531,236<br />
Cost of sales .............................................................................. 371,758 402,239 416,435 409,256 351,744<br />
Gross profit............................................................................... 156,140 161,511 192,556 195,490 179,492<br />
Selling, general and administrative expenses .............................. 148,057 161,608 168,452 165,859 151,770<br />
Operating income (loss) ............................................................ 8,082 (97) 24,103 29,631 27,721<br />
Income (loss) before income taxes and minority interests .......... (47,601) (6,532) 18,995 24,354 18,995<br />
Net income (loss) ...................................................................... (40,777) (15,879) 13,475 14,066 9,430<br />
At year-end:<br />
Total assets................................................................................ ¥543,088 ¥532,852 ¥544,465 ¥549,162 ¥513,905<br />
Total shareholders’ equity ......................................................... 221,750 214,896 231,940 219,970 169,186<br />
Total current assets.................................................................... 205,979 212,911 217,408 231,853 220,719<br />
Total current liabilities .............................................................. 178,281 189,386 181,409 191,327 207,005<br />
13<br />
Yen<br />
Amounts per share:<br />
Net income (loss):<br />
Primary ................................................................................. ¥ (197.45) ¥ (76.89) ¥ 65.25 ¥ 71.97 ¥ 48.59<br />
After full dilution .................................................................. — — 62.86 65.83 44.89<br />
Shareholders’ equity .................................................................. 1,073.75 1,040.56 1,123.09 1,065.17 871.76<br />
Ratios:<br />
Current ratio (%) .................................................................... 115.5% 112.4% 119.8% 121.2% 106.6%<br />
Equity ratio (%) ...................................................................... 40.8 40.3 42.6 40.1 32.9<br />
Return on assets (%)................................................................ (7.6) (2.9) 2.5 2.6 1.9<br />
Return on equity (%) .............................................................. (18.7) (7.1) 6.0 7.2 5.8<br />
Notes: 1. Figures for net sales do not include national consumption tax.<br />
2. Net income per share after full dilution (yen) for the fiscal years ended March 31, <strong>2000</strong> and 1999 is not presented because net losses for the<br />
years then ended were recorded.
MANAGEMENT’S DISCUSSION AND ANALYSIS<br />
Sales by Business Segment<br />
(Billions of Yen)<br />
’96<br />
’97<br />
’98<br />
’99<br />
’00<br />
Storage heads<br />
Other business<br />
Musical instruments<br />
and audio products<br />
700<br />
600<br />
500<br />
400<br />
300<br />
200<br />
100<br />
Sales by Geographical Segment<br />
(Billions of Yen)<br />
’96<br />
’97<br />
’98<br />
Overseas<br />
Japan<br />
’99<br />
’00<br />
0<br />
700<br />
600<br />
500<br />
400<br />
300<br />
200<br />
100<br />
0<br />
INCOME ANALYSIS<br />
Net Sales<br />
Net sales for the Company for fiscal <strong>2000</strong>, ended March 31, <strong>2000</strong>, were adversely<br />
affected by foreign currency exchange rates and a ¥15.8 billion drop in sales<br />
from the storage heads business—the withdrawal from which was determined at<br />
year-end. As a result, net sales declined 6.4%, or ¥35.9 billion, to ¥527.9 billion<br />
(US$4.97 billion) compared with the previous fiscal year.<br />
Sales in Japan, hindered by the loss of storage heads revenue, fell 4.5%, or<br />
¥14.6 billion, to ¥307.9 billion (US$2.90 billion).<br />
Overseas sales were weakened by the appreciation of the yen and declined<br />
8.8%, or ¥21.3 billion, to ¥219.9 billion (US$2.07 billion). The percentage of<br />
overseas sales fell 1.2% from the previous year, to 41.6%.<br />
14<br />
Costs and Expenses<br />
In costs during the term under review, the cost of sales ratio improved 1.0%<br />
owing to the decrease in sales and a ¥7.9 billion decline in depreciation expenses<br />
due to withdrawal from the storage heads business. As a result, cost of sales<br />
decreased ¥30.5 billion, to ¥371.8 billion (US$3.50 billion). Selling, general and<br />
administrative expenses declined ¥13.6 billion, to ¥148.1 billion (US$1.39 billion),<br />
primarily due to decreases in personnel expenses.<br />
Operating Income and Net Income<br />
As a result of the aforementioned factors, operating income for fiscal <strong>2000</strong> improved<br />
¥8.2 billion, from a ¥0.1 billion loss in the previous fiscal year to a profit<br />
of ¥8.1 billion (US$0.08 billion). However, despite the recording of extraordinary<br />
profit from the sale of investment securities, the Company incurred a<br />
¥17.4 billion loss on the withdrawal from the storage heads business; a ¥21.3 billion<br />
payment of extra retirement benefits in line with special early retirement<br />
initiatives; and a ¥29.5 billion lump-sum payment for past service cost of the<br />
pension plans. The recording of these extraordinary losses resulted once again<br />
in a net loss for the term of ¥40.8 billion (US$0.38 billion).<br />
FINANCIAL POSITION<br />
In total assets at year-end, although tangible fixed assets declined due to a withdrawal<br />
from the storage heads business and a decline in notes and accounts<br />
receivable and inventories, deferred income taxes increased owing to the application<br />
of tax-effect accounting, resulting in a year-on-year increase in total assets of<br />
1.9%, or ¥10.2 billion, to ¥543.1 billion (US$5.12 billion).
MANAGEMENT’S DISCUSSION AND ANALYSIS<br />
Capital Expenditure<br />
and Depreciation Expenses<br />
(Billions of Yen)<br />
50<br />
35.1<br />
’96<br />
R&D Expenditure<br />
(Billions of Yen)<br />
’96<br />
’97<br />
’98<br />
’99<br />
’00<br />
25<br />
20<br />
15<br />
10<br />
Total Shareholders’ Equity<br />
and ROE<br />
(Billions of Yen)<br />
250<br />
5.8<br />
’96<br />
47.4<br />
’97<br />
7.2<br />
’97<br />
37.1<br />
’98<br />
6.0<br />
’98<br />
34.3<br />
’99<br />
-7.1<br />
’99<br />
18.5<br />
’00<br />
Depreciation expenses<br />
Capital expenditure<br />
-18.7<br />
’00<br />
40<br />
30<br />
20<br />
10<br />
5<br />
0<br />
200<br />
150<br />
100<br />
50<br />
Total shareholders’ equity<br />
Return on equity (ROE) (%)<br />
0<br />
0<br />
15<br />
In liabilities, although accrued expenses and bank loans declined, the recording<br />
of accrued past service benefit expenses resulted in an increase of 1.4%, or<br />
¥4.3 billion, to ¥318.0 billion (US$3.00 billion).<br />
Total current assets declined ¥6.9 billion, to ¥206.0 billion (US$1.94 billion),<br />
and total current liabilities fell ¥11.1 billion, to ¥178.3 billion (US$1.68 billion).<br />
Working capital increased ¥4.2 billion compared to the previous year, to ¥27.7<br />
billion (US$0.26 billion). The current ratio thus rose 3.1%, to 115.5%. Total<br />
shareholders’ equity increased ¥6.9 billion, to ¥221.8 billion (US$2.09 billion).<br />
CASH FLOWS<br />
Although the Company incurred a loss before income taxes and minority interests<br />
for the term of ¥47.6 billion, cash and cash equivalents at end of year<br />
increased ¥14.3 billion compared to the previous fiscal year, to ¥33.6 billion<br />
(US$0.32 billion). This was due to an increase in the accrued past service benefit<br />
expenses, a decline in trade receivables and inventories, a curtailment of capital<br />
expenditures, and the sale of investment securities.<br />
Net cash provided by operating activities totaled ¥10.9 billion (US$0.10 billion),<br />
due primarily to depreciation expenses, an increase in the accrued past service<br />
benefit expenses, and a decline in trade receivables and inventory assets.<br />
Due to the sale of investment securities, net cash provided by investing activities<br />
totaled ¥12.5 billion (US$0.12 billion).<br />
Net cash used in financing activities amounted to ¥7.5 billion (US$0.07 billion),<br />
due to the repayment of loans.<br />
EXCHANGE RATES<br />
Owing to the rise in the value of the yen, net sales fell ¥33.0 billion and net<br />
income declined ¥19.1 billion. Foreign currency exchange rates applied were<br />
as follows:<br />
Average rate: US$1=¥114.02 (¥130.23 in fiscal 1999)<br />
Euro1=¥119.03 (¥144.19 in fiscal 1999)<br />
Year-end rate: US$1=¥106.15 (¥120.55 in fiscal 1999)<br />
Euro1=¥102.14 (¥129.29 in fiscal 1999)
CONSOLIDATED BALANCE SHEETS<br />
Thousands of<br />
Millions of Yen U.S. Dollars (Note 2)<br />
ASSETS <strong>2000</strong> 1999 <strong>2000</strong><br />
Current assets:<br />
Cash and bank deposits (Notes 6 and 14) ......................................................... ¥ 33,796 ¥ 18,031 $ 318,380<br />
Marketable securities (Notes 6 and 13) ............................................................. 2,805 4,056 26,425<br />
Notes and accounts receivable........................................................................... 76,334 91,649 719,114<br />
Less: Allowance for doubtful accounts .......................................................... (2,852) (4,022) (26,868)<br />
............................................................................................................................. 73,482 87,627 692,247<br />
Inventories........................................................................................................ 77,416 91,095 729,308<br />
Refundable income taxes................................................................................... — 653 —<br />
Deferred income taxes (Note 7) ........................................................................ 12,354 — 116,382<br />
Prepaid expenses and other current assets.......................................................... 6,124 11,447 57,692<br />
Total current assets ............................................................................................. 205,979 212,911 1,940,452<br />
Property, plant and equipment, net of accumulated depreciation (Notes 5 and 6):<br />
Land ................................................................................................................. 48,970 45,449 461,328<br />
Buildings and structures.................................................................................... 81,478 89,327 767,574<br />
Machinery and equipment................................................................................ 34,999 57,042 329,713<br />
Construction in progress................................................................................... 2,672 4,674 25,172<br />
Property, plant and equipment, net of accumulated depreciation ................... 168,121 196,494 1,583,806<br />
Investments and other assets:<br />
Investment securities (Notes 4, 6 and 13) .........................................................<br />
Valuation reserve for investment securities and investments in<br />
78,474 71,926 739,275<br />
unconsolidated subsidiaries and affiliates......................................................... (2,024) (3,134) (19,067)<br />
Long-term loans receivable................................................................................ 2,940 4,016 27,697<br />
Lease deposits ................................................................................................... 5,134 5,694 48,366<br />
Deferred income taxes (Note 7) ........................................................................ 32,123 — 302,619<br />
Excess of cost over net assets acquired ............................................................... 366 383 3,448<br />
Other assets ...................................................................................................... 7,324 7,822 68,997<br />
Total investments and other assets..................................................................... 124,337 86,707 1,171,333<br />
Translation adjustments ..................................................................................... 44,649 36,739 420,622<br />
Total assets .......................................................................................................... ¥543,088 ¥532,852 $5,116,232<br />
See notes to consolidated financial statements.<br />
<strong>YAMAHA</strong> <strong>CORPORATION</strong> and Consolidated Subsidiaries<br />
March 31, <strong>2000</strong> and 1999<br />
16
CONSOLIDATED BALANCE SHEETS<br />
17<br />
Thousands of<br />
Millions of Yen U.S. Dollars (Note 2)<br />
LIABLITIES AND SHAREHOLDERS’ EQUITY <strong>2000</strong> 1999 <strong>2000</strong><br />
Current liabilities:<br />
Short-term loans ............................................................................................... ¥ 42,683 ¥ 49,853 $ 402,101<br />
Current portion of long-term debt (Note 6) ..................................................... 11,527 6,253 108,592<br />
Notes and accounts payable .............................................................................. 52,335 49,969 493,029<br />
Accrued expenses .............................................................................................. 48,580 53,066 457,654<br />
Income taxes payable ........................................................................................ 1,803 3,576 16,985<br />
Employees’ savings deposits .............................................................................. 8,381 10,263 78,954<br />
Advances received ............................................................................................. 4,745 5,829 44,701<br />
Deferred income taxes (Note 7) ........................................................................ 122 — 1,149<br />
Other current liabilities..................................................................................... 8,146 10,570 76,740<br />
Total current liabilities ....................................................................................... 178,281 189,386 1,679,520<br />
Long-term liabilities:<br />
Long-term debt (Note 6) .................................................................................. 34,002 41,212 320,320<br />
Long-term accounts payable ............................................................................. 42,448 — 399,887<br />
Deferred income taxes (Note 7) ........................................................................ 132 — 1,244<br />
Deferred income taxes on land revaluation (Note 1 (n)) ................................... 1,632 — 15,374<br />
Retirement benefits (Note 9) ............................................................................ 18,635 38,010 175,553<br />
Long-term deposits received.............................................................................. 41,448 42,096 390,466<br />
Other long-term liabilities................................................................................. 1,416 3,038 13,340<br />
Total long-term liabilities................................................................................... 139,716 124,358 1,316,213<br />
Minority interests................................................................................................ 3,340 4,211 31,465<br />
Contingent liabilities (Note 10)<br />
Shareholders’ equity (Note 8):<br />
Common stock, ¥50 par value:<br />
Authorized—700,000,000 shares;<br />
Issued —206,523,263 shares.................................................................. 28,533 28,533 268,799<br />
Additional paid-in capital ................................................................................. 26,924 26,924 253,641<br />
Reserve for land revaluation (Note 1 (n)).......................................................... 8,331 — 78,483<br />
Retained earnings ............................................................................................. 157,962 159,441 1,488,102<br />
............................................................................................................................. 221,752 214,900 2,089,044<br />
Treasury stock, at cost ........................................................................................ (2) (3) (19)<br />
Total shareholders’ equity .................................................................................. 221,750 214,896 2,089,025<br />
Total liabilities and shareholders’ equity........................................................... ¥543,088 ¥532,852 $5,116,232
CONSOLIDATED STATEMENTS OF OPERATIONS<br />
18<br />
<strong>YAMAHA</strong> <strong>CORPORATION</strong> and Consolidated Subsidiaries<br />
Years ended March 31, <strong>2000</strong> and 1999<br />
Millions of Yen<br />
Thousands of<br />
U.S. Dollars (Note 2)<br />
<strong>2000</strong> 1999 <strong>2000</strong><br />
Net sales............................................................................................................... ¥527,897 ¥563,751 $4,973,123<br />
Cost of sales......................................................................................................... 371,758 402,239 3,502,195<br />
Gross profit................................................................................................. 156,140 161,511 1,470,937<br />
Selling, general and administrative expenses.......................................................... 148,057 161,608 1,394,790<br />
Operating income (loss) ............................................................................. 8,082 (97) 76,138<br />
Other income (expenses):<br />
Interest and dividend income............................................................................ 957 1,070 9,016<br />
Interest expense and discounts on notes............................................................ (2,968) (3,449) (27,960)<br />
Sales rebates ...................................................................................................... (4,188) (4,155) (39,454)<br />
Loss on foreign exchange .................................................................................. (280) (121) (2,638)<br />
Gain on sale of marketable and investment securities........................................ 12,247 138 115,374<br />
Gain (loss) on sale or disposal of properties, net................................................ 1,820 (1,963) 17,146<br />
Equity in earnings of unconsolidated subsidiaries and affiliates ......................... 4,209 3,366 39,651<br />
Early retirement benefits................................................................................... (21,281) (1,517) (200,480)<br />
Cumulative effect of accounting change with respect to<br />
prior service cost of the pension plan .............................................................. (29,507) — (277,975)<br />
Loss on disposal of discontinued operations...................................................... (17,368) — (163,618)<br />
Other, net......................................................................................................... 675 196 6,359<br />
............................................................................................................................. (55,684) (6,434) (524,578)<br />
Loss before income taxes and minority interests.......................................<br />
Income taxes (benefit):<br />
(47,601) (6,532) (448,431)<br />
Current............................................................................................................. 2,947 6,128 27,763<br />
Deferred ........................................................................................................... (10,167) 2,740 (95,780)<br />
......................................................................................................................... (7,219) 8,869 (68,008)<br />
Loss before minority interests........................................................................ (40,382) (15,401) (380,424)<br />
Minority interests................................................................................................ 395 477 3,721<br />
Net loss........................................................................................................ ¥ (40,777) ¥ (15,879) $ (384,145)<br />
See notes to consolidated financial statements.
CONSOLIDATED STATEMENTS OF SHAREHOLDERS’ EQUITY<br />
19<br />
<strong>YAMAHA</strong> <strong>CORPORATION</strong> and<br />
Consolidated Subsidiaries<br />
Years ended March 31, <strong>2000</strong> and 1999<br />
Thousands of<br />
Millions of Yen U.S. Dollars (Note 2)<br />
<strong>2000</strong> 1999 <strong>2000</strong><br />
Common stock:<br />
Balance at beginning of year<br />
(<strong>2000</strong>—206,523,263 shares;<br />
1999—206,523,263 shares) ........................................................................<br />
Balance at end of year<br />
(<strong>2000</strong>—206,523,263 shares;<br />
¥ 28,533 ¥ 28,533 $ 268,799<br />
1999—206,523,263 shares) ........................................................................ ¥ 28,533 ¥ 28,533 $ 268,799<br />
Additional paid-in capital (Note 8):<br />
Balance at beginning of year ............................................................................. ¥ 26,924 ¥ 26,924 $ 253,641<br />
Balance at end of year..................................................................................... ¥ 26,924 ¥ 26,924 $ 253,641<br />
Reserve for land revaluation:<br />
Balance at beginning of year ............................................................................. ¥ — ¥ — $ —<br />
Add:<br />
Gain on revaluation of land .......................................................................... 8,331 — 78,483<br />
Balance at end of year.....................................................................................<br />
Retained earnings:<br />
¥ 8,331 — $ 78,483<br />
Balance at beginning of year ............................................................................. ¥159,441 ¥176,485 $1,502,035<br />
Cumulative effect of initial adoption of tax-effect accounting ...........................<br />
Add:<br />
39,411 — 371,276<br />
Effect of change in scope of consolidation..................................................... — 1,033 —<br />
Effect of change in interests in subsidiaries.................................................... — 70 —<br />
Effect of change in revaluation reserve .......................................................... 1,157 — 10,900<br />
Net loss.........................................................................................................<br />
Deduct:<br />
(40,777) (15,879) (384,145)<br />
Decrease in consolidated subsidiaries ............................................................ (945) — (8,902)<br />
Effect of change in interests in subsidiaries.................................................... (116) (145) (1,093)<br />
Cash dividends paid...................................................................................... (206) (2,065) (1,941)<br />
Bonuses to directors and statutory auditors................................................... (2) (58) (19)<br />
Balance at end of year..................................................................................... ¥157,962 ¥159,441 $1,488,102<br />
See notes to consolidated financial statements.
CONSOLIDATED STATEMENTS OF CASH FLOWS<br />
<strong>YAMAHA</strong> <strong>CORPORATION</strong> and<br />
Consolidated Subsidiaries<br />
Year ended March 31, <strong>2000</strong><br />
20<br />
Millions of Yen<br />
Thousands of<br />
U.S. Dollars (Note 2)<br />
<strong>2000</strong> <strong>2000</strong><br />
Cash flows from operating activities:<br />
Loss before income taxes ......................................................................................................<br />
Adjustments to reconcile income (loss) before income taxes to net cash<br />
provided by operating activities:<br />
¥(47,601) $(448,431)<br />
Depreciation and amortization............................................................................................. 28,876 272,030<br />
Allowance for doubtful accounts.......................................................................................... (1,010) (9,515)<br />
Provision for accrued employees’ retirement benefits, net..................................................... (19,322) (182,025)<br />
Interest and dividend income............................................................................................... (957) (9,016)<br />
Interest expense.................................................................................................................... 2,968 27,960<br />
Equity in earnings of unconsolidated subsidiaries and affiliates ............................................ (4,209) (39,651)<br />
Gain on sale of investment securities.................................................................................... (9,091) (85,643)<br />
Gain on sale or disposal of properties, net ............................................................................ (1,820) (17,146)<br />
Loss on foreign exchange, net...............................................................................................<br />
Changes in operating assets and liabilities:<br />
280 2,638<br />
Decrease in accounts and notes receivable—trade ............................................................ 11,511 108,441<br />
Decrease in inventories .................................................................................................... 9,811 92,426<br />
Increase in accounts and notes payable—trade................................................................. 3,087 29,081<br />
Increase in long-term accounts payable—other ................................................................ 42,448 399,887<br />
Other, net............................................................................................................................ (2,470) (23,269)<br />
........................................................................................................................................ 12,501 117,767<br />
Interest and dividends received ............................................................................................ 959 9,034<br />
Interest paid......................................................................................................................... (2,968) (27,960)<br />
Refundable income taxes, net of payment ............................................................................ 358 3,373<br />
Net cash provided by operating activities ............................................................................. 10,851 102,223<br />
Cash flows from investing activities:<br />
Purchases of investment securities ........................................................................................ (34,321) (323,325)<br />
Proceeds from sale of marketable securities .......................................................................... 3,733 35,167<br />
Proceeds from sale of investment securities .......................................................................... 45,290 426,660<br />
Purchases of properties......................................................................................................... (20,175) (190,061)<br />
Proceeds from sale of properties ........................................................................................... 17,137 161,441<br />
Other, net............................................................................................................................ 811 7,640<br />
Net cash provided by investing activities .............................................................................. 12,474 117,513<br />
Cash flows from financing activities:<br />
Decrease in short-term loans, net ......................................................................................... (4,666) (43,957)<br />
Proceeds from long-term debt.............................................................................................. 2,382 22,440<br />
Repayments of long-term debt............................................................................................. (5,033) (47,414)<br />
Cash dividends paid............................................................................................................. (206) (1,941)<br />
Other, net............................................................................................................................ 0 0<br />
Net cash used in financing activities ..................................................................................... (7,522) (70,862)<br />
Effect of exchange rate changes on cash and cash equivalents ............................................. (1,467) (13,820)<br />
Net increase in cash and cash equivalents............................................................................. 14,335 135,045<br />
Cash and cash equivalents at beginning of year....................................................................<br />
Increase in cash and cash equivalents arising from inclusion of subsidiaries in<br />
17,923 168,846<br />
consolidation........................................................................................................................ 1,373 12,935<br />
Cash and cash equivalents at end of year (Note 14).............................................................. ¥ 33,632 $ 316,835<br />
See notes to consolidated financial statements.
NOTES TO CONSOLIDATED FINANCIAL STATEMENTS<br />
1. SUMMARY OF SIGNIFICANT ACCOUNTING POLICIES<br />
<strong>YAMAHA</strong> <strong>CORPORATION</strong> and<br />
Consolidated Subsidiaries<br />
March 31, <strong>2000</strong> and 1999<br />
(a) Basis of presentation<br />
<strong>YAMAHA</strong> <strong>CORPORATION</strong> (the “Company”) and its domestic subsidiaries maintain their accounting records and prepare their<br />
financial statements in accordance with accounting principles and practices generally accepted in Japan, and its foreign subsidiaries<br />
maintain their books of account in conformity with those of the countries of their domicile. The accompanying consolidated<br />
financial statements have been prepared from the financial statements filed with the Ministry of Finance as required by the<br />
Securities and Exchange Law of Japan. Accordingly, the accompanying consolidated financial statements may differ in certain significant<br />
aspects to present the consolidated financial position, results of operations and cash flows in accordance with accounting<br />
principles and practices generally accepted in countries and jurisdictions other than Japan. For the purposes of this document, certain<br />
reclassifications have been made to present the accompanying consolidated financial statements in a format which is familiar<br />
to readers outside Japan.<br />
In March 1998, the Business Accounting Deliberation Council of Japan (the “BADC”) issued a new accounting standard for<br />
statements of cash flows, which became effective the year ended March 31, <strong>2000</strong>. The Company and its consolidated subsidiaries<br />
adopted the new accounting standard for consolidation effective the year ended March 31, <strong>2000</strong>, and the accompanying consolidated<br />
statements of cash flows for the year ended March 31, <strong>2000</strong> only has been prepared in accordance with this standard.<br />
As permitted, amounts of less than one million yen have been omitted. As a result, the totals shown in the accompanying consolidated<br />
financial statements (both in yen and U.S. dollars) do not necessarily agree with the sum of the individual amounts.<br />
(b) Basis of consolidation and accounting for investments in unconsolidated subsidiaries and affiliates<br />
In accordance with the revised accounting standards for consolidation issued by the BADC, effective April 1, 1999, consolidated<br />
financial statements are required to include the accounts of the parent company and all its subsidiaries over which substantial control<br />
is exerted through either majority ownership of voting stock and/or by other means. As a result, the accompanying consolidated<br />
financial statements include the accounts of the Company and 72 consolidated subsidiaries. All significant intercompany<br />
balances and transactions have been eliminated in consolidation.<br />
In addition, effective April 1, 1999, the scope of affiliates who should be accounted for by the equity method has been expanded<br />
to include companies (other than subsidiaries as defined above) whose decision-making control over their operations is significantly<br />
affected by the consolidated group in various ways even if they are owned by less than 20%. As a result, the investments in three<br />
affiliates have been accounted for by the equity method.<br />
Investments in unconsolidated subsidiaries and affiliates not accounted for by the equity method are carried at cost.<br />
Certain foreign subsidiaries are consolidated on the basis of fiscal periods ending December 31, which differ from that of the<br />
Company; however, the necessary adjustments are made when the effect of the difference is material.<br />
All assets and liabilities of the subsidiaries are revaluated at fair values on acquisition, if applicable, and the excess of cost over<br />
underlying net assets at the date of acquisition is amortized over a period of five years on a straight-line basis.<br />
(c) Foreign currency translations<br />
The revenue and expense accounts of its foreign consolidated subsidiaries are translated into yen at the rate of exchange in effect at<br />
the balance sheet date. The balance sheet accounts, except for the components of shareholders’ equity, are also translated into yen<br />
at the rate of exchange in effect at the balance sheet date. The components of shareholders’ equity are translated at historical<br />
exchange rates.<br />
Current monetary assets and liabilities of the Company and its domestic subsidiaries denominated in foreign currencies are<br />
translated at the current exchange rates in effect at each balance sheet date if not hedged by forward exchange contracts, or at the<br />
contracted rates of exchange when hedged by forward exchange contracts. Other assets and liabilities of the Company and its<br />
domestic subsidiaries denominated in foreign currencies are translated into yen at the historical rates of exchange in effect at the<br />
dates of the respective transactions.<br />
(d) Cash and cash equivalents<br />
All highly liquid investments, generally with a maturity of three months or less when purchased, which are readily convertible into<br />
known amounts of cash and so near maturity that they represent only an insignificant risk of any change in value attributable to<br />
changes in interest rates, are considered cash equivalents.<br />
The BADC issued a new accounting standard for statements of cash flows in March 1998. This standard became effective for<br />
fiscal years beginning on or after April 1, 1999. Accordingly, certain short-term investments in money trusts and other, which had<br />
previously been classified under “marketable securities,” are now considered cash equivalents. The reclassifications were not made<br />
to the consolidated balance sheets as of March 31, 1999 in order to conform the prior year’s presentation to the current year’s<br />
presentation.<br />
(e) Marketable securities, including those classified as investment securities<br />
Marketable securities are stated at cost or at the lower of cost or market, cost being determined by the average method.<br />
21
NOTES TO CONSOLIDATED FINANCIAL STATEMENTS<br />
(f) Inventories<br />
Inventories of the Company and its domestic consolidated subsidiaries are stated principally at the lower of cost or market, cost<br />
being determined by the last-in, first-out method. Inventories of the Company’s foreign consolidated subsidiaries are stated principally<br />
at the lower of cost or market, cost being determined by the moving average method.<br />
(g) Depreciation and amortization<br />
Depreciation of property, plant and equipment is mainly calculated by the declining-balance method as stipulated in the<br />
Corporation Tax Law of Japan, except that certain consolidated subsidiaries employ the straight-line method at rates based on<br />
the estimated useful lives of the respective assets.<br />
(h) Allowance for doubtful accounts<br />
The allowance for doubtful accounts is provided at an amount sufficient to cover possible losses on the collection of receivables.<br />
For the Company and its consolidated subsidiaries, the amount of the allowance is determined based on (1) the maximum amount<br />
permitted to be charged to income under the Corporation Tax Law of Japan and based on past write-off experience, and (2) an<br />
estimated amount for probable doubtful accounts based on a review of the collectibility of individual receivables.<br />
22<br />
(i) Retirement benefits<br />
Employees’ retirement benefits: The Company and its consolidated subsidiaries have retirement benefits plans covering substantially<br />
all their employees. Employees of the Company and its consolidated subsidiaries who terminate their employment are entitled to<br />
lump-sum payments determined by reference to their current basic rate of pay, length of service and the conditions under which the<br />
termination occurs. Accrued employees’ retirement benefits are stated at the amount which would be required to be paid if all<br />
employees covered by the plan voluntarily terminated their employment as of the balance sheet date.<br />
In addition, the Company and certain consolidated subsidiaries have introduced defined benefit pension plans covering certain<br />
employees who meet the stipulated eligibility requirements as to age and length of service. The unamortized prior service cost is<br />
recognized as obligations of the Company and its consolidated subsidiaries and included in retirement benefits.<br />
Directors’ retirement benefits: The Company’s directors are generally entitled to receive lump-sum retirement payments based on the<br />
Company’s internal rules. The Company provides a 100% allowance for retirement benefits for its directors under its internal rules<br />
and this balance is included in retirement benefits in the balance sheets.<br />
(j) Warranty reserve<br />
The warranty reserve is provided to cover costs for possible repairs which may be claimed by customers after the Group companies’<br />
sales. The amount of this reserve is estimated based on a percentage of the amount or volume of sales and after considering past<br />
experience with repairs to products under warranty.<br />
(k) Leases<br />
Noncancelable lease transactions are accounted for as operating leases regardless of whether such leases are classified as operating or<br />
finance leases, except that lease agreements which stipulate the transfer of ownership of the leased assets to the lessee are accounted<br />
for as finance leases.<br />
(l) Income taxes<br />
Effective the year ended March 31, <strong>2000</strong>, the Company and its consolidated subsidiaries fully adopted deferred tax accounting for<br />
income taxes in accordance with a new accounting standard issued by the BADC. This standard requires recognition of income<br />
taxes by the liability method. Under the liability method, deferred tax assets and liabilities are determined based on the difference<br />
between financial reporting and the tax basis of the assets and liabilities and are measured using the enacted tax rates and laws<br />
which will be in effect when the differences are expected to reverse. The effect of this change on deferred income taxes amounted<br />
to ¥12,303 million ($115,902 thousand) as current assets, ¥32,123 million ($302,619 thousand) as noncurrent assets, ¥122 million<br />
($1,149 thousand) as current liabilities, ¥132 million ($1,244 thousand) as long-term liabilities and ¥1,632 million ($15,374<br />
thousand) as long-term liabilities with respect to land revaluation as of March 31, <strong>2000</strong>. In addition, the effect of this change was<br />
to decrease net loss ¥10,769 million ($101,451 thousand) for the year ended March 31, <strong>2000</strong> and increase retained earnings<br />
¥50,180 million ($472,727 thousand) as of March 31, <strong>2000</strong> from the amounts which would have been recorded by the method<br />
applied in the previous year.<br />
(m) Appropriation of retained earnings<br />
Under the Commercial Code of Japan (the “Code”), the appropriation of retained earnings with respect to a given financial period<br />
is made by resolution of the shareholders at a general meeting held subsequent to the close of such financial period. The accounts<br />
for that period do not, therefore, reflect such appropriation.<br />
(n) Land revaluation<br />
Pursuant to the “Law Concerning the Revaluation of Land” (the “Law”), land used for the business operations of a consolidated<br />
subsidiary and an affiliate was revalued on March 31, <strong>2000</strong>. The excess of the revalued carrying amount over the book value before
NOTES TO CONSOLIDATED FINANCIAL STATEMENTS<br />
revaluation that has been included in shareholders’ equity amounted to ¥8,331 million ($78,483 thousand) as the reserve for land<br />
revaluation at an amount net of the related tax effect at March 31, <strong>2000</strong>. The corresponding income taxes of ¥1,632 million<br />
($15,374 thousand) are included in long-term liabilities at March 31, <strong>2000</strong> as deferred income taxes on land revaluation.<br />
The revaluation of the land was determined based on the official standard notice prices in accordance with the relevant regulations<br />
of the Local Income Tax Law of Japan with certain necessary adjustments.<br />
(o) Reclassifications<br />
Certain prior-year amounts have been reclassified to conform to the fiscal <strong>2000</strong> presentation. These changes have had no impact<br />
on previously reported results of operations or shareholders’ equity.<br />
2. U.S. DOLLAR AMOUNTS<br />
For the convenience of the reader, the accompanying financial statements with respect to the year ended March 31, <strong>2000</strong> have<br />
been presented in U.S. dollars by translating all yen amounts at ¥106.15=U.S.$1.00, the exchange rate prevailing on March 31,<br />
<strong>2000</strong>. This translation should not be construed as a representation that yen have been, could have been or could in the future be<br />
converted into U.S. dollars at the above or any other rate.<br />
3. ACCOUNTING CHANGES<br />
In previous years, the prior service cost of the employees’ pension plans was recognized as expenses when contributions to the plans<br />
were made by the Company and certain consolidated subsidiaries. Effective April 1, 1999, the Company and certain consolidated<br />
subsidiaries have changed their accounting method to recognize the unamortized prior service cost as obligations at the balance<br />
sheet date on an accrual basis. The effect of this change was to decrease net income ¥29,507 million ($277,975 thousand) from the<br />
amount which would have been recorded under the method applied in the previous year.<br />
4. INVESTMENT SECURITIES<br />
Investment securities and investment in and advances to unconsolidated subsidiaries and affiliates at March 31, <strong>2000</strong> and 1999<br />
were as follows:<br />
Thousands of<br />
Millions of Yen U.S. Dollars<br />
<strong>2000</strong> 1999 <strong>2000</strong><br />
Investment securities.................................................................................................................... ¥35,409 ¥27,727 $333,575<br />
Investment in and advances to unconsolidated subsidiaries and affiliates...................................... 43,065 44,199 405,699<br />
.................................................................................................................................................... ¥78,474 ¥71,926 $739,275<br />
5. ACCUMULATED DEPRECIATION<br />
Accumulated depreciation at March 31, <strong>2000</strong> and 1999 was ¥226,825 million ($2,136,835 thousand) and ¥256,217 million,<br />
respectively.<br />
6. SHORT-TERM LOANS AND LONG-TERM DEBT<br />
Short-term loans consisted of unsecured loans payable to banks at the weighted average interest rate of 3.1% per annum at<br />
March 31, <strong>2000</strong>.<br />
Long-term debt at March 31, <strong>2000</strong> consisted of the following:<br />
Thousands of<br />
Millions of Yen U.S. Dollars<br />
Loans from banks, due through 2012 at average<br />
rates of 3.4% and 2.3% for current<br />
and noncurrent portion, respectively.......................................................................................................... ¥21,212 $199,830<br />
1.9% unsecured convertible bonds, due 2004 .............................................................................................. 24,317 229,082<br />
Total long-term debt.................................................................................................................................... 45,529 428,912<br />
Less: Current portion.................................................................................................................................. 11,527 108,592<br />
.................................................................................................................................................................... ¥34,002 $320,320<br />
On September 30, 1988, the Company issued 1.9% unsecured convertible bonds, due 2004, which are convertible into common<br />
stock of the Company at ¥2,200 per share during the period from November 1, 1988 to March 31, 2004.<br />
23
NOTES TO CONSOLIDATED FINANCIAL STATEMENTS<br />
The assets pledged as collateral for long-term debt and certain other current liabilities at March 31, <strong>2000</strong> were as follows:<br />
Millions of Yen<br />
Thousands of<br />
U.S. Dollars<br />
Bank deposits............................................................................................................................................... ¥ 52 $ 490<br />
Marketable securities.................................................................................................................................... 1,349 12,708<br />
Property, plant and equipment, net of accumulated depreciation................................................................. 16,544 155,855<br />
Investment securities.................................................................................................................................... 12,730 119,925<br />
The aggregate annual maturities of long-term debt subsequent to March 31, <strong>2000</strong> are summarized as follows:<br />
Year ending March 31, Millions of Yen<br />
Thousands of<br />
U.S. Dollars<br />
2001 ............................................................................................................................................................ ¥11,527 $108,592<br />
2002 ............................................................................................................................................................ 2,818 26,547<br />
2003 ............................................................................................................................................................ 2,388 22,497<br />
2004 ............................................................................................................................................................ 25,400 239,284<br />
2005 and thereafter...................................................................................................................................... 3,396 31,992<br />
.................................................................................................................................................................... ¥45,529 $428,912<br />
7. INCOME TAXES<br />
Income taxes applicable to the Company and its domestic subsidiaries comprised corporation tax, inhabitants’ taxes and enterprise<br />
tax, which, in the aggregate, resulted in statutory tax rates of approximately 41% and 46% for <strong>2000</strong> and 1999, respectively.<br />
Income taxes of the foreign subsidiaries are based generally on the tax rates applicable in their countries of incorporation.<br />
The major components of deferred tax assets and liabilities as of March 31, <strong>2000</strong> are summarized as follows:<br />
Thousands of<br />
Millions of Yen U.S. Dollars<br />
Deferred tax assets:<br />
Write-down of inventories ....................................................................................................................... ¥ 2,245 $ 21,149<br />
Allowance for doubtful receivables ........................................................................................................... 1,176 11,079<br />
Depreciation............................................................................................................................................ 13,589 128,017<br />
Valuation allowance of equity securities ................................................................................................... 827 7,791<br />
Accrued employees’ bonuses .................................................................................................................... 1,068 10,061<br />
Warranty reserve...................................................................................................................................... 672 6,331<br />
Retirement benefits and long-term accounts payable—other.................................................................... 22,861 215,365<br />
Tax loss carried forward ........................................................................................................................... 16,312 153,669<br />
Other....................................................................................................................................................... 10,812 101,856<br />
.................................................................................................................................................................... 69,565 655,346<br />
Valuation allowance................................................................................................................................. (22,683) (213,688)<br />
24<br />
Total deferred tax assets ...............................................................................................................................<br />
Deferred tax liabilities:<br />
46,882 441,658<br />
Reserve for deferred gain on properties .................................................................................................... (1,589) (14,969)<br />
Other....................................................................................................................................................... (1,070) (10,080)<br />
Total deferred tax liabilities.......................................................................................................................... (2,660) (25,059)<br />
Net deferred tax assets.................................................................................................................................. ¥44,222 $416,599<br />
8. LEGAL RESERVE AND ADDITIONAL PAID-IN CAPITAL<br />
In accordance with the Code, the Company and its consolidated subsidiaries have provided the legal reserve as an appropriation of<br />
retained earnings. The Code provides that neither additional paid-in capital nor the legal reserve is available for dividends, but<br />
both may be used to reduce or eliminate a deficit by resolution of the shareholders or may be transferred to common stock by resolution<br />
of the Board of Directors.<br />
The legal reserve of the Company and its consolidated subsidiaries has been included in retained earnings.
NOTES TO CONSOLIDATED FINANCIAL STATEMENTS<br />
9. RETIREMENT BENEFITS<br />
The charges to income for the provision for retirement benefits of the Company and its consolidated subsidiaries for the years<br />
ended March 31, <strong>2000</strong> and 1999 were as follows:<br />
Thousands of<br />
Millions of Yen U.S. Dollars<br />
<strong>2000</strong> 1999 <strong>2000</strong><br />
Provision for retirement benefits.................................................................................................... ¥4,629 ¥5,542 $43,608<br />
10. CONTINGENT LIABILITIES<br />
The Company had the following contingent liabilities at March 31, <strong>2000</strong> and 1999:<br />
Thousands of<br />
Millions of Yen U.S. Dollars<br />
<strong>2000</strong> 1999 <strong>2000</strong><br />
Export bills discounted with banks ................................................................................................ ¥1,821 ¥3,203 $17,155<br />
As guarantors of indebtedness of others ......................................................................................... 212 250 1,997<br />
11. AMOUNTS PER SHARE<br />
Basic loss per share shown below is based on the weighted average number of shares of common stock outstanding during each<br />
year. Diluted net loss per share is based on the weighted average number of shares of common stock outstanding each year after<br />
giving effect to the dilutive potential of common shares to be issued upon the conversion of convertible bonds.<br />
Net assets per share are based on the number of shares of common stock outstanding at each balance sheet date.<br />
Yen U.S. Dollars<br />
<strong>2000</strong> 1999 <strong>2000</strong><br />
Net loss:<br />
Basic ....................................................................................................................................... ¥(197.45) ¥(76.89) $(1.86)<br />
Diluted ................................................................................................................................... — — —<br />
Yen U.S. Dollars<br />
<strong>2000</strong> 1999 <strong>2000</strong><br />
Shareholders’ equity .............................................................................................................. ¥1,073.75 ¥1,040.56 $10.12<br />
Diluted net loss per share for the years ended March 31, <strong>2000</strong> and 1999 has not been presented because no consolidated net<br />
income was reported for the years then ended.<br />
12. LEASES<br />
The following pro forma amounts represent the acquisition costs, accumulated depreciation and net book value of leased assets as<br />
of March 31, <strong>2000</strong> and 1999, which would have been reflected in the balance sheets if finance leases currently accounted for as<br />
operating leases had been capitalized.<br />
Millions of Yen Thousands of U.S. Dollars<br />
Tools Tools<br />
and and<br />
Year ended March 31, <strong>2000</strong> equipment Other Total equipment Other Total<br />
Acquisition costs ....................................................................... ¥6,394 ¥ 980 ¥7,374 $60,236 $9,232 $69,468<br />
Accumulated depreciation......................................................... 3,471 674 4,146 32,699 6,350 39,058<br />
Net book value.......................................................................... ¥2,922 ¥ 305 ¥3,228 $27,527 $2,873 $30,410<br />
25<br />
Millions of Yen Thousands of U.S. Dollars<br />
Tools Tools<br />
and and<br />
Year ended March 31, 1999 equipment Other Total equipment Other Total<br />
Acquisition costs ....................................................................... ¥7,946 ¥1,130 ¥9,077 $74,856 $10,645 $85,511<br />
Accumulated depreciation......................................................... 4,295 715 5,011 40,462 6,736 47,207<br />
Net book value.......................................................................... ¥3,651 ¥ 414 ¥4,065 $34,395 $ 3,900 $38,295
NOTES TO CONSOLIDATED FINANCIAL STATEMENTS<br />
Lease expenses relating to finance leases accounted for as operating leases amounted to ¥1,809 million ($17,042 thousand) and<br />
¥1,965 million for the years ended March 31, <strong>2000</strong> and 1999, respectively.<br />
Future minimum lease payments subsequent to March 31, <strong>2000</strong> for finance lease transactions accounted for as operating leases<br />
are summarized as follows:<br />
Thousands of<br />
Year ending March 31, Millions of Yen U.S. Dollars<br />
2001 ............................................................................................................................................................ ¥1,375 $12,953<br />
2002 and thereafter...................................................................................................................................... 1,852 17,447<br />
.................................................................................................................................................................... ¥3,228 $30,410<br />
26<br />
13. MARKETABLE AND INVESTMENT SECURITIES<br />
Information with respect to the book and fair values of marketable and investment securities for which market prices are available<br />
for the year ended March 31, <strong>2000</strong> is summarized as follows:<br />
Millions of Yen Thousands of U.S. Dollars<br />
Book Fair Unrealized Book Fair Unrealized<br />
value value gain (loss) value value gain (loss)<br />
Marketable securities:<br />
Equity securities .................................................................... ¥ 1,312 ¥ 5,148 ¥ 3,836 $ 12,360 $ 48,497 $ 36,138<br />
Debt securities ...................................................................... 44 52 7 415 490 66<br />
Other .................................................................................... 98 91 (6) 923 857 (57)<br />
................................................................................................. 1,455 5,292 3,837 13,707 49,854 36,147<br />
Investment securities:<br />
Equity securities .................................................................... 68,656 92,943 24,287 646,783 875,582 228,799<br />
Debt securities ...................................................................... 2,412 2,448 36 22,723 23,062 339<br />
Other .................................................................................... 4 5 1 38 47 9<br />
................................................................................................. 71,072 95,398 24,325 669,543 878,709 229,157<br />
Total......................................................................................... ¥72,528 ¥100,691 ¥28,163 $683,260 $948,573 $265,313<br />
The fair value of listed securities is based primarily on the closing prices on the Tokyo Stock Exchange. The fair value of overthe-counter<br />
(OTC) traded securities is the price issued by the Japan Securities Dealers’ Association. The fair value of securities<br />
with their positions, etc., is based on the position price issued by the Japan Securities Dealers’ Association. The fair value of unlisted<br />
beneficial certificates of securities investment trusts is the price quoted by the respective securities investment management<br />
companies.<br />
14. SUPPLEMENTARY CASH FLOW INFORMATION<br />
The following table represents a reconciliation of cash and cash equivalents as of March 31, <strong>2000</strong>:<br />
Millions of Yen<br />
Thousands of<br />
U.S. Dollars<br />
Cash and bank deposits................................................................................................................................ ¥33,796 $318,380<br />
Time deposits with a maturity of more than three months........................................................................... (163) (1,536)<br />
Cash and cash equivalents............................................................................................................................ ¥33,632 $316,835
NOTES TO CONSOLIDATED FINANCIAL STATEMENTS<br />
27<br />
15. DERIVATIVES AND HEDGING ACTIVITIES<br />
The Company and its subsidiaries primarily utilize forward foreign exchange and currency option contracts to hedge their exposure<br />
to fluctuations of foreign exchange arising from exporting and importing transactions in the normal course of business. As a matter<br />
of policy, the Company and its subsidiaries do not speculate in derivative transactions, which may have many huge fluctuations in<br />
their market values. The forward foreign exchange contracts utilized by the Company and its subsidiaries have market risk.<br />
However, the Company and its subsidiaries do not anticipate any risks resulting from fluctuations of foreign currency markets,<br />
except option prices paid because the currency option contracts are restricted to enter into the purchase option with put foreign<br />
currency/call yen. The Company and its subsidiaries principally follow their internal rules for the derivative transactions, under<br />
which the status of such transactions are reported to their top management on a regular basis.<br />
Millions of Yen<br />
Contracted Fair Unrealized<br />
amount value gain (loss)<br />
Forward foreign exchange contracts:<br />
Sold<br />
U.S. dollars...................................................................................................................................... ¥10,223 ¥ 9,982 ¥ 241<br />
Euro ................................................................................................................................................ 14,504 13,700 803<br />
Australian dollars............................................................................................................................. 658 638 19<br />
Canadian dollars..............................................................................................................................<br />
Purchased<br />
1,346 1,350 (3)<br />
Euro ................................................................................................................................................ 1,348 1,302 (45)<br />
Total ...............................................................................................................................................<br />
Option:<br />
Purchased<br />
28,080 26,974 1,014<br />
Put .................................................................................................................................................. (—) (—)<br />
16. SEGMENT INFORMATION<br />
The business and geographical segment information and overseas sales for the Company and its consolidated subsidiaries for the<br />
years ended March 31, <strong>2000</strong> and 1999 are outlined as follows:<br />
Business Segments<br />
Millions of Yen<br />
Musical Electronic<br />
instruments Lifestyle equipment Eliminations<br />
and audio related and metal or unallocated<br />
Year ended March 31, <strong>2000</strong><br />
I. Sales and operating income<br />
products products products Recreation Others Total amounts Consolidated<br />
Sales to external customers ......... ¥387,004 ¥46,865 ¥ 55,880 ¥23,484 ¥14,663 ¥527,897 ¥ — ¥527,897<br />
Intersegment sales or transfers .... — 1,243 4,966 — 3,735 9,944 (9,944) —<br />
Total sales .................................. 387,004 48,108 60,846 23,484 18,398 537,842 (9,944) 527,897<br />
Operating expenses .................... 359,926 49,104 78,960 24,266 18,194 530,451 (10,636) 519,814<br />
Operating income (loss).............<br />
II. Total assets, depreciation<br />
and capital expenditures<br />
¥ 27,077 ¥ (995) ¥(18,113) ¥ (781) ¥ 204 ¥ 7,390 ¥ 692 ¥ 8,082<br />
Total assets................................. ¥275,407 ¥22,395 ¥61,723 ¥77,703 ¥61,209 ¥498,439 ¥44,649 ¥543,088<br />
Depreciation .............................. 9,920 1,518 14,365 3,009 798 29,612 (977) 28,635<br />
Capital expenditures .................. 7,846 1,683 6,968 1,403 927 18,829 (285) 18,544
NOTES TO CONSOLIDATED FINANCIAL STATEMENTS<br />
Thousands of U.S. Dollars<br />
Musical Electronic<br />
instruments Lifestyle equipment Eliminations<br />
and audio related and metal or unallocated<br />
Year ended March 31, <strong>2000</strong><br />
I. Sales and operating income<br />
products products products Recreation Others Total amounts Consolidated<br />
Sales to external customers ........ $3,645,822 $441,498 $ 526,425 $221,234 $138,135 $4,973,123 $ — $4,973,123<br />
Intersegment sales or transfers ... — 11,710 46,783 — 35,186 93,679 (93,679) —<br />
Total sales ................................. 3,645,822 453,208 573,208 221,234 173,321 5,066,811 (93,679) 4,973,123<br />
Operating expenses.................... 3,390,730 462,591 743,853 228,601 171,399 4,997,183 (100,198) 4,896,976<br />
Operating income (loss)............. $ 255,082 $ (9,374) $(170,636) $ (7,358) $ 1,922 $ 69,618 $ 6,519 $ 76,138<br />
II. Total assets, depreciation<br />
and capital expenditures<br />
Total assets................................ $2,594,508 $210,975 $ 581,470 $732,011 $576,627 $4,695,610 $420,622 $5,116,232<br />
Depreciation ............................. 93,453 14,301 135,327 288,347 7,518 278,964 (9,204) 269,760<br />
Capital expenditures.................. 73,914 15,855 65,643 13,217 8,733 177,381 (2,685) 174,696<br />
28<br />
Millions of Yen<br />
Musical Electronic<br />
instruments Lifestyle equipment Eliminations<br />
and audio related and metal or unallocated<br />
Year ended March 31, 1999<br />
I. Sales and operating income<br />
products products products Recreation Others Total amounts Consolidated<br />
Sales to external customers........... ¥408,025 ¥44,841 ¥ 73,226 ¥23,324 ¥14,333 ¥563,751 ¥ — ¥563,751<br />
Intersegment sales or transfers ..... — 1,566 6,691 — 8,043 16,300 (16,300) —<br />
Total sales.................................... 408,025 46,407 79,917 23,324 22,377 580,051 (16,300) 563,751<br />
Operating expenses...................... 377,330 48,882 108,339 24,565 20,842 579,960 (16,111) 563,848<br />
Operating income (loss) .............. ¥ 30,694<br />
II. Total assets, depreciation<br />
and capital expenditures<br />
¥ (2,474) ¥ (28,421) ¥ (1,240) ¥ 1,534 ¥ 91 ¥ (188) ¥ (97)<br />
Total assets .................................. ¥253,048 ¥17,582 ¥ 95,003 ¥78,863 ¥53,010 ¥497,508 ¥ 35,344 ¥532,852<br />
Depreciation................................ 9,608 1,838 22,315 3,085 859 37,707 (1,260) 36,446<br />
Capital expenditures.................... 9,936 1,940 21,231 1,744 938 35,792 (1,449) 34,342<br />
Notes: (1) Business segments are divided into categories based on the application or nature of each product in the market.<br />
(2) Major products in each business segment:<br />
Business segment Major products & services<br />
Musical instruments Pianos, digital musical instruments, wind instruments, guitars, percussion instruments, educational musical<br />
and audio products instruments, pro-audios, audio products, music schools, IT equipment<br />
Lifestyle related System kitchens, bathtubs, washstands, furniture, parts for housing components, sound equipment for<br />
products residential use<br />
Electronic equipment LSIs, storage heads, special metals<br />
and metal products<br />
Recreation Management of leisure facilities<br />
Others Golf and archery equipment, car interior parts, industrial robots<br />
(3) As described in Note 1 (l), the Company and its consolidated subsidiaries adopted tax-effect accounting in accordance with a new accounting<br />
standard, effective the year ended March 31, <strong>2000</strong>. The effect of this change increased total assets in the segments of Musical instruments and<br />
audio products, Lifestyle related products, Electronic equipment and metal products, Recreation and Others ¥30,846 million ($290,589<br />
thousand), ¥238 million ($2,242 thousand), ¥11,538 million ($108,695 thousand), ¥25 million ($236 thousand) and ¥1,776 million<br />
($16,731 thousand), respectively, from the amounts which would have been recorded under the method applied in the previous year.<br />
(4) Eliminations or unallocated amounts of total assets are mainly translation adjustments, which amounted to ¥44,649 million ($420,622 thousand)<br />
and ¥36,739 million for the years ended March 31, <strong>2000</strong> and 1999, respectively.
NOTES TO CONSOLIDATED FINANCIAL STATEMENTS<br />
Geographical Segments<br />
Millions of Yen<br />
Asia, Oceania Eliminations<br />
and or unallocated<br />
Year ended March 31, <strong>2000</strong><br />
I. Sales and operating income<br />
Japan North America Europe other areas Total amounts Consolidated<br />
Sales to external customers ........................... ¥331,323 ¥ 94,703 ¥73,096 ¥28,773 ¥527,897 ¥ — ¥527,897<br />
Intersegment sales or transfers ...................... 163,616 6,228 510 47,722 218,078 (218,078) —<br />
Total sales .................................................... 494,940 100,932 73,607 76,496 745,976 (218,078) 527,897<br />
Operating expenses ...................................... 500,051 94,973 70,666 74,733 740,425 (220,610) 519,814<br />
Operating income (loss) ............................... ¥ (5,110) ¥ 5,958 ¥ 2,940 ¥ 1,763 ¥ 5,551 ¥ 2,531 ¥ 8,082<br />
II. Total assets............................................. ¥418,823 ¥ 35,152 ¥26,406 ¥34,296 ¥514,679 ¥ 28,409 ¥543,088<br />
Thousands of U.S. Dollars<br />
Asia, Oceania Eliminations<br />
and or unallocated<br />
Year ended March 31, <strong>2000</strong><br />
I. Sales and operating income<br />
Japan North America Europe other areas Total amounts Consolidated<br />
Sales to external customers .............. $3,121,272 $892,162 $688,610 $271,060 $4,973,123 $ — $4,973,123<br />
Intersegment sales or transfers ......... 1,541,366 58,672 4,805 449,571 2,054,432 (2,054,432) —<br />
Total sales ....................................... 4,662,647 950,843 693,424 720,641 7,027,565 (2,054,432) 4,973,123<br />
Operating expenses ......................... 4,710,796 894,706 665,718 704,032 6,975,271 (2,078,285) 4,896,976<br />
Operating income (loss) .................. $ (48,139) $ 56,128 $ 27,697 $ 16,609 $ 52,294 $ 23,844 $ 76,138<br />
II. Total assets ............................... $3,945,577 $331,154 $248,761 $323,090 $4,848,601 $ 267,631 $5,116,232<br />
Millions of Yen<br />
Asia, Oceania Eliminations<br />
and or unallocated<br />
Year ended March 31, 1999<br />
I. Sales and operating income<br />
Japan North America Europe other areas Total amounts Consolidated<br />
Sales to external customers............................. ¥349,120 ¥ 94,777 ¥82,246 ¥37,607 ¥563,751 ¥ — ¥563,751<br />
Intersegment sales or transfers........................ 167,392 9,288 1,138 36,759 214,579 (214,579) —<br />
Total sales...................................................... 516,512 104,065 83,385 74,366 778,330 (214,579) 563,751<br />
Operating expenses........................................ 530,634 96,214 78,969 71,360 777,177 (213,329) 563,848<br />
Operating income (loss)................................. ¥ (14,121) ¥ 7,851 ¥ 4,416 ¥ 3,006 ¥ 1,152 ¥ (1,249) ¥ (97)<br />
II. Total assets .............................................. ¥413,707 ¥ 39,318 ¥32,677 ¥26,823 ¥512,528 ¥ 20,324 ¥532,852<br />
29<br />
Notes: (1) Geographical segments are divided into categories based on their geographical proximity.<br />
(2) Major nations or regions included in each geographical segment:<br />
(1) North America—U.S.A., Canada<br />
(2) Europe—Germany, U.K.<br />
(3) Asia, Oceania and other areas—Singapore, Australia<br />
(3) As described in Note 1 (1), the Company and its consolidated subsidiaries adopted tax-effect accounting in accordance with a new accounting<br />
standard, effective the year ended March 31, <strong>2000</strong>. The effect of this change increased total assets in the segments of Japan, North America,<br />
Europe and Asia, Oceania and other areas ¥42,253 million ($398,050 thousand), ¥1,904 million ($17,937 thousand), ¥54 million ($509 thousand)<br />
and ¥213 million ($2,007 thousand), respectively, from the amounts which would have been recorded under the method applied in the<br />
previous year.<br />
(4) Eliminations or unallocated amounts of total assets principally consist of translation adjustments, which amounted to ¥44,649 million ($420,622<br />
thousand) and ¥36,739 million as of March 31, <strong>2000</strong> and 1999, respectively.<br />
Overseas Sales<br />
Millions of Yen<br />
Asia, Oceania<br />
Year ended March 31, <strong>2000</strong> North America Europe and other areas Total<br />
Overseas sales:<br />
Overseas sales............................................................................................................. ¥96,005 ¥73,397 ¥50,452 ¥219,855<br />
Consolidated net sales................................................................................................ — — — 527,897<br />
% of consolidated net sales......................................................................................... 18.2% 13.9% 9.5% 41.6%
NOTES TO CONSOLIDATED FINANCIAL STATEMENTS<br />
Thousands of U.S. Dollars<br />
Asia, Oceania<br />
Year ended March 31, <strong>2000</strong><br />
Overseas sales:<br />
North America Europe and other areas Total<br />
Overseas sales ...................................................................................................... $904,427 $691,446 $475,290 $2,071,173<br />
Consolidated net sales ......................................................................................... — — — 4,973,123<br />
% of consolidated net sales .................................................................................. 18.2% 13.9% 9.6% 41.6%<br />
30<br />
Millions of Yen<br />
Asia, Oceania<br />
Year ended March 31, 1999<br />
Overseas sales:<br />
North America Europe and other areas Total<br />
Overseas sales............................................................................................................. ¥96,203 ¥82,517 ¥62,491 ¥241,212<br />
Consolidated net sales................................................................................................ — — — 563,751<br />
% of consolidated net sales......................................................................................... 17.1% 14.6% 11.1% 42.8%<br />
Notes: (1) Overseas sales are sales of the Company and its consolidated subsidiaries.<br />
Geographical areas are divided into categories based on their geographical proximity.<br />
(2) Major nations or regions included in each geographical segment:<br />
(1) North America—U.S.A., Canada<br />
(2) Europe—Germany, U.K.<br />
(3) Asia, Oceania and other areas—Singapore, Australia
<strong>REPORT</strong> OF INDEPENDENT AUDITORS<br />
The Board of Directors<br />
<strong>YAMAHA</strong> <strong>CORPORATION</strong><br />
We have audited the accompanying consolidated balance sheets of <strong>YAMAHA</strong> <strong>CORPORATION</strong> and consolidated<br />
subsidiaries as of March 31, <strong>2000</strong> and 1999, and the related consolidated statements of operations and shareholders’<br />
equity for the years then ended and the related consolidated statement of cash flows for the year ended March 31,<br />
<strong>2000</strong>, all expressed in yen. Our audits were made in accordance with auditing standards, procedures and practices generally<br />
accepted and applied in Japan and, accordingly, included such tests of the accounting records and such other<br />
auditing procedures as we considered necessary in the circumstances.<br />
In our opinion, the consolidated financial statements referred to above present fairly the consolidated financial position<br />
of <strong>YAMAHA</strong> <strong>CORPORATION</strong> and consolidated subsidiaries at March 31, <strong>2000</strong> and 1999, the consolidated<br />
results of their operations for the years then ended and the consolidated results of their cash flows for the year ended<br />
March 31, <strong>2000</strong>, in conformity with accounting principles and practices generally accepted in Japan consistently<br />
applied during the period except for the change, with which we concur, in the method of accounting for prior service<br />
cost of the employees’ pension plans as described in Note 3 to the consolidated financial statements.<br />
As described in Note 1 to the consolidated financial statements, <strong>YAMAHA</strong> <strong>CORPORATION</strong> and consolidated subsidiaries<br />
have adopted new accounting standards for consolidation and tax-effect accounting in the preparation of<br />
their consolidated financial statements for the year ended March 31, <strong>2000</strong>.<br />
The U.S. dollar amounts in the accompanying consolidated financial statements with respect to the year ended March<br />
31, <strong>2000</strong> are presented solely for convenience. Our audit also included the translation of yen amounts into U.S. dollar<br />
amounts and, in our opinion, such translation has been made on the basis described in Note 2 to the consolidated<br />
financial statements.<br />
Century Ota Showa & Co.<br />
Hamamatsu, Japan<br />
June 29, <strong>2000</strong><br />
See Note 1 to the consolidated financial statements which explains the basis of preparation of the consolidated financial statements of<br />
<strong>YAMAHA</strong> <strong>CORPORATION</strong> and consolidated subsidiaries under Japanese accounting principles and practices.<br />
31
WORLDWIDE NETWORK<br />
Japan Overseas<br />
�Yamaha Music Tokyo Co., Ltd.<br />
�Yamaha Music Nishitokyo Co., Ltd.<br />
�Yamaha Music Yokohama Co., Ltd.<br />
�Yamaha Music Kitakanto Co., Ltd.<br />
�Yamaha Music Higashikanto Co., Ltd.<br />
�Yamaha Music Niigata Co., Ltd.<br />
�Yamaha Music Osaka Co., Ltd.<br />
�Yamaha Music Kobe Co., Ltd.<br />
�Yamaha Music Okayama Co., Ltd.<br />
�Yamaha Music Matsuyama Co., Ltd.<br />
�Yamaha Music Nagoya Co., Ltd.<br />
�Yamaha Music Hamamatsu Co., Ltd.<br />
�Yamaha Music Kanazawa Co., Ltd.<br />
�Yamaha Music Kyushu Co., Ltd.<br />
�Yamaha Music Hokkaido Co., Ltd.<br />
�Yamaha Music Tohoku Co., Ltd.<br />
�Yamaha Music Hiroshima Co., Ltd.<br />
�Yamaha Music Trading Corporation<br />
�Yamaha Music Media Corporation<br />
�Yamaha Sound Technologies Inc.<br />
�Yamaha Kagoshima Semiconductor Inc.<br />
�Yamaha Livingtec Corporation<br />
�Yamaha Living Products Corporation<br />
�Yamaha Resort Corporation<br />
�Kiroro Development Corporation<br />
�Haimurubushi Inc.<br />
�Yamaha Metanix Corporation<br />
�Yamaha Fine Technologies Co., Ltd.<br />
�Yamaha Credit Corporation<br />
�Yamaha Insurance Service Co., Ltd.<br />
Sweden<br />
United Kingdom<br />
Germany<br />
France<br />
Italy<br />
Spain<br />
United Arab Emirates<br />
American Region<br />
�Yamaha Corporation of America<br />
�Yamaha Exporting, Inc.<br />
�Yamaha Electronics Corporation,<br />
U.S.A.<br />
�Yamaha Music Manufacturing, Inc.<br />
�Yamaha Musical Products, Inc.<br />
�Yamaha Canada Music Ltd.<br />
�Yamaha de México, S.A. de C.V.<br />
�Yamaha de Panamá, S.A.<br />
�Yamaha Musical do Brasil Ltda.<br />
�Yamaha Music Argentina S.A.<br />
European Region<br />
�Yamaha-Kemble Music (U.K.) Ltd.<br />
�Kemble & Company Ltd.<br />
�Kemble Music Ltd.<br />
�Yamaha MusicSoft Europe Ltd.<br />
�Yamaha Electronics (U.K.) Ltd.<br />
�Yamaha Europa G.m.b.H.<br />
�Yamaha Elektronik Europa G.m.b.H.<br />
�Yamaha Musique France S.A.<br />
�Yamaha Electronique France S.A.<br />
�Yamaha Electronique Alsace S.A.<br />
�Yamaha Musica Italia s.p.a.<br />
�Yamaha •Hazen Musica S.A.<br />
�Yamaha Scandinavia A.B.<br />
Thailand<br />
China<br />
Malaysia<br />
Singapore<br />
Indonesia<br />
Taiwan<br />
Australia<br />
32<br />
�Consolidated Subsidiaries<br />
�Non-consolidated Subsidiaries<br />
�Company accounted for by the equity method<br />
Asia, Oceania and Other Region<br />
�Tianjin Yamaha Electronic Musical<br />
Instruments, Inc.<br />
�Guangzhou Yamaha-Pearl River<br />
Piano Inc.<br />
�Yamaha Trading (Shanghai) Co., Ltd.<br />
�Xiaoshan Yamaha Musical<br />
Instrument Co., Ltd.<br />
�Yamaha Electronics (China) Ltd.<br />
�Taiwan Yamaha Musical Inst. Mfg.<br />
Co., Ltd.<br />
�Yamaha KHS Music Co., Ltd.<br />
�Kaohsiung Yamaha Co., Ltd.<br />
�P.T. Yamaha Music Indonesia<br />
(Distributor)<br />
�P.T. Yamaha Indonesia<br />
�P.T. Yamaha Music Manufacturing<br />
Indonesia<br />
�P.T. Yamaha Musical Products<br />
Indonesia<br />
�P.T. Yamaha Manufacturing Asia<br />
�P.T. Yamaha Electronics<br />
Manufacturing Indonesia<br />
�Yamaha Music (Asia) Pte. Ltd.<br />
�Yamaha Systems Technology<br />
Singapore Pte. Ltd.<br />
�Yamaha Electronics Asia Pte. Ltd.<br />
�Siam Music Yamaha Co., Ltd.<br />
�Yamaha Electronics Manufacturing<br />
(M) Sdn. Bhd.<br />
�Yamaha Music (Malaysia) Sdn. Bhd.<br />
�Yamaha Music Australia Pty., Ltd.<br />
�Yamaha Music Gulf FZE<br />
�Yamaha Motor Co., Ltd.<br />
�KORG Inc.<br />
Mexico<br />
Canada<br />
United States of America<br />
Panama<br />
Brazil<br />
Argentina
CORPORATE DATA<br />
Board of Directors and<br />
Corporate Auditors<br />
President and Representative<br />
Director<br />
Shuji Ito<br />
Senior Managing Director<br />
Katsuhiro Kishida<br />
Managing Directors<br />
Kunihiro Maejima<br />
Masatada Wachi<br />
Directors<br />
Noriyuki Egawa<br />
Yoshihiro Umeda<br />
Haruki Koike<br />
Shinya Hanamoto<br />
Shigeo Harikae<br />
Hirokazu Kato<br />
Tsuneo Kuroe<br />
Corporate Auditors<br />
Naomoto Ota<br />
Hisatake Chatani<br />
Shigebumi Suzuki<br />
Kimiyuki Nakamura<br />
(As of June 30, <strong>2000</strong>)<br />
Investor Information<br />
Head Office<br />
10-1, Nakazawa-cho, Hamamatsu,<br />
Shizuoka 430-8650, Japan<br />
Accounting & Finance Division<br />
Tel: +81 53 460-2141<br />
Fax: +81 53 464-8554<br />
General Administration Division<br />
Tel: +81 53 460-2211<br />
Fax: +81 53 460-2525<br />
Fiscal Year-end Date<br />
March 31<br />
Dividends<br />
Year-end: To the shareholders of record<br />
on March 31<br />
Interim: To the shareholders of record<br />
on September 30<br />
Date of Establishment<br />
October 1897<br />
Stated Capital<br />
¥28,533 million<br />
Number of Common Stock<br />
Authorized: 700,000,000 shares<br />
Issued: 206,523,263 shares<br />
Number of Shareholders<br />
12,429<br />
Number of Employees<br />
21,599<br />
Number of Consolidated Subsidiaries<br />
72<br />
Number of Companies Accounted for<br />
by the Equity Method<br />
3<br />
Stock Exchange Listings<br />
Tokyo, Osaka, and Nagoya<br />
First Section, Code No. 7951<br />
Stock Price Movement<br />
(Yen)<br />
’98<br />
Apr.<br />
l<br />
June<br />
July<br />
l<br />
Sep.<br />
Oct.<br />
l<br />
Dec.<br />
’99<br />
Jan.<br />
l<br />
Mar.<br />
Apr.<br />
l<br />
June<br />
July<br />
l<br />
Sep.<br />
Oct.<br />
l<br />
Dec.<br />
’00<br />
Jan.<br />
l<br />
Mar.<br />
2,000<br />
1,500<br />
1,000<br />
500<br />
0<br />
33<br />
Transfer Agent and Registrar<br />
The Chuo Mitsui Trust<br />
and Banking Co., Ltd.<br />
Nagoya Branch<br />
Stock Transfer Agency Department<br />
Address: 2-20-25, Nishiki, Naka-ku,<br />
Nagoya 460-8685, Japan<br />
Tel: +81 52 231-1145<br />
(Formerly The Chuo Trust and Banking<br />
Co., Ltd.; merged with The Mitsui Trust<br />
and Banking Co., Ltd., on April 1, <strong>2000</strong>.)<br />
Newspaper for Official Notice<br />
Nihon Keizai Shimbun<br />
Annual General Meeting of<br />
Shareholders<br />
The annual general meeting of shareholders<br />
of the Corporation is normally held in<br />
June each year in Hamamatsu, Japan. In<br />
addition, the Corporation may hold<br />
an extraordinary general meeting of shareholders<br />
as necessary, giving at least two<br />
weeks’ prior notice to shareholders.<br />
Notice to nonresident shareholders of any<br />
shareholders’ meeting will be mailed to<br />
their standing proxies or to their mailing<br />
addresses in Japan.<br />
Auditor<br />
Century Ota Showa & Co.<br />
Main Shareholders<br />
Percentage of Total Shares (%)<br />
The Dai-Ichi Kangyo Bank, Ltd. 4.80<br />
The Fuji Bank, Ltd. 4.80<br />
The Sumitomo Bank, Ltd. 4.80<br />
The Sumitomo Marine &<br />
Fire Insurance, Co., Ltd. 4.49<br />
The Shizuoka Bank, Limited 4.04<br />
(As of March 31, <strong>2000</strong>)