Introduction to Statistics in Psychology: PSY 201 - Department of ...
Introduction to Statistics in Psychology: PSY 201 - Department of ...
Introduction to Statistics in Psychology: PSY 201 - Department of ...

You also want an ePaper? Increase the reach of your titles
YUMPU automatically turns print PDFs into web optimized ePapers that Google loves.
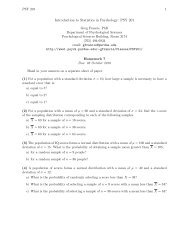
<strong>PSY</strong> <strong>201</strong> 3<br />
(9) Montarello and Mart<strong>in</strong>s (2005) found that fifth-grade students completed more mathematics<br />
problems correctly when simple problems were mixed <strong>in</strong> with their regular math assignments. To<br />
further explore this phenomenon, suppose that a researcher selects a standardized mathematics<br />
achievement test that produces a normal distribution <strong>of</strong> scores with a mean <strong>of</strong> µ = 100 and a<br />
stanard deviation <strong>of</strong> σ = 18. The researcher modifies the test by <strong>in</strong>sert<strong>in</strong>g a set <strong>of</strong> very easy<br />
problems among the standardized questions, and gives the modified test <strong>to</strong> a sample <strong>of</strong> n = 36<br />
students. If the average test score for the sample is X = 104, is this result sufficient <strong>to</strong> conclude<br />
that <strong>in</strong>sert<strong>in</strong>g the easy questions improves performance Use a one-tailed test with α = 0.01<br />
(10) Compute the t values that form the boundaries <strong>of</strong> the critical region for a two-tailed test with<br />
α = 0.05 for each <strong>of</strong> the follow<strong>in</strong>g df values.<br />
a) df = 8<br />
b) df = 15<br />
c) df = 24<br />
(11) A sample is randomly selected from a population with a mean <strong>of</strong> µ = 50, and a treatment<br />
is adm<strong>in</strong>istered <strong>to</strong> the <strong>in</strong>dividuals <strong>in</strong> the sample. After treatment, the sample is found <strong>to</strong> have a<br />
mean <strong>of</strong> X = 56 with a standard deviation <strong>of</strong> s = 8.<br />
a) If there are n = 4 <strong>in</strong>dividuals <strong>in</strong> the sample, are the data sufficient <strong>to</strong> reject H 0 and conclude<br />
that the treatment has a significant effect us<strong>in</strong>g a two-tailed test with α = 0.05<br />
b) If there are n = 16 <strong>in</strong>dividuals <strong>in</strong> the sample, are the data sufficient <strong>to</strong> reject H 0 and conclude<br />
that the treatment has a significant effect Aga<strong>in</strong>, assume a two-tailed test with α = 0.05.<br />
(12) Last fall, a sample <strong>of</strong> n = 36 freshmen was selected <strong>to</strong> participate <strong>in</strong> a new 4-hour tra<strong>in</strong><strong>in</strong>g<br />
program designed <strong>to</strong> improve study skills. To evaluate the effectiveness <strong>of</strong> the new program, the<br />
sample was compared with the rest <strong>of</strong> the freshman class. All freshmen must take the same English<br />
Language Skills course, and the mean score on the f<strong>in</strong>al exam for the entire freshman class <strong>of</strong><br />
µ = 75. The students <strong>in</strong> the new program had a mean score <strong>of</strong> X = 79.4 with a standard deviation<br />
<strong>of</strong> s = 18.<br />
a) On the basis <strong>of</strong> this data, can the college conclude that the students <strong>in</strong> the new program<br />
performed significantly better than the rest <strong>of</strong> the freshman class Use a one-tailed test with<br />
α = 0.05.<br />
b) On the basis <strong>of</strong> this data, can the college conclude that the students <strong>in</strong> the new program are<br />
significantly different from the rest <strong>of</strong> the freshman class Use a two-tailed test with α = 0.05.<br />
(13) The librarian at the local elementary school claims that, on average, the books <strong>in</strong> the library<br />
are more than 20 years old. To test this claim, a student takes a sample <strong>of</strong> n = 30 books and<br />
records the publication date for each. The sample produces an average age <strong>of</strong> X = 23.8 years with<br />
a variance <strong>of</strong> s 2 = 67.5. Use this sample <strong>to</strong> conduct a one-tailed test with α = 0.01 <strong>to</strong> determ<strong>in</strong>e<br />
whether the average age <strong>of</strong> the library books is significantly greater than 20 years.


![Exam 4 Study Guide[1]](https://img.yumpu.com/45196739/1/190x245/exam-4-study-guide1.jpg?quality=85)