

Assuring Food Security in Developing Countries under the - Unctad
Assuring Food Security in Developing Countries under the - Unctad
Assuring Food Security in Developing Countries under the - Unctad

Create successful ePaper yourself
Turn your PDF publications into a flip-book with our unique Google optimized e-Paper software.
6<br />
Box 1<br />
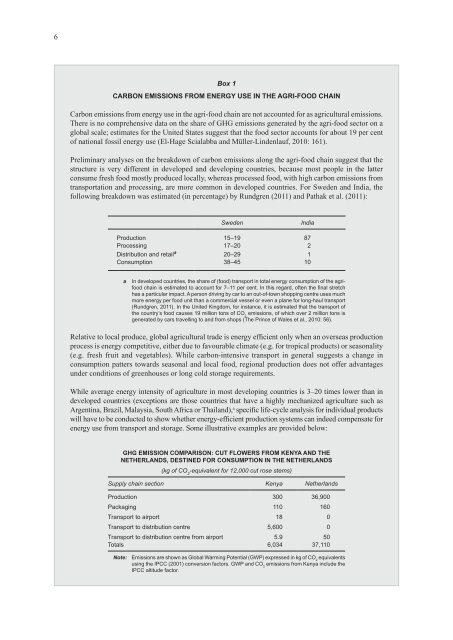
carbon eMissions froM energy use <strong>in</strong> <strong>the</strong> agri-food cha<strong>in</strong><br />
Carbon emissions from energy use <strong>in</strong> <strong>the</strong> agri-food cha<strong>in</strong> are not accounted for as agricultural emissions.<br />
There is no comprehensive data on <strong>the</strong> share of GHG emissions generated by <strong>the</strong> agri-food sector on a<br />
global scale; estimates for <strong>the</strong> United States suggest that <strong>the</strong> food sector accounts for about 19 per cent<br />
of national fossil energy use (El-Hage Scialabba and Müller-L<strong>in</strong>denlauf, 2010: 161).<br />
Prelim<strong>in</strong>ary analyses on <strong>the</strong> breakdown of carbon emissions along <strong>the</strong> agri-food cha<strong>in</strong> suggest that <strong>the</strong><br />
structure is very different <strong>in</strong> developed and develop<strong>in</strong>g countries, because most people <strong>in</strong> <strong>the</strong> latter<br />
consume fresh food mostly produced locally, whereas processed food, with high carbon emissions from<br />
transportation and process<strong>in</strong>g, are more common <strong>in</strong> developed countries. For Sweden and India, <strong>the</strong><br />
follow<strong>in</strong>g breakdown was estimated (<strong>in</strong> percentage) by Rundgren (2011) and Pathak et al. (2011):<br />
Sweden India<br />
Production 15–19 87<br />
Process<strong>in</strong>g 17–20 2<br />
Distribution and retail a<br />
20–29 1<br />
Consumption 38–45 10<br />
a In developed countries, <strong>the</strong> share of (food) transport <strong>in</strong> total energy consumption of <strong>the</strong> agrifood<br />
cha<strong>in</strong> is estimated to account for 7–11 per cent. In this regard, often <strong>the</strong> f<strong>in</strong>al stretch<br />
has a particular impact. A person driv<strong>in</strong>g by car to an out-of-town shopp<strong>in</strong>g centre uses much<br />
more energy per food unit than a commercial vessel or even a plane for long-haul transport<br />
(Rundgren, 2011). In <strong>the</strong> United K<strong>in</strong>gdom, for <strong>in</strong>stance, it is estimated that <strong>the</strong> transport of<br />
<strong>the</strong> country’s food causes 19 million tons of CO 2 emissions, of which over 2 million tons is<br />
generated by cars travell<strong>in</strong>g to and from shops (The Pr<strong>in</strong>ce of Wales et al., 2010: 56).<br />
Relative to local produce, global agricultural trade is energy efficient only when an overseas production<br />
process is energy competitive, ei<strong>the</strong>r due to favourable climate (e.g. for tropical products) or seasonality<br />
(e.g. fresh fruit and vegetables). While carbon-<strong>in</strong>tensive transport <strong>in</strong> general suggests a change <strong>in</strong><br />
consumption patters towards seasonal and local food, regional production does not offer advantages<br />
<strong>under</strong> conditions of greenhouses or long cold storage requirements.<br />
While average energy <strong>in</strong>tensity of agriculture <strong>in</strong> most develop<strong>in</strong>g countries is 3–20 times lower than <strong>in</strong><br />
developed countries (exceptions are those countries that have a highly mechanized agriculture such as<br />
Argent<strong>in</strong>a, Brazil, Malaysia, South Africa or Thailand), a specific life-cycle analysis for <strong>in</strong>dividual products<br />
will have to be conducted to show whe<strong>the</strong>r energy-efficient production systems can <strong>in</strong>deed compensate for<br />
energy use from transport and storage. Some illustrative examples are provided below:<br />
ghg eMission coMParison: cut flowers froM Kenya and <strong>the</strong><br />
ne<strong>the</strong>rlands, dest<strong>in</strong>ed for consuMPtion <strong>in</strong> <strong>the</strong> ne<strong>the</strong>rlands<br />
(kg of CO 2 -equivalent for 12,000 cut rose stems)<br />
Supply cha<strong>in</strong> section Kenya Ne<strong>the</strong>rlands<br />
Production 300 36,900<br />
Packag<strong>in</strong>g 110 160<br />
Transport to airport 18 0<br />
Transport to distribution centre 5,600 0<br />
Transport to distribution centre from airport 5.9 50<br />
Totals 6,034 37,110<br />
Note: Emissions are shown as Global Warm<strong>in</strong>g Potential (GWP) expressed <strong>in</strong> kg of CO 2 equivalents<br />
us<strong>in</strong>g <strong>the</strong> IPCC (2001) conversion factors. GWP and CO 2 emissions from Kenya <strong>in</strong>clude <strong>the</strong><br />
IPCC altitude factor.


