

Assuring Food Security in Developing Countries under the - Unctad
Assuring Food Security in Developing Countries under the - Unctad
Assuring Food Security in Developing Countries under the - Unctad

You also want an ePaper? Increase the reach of your titles
YUMPU automatically turns print PDFs into web optimized ePapers that Google loves.
Box 2<br />
required changes <strong>in</strong> food consuMPtion Patterns<br />
Although an <strong>in</strong>-depth analysis of desirable changes <strong>in</strong> food consumption patterns is beyond <strong>the</strong> purview<br />
of this paper, it should be mentioned that several specific changes may significantly reduce GHG <strong>in</strong>tensity<br />
of food. Analysis of household food consumption suggests that reduced GHG emissions (i.e. “climatesmart<br />
diets”) could result from:<br />
(i) <strong>the</strong> substitution of crop food products for animal food products a (for <strong>the</strong> replacement of animal<br />
prote<strong>in</strong>s it is very important to pay attention also to <strong>the</strong> nutritive values of foods and gett<strong>in</strong>g a<br />
balanced diet; animal prote<strong>in</strong>s could be mostly or partly replaced by o<strong>the</strong>r prote<strong>in</strong>, such as pulses<br />
and vegetables);<br />
(ii) favour<strong>in</strong>g consumption of locally produced and seasonal food to reduce transport and cold storagerelated<br />
GHG emissions.<br />
Comparisons of GHG <strong>in</strong>tensity of common diets <strong>in</strong> India showed that a non-vegetarian meal with mutton<br />
emitted 1.8 times more GHG than a vegetarian meal; 1.5 times more than a non-vegetarian meal with<br />
chicken and an ovo-vegetarian meal; and 1.4 times more than a lacto-vegetarian meal.<br />
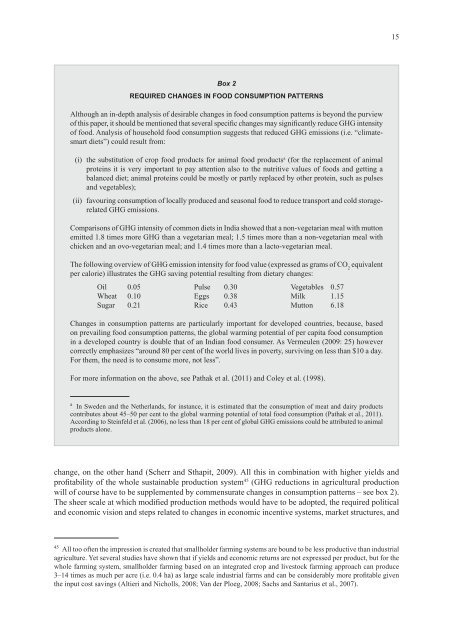
The follow<strong>in</strong>g overview of GHG emission <strong>in</strong>tensity for food value (expressed as grams of CO equivalent<br />
2<br />
per calorie) illustrates <strong>the</strong> GHG sav<strong>in</strong>g potential result<strong>in</strong>g from dietary changes:<br />
Oil 0.05 Pulse 0.30 Vegetables 0.57<br />
Wheat 0.10 Eggs 0.38 Milk 1.15<br />
Sugar 0.21 Rice 0.43 Mutton 6.18<br />
Changes <strong>in</strong> consumption patterns are particularly important for developed countries, because, based<br />
on prevail<strong>in</strong>g food consumption patterns, <strong>the</strong> global warm<strong>in</strong>g potential of per capita food consumption<br />
<strong>in</strong> a developed country is double that of an Indian food consumer. As Vermeulen (2009: 25) however<br />
correctly emphasizes “around 80 per cent of <strong>the</strong> world lives <strong>in</strong> poverty, surviv<strong>in</strong>g on less than $10 a day.<br />
For <strong>the</strong>m, <strong>the</strong> need is to consume more, not less”.<br />
For more <strong>in</strong>formation on <strong>the</strong> above, see Pathak et al. (2011) and Coley et al. (1998).<br />
a In Sweden and <strong>the</strong> Ne<strong>the</strong>rlands, for <strong>in</strong>stance, it is estimated that <strong>the</strong> consumption of meat and dairy products<br />
contributes about 45–50 per cent to <strong>the</strong> global warm<strong>in</strong>g potential of total food consumption (Pathak et al., 2011).<br />
Accord<strong>in</strong>g to Ste<strong>in</strong>feld et al. (2006), no less than 18 per cent of global GHG emissions could be attributed to animal<br />
products alone.<br />
change, on <strong>the</strong> o<strong>the</strong>r hand (Scherr and Sthapit, 2009). All this <strong>in</strong> comb<strong>in</strong>ation with higher yields and<br />
profitability of <strong>the</strong> whole susta<strong>in</strong>able production system 45 (GHG reductions <strong>in</strong> agricultural production<br />
will of course have to be supplemented by commensurate changes <strong>in</strong> consumption patterns – see box 2).<br />
The sheer scale at which modified production methods would have to be adopted, <strong>the</strong> required political<br />
and economic vision and steps related to changes <strong>in</strong> economic <strong>in</strong>centive systems, market structures, and<br />
45 All too often <strong>the</strong> impression is created that smallholder farm<strong>in</strong>g systems are bound to be less productive than <strong>in</strong>dustrial<br />
agriculture. Yet several studies have shown that if yields and economic returns are not expressed per product, but for <strong>the</strong><br />
whole farm<strong>in</strong>g system, smallholder farm<strong>in</strong>g based on an <strong>in</strong>tegrated crop and livestock farm<strong>in</strong>g approach can produce<br />
3–14 times as much per acre (i.e. 0.4 ha) as large scale <strong>in</strong>dustrial farms and can be considerably more profitable given<br />
<strong>the</strong> <strong>in</strong>put cost sav<strong>in</strong>gs (Altieri and Nicholls, 2008; Van der Ploeg, 2008; Sachs and Santarius et al., 2007).<br />
15


