Network Intrusion Detection Using Tree Augmented Naive-Bayes
Network Intrusion Detection Using Tree Augmented Naive-Bayes
Network Intrusion Detection Using Tree Augmented Naive-Bayes

You also want an ePaper? Increase the reach of your titles
YUMPU automatically turns print PDFs into web optimized ePapers that Google loves.
<strong>Network</strong> <strong>Intrusion</strong> <strong>Detection</strong> <strong>Using</strong> <strong>Tree</strong> <strong>Augmented</strong> <strong>Naive</strong>-<strong>Bayes</strong><br />
R. Najafi ∗<br />
Sanay Systems<br />
najafirobab88@gmail.com<br />
Mohsen Afsharchi<br />
University of Zanjan<br />
afsharchim@znu.ac.ir<br />
Abstract: Computer networks are nowadays subject to an increasing number of attacks. <strong>Intrusion</strong><br />
<strong>Detection</strong> Systems (IDS) are designed to protect them by identifying malicious behaviors or<br />
improper uses. Since the scope is different in each case (register already-known menaces to later<br />
recognize them or model legitimate uses to trigger when a variation is detected), IDS have failed so<br />
far to respond against both kind of attacks. In this paper, we apply two of the efficient data mining<br />
algorithms called <strong>Naive</strong> <strong>Bayes</strong> and tree augmented <strong>Naive</strong> <strong>Bayes</strong> for network intrusion detection and<br />
compare them with decision tree and support vector machine. We present experimental results on<br />
NSL-KDD data set and then observe that our intrusion detection system has higher detection rate<br />
and lower false positive rate.<br />
Keywords: Anomaly And Misuse <strong>Detection</strong>, <strong>Bayes</strong>ian <strong>Network</strong>, <strong>Intrusion</strong> detection, <strong>Tree</strong> <strong>Augmented</strong> <strong>Naive</strong>-<strong>Bayes</strong>,<br />
<strong>Naive</strong>-<strong>Bayes</strong>.<br />
1 Introduction<br />
<strong>Intrusion</strong> detection techniques are the last line of defense<br />
against computer attacks behind secure network<br />
architecture design, firewalls, and personal screening.<br />
Despite the plethora of intrusion prevention techniques<br />
available, attacks against computer systems are still<br />
successful. Thus, intrusion detection systems (IDSs)<br />
play a vital role in network security. The attacks are<br />
targeted at stealing confidential information such as<br />
credit card numbers, passwords, and other financial information.<br />
One solution to this dilemma is the use of<br />
intrusion detection system (IDS). It is very popular security<br />
tool over the last two decades, and today, IDS<br />
based on computer intelligent are attracting attention<br />
of current research community a lot.<br />
We present experimental results on NSL-KDD data<br />
set and WEKA software.<br />
Valdes and Skinner employed a naive <strong>Bayes</strong>ian network<br />
to perform intrusion detection on network events.<br />
The classification capability of a naive <strong>Bayes</strong>ian network<br />
is identical to a threshold-based system that computes<br />
the sum of the outputs obtained from the child<br />
nodes. This is due to the fact that all models (i.e.,<br />
the child nodes) operate independently and only influence<br />
the probability of the root node. This single<br />
probability value at the root node can be represented<br />
by a threshold. In addition, the restriction of having<br />
a single parent node complicates the incorporation of<br />
additional information. This is because variables that<br />
represent such information cannot be linked directly to<br />
the nodes representing the model outputs. [2]<br />
ADAM (Audit Data Analysis and Mining) is an<br />
intrusion detector built to detect intrusions using data<br />
mining techniques. It first absorbs training data known<br />
to be free of attacks. Next, it uses an algorithm to<br />
group attacks, unknown behaviors, and false alarms.<br />
ADAM has several useful capabilities, namely;<br />
• Classifying an item as a known attack<br />
• Classifying an item as a normal event<br />
• Classifying an item as an unknown attack<br />
∗ Corresponding Author, P. O. Box 45195-1159, F: (+98) 241 421-5071, T: (+98) 241 415-5067<br />
• Match audit trial data to the rules it gives rise<br />
to. [8]<br />
Also, TAN algorithm can be used for ranking, regres-
CICIS’12, IASBS, Zanjan, Iran, May 29-31, 2012<br />
sion analysis, probability estimation and engine fault<br />
diagnosis improvement.<br />
The paper is structured as follows: Section 2 introduces<br />
<strong>Bayes</strong>ian networks and classifications. Section<br />
3 introduces intrusion detection systems and different<br />
kinds of attacks. Section 4 describes intrusion detection<br />
with <strong>Bayes</strong>ian networks. Section 5 presents and<br />
analyzes our experimental results. Section 6 summarizes<br />
the main conclusions.<br />
2 Primary Description<br />
A <strong>Bayes</strong>ian network B =< N, A, Θ > is a directed<br />
acyclic graph (DAG) < N, A > where each node n ∈ N<br />
represents a domain variable (e.g., a dataset attribute),<br />
and each arc a ∈ A between nodes represents a probabilistic<br />
dependency, quantified using a conditional<br />
probability distribution (CP table) θ i ∈ Θ for each<br />
node n i . A BN can be used to compute the conditional<br />
probability of one node, given values assigned to<br />
the other nodes [3].<br />
• <strong>Bayes</strong>ian networks in conjunction with <strong>Bayes</strong>ian<br />
methods and other types of models offer an efficient<br />
and principled approach for avoiding the<br />
overfitting of data. [1]<br />
<strong>Bayes</strong>ian network structure represents the interrelationships<br />
among the dataset attributes. Human<br />
experts can easily understand the network structures<br />
and if necessary modify them to obtain better predictive<br />
models. By adding decision nodes and utility<br />
nodes, BN models can also be extended to decision<br />
networks for decision analysis. Applying <strong>Bayes</strong>ian<br />
network techniques to classification involves two subtasks:<br />
BN learning (training) to get a model and BN<br />
inference to classify instances. The two major tasks<br />
in learning a BN are: learning the graphical structure,<br />
and then learning the parameters (CP table entries)<br />
for that structure.<br />
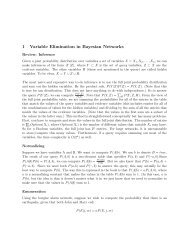
The set of parents of a node x i in B S is denoted as<br />
π i . The structure is annotated with a set of conditional<br />
probabilities (B P ), containing a term P (x i = X i |π i =<br />
Π i ) for each possible value Xi of xi and each possible<br />
instantiation Π i of π i . [3]<br />
One application of <strong>Bayes</strong>ian networks is classification.<br />
A somewhat simplified statement of the problem<br />
of supervised learning is as follows. Given a training<br />
set of labeled instances of the form < a 1 , ..., a n > , C<br />
construct a classifier f capable of predicting the value<br />
of C, given instances < a 1 , ..., a n > as input. The variables<br />
A 1 , ..., A n are called features or attributes, and<br />
the variable C is usually referred to as the class variable<br />
or label. [11]<br />
Two types of <strong>Bayes</strong>ian network classifiers that we<br />
use them in this paper are: <strong>Naive</strong>-<strong>Bayes</strong> and <strong>Tree</strong> <strong>Augmented</strong><br />
<strong>Naive</strong>-<strong>Bayes</strong><br />
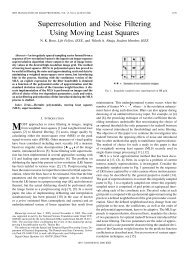
Figure 1: <strong>Bayes</strong>ian network for cancer<br />
The main advantages of <strong>Bayes</strong>ian networks are:<br />
• <strong>Bayes</strong>ian networks can readily handle incomplete<br />
data sets.<br />
• <strong>Bayes</strong>ian networks allow one to learn about<br />
causal relationships.<br />
2.1 <strong>Naive</strong>-<strong>Bayes</strong><br />
A <strong>Naive</strong>-<strong>Bayes</strong> BN is a simple structure that has the<br />
class node as the parent node of all other nodes (see<br />
Figure 1). No other connections are allowed in a <strong>Naive</strong>-<br />
<strong>Bayes</strong> structure. <strong>Naive</strong>-<strong>Bayes</strong> assumes that all the features<br />
are independent of each other. In recent years, a<br />
lot of effort has focused on improving <strong>Naive</strong>-<strong>Bayes</strong>ian<br />
classifiers, following two general approaches: selecting<br />
feature subset and relaxing independence assumptions.
The Third International Conference on Contemporary Issues in Computer and Information Sciences<br />
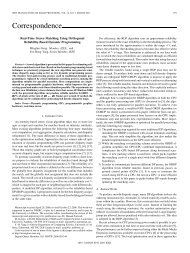
Figure 2: <strong>Naive</strong>-<strong>Bayes</strong> Structure [6]<br />
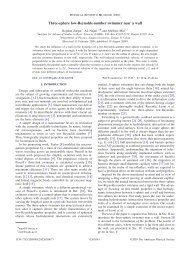
2.2 <strong>Tree</strong> <strong>Augmented</strong> <strong>Naive</strong>-<strong>Bayes</strong><br />
(TAN)<br />
TAN classifiers extend <strong>Naive</strong>-<strong>Bayes</strong> by allowing the attributes<br />
to form a tree, (see Figure 2) here c is the class<br />
node, and the features x 1 , x 2 , x 3 , x 4 , without their respective<br />
arcs from c, form a tree. [6]<br />
<strong>Intrusion</strong> detection is comprised of two main techniques<br />
which are misuse-based intrusion detection and<br />
anomaly based intrusion detection.<br />
Misuse-based intrusion detection IDSs that employ<br />
misuse detection approach detect attacks by comparing<br />
the existing signatures against the network traffics<br />
captured by the IDSs. When a match is found,<br />
the IDSs will take action as the traffics are considered<br />
harmful to computer systems or computer networks.<br />
Actions taken by the IDSs will normally include sending<br />
alerts to network administrator and logging the intrusive<br />
events.<br />
IDSs that implement misuse detection approach<br />
are, however, incapable of detecting novel attacks. The<br />
network administrator will need to update the stored<br />
signatures frequently to make sure that the IDSs perform<br />
well in detecting intrusions. [5]<br />
Anomaly based intrusion detection IDSs that employ<br />
anomaly detection are capable of identifying novel<br />
attacks, that contain activities deviated from the norm.<br />
Such IDSs utilize the built profiles that are learned<br />
based on normal activities in computer networks. This<br />
system has two stages:<br />
Figure 3: TAN Structure [6]<br />
3 <strong>Intrusion</strong> <strong>Detection</strong> Systems<br />
<strong>Intrusion</strong> detection systems are used to identify, classify<br />
and possibly, to respond to benign activities. Also,<br />
<strong>Intrusion</strong> <strong>Detection</strong> System (IDS) is used to monitor<br />
all or partial traffic, detect malicious activities, and<br />
respond to the activities. <strong>Network</strong> intrusion detection<br />
system was established for the purpose of malicious activities<br />
detection to strengthen the security, confidentiality,<br />
and integrity of critical information systems.<br />
These systems can be network-based or host-based.<br />
HIDS is used to analyze the internal event such as process<br />
identifier while NIDS is to analyze the external<br />
event such as traffic volume, IP address, service port<br />
and others. The challenge of the study is: how we can<br />
have an IDS with high detection and low false positive<br />
rate [4]<br />
• Learning: It works on profiles. The profiles represent<br />
the normal behavioural activities of the<br />
users, systems, or network connections, applications.<br />
Great care should be taken while defining<br />
profiles because currently there is no effective way<br />
to define normal profiles that can achieve high detection<br />
rate and low false positives at the same<br />
time.<br />
• <strong>Detection</strong>: The profile is used to detect any deviance<br />
in user behavior. [7]<br />
3.1 Problems of <strong>Intrusion</strong> <strong>Detection</strong><br />
Systems<br />
IDS have three common problems: temporal complexity,<br />
correctness and adaptability.<br />
The temporal complexity problem results from the extensive<br />
quantity of data that the system must supervise<br />
in order to perceive the whole situation. False positive<br />
and false negative rates are usually used to evaluate<br />
the correctness of IDS. False positive can be defined as<br />
alarms which are triggered from legitimate activities.<br />
False negative includes attacks which are not detected<br />
by the system. An IDS is more precise if it detects<br />
more attacks and gives few false alarms.<br />
In case of misuse detection systems, security experts<br />
must examine new attacks to add their corresponding<br />
signatures. In anomaly detection systems,
CICIS’12, IASBS, Zanjan, Iran, May 29-31, 2012<br />
human experts are necessary to define relevant attribute<br />
for defining the normal behavior. This leads<br />
us to the adaptability problem. [10]<br />
3.2 Different Types of Attacks<br />
Attacks are grouped into four classes:<br />
• Denial of Service (DOS): Making some machine<br />
resources unavailable or too busy to answer<br />
to legitimate users requests.<br />
• User to Root (U2R): Exploiting vulnerability<br />
on a system to obtain a root access.<br />
• Remote To Local (R2L): <strong>Using</strong> vulnerability<br />
in order to obtain a local access like a machine<br />
user.<br />
• Probing: Collecting useful information or<br />
known vulnerabilities about a network or a system.<br />
[8]<br />
4 <strong>Network</strong> <strong>Intrusion</strong> <strong>Detection</strong><br />
<strong>Using</strong> <strong>Bayes</strong>ian <strong>Network</strong>s<br />
In the following we will first discuss the <strong>Naive</strong>-<strong>Bayes</strong><br />
and then explore our contribution which is <strong>Tree</strong> <strong>Augmented</strong><br />
<strong>Naive</strong>-<strong>Bayes</strong> in intrusion detection.<br />
4.1 <strong>Naive</strong>-<strong>Bayes</strong><br />
The purpose is to find the probability that a computer<br />
or local network attack is going on.The result of the<br />
propagation of changed probabilities of certain events<br />
observed by <strong>Bayes</strong>ian network can be an automatic activation<br />
of some mechanism for attack prevention such<br />
as: breaking TCP connections, traffic redirection or<br />
disabling user activity. If the probability of an attack<br />
is significantly increased but not enough to be considered<br />
as an attack, the network will generate a report<br />
about the event and warn the system administrator.<br />
Once the network is quantified, it is able to classify<br />
any new object giving its attributes value using the<br />
<strong>Bayes</strong> rule expressed by:<br />
P (C i |A) = P (A|C i)P (C i )<br />
P (A)<br />
(1)<br />
Where c i is a possible value in the session class and<br />
A is the total evidence on attributes nodes. The evidence<br />
A can be dispatched in the pieces of evidence,<br />
say a 1 , a 2 , ..., a n relative to the attributes A 1 , A 2 , ..., A n<br />
, respectively. Since naive <strong>Bayes</strong>ian networks work under<br />
the assumption that these attributes are independent<br />
(giving the parent node C), their combined probability<br />
is obtained as follows:<br />
P (C i |A) = P (a 1|C i )P (a 2 |C i )...P (a n |C i )P (C i )<br />
P (A)<br />
(2)<br />
Note that there is no need to explicitly compute<br />
the denominator P(A) since it is determined by<br />
the normalization condition. Therefore, it is sufficient<br />
to compute for each class c i its likelihood,<br />
i.e. P (a 1 |C i )P (a 2 |C i )...P (a n |C i )P (C i ) to classify any<br />
new object characterized by its attributes values<br />
a 1 , a 2 , ..., a n . [9]<br />
4.2 <strong>Tree</strong> <strong>Augmented</strong> <strong>Naive</strong>-<strong>Bayes</strong><br />
<strong>Bayes</strong>ian network structure learning without any structural<br />
restrictions is known to be a difficult problem.<br />
Several possibilities of adding arcs between classifier<br />
features have been proposed. TAN models are wellknown<br />
extensions of naive <strong>Bayes</strong>. The main rule of<br />
TAN classification is given by:<br />
P (C|A) = αP (C)P (A 1 |P A 1 , C)...P (A n |P A n , C) (3)<br />
A is the global information provided by features values.<br />
P A i is the parent feature of A i (on which A i<br />
depends). The optimal tree can be obtained simply by<br />
calculating mutual information measures between each<br />
two variables on the basis of training instances. [10]<br />
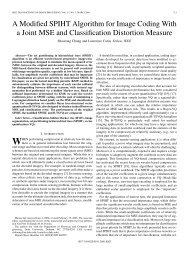
Figure 4: IDS with <strong>Bayes</strong>ian <strong>Network</strong>
The Third International Conference on Contemporary Issues in Computer and Information Sciences<br />
4.3 Algorithm<br />
We present here an algorithm to achieve an optimal<br />
choice and placement of detectors.<br />
Input<br />
(i) <strong>Bayes</strong>ian network BN = (V,CPT(V ),H(V )) where<br />
V is the set of attack vertices, CPT(V ) is the set of<br />
conditional probability tables associated with the attack<br />
vertices, and H(V ) is the set of hosts affected if<br />
the attack vertex is achieved.<br />
(ii) Set of detectors D = (d i , V (d i ), CP T [i][j]) where<br />
d i is the i th detector, V (d i ) is the set of attack vertices<br />
that the detector d i can be attached to (i.e., the<br />
detector can possibly detect those attack goals being<br />
achieved), and CPT[i][j] ∀j ∈ V (di) is the CPT tables<br />
associated with detector i and attack vertex j.<br />
Output:<br />
Set of tuples θ = (di, Π i ) where di is the i th detector<br />
selected and Π i is the set of attack vertices that it is<br />
attached to.<br />
DETECTOR-PLACEMENT (BN, D)<br />
System-Cost= 0<br />
Sort all (d i , a j ), a j ∈ V (d i ), i by<br />
BENEFIT(d i , a j )<br />
Sorted list= L<br />
Length(L)= N<br />
for i=1 to n do<br />
System-Cost= System-Cost + Cost(d i , a j )<br />
/* Cost(d i , a j ) can be in terms of economic<br />
cost, cost due to false alarms and missed<br />
alarms, etc. */<br />
if System − Cost > T hresholdτ then<br />
break<br />
end<br />
if d i ∈ θ then<br />
add a j toΠ i ∈ θ<br />
else<br />
add(d i , Π i = a j )toθ<br />
end<br />
end<br />
return θ<br />
The worst-case complexity of this algorithm is O(dv<br />
B(v,CPT(v)) + dv log(dv) + dv), where d is the number<br />
of detectors and v is the number of attack vertices.<br />
B(v,CPT(v)) is the cost of <strong>Bayes</strong>ian inference on a BN<br />
with v nodes and CPT(v) defining the edges. The first<br />
term is due to calling <strong>Bayes</strong>ian inference with up to d<br />
times v terms. The second term is the sorting cost and<br />
the third term is the cost of going through the for loop<br />
dv times. [13]<br />
BENEFIT (d, a)<br />
/* This is to calculate the benefit from attaching<br />
detector d to attack vertex a */<br />
Let the end attack vertices in the BN be<br />
F = f i , i = 1, 2, ..., M<br />
for each fi, the following cost-benefit table exists<br />
do<br />
Perform <strong>Bayes</strong>ian Inference with d as the<br />
only detector in the network and connected<br />
to attack vertex a<br />
Calculate for each f i , the precision and<br />
recall, call them, Precision(f i , d, a) ,<br />
Recall(f i , d, a) System Benefit =<br />
m∑<br />
Benefit f i (T rue Negative) ×<br />
i=1<br />
Precision(f i , d, a) + Benefitf i (T rue P ositive)<br />
× Recall(f i , d, a)<br />
end<br />
return System-Benefit<br />
5 Experimental Result<br />
The data used in this paper are those proposed in the<br />
NSL-KDD for intrusion detection which are generally<br />
used for benchmarking intrusion detection problems.<br />
They set up an environment to collect TCP/IP dump<br />
raws from a host located on a simulated military network.<br />
Each TCP/IP connection is described by 41 features<br />
and labeled as either normal or as an attack.<br />
We evaluate the performance of <strong>Naive</strong>-<strong>Bayes</strong> and<br />
then we convert that to tree augmented <strong>Naive</strong>-bayes.<br />
So the new system has better performance.<br />
parent<br />
dst bytes<br />
srv count<br />
hot<br />
src bytes<br />
count<br />
childs<br />
num compromised<br />
count, srv diff host rate<br />
is guest login<br />
wrong fragment, flag<br />
same srv rate<br />
Table 1: Connections in TAN<br />
At the end compare them with DT and SVM. We<br />
use full training set and 10- fold cross validation for the<br />
testing purposes. In 10-fold cross-validation, the available<br />
data is randomly divided in to 10 disjoint subsets<br />
of approximately equal sizes. One of the subsets is then<br />
used as the test set and the remaining 9 sets are used<br />
for building the classifier. The test set is then used<br />
to estimate the accuracy. This is done repeatedly 10<br />
times so that each subset is used as a test subset once.<br />
The accuracy estimates is then the mean of the esti-
CICIS’12, IASBS, Zanjan, Iran, May 29-31, 2012<br />
mates for each of the classifiers. Cross-validation has<br />
been tested extensively and has been found to generally<br />
work well when sufficient data is available.<br />
5.1 Kappa Statistic Rate<br />
The kappa statistic measures the agreement of prediction<br />
with the true class 1.0 signifies complete agreement.<br />
This rate in <strong>Naive</strong>-<strong>Bayes</strong> is 0.759 and in DT is<br />
0.989 and in SVM is 0.961 but TAN has better result,<br />
0.988.<br />
5.2 Confusion Matrix<br />
A Confusion Matrix is sometimes used to represent the<br />
result of testing, as shown in Table 1.It is a two- dimensional<br />
table with a row and column for each class,<br />
each element of the matrix show the number of test<br />
examples for which the actual class is the row and the<br />
predicted class is the column. The Advantage of using<br />
this matrix is that it not only tells us how many got<br />
misclassified but also what misclassifications occurred.<br />
Normal DOS R2L Probe U2R<br />
Normal 3474 106 162 455 589<br />
NB 4759 7 8 12 0<br />
TAN 4760 5 8 13 0<br />
DT 4732 17 14 24 0<br />
SVM<br />
R2l 0 0 63 9 4<br />
NB 5 0 69 1 1<br />
TAN 10 0 63 2 1<br />
DT 31 1 41 1 0<br />
SVM<br />
DOS 115 3176 1 26 15<br />
NB 9 3321 0 3 0<br />
TAN 7 3319 1 6 0<br />
DT 65 3264 0 1 0<br />
SVM<br />
Probe 40 15 10 718 17<br />
NB 22 10 0 768 0<br />
TAN 20 9 1 770 0<br />
DT 32 8 0 764 0<br />
SVM<br />
U2R 0 0 2 0 2<br />
NB 2 0 2 0 0<br />
TAN 4 0 0 0 0<br />
DT 3 0 1 0 0<br />
SVM<br />
Table 3: Experimental Result in Confusion Matrix<br />
False Normal DOS R2L Probe U2R<br />
Positive<br />
NB 0.037 0.021 0.02 0.06 0.069<br />
TAN 0.009 0.003 0.001 0.002 0<br />
DT 0.01 0.002 0.001 0.003 0<br />
SVM 0.031 0.005 0.002 0.003 0<br />
Table 2: False Positive Rate<br />
5.3 Time Taken to Build Model<br />
<strong>Naive</strong>-<strong>Bayes</strong> is build in 3.77 seconds, TAN in 20.09 seconds,<br />
DT in 36.86 seconds and SVM in 43.63 seconds.<br />
So <strong>Naive</strong>-<strong>Bayes</strong> is faster.<br />
Figure 5: ROC Curve-Performance Analysis of IDS<br />
5.5 <strong>Detection</strong> Rate and False Positive<br />
Rate<br />
5.4 Percent of Correct Classification<br />
PCC of <strong>Naive</strong>-<strong>Bayes</strong> is %85 and PCC of TAN is %99.3<br />
and PCC of DT is %99.4 and PCC of SVM is %97.8.<br />
The detection rate is the number of attacks detected<br />
by the system divided by the number of attacks in the<br />
data set. It is equivalent to Recall.<br />
The false positive rate is the number of normal con-
The Third International Conference on Contemporary Issues in Computer and Information Sciences<br />
nections that are misclassified as attacks divided by the<br />
number of normal connections in the data set.<br />
The average of false positive rate in <strong>Naive</strong>-<strong>Bayes</strong> is<br />
0.033 and in TAN and DT is 0.006, in SVM is 0.019.<br />
5.6 Accuracy Rate<br />
Precision Recall F Measure<br />
Normal 0.957 0.726 0.826<br />
NB 0.992 0.994 0.993<br />
TAN 0.991 0.995 0.993<br />
DT 0.973 0.989 0.981<br />
SVM<br />
DOS 0.963 0.953 0.958<br />
NB 0.995 0.996 0.996<br />
TAN 0.996 0.996 0.996<br />
DT 0.992 0.98 0.986<br />
SVM<br />
R2l 0.265 0.829 0.401<br />
NB 0.873 0.908 0.89<br />
TAN 0.863 0.829 0.846<br />
DT 0.732 0.554 0.631<br />
SVM<br />
Probe 0.594 0.898 0.715<br />
NB 0.98 0.96 0.97<br />
TAN 0.973 0.963 0.968<br />
DT 0.967 0.95 0.959<br />
SVM<br />
U2R 0.003 0.5 0.006<br />
NB 0 0 0<br />
TAN 0 0 0<br />
DT 0 0 0<br />
SVM<br />
AVG 0.921 0.826 0.861<br />
NB 0.991 0.991 0.991<br />
TAN 0.99 0.99 0.99<br />
DT 0.977 0.978 0.977<br />
SVM<br />
Table 4: Accuracy rate in different algorithms<br />
5.7 ROC Curve<br />
We plot a ROC (Receive Operating Characteristic)<br />
curve which is often used to measure performance of<br />
IDS. This curve is a plot of the detection rate against<br />
the false positive rate, which is shown in Figure 5.<br />
6 Conclusions<br />
In this paper, we have proposed a framework of intrusion<br />
detection systems based on <strong>Naive</strong>-<strong>Bayes</strong> and<br />
TAN algorithms and compared them with decision tree<br />
and support vector machine. According to the result,<br />
<strong>Naive</strong>-<strong>Bayes</strong> is found less time consuming. TAN has<br />
better accuracy rate and detection rate, and also has<br />
less false positive rate.<br />
Refrences<br />
[1] K Korb and E Nicholson, <strong>Bayes</strong>ian Artificial Intelligence<br />
(2004).<br />
[2] Ch Kruegel, D Mutz, W Robrtson, and F Valeur, <strong>Bayes</strong>ian<br />
Event Classification For <strong>Intrusion</strong> <strong>Detection</strong>, 19th Annual<br />
Computer Security Application Conference IEEE Computer<br />
Society, Washington DC 187 (2008), 14–23.<br />
[3] L Ben-Gal, <strong>Bayes</strong>ian <strong>Network</strong>, Encyclopedia Of Statistics<br />
In Quality And Reliability, 2007.<br />
[4] Y Wee, W Cheah, SH Tan, and K Wee, Causal Discovery<br />
And Reasoning For <strong>Intrusion</strong> <strong>Detection</strong> <strong>Using</strong> <strong>Bayes</strong>ian<br />
<strong>Network</strong> 1 (2011), no. 2.<br />
[5] K Chin Khor, CH Ting, and S Amnuaisuk, From Feature<br />
Selection To Building Of <strong>Bayes</strong>ian Classifiers: A <strong>Network</strong><br />
<strong>Intrusion</strong> <strong>Detection</strong> Perspective.<br />
[6] J Cheng and R Greiner, From Feature Selection To Building<br />
Of <strong>Bayes</strong>ian Classifiers: A <strong>Network</strong> <strong>Intrusion</strong> <strong>Detection</strong><br />
Perspective, Proc.14 th Canadian Conference On AI, 2001.<br />
[7] M Pater, H Kim, and A Pamnam, State Of The Art In<br />
<strong>Intrusion</strong> <strong>Detection</strong> System.<br />
[8] M Panda and M.R Patra, <strong>Network</strong> <strong>Intrusion</strong> <strong>Detection</strong> <strong>Using</strong><br />
Nave <strong>Bayes</strong>, International Journal Of Computer Science<br />
And <strong>Network</strong> Security 7 (2007), no. 12, 258–263.<br />
[9] N Amor, S Benferhat, and Z Elovedi, Nave <strong>Bayes</strong>ian <strong>Network</strong>s<br />
In <strong>Intrusion</strong> <strong>Detection</strong> System, 14 th European Conference<br />
On Machine Learning 17 th European Conference<br />
On Principles And Practice Of Knowledge Discovery In<br />
Databases.<br />
[10] S Benferhat, H Drias, and A Boudjelida, An <strong>Intrusion</strong> <strong>Detection</strong><br />
Approach Based On <strong>Tree</strong> <strong>Augmented</strong> Nave-<strong>Bayes</strong><br />
And Expert Knowledge.<br />
[11] N Friedman, M Goldzmidt, and A Boudjelida, Building<br />
classifiers <strong>Using</strong> <strong>Bayes</strong>ian <strong>Network</strong>, In Proceeding of the<br />
National Conference on AI, Menlo Park, CA: AAAI Press<br />
(1996), 1277–1284.<br />
[12] Cerquides Bueno J, Improving <strong>Bayes</strong>ian <strong>Network</strong> Classifiers,<br />
Ph.D. Thesis, university Of Politecnica De Catalunya.<br />
(1996), 1277–1284.<br />
[13] G Modelo-Howard, S Bagchi, and G Lebanon, Determining<br />
Placement Of <strong>Intrusion</strong> Detectors For A Distributed Application<br />
Through <strong>Bayes</strong>ian <strong>Network</strong> Modelling, Springer-<br />
Verlage Berlin Heidelberg (2008), 271–290.