Folie 1 - Commerzbank AG
Folie 1 - Commerzbank AG
Folie 1 - Commerzbank AG

You also want an ePaper? Increase the reach of your titles
YUMPU automatically turns print PDFs into web optimized ePapers that Google loves.
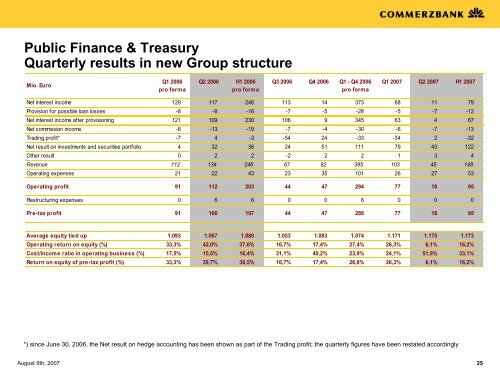
Public Finance & Treasury<br />
Quarterly results in new Group structure<br />
Mio. Euro<br />
August 9th, 2007<br />
Q1 2006<br />
pro forma<br />
Q2 2006 H1 2006<br />
pro forma<br />
Q3 2006 Q4 2006 Q1 - Q4 2006<br />
pro forma<br />
Q1 2007 Q2 2007 H1 2007<br />
Net interest income 129 117 246 113 14 373 68 11 79<br />
Provision for possible loan losses -8 -8 -16 -7 -5 -28 -5 -7 -12<br />
Net interest income after provisioning 121 109 230 106 9 345 63 4 67<br />
Net commission income -6 -13 -19 -7 -4 -30 -6 -7 -13<br />
Trading profit* -7 4 -3 -54 24 -33 -34 2 -32<br />
Net result on investments and securities portfolio 4 32 36 24 51 111 79 43 122<br />
Other result 0 2 2 -2 2 2 1 3 4<br />
Revenue 112 134 246 67 82 395 103 45 148<br />
Operating expenses 21 22 43 23 35 101 26 27 53<br />
Operating profit 91 112 203 44 47 294 77 18 95<br />
Restructuring expenses 0 6 6 0 0 6 0 0 0<br />
Pre-tax profit 91 106 197 44 47 288 77 18 95<br />
Average equity tied up 1.093 1.067 1.080 1.053 1.083 1.074 1.171 1.175 1.173<br />
Operating return on equity (%) 33,3% 42,0% 37,6% 16,7% 17,4% 27,4% 26,3% 6,1% 16,2%<br />
Cost/income ratio in operating business (%) 17,5% 15,5% 16,4% 31,1% 40,2% 23,9% 24,1% 51,9% 33,1%<br />
Return on equity of pre-tax profit (%) 33,3% 39,7% 36,5% 16,7% 17,4% 26,8% 26,3% 6,1% 16,2%<br />
*) since June 30, 2006, the Net result on hedge accounting has been shown as part of the Trading profit; the quarterly figures have been restated accordingly<br />
25