Error Estimation of SPECT OSEM with 3D Resolution Recovery ...
Error Estimation of SPECT OSEM with 3D Resolution Recovery ...
Error Estimation of SPECT OSEM with 3D Resolution Recovery ...

Create successful ePaper yourself
Turn your PDF publications into a flip-book with our unique Google optimized e-Paper software.
A. Simulations <strong>of</strong> imaging system<br />
Quasi-analytical simulations (voxel size: 0.6 mm) are<br />
performed by modeling the projection operator in <strong>3D</strong><br />
according to the detector and collimator specifications <strong>of</strong> the<br />
Siemens Symbia T-series gamma cameras <strong>with</strong> the parameters<br />
listed in Table I, and assuming a perfect collimator. Poisson<br />
noise is added to the generated projection data. Photon<br />
attenuation in the object is accounted for and a derived μ-map<br />
is used for attenuation correction. We assume an acquisition<br />
<strong>with</strong> perfect scatter rejection <strong>of</strong> 140keV (Tc-99m) photons.<br />
for a given object j at a given imaging parameter set i. The<br />
boundaries <strong>of</strong> the target object to be measured are derived<br />
from the true high resolution image (Fig. 1 top row). Partial<br />
volume effects, specifically spill-in and spill-out at the object<br />
boundaries due to finite pixel size, are compensated for by<br />
measuring the loss <strong>of</strong> emission in the simulation using<br />
different pixel sizes.<br />
B. Cross Calibration <strong>of</strong> the Imaging System<br />
TABLE I<br />
COLLIMATOR SPECIFICATIONS OF FOUR SIEMENS LOW ENERGY COLLIMATORS<br />
Acceptance<br />
Angle (rad)<br />
Sensitivity<br />
(cpm/μCi)<br />
Hole Length<br />
(mm)<br />
Geometric<br />
<strong>Resolution</strong> @<br />
10cm (mm)<br />
LEHS 0.115194 1020 24.05 13.4<br />
LEAP 0.064973 330 24.05 7.6<br />
LEHR 0.049514 202 24.05 5.9<br />
LEUHR 0.034632 100 35.8 4.4<br />
LEHS: Low Energy High Sensitivity, LEAP: Low Energy All Purpose, LEHR:<br />
Low Energy High <strong>Resolution</strong>, LEUHR: Low Energy Ultra High <strong>Resolution</strong><br />
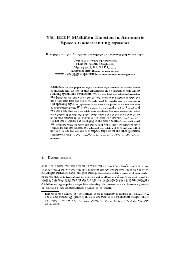
Hot spheres <strong>with</strong> diameters between 9.8 mm and 168 mm in a<br />
warm cylindrical background (Sphere to background ratio<br />
10:1) are simulated. Pixel size and total counts are varied<br />
between 2.4 mm and 9.6 mm and 0.125 and 32 million counts.<br />
Image reconstruction is performed using MLEM/<strong>OSEM</strong> <strong>with</strong><br />
isotropic resolution recovery (Flash<strong>3D</strong>) and attenuation<br />
correction. Fig. 1 shows example images <strong>of</strong> simulated and<br />
reconstructed spheres.<br />
Fig. 1: True (top row) and example reconstructed images (bottom row, LEHR<br />
collimation, 2.4 mm voxel, 32 <strong>OSEM</strong> updates) <strong>of</strong> the simulated spheres <strong>of</strong><br />
different diameters in a 10% background.<br />
Images are analyzed in terms <strong>of</strong> emission recovery. The<br />
emission recovery coefficient is defined as:<br />
( j i)<br />
( j)<br />
Measured Emission ,<br />
C E<br />
( j, i)<br />
= , (1)<br />
True Emission<br />
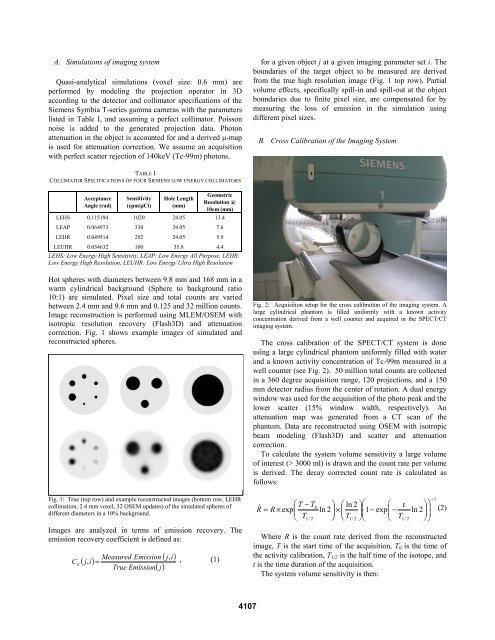
Fig. 2: Acquisition setup for the cross calibration <strong>of</strong> the imaging system. A<br />
large cylindrical phantom is filled uniformly <strong>with</strong> a known activity<br />
concentration derived from a well counter and acquired in the <strong>SPECT</strong>/CT<br />
imaging system.<br />
The cross calibration <strong>of</strong> the <strong>SPECT</strong>/CT system is done<br />
using a large cylindrical phantom uniformly filled <strong>with</strong> water<br />
and a known activity concentration <strong>of</strong> Tc-99m measured in a<br />
well counter (see Fig. 2). 50 million total counts are collected<br />
in a 360 degree acquisition range, 120 projections, and a 150<br />
mm detector radius from the center <strong>of</strong> rotation. A dual energy<br />
window was used for the acquisition <strong>of</strong> the photo peak and the<br />
lower scatter (15% window width, respectively). An<br />
attenuation map was generated from a CT scan <strong>of</strong> the<br />
phantom. Data are reconstructed using <strong>OSEM</strong> <strong>with</strong> isotropic<br />
beam modeling (Flash<strong>3D</strong>) and scatter and attenuation<br />
correction.<br />
To calculate the system volume sensitivity a large volume<br />
<strong>of</strong> interest (> 3000 ml) is drawn and the count rate per volume<br />
is derived. The decay corrected count rate is calculated as<br />
follows:<br />
ˆ<br />
⎛ T − T ⎞ ⎛<br />
0 ln 2 ⎞⎛<br />
⎛ ⎞⎞<br />
exp ln 2 ⎜1<br />
exp ln 2 ⎟<br />
×<br />
t<br />
R = R ×<br />
⎜ ⎟<br />
⎜<br />
⎟<br />
−<br />
⎜ −<br />
⎟ (2)<br />
⎝ T1/<br />
2 ⎠ ⎝ T1/<br />
2 ⎠⎝<br />
⎝ T1/<br />
2 ⎠⎠<br />
Where R is the count rate derived from the reconstructed<br />
image, T is the start time <strong>of</strong> the acquisition, T 0 is the time <strong>of</strong><br />
the activity calibration, T 1/2 is the half time <strong>of</strong> the isotope, and<br />
t is the time duration <strong>of</strong> the acquisition.<br />
The system volume sensitivity is then:<br />
−1<br />
4107