

Download PDF - Kumba Iron Ore
Download PDF - Kumba Iron Ore
Download PDF - Kumba Iron Ore

You also want an ePaper? Increase the reach of your titles
YUMPU automatically turns print PDFs into web optimized ePapers that Google loves.
KUMBA IRON ORE<br />
ANNUAL FINANCIAL STATEMENTS 2011<br />
Towards sustainable<br />
partnerships
Towards sustainable<br />
partnerships<br />
CONTENTS<br />
ii<br />
ii<br />
Approach and overview<br />
<strong>Kumba</strong> at a glance<br />
1 Integrated reporting<br />
2 Financial review<br />
10 Audited annual financial statements<br />
10 Directors’ responsibility for financial reporting<br />
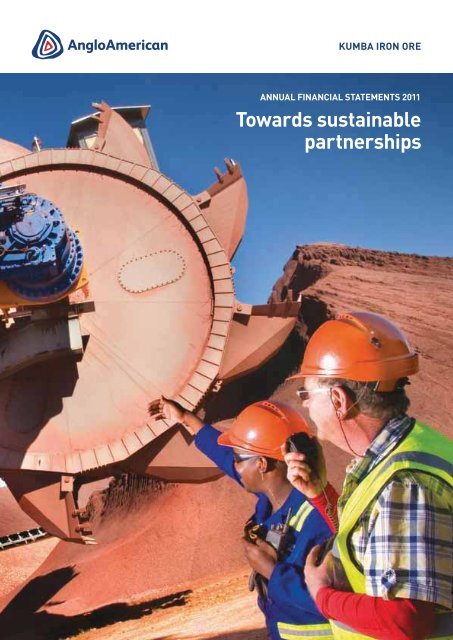
FRONT COVER: A GOOD EXAMPLE OF<br />
SUSTAINABLE PARTNERSHIPS<br />
Sarel Le Roux, a master electrician, and Clayton Mora, an<br />
electrical engineer, are shown on the cover photograph,<br />
conducting their final inspections together on the newly<br />
commissioned reclaimer at Kolomela mine.<br />
Kolomela mine was brought into commercial production<br />
in December 2011, within budget and ahead of schedule.<br />
Working partnerships like this one between Sarel and<br />
Clayton have been a critical feature of the success story so<br />
far at Kolomela mine, and indeed throughout the <strong>Kumba</strong><br />
group. In this environment of partnership, the company has<br />
been able to achieve strong financial success for the year<br />
and a solid platform for growth in the year ahead.<br />
It is with this in mind that we introduce our suite of<br />
reports for 2011 with the theme: ’Towards sustainable<br />
partnerships.’<br />
11 Certificate of the company secretary<br />
12 Independent auditor’s report<br />
13 Directors’ report<br />
17 Report of the Audit Committee<br />
19 Remuneration report<br />
27 Principal accounting policies<br />
38 Group balance sheet<br />
39 Group income statement<br />
39 Group statement of comprehensive income<br />
40 Group statement of changes in equity<br />
41 Group cash flow statement<br />
42 Group – Notes to the financial statements<br />
69 Company balance sheet<br />
70 Company income statement<br />
70 Company statement of changes in equity<br />
71 Company cash flow statement<br />
Integrated Report 2011<br />
Annual Financial<br />
Statements 2011<br />
Sustainable<br />
Development<br />
Report 2011<br />
72 Company – Notes to the financial statements<br />
76 Annexures<br />
76 Annexure 1: Investments in subsidiaries<br />
77 Annexure 2: Investments in associates, joint ventures<br />
and other investments<br />
78 Annexure 3: Share-based payments<br />
Abridged Integrated<br />
Report 2011<br />
<strong>Kumba</strong> Online Report 2011<br />
http://www.angloamericankumba.com/<br />
reports/kumba_ar2011/index.php<br />
82 Annexure 4: Balance sheet: US dollar<br />
convenience translation<br />
Look out for important references<br />
KPI Key performance indicator<br />
IR See the corresponding page/s in our Integrated Report<br />
SD See the corresponding page/s in our Sustainable Development Report<br />
www See the website http://www.angloamericankumba.com<br />
83 Annexure 5: Income statement: US dollar<br />
convenience translation<br />
84 Corporate information<br />
84 Shareholder analysis<br />
85 Breakdown of non-public holdings<br />
86 Administration<br />
Annual Financial Statements 2011<br />
i
KUMBA AT A GLANCE<br />
BROAD AND MEANINGFUL<br />
OWNERSHIP AT ALL LEVELS<br />
OUR OPERATIONS<br />
4a<br />
4d<br />
4c<br />
4e<br />
4b<br />
3b<br />
Thabazimbi mine<br />
Sishen mine<br />
Kolomela mine<br />
2c<br />
Limpopo<br />
3a<br />
1<br />
2<br />
North West<br />
1<br />
Gauteng<br />
Mpumalanga<br />
1<br />
2<br />
Corporate office<br />
Centurion (South Africa)<br />
Mines<br />
a. Sishen mine<br />
b. Kolomela mine<br />
c. Thabazimbi mine<br />
3<br />
4<br />
Port operations<br />
a. Saldanha Bay (South Africa)<br />
b. Qingdao (China)<br />
Exports<br />
a. Western Europe<br />
b. China<br />
c. Japan<br />
d. South Korea<br />
e. The Middle East<br />
3a<br />
2a<br />
2b<br />
Northern Cape<br />
Western Cape<br />
SOUTH AFRICA<br />
Free State KwaZulu-<br />
Natal<br />
Eastern Cape<br />
KUMBA IRON ORE LIMITED GROUP STRUCTURE<br />
Industrial<br />
Development Corp<br />
12.9%<br />
Anglo American plc<br />
65.2%<br />
Minority interests<br />
21.9%<br />
KUMBA IRON ORE<br />
LIMITED<br />
73.9%<br />
Public Investment Corp<br />
4.3%<br />
BEE OWNERSHIP<br />
26.1%<br />
Exxaro Resources<br />
Limited: 19.98%<br />
SIOC Community<br />
Development Trust: 3%<br />
SIOC Employee Share<br />
Participation Scheme<br />
(Envision): 3.1%<br />
SISHEN IRON ORE<br />
COMPANY<br />
OPERATIONS<br />
Sishen mine<br />
Thabazimbi mine<br />
Kolomela mine<br />
Saldanha Bay port<br />
operations<br />
ii<br />
<strong>Kumba</strong> <strong>Iron</strong> <strong>Ore</strong> Limited
EXPORT DESTINATIONS AND EXPORT VOLUMES<br />
13%<br />
68%<br />
18%<br />
1%<br />
<strong>Kumba</strong> <strong>Iron</strong> <strong>Ore</strong> Limited (<strong>Kumba</strong> or the group), a member of the<br />
Anglo American plc Group, is a leading value-adding supplier of<br />
high-quality iron ore to the global steel industry. With its headquarters<br />
in Centurion, South Africa, the group holds a 73.9% interest in and<br />
manages Sishen <strong>Iron</strong> <strong>Ore</strong> Company (Pty) Limited (SIOC) which, in<br />
turn, has three mining operations:<br />
<br />
Cape Province;<br />
<br />
Province; and<br />
<br />
in Northern Cape Province, which was brought into commercial<br />
production in December 2011 and is anticipated to produce<br />
between 4 million tonnes (Mt) and 5Mt while ramping up in<br />
2012, before reaching design capacity of 9 million tonnes per<br />
annum (Mtpa) in 2013.<br />
Both the Sishen and Kolomela mines are long-life operations with<br />
current life of mine (LOM) estimates, of 21 years and 27 years<br />
<br />
for 2016), after some 80 years of continuous operation. The<br />
<br />
at a feasibility stage. Subject to board approval, this project will<br />
<br />
group reported total attributable <strong>Ore</strong> Reserves of 1,197.7Mt and<br />
attributable Mineral Resources of 1,340.4Mt (These are reported in<br />
accordance with the South African Code for Reporting of Exploration<br />
Results, Mineral Resources and Mineral Reserves (SAMREC)).<br />
<strong>Kumba</strong> produced 41.3Mt of iron ore for domestic and export<br />
markets in 2011. The export ore is railed via a dedicated iron ore rail<br />
link operated by Transnet Freight Rail, the national transport utility for<br />
rail operations, to the port of Saldanha Bay.<br />
In 2011 the company exported 37.1Mt of iron ore from the port of<br />
Saldanha Bay to customers in countries and regions around the<br />
world, including China (68%), Western Europe (13%), Japan and<br />
South Korea (18%) and the Middle East (1%).<br />
The group continues to invest significantly in the development<br />
and expansion of its business. In 2011 <strong>Kumba</strong> spent R5.8 billion<br />
on capital – 53% on growth projects and 47% on stay in<br />
business capital.<br />
<strong>Kumba</strong>’s South African project pipeline is extensive, with the<br />
potential to grow production to 70Mtpa by 2019; Kolomela mine is<br />
expected to produce an additional 9Mtpa by 2013 while a further<br />
15Mtpa could come from other Northern Cape Province operations<br />
and 5Mtpa from Limpopo Province. As much of this growth potential<br />
resides in lower-grade ore, the group is intensely focused on turning<br />
this material to account. In the year under review, <strong>Kumba</strong> announced<br />
its intention of seeking growth in other parts of Africa, in a second<br />
footprint, most notably west and central Africa, with the aim of<br />
growing production by a further 10 to 20Mtpa by 2020.<br />
At the end of December 2011, <strong>Kumba</strong> employed 11,898 people,<br />
comprising 6,303 full-time employees and 5,595 full-time<br />
contractors. A further 4,131 fixed-term project contractors were<br />
employed on capital expenditure projects during the year.<br />
<strong>Kumba</strong>, which is listed on the JSE Limited (JSE) in South Africa, had<br />
a market capitalisation of R161 billion at 31 December 2011, the<br />
eighth largest company listed on the JSE by market capitalisation.<br />
The company’s largest shareholder is Anglo American plc, with a<br />
65.2% interest. Also holding a significant stake is South Africa’s<br />
Industrial Development Corporation, a national development finance<br />
institution set up to promote economic development and growth<br />
in the country, which holds 12.9%. The balance (free float) is held<br />
largely by institutional investors in South Africa (45%), the United<br />
Kingdom (19%), North America (26%) and Europe (5%).<br />
Achieved in a landmark transaction in 2006, SIOC is fully<br />
empowered, with a black economic empowerment (BEE) ownership<br />
of 26.1%. Through this empowerment structure, <strong>Kumba</strong> has<br />
achieved a significant and broad-based BEE shareholding as<br />
set out below. The slight increase in the BEE ownership from<br />
2010 is as a result of the unwind of the first phase as well<br />
as the implementation of the second five-year phase of the<br />
Envision scheme.<br />
<br />
on the JSE, has a 19.98% stake.<br />
<br />
3% unencumbered interest.<br />
<br />
IR Page 65<br />
iii<br />
<strong>Kumba</strong> <strong>Iron</strong> <strong>Ore</strong> Limited
INTEGRATED REPORTING<br />
THE INTEGRATED<br />
REPORTING JOURNEY<br />
Approach and overview<br />
APPROACH<br />
<strong>Kumba</strong> recognises that the group has a responsibility to engage with<br />
and report to a broad range of stakeholders, including shareholders,<br />
employees, customers, communities, suppliers and the public at<br />
large. In <strong>Kumba</strong>’s Integrated Report 2011, the group presents a<br />
holistic ‘picture’ of the business, covering its operating context and<br />
markets, the opportunities and challenges it faces, its strategy, its<br />
operational, financial and non-financial performance for the year, and<br />
its objectives and outlook for the year ahead. Issues and concerns<br />
raised by stakeholders actively inform opportunities and challenges<br />
within the business.<br />
In developing the Integrated Report 2011, <strong>Kumba</strong> has applied the<br />
recommendations of the King Code of Governance Principles for<br />
South Africa 2009 (King III), the Integrated Report Discussion<br />
Paper published by the Integrated Reporting Committee of<br />
South Africa, as well as the discussion paper, Towards Integrated<br />
Reporting: Communicating Value in the 21st Century, published by the<br />
International Integrated Reporting Committee.<br />
This report, the Annual Financial Statements 2011, forms part of a<br />
suite of reports produced by the group. It comprises:<br />
<br />
<br />
annual general meeting, which has been posted to all shareholders;<br />
<br />
<br />
the economic, social and environmental impacts of the group’s<br />
business in greater detail;<br />
<br />
report which focuses on the issues that are important to<br />
employees; and<br />
<br />
(with downloadable pdfs) on an interactive web platform at<br />
http://www.angloamericankumba.com/reports/kumba_ar2011/<br />
index.php.<br />
ABOUT THIS REPORT:<br />
SCOPE AND BOUNDARY<br />
This report presents the group’s annual financial statement for<br />
the year ended 31 December 2011. It forms part of a suite of<br />
reports that gives an overall account of the group’s operational,<br />
financial, economic, social and environmental performance, as<br />
well as governance, during the period under review. Historical<br />
information is supplied for context where appropriate. Also<br />
supplied is an outlook where these support an understanding of<br />
the strategy of the business.<br />
The annual financial statements have been prepared in<br />
compliance with International Financial Reporting Standards<br />
and the International Financial Reporting Interpretation<br />
Committee’s interpretations of those standards; the South<br />
African Companies Act No 71 of 2008 as amended (The<br />
Companies Act); the Listings Requirements of the JSE Limited;<br />
and the AC500 standards as issued by the Accounting<br />
Practices Board. The annual financial statements have been<br />
audited by Deloitte & Touche. An unmodified audit opinion<br />
was issued and is included on page 12 of the Annual<br />
Financial Statements.<br />
Printed copies of these reports are available on request.<br />
Stakeholders are encouraged to provide feedback on <strong>Kumba</strong>’s<br />
reports and its reporting. Your feedback and suggestions will<br />
be taken into consideration as the group continues its journey.<br />
A feedback form is available at http://www.angloamericankumba.com/<br />
reports/kumba_ar2011/sustainability/feedback_form.php.<br />
Annual Financial Statements 2011<br />
1
FINANCIAL REVIEW<br />
FOR THE YEAR ENDED 31 DECEMBER 2011<br />
SIGNIFICANT<br />
DISTRIBUTIONS TO<br />
SHAREHOLDERS<br />
<strong>Kumba</strong>’s headline earnings for the year ended 31 December 2011<br />
were a record R17.0 billion, 19% more than the R14.3 billion<br />
achieved in 2010. This financial performance was achieved mainly<br />
as a result of a weighted average increase of 26% in export iron<br />
ore prices realised and a 3% increase in export sales volumes.<br />
Attributable and headline earnings for the year were R53.11 and<br />
R53.13 per share respectively, on which a final cash dividend of<br />
R22.50 per share was declared, bringing the total dividend for 2011<br />
to R44.20 per share.<br />
We continue to deliver increasing value to our listed shareholders<br />
and also to Sishen <strong>Iron</strong> <strong>Ore</strong> Company’s Black Economic<br />
Empowerment shareholders by returning substantial cash dividends.<br />
The group announced the maturity of the first phase of Envision,<br />
its broad based employee share scheme with 6,209 permanent<br />
employee members, on 29 November 2011. Envision was valued at<br />
R2.7 billion at the conclusion of its first phase, resulting in employee<br />
members who have worked for <strong>Kumba</strong> over the five-year period<br />
since its inception in 2006, each receiving R576,045 (pre-tax).<br />
Envision is a broad based empowerment success story and sets a<br />
benchmark for empowerment goals and ideals in South Africa.<br />
Vincent Uren, Chief financial officer<br />
“ The group has again posted<br />
outstanding financial results”<br />
OPERATIONAL PERFORMANCE<br />
The key indicators of our operating results during the past year were:<br />
REVENUE<br />
(R billion)<br />
CAGR:43%<br />
2010<br />
38.7<br />
2011<br />
48.6<br />
2007<br />
11.5<br />
2008<br />
21.4<br />
2009<br />
23.4<br />
REVENUE<br />
up 26% to<br />
R48.6bn<br />
HEADLINE EARNINGS<br />
up 19% to<br />
R17.0bn<br />
FINAL CASH<br />
DIVIDEND<br />
R22.50<br />
per share<br />
ENVISION<br />
Returns<br />
R2.7bn<br />
to employees<br />
2 <strong>Kumba</strong> <strong>Iron</strong> <strong>Ore</strong> Limited
OPERATING PROFIT<br />
(R billion)<br />
CAGR:52%<br />
SISHEN MINE UNIT CASH COST<br />
(R/tonne)<br />
CAGR:19%<br />
2007<br />
6.0<br />
2008<br />
13.5<br />
2009<br />
12.9<br />
2010<br />
25.1<br />
2011<br />
32.0<br />
ATTRIBUTABLE EARNINGS AND DIVIDEND PER SHARE (Rand)<br />
2007<br />
74.3<br />
2008<br />
96.5<br />
2009<br />
98.8<br />
2010<br />
111.2 *<br />
* The 2010 unit cash cost was restated to take into account non-cash share-based payment expenses<br />
2011<br />
150.5<br />
CAGR EPS:51%; CAGR DPS:56%<br />
Financial review<br />
60<br />
50<br />
40<br />
44.7 44.2<br />
34.5<br />
53.1<br />
30<br />
20<br />
10<br />
10.1<br />
7.5<br />
22.8<br />
21.0<br />
21.9<br />
14.6<br />
0<br />
2007 2008 2009 2010 2011<br />
Earnings per share (EPS)<br />
Dividend per share (DPS)<br />
OPERATIONAL PERFORMANCE<br />
Rand million 2011 2010 % change 2009<br />
Revenue 48,553 38,704 25% 23,408<br />
Operating expenses (16,587) (13,573) 22% (10,528)<br />
Operating expenses (excl. mineral royalty) (14,825) (12,163) 22% (10,528)<br />
Mineral royalty (1,762) (1,410) 25% –<br />
Operating profit 31,966 25,131 27% 12,880<br />
Operating margin (%) 66 65 – 55<br />
Headline earnings 17,048 14,328 19% 6,972<br />
Cash from operations 32,631 25,555 28% 12,745<br />
Capital expenditure 5,849 4,723 24% 3,996<br />
REVENUE<br />
The group’s total mining revenue (excluding shipping operations –<br />
R2.7 billion in 2011; R2.9 billion in 2010) of R45.8 billion for the<br />
year was 28% higher than the R35.8 billion of 2010.<br />
REVENUE<br />
2011 (R million)<br />
2,711<br />
45,842<br />
2010 (R million)<br />
2,879<br />
35,825<br />
The increase in mining revenue was driven by a weighted average<br />
increase of 26% in export iron ore prices compared to 2010, which<br />
added R9.6 billion. Spot iron ore prices traded at record highs<br />
during the first half of 2011 as the demand for iron ore exceeded<br />
supply. In 2011, global steel production was up by 6% to 1.5 billion<br />
tonnes, of which 683Mt was produced in China, an increase of 7%.<br />
To support this growth in steel production, China’s seaborne iron<br />
ore imports rose by 8% to 654Mt with the balance of China’s iron<br />
ore needs met by domestic iron ore production. However, the global<br />
economic uncertainty in the second half of the year, coupled with a<br />
<br />
steel stocking by end users and the construction sector, caused steel<br />
prices to fall. In turn, steel mills cut production, slowed purchasing of<br />
raw materials, focused on fine ore (rather than lump ore) and turned<br />
to sourcing lower grade ore to limit absolute costs. This halted<br />
Sale of iron ore<br />
Services rendered – shipping<br />
Annual Financial Statements 2011<br />
3
FINANCIAL REVIEW<br />
FOR THE YEAR ENDED 31 DECEMBER 2011<br />
ANALYSIS OF THE INCREASE IN REVENUE (R million)<br />
50,000<br />
46,000<br />
9,588<br />
764 -335 -168<br />
48,553<br />
42,000<br />
38,000<br />
38,704<br />
34,000<br />
30,000<br />
2010 Price Volume Currency<br />
Shipping 2011<br />
REVENUE – SEGMENT ANALYSIS<br />
2011 (R million)<br />
2010 (R million)<br />
907 32<br />
666<br />
2,711<br />
2,879<br />
REVENUE – GEOGRAPHICAL ANALYSIS<br />
2011(R million)<br />
2010 (R million)<br />
227 310<br />
5,450<br />
3,388<br />
4,896<br />
300<br />
57<br />
2,874<br />
29,904<br />
23,112<br />
35,159<br />
44,903<br />
9,274<br />
7,465<br />
1<br />
Sishen mine<br />
R nil revenue in 2010<br />
Thabazimbi mine Shipping operations Kolomela mine 1<br />
South Africa<br />
China<br />
Rest of Asia<br />
Europe<br />
Middle East<br />
Americas<br />
increases in the spot price of iron ore. By the end of the third quarter,<br />
steel production had started to slow noticeably as steel prices<br />
continued to weaken and market sentiment remained uncertain.<br />
Spot iron ore prices fell to a low of US$116.75/tonne CFR at the<br />
end of October 2011, losing around 35% from the peak achieved in<br />
early September 2011. Similarly lump iron ore premiums came under<br />
severe pressure during the fourth quarter of 2011. Steel markets<br />
in China remain subdued but have stabilised with steel producers<br />
resuming the sourcing of iron ore during November 2011 as stocks<br />
had been run down and spot iron ore pricing found a support level<br />
provided by high cost Chinese domestic iron ore production. Spot<br />
prices have recovered and climbed to around US$140.00/tonne<br />
CFR to China.<br />
In addition we increased our export sales volume by 3% or 1.0Mt on<br />
which these higher prices were realised – this increased revenue by<br />
R764 million.<br />
The average Rand/US$ exchange rate of R7.25 to the dollar was<br />
marginally stronger than the R7.30 achieved during 2010 which<br />
resulted in a decline in revenue of R335 million.<br />
Due to lower freight rates, the revenue from shipping operations of<br />
R2.7 billion was R168 million down on the R2.9 billion earned during<br />
2010. This revenue was earned on 21.7Mt shipped on behalf of our<br />
customers. The margin achieved has been sustained delivering a<br />
profit of R337 million for the year.<br />
Revenue generated from Sishen mine increased significantly by<br />
<br />
mine’s revenue was up 36%, revenue of R32 million was generated<br />
on the sale of first ore by Kolomela mine and revenue from our<br />
shipping operations decreased by 6%, as compared to 2010.<br />
62% of revenue was earned from sales to customers in China, 19%<br />
from customers based in the rest of Asia and 11% from European<br />
customers. A geographical analysis of revenue earned based on the<br />
country of origin is provided above.<br />
OPERATING EXPENDITURE<br />
Operating expenses increased by 22% year on year from<br />
R13.6 billion to R16.6 billion. Mining operating expenses increased<br />
by R2.8 billion or 30% from 2010 (calculated on operating<br />
expenses excluding shipping expenses and the mineral royalty).<br />
As with the rest of the industry, <strong>Kumba</strong> experienced mining inflation<br />
well in excess of CPI. A number of cost items increased well in<br />
excess of inflation, such as the price of diesel which increased by<br />
24%. In addition, operating costs remained under pressure due to<br />
large planned increases in waste mining activities across all our sites.<br />
Operating expenses was favourably affected by higher finance gains<br />
realised from the revaluation of US$ denominated monetary assets<br />
and derivative instruments, to the value of R587 million.<br />
Selling and distribution costs rose by 22% year on year to<br />
R3.7 billion. This was primarily driven by rail and port tariff<br />
contractual increases, a 7% increase in volumes railed by Transnet to<br />
39.1Mt and a 3% increase in volumes loaded at the port, to 37.6Mt.<br />
Sishen mine unit cash cost<br />
Sishen mine produced 38.9Mt, 6% lower year on year as operations<br />
were disrupted during the first half of 2011. The mine managed to<br />
mitigate some of the production shortfall by producing 9% more in<br />
the second half of 2011. This production shortfall had a significant<br />
impact on Sishen mine’s unit cash cost which has a substantial<br />
fixed cost element. As a result unit cash costs increased by 35% to<br />
4 <strong>Kumba</strong> <strong>Iron</strong> <strong>Ore</strong> Limited
17<br />
13<br />
OPERATING EXPENDITURE<br />
Rand million 2011 2010 % change 2009<br />
Production costs 9,497 7,317 30 5,960<br />
Movement in inventories (149) (459) (68) (600)<br />
Finished products 247 (171) – (440)<br />
Work-in-progress (396) (288) 38 (160)<br />
Finance gains (587) (286) 105 (329)<br />
Other – (2) – (30)<br />
Cost of goods sold 8,761 6,570 33 5,001<br />
Selling and distribution costs 3,698 3,041 22 2,838<br />
Sublease rent received (8) (8) – (8)<br />
Mining operating expenses 12,451 9,603 30 7,831<br />
Mineral royalty 1,762 1,410 25 –<br />
Cost of services rendered – shipping 2,374 2,560 (7) 2,697<br />
Operating expenses 16,587 13,573 22 10,528<br />
Financial review<br />
R150/tonne from the R111/tonne achieved in 2010. However, at<br />
US$21/tonne the mine remains well positioned in the lower part of<br />
the cash cost curve.<br />
We saw a R39/tonne increase in unit cash cost which was driven by<br />
a few key factors:<br />
– Inflationary pressures, principally on labour and contract mining,<br />
pushed up costs by almost R7/tonne;<br />
– A number of cost items increasing well in excess of inflation,<br />
such as the price of diesel which increased from R7.50 per litre<br />
to R9.30 per litre. This accounted for R7/tonne of the nearly<br />
R13/tonne increases in excess of inflation and increased<br />
maintenance cost on the larger mining fleet contributed a further<br />
R3/tonne;<br />
– The increased mining activity added almost R11/tonne or<br />
10%; and<br />
– The production shortfalls added R9/tonne.<br />
Further increases in unit cash costs are anticipated as the mine<br />
increases the waste stripping according to plan. The increased waste<br />
stripping is expected to add 10% per annum to unit cash costs<br />
(before mining inflation) for the next 2 to 3 years.<br />
The group’s Asset Optimisation and Supply Chain programmes are<br />
now embedded in the business. Sishen mine’s Asset Optimisation<br />
initiatives are focused on improving the efficiency of mining<br />
operations on a sustainable basis. Through these initiatives and<br />
procurement savings we seek to contain some of the cost increases.<br />
The Sishen Mine unit cash cost structure per major cost component<br />
– both on a Rand per tonne as well as a percentage basis – is<br />
illustrated below. Compared to 2010, with the significant increase in<br />
the cost and utilisation of diesel, the relative contribution of this cost<br />
item to the mine’s cost structure saw an increase from 13% to 17%.<br />
SISHEN MINE UNIT CASH COST STRUCTURE<br />
2011 (R/tonne)<br />
2010 (R/tonne)<br />
2011 (%)<br />
2010 (%)<br />
27.87<br />
34.75<br />
21.12<br />
18<br />
23<br />
19<br />
28<br />
29.43<br />
5.32<br />
7.91<br />
6.21 3.81<br />
4<br />
5<br />
3<br />
5<br />
29.76<br />
20<br />
14.51<br />
25.33<br />
22.51<br />
20<br />
19.53<br />
13.61<br />
13<br />
12<br />
Labour Outside service Maintenance Fuel Drilling & blasting Energy Other<br />
SISHEN MINE UNIT CASH COST (R/tonne)<br />
160<br />
150<br />
140<br />
130<br />
120<br />
110<br />
100<br />
111.20*<br />
(US$15.23)<br />
6.84<br />
12.74<br />
10.82<br />
8.87 150.47<br />
(US$20.75)<br />
2010 Inflation Cost escalation Mining volume<br />
Production volume 2011<br />
* The 2010 unit cash cost was restated to take into account non-cash share-based payment expenses<br />
Annual Financial Statements 2011<br />
5
16<br />
30<br />
FINANCIAL REVIEW<br />
FOR THE YEAR ENDED 31 DECEMBER 2011<br />
Operating profit (EBIT)<br />
Operating profit increased by 27% from R25.1 billion to a record<br />
R32.0 billion. The group’s operating profit margin increased<br />
marginally to 66%. Excluding the margin earned from providing<br />
a shipping service to customers, the group’s mining operating<br />
margin remained stable at 69%. The operating profit achieved was<br />
impacted by the increase in operating expenses on the back of the<br />
growth in mining volumes across the group and above inflationary<br />
cost increases.<br />
Operating profit improved principally as a result of:<br />
<br />
which added R8.9 billion to operating profit and a 3% growth in<br />
export sales volumes which contributed R954 million; and<br />
<br />
shipped by <strong>Kumba</strong> on behalf of customers increased by 3.0Mt<br />
from 18.7Mt in 2010 to 21.7Mt for 2011.<br />
This increase in operating profit was offset by:<br />
<br />
selling and distribution expenses, shipping expenses and the<br />
mineral royalty) driven by the substantial increase in waste mined<br />
<br />
on costs;<br />
<br />
mainly as a result of a 7% growth in total volumes railed at an<br />
increased tariff;<br />
<br />
free-on-rail (‘FOR’) iron ore revenue, which added R352 million to<br />
operating expenditure; and<br />
<br />
marginally stronger than the R7.30 achieved during 2010 and<br />
resulted in a decline in revenue of some R335 million.<br />
The group’s operating profit per business segment is analysed below.<br />
Other segments, which include the Corporate Office, Project and<br />
Technical Services of the group, contributed to a net operating loss<br />
of R1.1 billion and R684 million for 2011 and 2010 respectively. Net<br />
finance income incurred on a centralised basis was R92 million for<br />
2011 (R29 million net finance costs for 2010).<br />
CAPITAL EXPENDITURE<br />
Rand million 2011 2010<br />
Capital expenditure 5,849 4,723<br />
Comprising:<br />
Expansion 3,104 3,099<br />
Stay in business 2,745 1,624<br />
Transfers from assets under<br />
construction to property, plant<br />
and equipment 8,951 1,519<br />
Capital expenditure of R5.8 billion was incurred, of which R2.7 billion<br />
was to maintain operations, mainly for Sishen mine’s fleet expansion<br />
programme. R3.1 billion was invested to expand operations, mainly<br />
on Kolomela mine, and R317 million on the Sishen Westerly<br />
Expansion Project (SWEP) in 2011 (2010: R62 million).<br />
The development of Kolomela mine was largely completed during<br />
2011, and the mine commenced with commercial production in<br />
December 2011. On 1 December 2011 the capitalisation of mining<br />
operating expenses ceased as substantially all the activities for<br />
bringing the mine in the location and condition necessary for it to<br />
be capable of operating in the manner intended by management<br />
had been completed. R7.7 billion was subsequently transferred<br />
to property, plant, infrastructure and equipment from assets<br />
under construction.<br />
Stay in business capital expenditure of some R3 billion is anticipated<br />
for 2012 and 2013 mainly due to the Sishen mining fleet<br />
replacement and associated infrastructure.<br />
Cash flows<br />
The group continued to generate substantial cash from its operations,<br />
with R34.3 billion (before the mineral royalty of R1.7 billion) generated<br />
during the year, 27% more than the R27.0 billion of 2010. These<br />
cash flows were used to pay aggregate dividends of R17.9 billion,<br />
taxation of R7.0 billion, the Envision payout of R2.7 billion and mineral<br />
royalties of R1.7 billion during 2011.<br />
Cash generated during the year was utilised as follows:<br />
EBIT – SEGMENT ANALYSIS<br />
2011(R million)<br />
2010 (R million)<br />
112<br />
337<br />
-80<br />
-44<br />
319<br />
UTILISATION OF CASH GENERATED<br />
2011(%)<br />
2010 (%)<br />
7<br />
1<br />
6<br />
14<br />
7<br />
23<br />
2 2<br />
32,661<br />
25,540<br />
29<br />
47<br />
16<br />
Sishen mine Thabazimbi mine 1 Shipping operations Kolomela mine 2<br />
1 Contributed an operating loss of R44 million for 2010<br />
2 Contributed an operating loss of R80 million for 2011; R nil EBIT in 2010<br />
Employee cost Additions to PPE<br />
Taxation 1<br />
Dividends paid<br />
1 Taxation includes mineral royalties<br />
Envision<br />
Other<br />
Cash retained<br />
6 <strong>Kumba</strong> <strong>Iron</strong> <strong>Ore</strong> Limited
Net debt<br />
<strong>Kumba</strong>’s net cash position at 31 December was as follows:<br />
Rand million 2011 2010<br />
Long-term interest-bearing<br />
borrowings – 3,185<br />
Short-term portion of long-term<br />
interest-bearing borrowings 3,191 –<br />
Total 3,191 3,185<br />
Cash and cash equivalents (4,742) (4,855)<br />
Net cash (1,551) (1,670)<br />
Total equity 20,592 18,376<br />
Interest cover (times) 206 77<br />
At 31 December 2011 R3.2 billion of the total R8.6 billion long-term<br />
debt facilities has been drawn down to finance <strong>Kumba</strong>’s expansion.<br />
The R3.2 billion debt facility matures in 2012 and is due for<br />
repayment on 31 July 2012. We are well advanced with the process<br />
to put in place alternative funding options for the group.<br />
<strong>Kumba</strong> was not in breach of any of its covenants during the year.<br />
The group had undrawn long-term borrowing and uncommitted<br />
short-term facilities at 31 December 2011 of R9 billion<br />
(2010: R9.3 billion). <strong>Kumba</strong>’s debt profile has a longer term bias,<br />
which reflects both our capital investment programme as well as<br />
the excellent results generated by our operations over the past<br />
5 years. This has reduced the group’s dependency on short-term<br />
borrowing facilities.<br />
SHAREHOLDER RETURNS<br />
Share price<br />
<strong>Kumba</strong>’s share price has shown a marked increase during the year,<br />
growing 39% from the closing price of R425 at 31 December 2010<br />
to R500 at 31 December 2011. The share price has grown at a<br />
compound annual growth rate of 35% from the listing share price<br />
of R111 at the end of 2006. <strong>Kumba</strong> continued to outperform the<br />
mining index of the JSE during the year by some 25%.<br />
Dividends<br />
<strong>Kumba</strong> continues to return cash to its shareholders after considering<br />
the need to preserve cash to fund the future growth of the group.<br />
<strong>Kumba</strong>’s dividend policy of returning surplus cash to shareholders<br />
remains unchanged as does the desire to fund capital expenditure<br />
with debt instruments.<br />
Financial review<br />
KUMBA CLOSING SHARE PRICE (Rand)<br />
500<br />
500<br />
400<br />
300<br />
200<br />
100<br />
111<br />
0<br />
Dec 2006 Dec 2007 Dec 2008 Dec 2009 Dec 2010 Dec 2011<br />
Total dividend<br />
2011<br />
Final dividend<br />
31 December 2011<br />
Interim dividend<br />
30 June 2011<br />
Total dividend<br />
2010<br />
Total dividend<br />
2009<br />
Earnings per share (Rand per share) 53.11 24.88 28.23 44.66 21.94<br />
Dividend per share (Rand per share) 44.20 22.50 21.70 34.50 14.60<br />
Total dividend declared (Rm) 14,250 7,247 7,003 11,101 4 671<br />
Dividend cover (times) 1.2 1.1 1.3 1.3 1.5<br />
EMPOWERMENT<br />
Rand million 2011 2010 2009 2008 2007<br />
Dividend declared by SIOC 19,266 13,982 6,295 9,040 3,266<br />
– <strong>Kumba</strong> 14,250 10,348 4,658 6,690 2,417<br />
– Exxaro 3,851 2,796 1,259 1,808 653<br />
– SIOC Community development trust 578 419 189 271 98<br />
– Envision (Employee share ownership scheme) 587 419 189 271 98<br />
Dividend cash flows to BEE shareholders 1 4,170 1,876 1,811 1,076 392<br />
– Exxaro 3,516 1,810 1,744 1,036 374<br />
– SIOC Community development trust 527 4 8 8 7<br />
– Envision (Employee share ownership scheme) 127 62 59 32 11<br />
1 Dividend cash flows in 2011 consists of the final cash dividend for 2010 and the interim dividend for 2011<br />
Annual Financial Statements 2011<br />
7
FINANCIAL REVIEW<br />
FOR THE YEAR ENDED 31 DECEMBER 2011<br />
Attributable and headline earnings for the year were R53.11 and<br />
R53.13 per share respectively (2010: R44.66 and R44.67 per<br />
share). The board reviewed the cash flow generation, growth plans<br />
and the capital structure of <strong>Kumba</strong> and declared a final dividend<br />
of R22.50 per share (interim dividend R21.70 per share), bringing<br />
the total dividend for the year to R44.20 (2010: R34.50). With the<br />
declaration of the final dividend the cover has reduced to 1.2 times<br />
for 2011 from 1.3 times in 2010. The total dividend declared to<br />
shareholders since listing is R122.60 per share.<br />
The board will continue to consider the dividend payable at each<br />
declaration date after taking into account the financial position and<br />
prospects of the group.<br />
Empowerment<br />
<strong>Kumba</strong> continues to make a meaningful contribution towards<br />
South Africa’s broad based empowerment, through both capital<br />
appreciation and the payment of substantial cash dividends to the<br />
Black Economic Empowerment (BEE) shareholders of Sishen <strong>Iron</strong><br />
<strong>Ore</strong> Company (Pty) Limited (SIOC):<br />
<br />
its broad based employee share scheme with 6,209 permanent<br />
employee members, on 29 November 2011. Envision was valued<br />
at R2.7 billion at the conclusion of its first phase, resulting<br />
in employee members who have worked for <strong>Kumba</strong> over the<br />
five-year period since its inception in 2006, each receiving<br />
R576,045 (pre tax). Members of the scheme have already received<br />
up to R55,000 in dividends through the course of the five year<br />
term. The second five year phase of the scheme commenced on<br />
10 November 2011, through this second phase employees will<br />
receive their first dividend in March 2012 payable from the final<br />
SIOC 2011 dividend declared.<br />
<br />
received R1.3 billion in dividends since its inception five years<br />
ago, of which R527 million was received in cash during 2011<br />
and R578 million will be paid in February 2012 from the final<br />
2011 dividend declared by SIOC. These funds contribute towards<br />
sustainable community projects.<br />
<br />
since its listing five years ago.<br />
KEY FACTORS AFFECTING FUTURE<br />
OPERATING RESULTS<br />
Export iron ore sales prices and volumes<br />
The short-term outlook for the global seaborne iron ore market<br />
is impacted by ongoing macro-economic uncertainty. Monetary<br />
tightening measures to control inflation in emerging economies<br />
such as China started to have the intended effect. In addition, a lack<br />
of co-ordinated policy response to tackle the European sovereign<br />
debt crisis also impacted demand. Despite the short-term macroeconomic<br />
uncertainty, medium to long-term prospects for demand<br />
remains robust as China continues to industrialise and urbanise.<br />
Nevertheless, as China shifts from an investment intensive to<br />
consumption driven economy, the rate of growth for steel materials is<br />
expected to moderate to a more sustainable level.<br />
While demand is a key driver for pricing, supply constraints also<br />
play a crucial role. In the short-term iron ore supply is anticipated to<br />
<br />
Australia, and government’s moves in India to control export.<br />
Ongoing challenges producers face in delivering new supply will<br />
lead to increasing capital intensity and underpinned long-term<br />
pricing outlook.<br />
<strong>Kumba</strong>’s ability to supply iron ore to the market will be enhanced by<br />
the ramping up of Kolomela mine during 2012 to produce between<br />
4Mt and 5Mt in 2012. Export sales volumes in 2012 are anticipated<br />
to grow by ~3Mt from the volumes achieved in 2011 as volumes<br />
from Kolomela mine ramp up, offset by the fact that excess finished<br />
product stockpiles at Sishen mine have been depleted to operating<br />
levels.<br />
Exchange rate<br />
Relative to 2010, the US Dollar has weakened marginally against<br />
the South African Rand, remaining at pre-2008 levels, as can be<br />
seen from the graph on the next page. A significant proportion of<br />
our turnover and capital expenditure is affected by Rand/US Dollar<br />
exchange rate, and as such <strong>Kumba</strong>’s operating profit remains highly<br />
sensitive to the Rand/US Dollar exchange rate.<br />
Operating expenses<br />
Annual production volumes from Sishen mine are expected to<br />
increase back to design capacity which should aid in containing<br />
unit cost increases. Waste mining at Sishen mine is anticipated<br />
to increase in line with the planned ramp up that commenced<br />
in 2009, which will put upward pressure on unit cash costs<br />
of production.<br />
Operating efficiencies and revenue<br />
enhancement<br />
<strong>Kumba</strong> continues to focus on operational excellence, productivity<br />
improvements and efficiencies. Achieving this optimisation is<br />
currently a critical factor at Sishen mine, where management is<br />
facing a challenging period of increasing waste stripping set to<br />
continue for the next two to three years. The western-dipping ore<br />
body requires increased waste stripping and tight pit conditions<br />
constrain face lengths which, in turn, limits flexibility. Sishen mine’s<br />
PLATTS IODEX 62% Fe CFR (US Dollar)<br />
200<br />
160<br />
120<br />
80<br />
40<br />
Dec 2008 Dec 2009<br />
Dec 2010<br />
Dec 2011<br />
Platts IODEX 62% Fe CFR<br />
8 <strong>Kumba</strong> <strong>Iron</strong> <strong>Ore</strong> Limited
productivity improvement project, ‘Bokamoso’ continues to deliver<br />
efficiency and productivity improvements required to partially offset<br />
cost pressures associated with increased mining activity.<br />
SIGNIFICANT ACCOUNTING MATTERS<br />
Change in accounting estimates<br />
Management has revised the remaining estimated useful lives of<br />
certain items of property, plant and equipment at Sishen mine, as<br />
well as the estimated rehabilitation and decommissioning provisions<br />
at both Sishen and Kolomela mines. The change in estimate at<br />
Kolomela mine was mainly as a result of a decrease in the useful<br />
life resulting from the exclusion of inferred mineral resources from<br />
the LOM plan for accounting purposes. The LOM plan on which<br />
accounting estimates are based only includes proved and probable<br />
ore resources as disclosed in <strong>Kumba</strong>’s annual <strong>Ore</strong> Reserves and<br />
Mineral Resources statement. The effect of these changes is<br />
detailed below:<br />
31 December<br />
Rand million<br />
2011<br />
Increase in environmental rehabilitation provision 67<br />
Increase in decommissioning provision 20<br />
Increase in accumulated depreciation 55<br />
The change in estimate in the environmental rehabilitation provision<br />
and accumulated depreciation was applied prospectively from<br />
1 January 2011 and resulted in a decrease in attributable profit<br />
before taxation and headline earnings per share for the year ended<br />
31 December 2011 of R122 million and 21 cents, respectively.<br />
The change in estimate in the decommissioning provision has been<br />
capitalised to the related property, plant and equipment.<br />
IR Page 70<br />
Unwinding of phase one of Envision<br />
Envision, SIOC’s broad-based equity participation scheme for<br />
employees below managerial level, was set up to provide a<br />
framework for the incentivisation and retention of certain employees,<br />
as well as effective participation in the equity transition of the group<br />
as contemplated in the Mining Charter.<br />
Envision was structured as a ten year scheme, divided into two<br />
capital appreciation periods. The first capital appreciation period<br />
vested on 17 November 2011. The second capital appreciation<br />
period commenced on 10 November 2011 with the issue of 3.09%<br />
in the share capital of SIOC to the Envision trust. This resulted in a<br />
net increase in the non-controlling interest in SIOC of R4 million.<br />
The unwind of phase one resulted in a net cash outflow for the<br />
group through the implementation of the specific share repurchase<br />
by <strong>Kumba</strong> undertaken to monetise the value for employee<br />
participants. The actual monetary impact was R2.7 billion, based<br />
on a <strong>Kumba</strong> 5 day average share price of R 508.82 per share on<br />
17 November 2011.<br />
Accounting policies<br />
The following amendments to published standards and<br />
interpretations which became effective for the year commencing on<br />
1 January 2011 were adopted by the group:<br />
IAS 24 - RELATED PARTY DISCLOSURES<br />
(AMENDMENT)<br />
This amendment simplifies the definition of a related party, clarifying<br />
its intended meaning and eliminating inconsistencies from the<br />
definition and provides a partial exemption from the disclosure<br />
requirements for government-related entities. This amendment did<br />
not have a significant impact on the reported results for the year<br />
ended 31 December 2011.<br />
ANNUAL IMPROVEMENTS PROJECT 2010<br />
The group adopted the amendments to various issued accounting<br />
standards issued by the International Accounting Standards Board<br />
(IASB) as part of its Annual Improvements Project 2010 that are<br />
effective for reporting periods that commenced on 1 January 2011.<br />
These amendments have not had an effect on the reported results or<br />
the group accounting policies.<br />
CONCLUSION<br />
The year under review has been very successful for the group.<br />
This has enabled us to consistently deliver on and exceed our<br />
financial targets and consequently return significant cash to<br />
our shareholders. Our strong balance sheet, together with our<br />
sustained financial performance, provides a solid foundation for<br />
sustainable growth.<br />
Vincent Uren<br />
Chief financial officer<br />
Financial review<br />
EXCHANGE RATE (Rand/US Dollar)<br />
10<br />
9<br />
8<br />
7<br />
6<br />
5<br />
Dec 2006 Dec 2007 Dec 2008 Dec 2009 Dec 2010 Dec 2011<br />
Yearly average<br />
Monthly average<br />
Annual Financial Statements 2011<br />
9
DIRECTORS’ RESPONSIBILITY FOR FINANCIAL REPORTING<br />
FOR THE YEAR ENDED 31 DECEMBER 2011<br />
DIRECTORS’ RESPONSIBILITY<br />
FOR FINANCIAL REPORTING<br />
The directors are responsible for:<br />
<br />
financial statements and related financial information of the <strong>Kumba</strong><br />
<strong>Iron</strong> <strong>Ore</strong> Limited Group (the group) as well as <strong>Kumba</strong> <strong>Iron</strong> <strong>Ore</strong><br />
Limited (<strong>Kumba</strong> or the company), in accordance with International<br />
Financial Reporting Standards and the requirements of The<br />
Companies Act and the Listings Requirements of the JSE Limited,<br />
which include amounts based on judgments and estimates made<br />
by management.<br />
The annual financial statements, set out on pages 13 to 81, are<br />
based on appropriate accounting policies which have been been<br />
consistently applied and which are supported by reasonable and<br />
prudent judgments and estimates, comprise the balance sheets<br />
at 31 December 2011; the income statements, the statements of<br />
comprehensive income, the statements of changes in equity and cash<br />
flow statements for the year then ended; the notes to the financial<br />
statements, which include a summary of principal accounting policies<br />
and other explanatory notes; and the directors’ report.<br />
The directors, primarily through the Audit Committee, meet periodically<br />
with the external and internal auditors as well as the executive<br />
management to evaluate matters concerning the responsibilities below:<br />
<br />
of risk management;<br />
<br />
internal control relevant to the preparation and fair presentation<br />
of these financial statements, that provides reasonable but not<br />
absolute assurance against material misstatement or loss, whether<br />
owing to fraud or error;<br />
<br />
<br />
circumstances;<br />
<br />
assets; and<br />
<br />
financial statements.<br />
The group’s internal auditors independently evaluate the internal<br />
controls and co-ordinate their audit coverage with the external auditors.<br />
The external and internal auditors have unrestricted access to all<br />
records, property and personnel as well as to the Audit Committee.<br />
The directors acknowledge that they are ultimately responsible for<br />
the process of risk management and the system of internal financial<br />
control established by the group and place a strong emphasis on<br />
maintaining a strong control environment. The directors are not<br />
aware of any material breakdown in the functioning of these controls<br />
and systems during the year under review. The directors are of<br />
the opinion, based on the information and explanations given by<br />
management, the internal auditors, the external auditors and the<br />
group’s risk, compliance and other reporting processes that the<br />
risk management processes and system of internal control provide<br />
reasonable assurance in all key material aspects that the financial<br />
records may be relied upon for the preparation of the annual<br />
financial statements.<br />
Having considered the group’s major risks, outstanding legal,<br />
insurance and taxation issues, an assessment of the solvency<br />
and liquidity taking into account the current financial position and<br />
existing borrowing facilities as well as the group’s financial budgets<br />
with their underlying business plans, the directors consider it<br />
appropriate that the annual financial statements be prepared on<br />
the going-concern basis.<br />
APPROVAL OF GROUP ANNUAL<br />
FINANCIAL STATEMENTS AND ANNUAL<br />
FINANCIAL STATEMENTS<br />
The group annual financial statements on pages 13 to 68, and<br />
78 to 81; and the annual financial statements of <strong>Kumba</strong> <strong>Iron</strong> <strong>Ore</strong><br />
Limited on pages 69 to 77, as identified in the first paragraph, were<br />
approved by the <strong>Kumba</strong> board of directors on 7 February 2012 and<br />
are subject to approval by the shareholders at the annual general<br />
meeting on 4 May 2012. The group and company annual financial<br />
statements are signed on the directors’ behalf by:<br />
The independent auditors are responsible for reporting on whether<br />
the group annual financial statements and the company annual<br />
financial statements are fairly presented in accordance with<br />
the applicable financial reporting framework. Their report to the<br />
members of the group and <strong>Kumba</strong> is set out on page 12 of<br />
this report.<br />
AJ Morgan<br />
Interim chairman<br />
7 February 2012<br />
CI Griffith<br />
Chief executive<br />
10 <strong>Kumba</strong> <strong>Iron</strong> <strong>Ore</strong> Limited
CERTIFICATE OF THE COMPANY SECRETARY<br />
FOR THE YEAR ENDED 31 DECEMBER 2011<br />
CERTIFICATE OF THE<br />
COMPANY SECRETARY<br />
I, VF Malie, in my capacity as company secretary, confirm that, for the year ended 31 December 2011, <strong>Kumba</strong> <strong>Iron</strong> <strong>Ore</strong> Limited has lodged with<br />
the Registrar of Companies all such returns and notices as are required of a public company in terms of the Companies Act 71 of 2008, as<br />
amended, and that all such returns and notices are true, correct and up to date.<br />
VF Malie<br />
Company secretary<br />
7 February 2012<br />
Approvals<br />
Annual financial statements 2011<br />
11
INDEPENDENT AUDITOR’S REPORT<br />
INDEPENDENT<br />
AUDITOR’S REPORT<br />
TO THE SHAREHOLDERS OF KUMBA IRON ORE LIMITED<br />
We have audited the group annual financial statements and annual<br />
financial statements of <strong>Kumba</strong> <strong>Iron</strong> <strong>Ore</strong> Limited, which comprise the<br />
consolidated and separate balance sheets as at 31 December 2011,<br />
and the consolidated and separate income statements, the consolidated<br />
and separate statements of comprehensive income, the consolidated<br />
and separate statements of changes in equity, the consolidated<br />
and separate cash flow statements for the year then ended, and a<br />
summary of significant accounting policies and other explanatory<br />
notes, and the directors’ report, as set out on pages 13 to 81.<br />
OPINION<br />
In our opinion, these financial statements present fairly, in all material<br />
respects, the consolidated and separate financial position of <strong>Kumba</strong><br />
<strong>Iron</strong> <strong>Ore</strong> Limited as at 31 December 2011, and its consolidated<br />
and separate financial performance and consolidated and separate<br />
cash flows for the year then ended in accordance with International<br />
Financial Reporting Standards, and the requirements of the<br />
Companies Act of South Africa.<br />
DIRECTORS’ RESPONSIBILITY FOR THE<br />
FINANCIAL STATEMENTS<br />
The company’s directors are responsible for the preparation and<br />
fair presentation of these financial statements in accordance with<br />
International Financial Reporting Standards and the requirements<br />
of the Companies Act of South Africa, and for such internal control<br />
as the directors determine is necessary to enable the preparation<br />
of financial statements that are free from material misstatement,<br />
whether due to fraud or error.<br />
AUDITOR’S RESPONSIBILITY<br />
Our responsibility is to express an opinion on these financial<br />
statements based on our audit. We conducted our audit in<br />
accordance with International Standards on Auditing. Those<br />
standards require that we comply with ethical requirements and plan<br />
and perform the audit to obtain reasonable assurance about whether<br />
the financial statements are free from material misstatement.<br />
An audit involves performing procedures to obtain audit evidence<br />
about the amounts and disclosures in the financial statements. The<br />
procedures selected depend on the auditor’s judgement, including<br />
the assessment of the risks of material misstatement of the financial<br />
statements, whether due to fraud or error. In making those risk<br />
assessments, the auditor considers internal controls relevant to the<br />
entity’s preparation and fair presentation of the financial statements,<br />
in order to design audit procedures that are appropriate in the<br />
circumstances, but not for the purpose of expressing an opinion<br />
on the effectiveness of the entity’s internal controls. An audit also<br />
includes evaluating the appropriateness of accounting policies<br />
used and the reasonableness of accounting estimates made by<br />
management, as well as evaluating the overall presentation of the<br />
financial statements.<br />
Deloitte & Touche<br />
Registered auditor<br />
Per G Krog<br />
Partner<br />
7 February 2012<br />
National executive: GG Gelink chief executive; AE Swiegers<br />
chief operating officer; GM Pinnock audit; DL Kennedy risk advisory<br />
and legal services; NB Kader tax; L Geeringh consulting; L Bam<br />
<br />
finance; TJ Brown chairman of the board; MJ Comber deputy<br />
chairman of the board<br />
A full list of partners and directors is available on request<br />
BBBEE rating: Level 2 contributor in terms of the Chartered<br />
Accountancy Profession Sector Code<br />
Member of Deloitte Touche Tohmatsu Limited<br />
We believe that the audit evidence we have obtained is sufficient<br />
and appropriate to provide a basis for our audit opinion.<br />
12 <strong>Kumba</strong> <strong>Iron</strong> <strong>Ore</strong> Limited
DIRECTORS’ REPORT<br />
FOR THE YEAR ENDED 31 DECEMBER 2011<br />
DIRECTORS’ REPORT<br />
COMPANY REGISTRATION NUMBER 2005/015852/06<br />
The directors have pleasure in presenting the annual financial<br />
statements of <strong>Kumba</strong> and the group for the year ended<br />
31 December 2011.<br />
NATURE OF BUSINESS<br />
<strong>Kumba</strong> was incorporated in South Africa on 16 May 2005 and<br />
commenced trading in November 2006 following the unbundling<br />
of <strong>Kumba</strong> from Exxaro Resources Limited (previously <strong>Kumba</strong><br />
Resources Limited). Subsequent to unbundling, <strong>Kumba</strong> listed on the<br />
JSE Limited (JSE) on 20 November 2006 as the only pure play iron<br />
ore company on the JSE.<br />
<strong>Kumba</strong> is a mining group of companies focusing on the exploration,<br />
extraction, beneficiation, marketing, shipping and sale of iron ore. <strong>Kumba</strong><br />
produces iron ore in South Africa at Sishen and Kolomela mines in<br />
<br />
Province. The Kolomela mine commenced commercial production on<br />
1 December 2011, almost five months ahead of schedule.<br />
The nature of the businesses of the group’s subsidiaries, associates<br />
and joint ventures is set out in annexures 1 and 2.<br />
CORPORATE GOVERNANCE<br />
The group subscribes to the Code of Good Corporate Practices and<br />
Conduct as contained in the King III report on corporate governance.<br />
The board has satisfied itself that <strong>Kumba</strong> has complied in all material<br />
aspects with the code as well as the JSE Listings Requirements<br />
throughout the year under review. The corporate governance report<br />
is set out on pages 82 to 93of the Integrated Report 2011.<br />
IR Page 82<br />
FINANCIAL RESULTS<br />
The financial statements on pages 13 to 81 set out fully the financial<br />
position, results of operations and cash flows of the group for the<br />
financial year ended 31 December 2011. The financial statements<br />
have been prepared under the supervision of Martin Poggiolini,<br />
CA(SA), acting chief financial officer.<br />
Operating results for the year<br />
Summary of the group’s key financial results for the year ended<br />
31 December:<br />
Rand million 2011 2010<br />
% Increase/<br />
(decrease)<br />
Revenue 48,553 38,704 25<br />
Operating profit 31,966 25,131 27<br />
Cash generated from<br />
operations (excluding<br />
mineral royalties paid) 34,331 26,965 27<br />
The group’s total mining revenue (excluding shipping operations<br />
– R2.7 billion in 2011; R2.9 billion in 2010) of R45.8 billion for<br />
the year was 28% higher than the R35.8 billion of 2010 due to a<br />
weighted average increase of 26% in export prices.<br />
Operating profit increased by 27% from R25.1 billion to R32.0 billion.<br />
The group’s operating profit margin increased marginally to 66%.<br />
Excluding the margin earned from providing shipping services to<br />
customers, the group’s mining operating margin remained stable at<br />
69%. The operating profit achieved was impacted by an increase<br />
in operating expenses on the back of the growth in mining volumes<br />
across the group and above-inflation cost increases.<br />
The group continued to generate substantial cash from its operations,<br />
with R34.3 billion (before the mineral royalty of R1.7 billion)<br />
generated during the year, 27% more than the R27.0 billion of<br />
2010. These cash flows were used to pay aggregate dividends<br />
of R17.9 billion, taxation of R7.0 billion, Envision phase one of<br />
R2.7 billion and mineral royalties of R1.7 billion during 2011.<br />
Attributable and headline earnings for the year were R53.11<br />
and R53.13 per share respectively. Refer to note 20, ‘Per share<br />
information’, of the group annual financial statements for an analysis<br />
of movements in the group’s basic and headline earnings per share.<br />
FINANCIAL POSITION<br />
Summary of the group’s financial position as at 31 December:<br />
Rand million 2011 2010 (decrease)<br />
% Increase/<br />
Property, plant and<br />
equipment 20,878 15,866 32<br />
Net working capital<br />
(excluding cash and<br />
cash equivalents) 2,845 2,924 (3)<br />
Net cash 1,551 1,670 (7)<br />
Net asset value per<br />
share (R) 49.16 44.54 10<br />
Property, plant and equipment<br />
Capital expenditure of R5.8 billion was incurred. R2.7 billion was<br />
invested to maintain operations, mainly on Sishen mine’s fleet<br />
expansion programme to mitigate mining and production risks.<br />
A further R3.1 billion was incurred to expand operations, mainly on<br />
the development of Kolomela mine.<br />
Excellent progress was made at Kolomela mine, which was brought<br />
into production ahead of schedule. The plant was successfully<br />
commissioned during 2011, delivering production of 1.2Mt during the<br />
fourth quarter, bringing total production for 2011 to 1.5Mt. Kolomela<br />
mine is on track to produce between 4Mt and 5Mt in 2012 during<br />
ramp up, before producing at full design capacity of 9Mtpa in 2013.<br />
Audited annual financial statements<br />
Annual Financial Statements 2011<br />
13
DIRECTORS’ REPORT<br />
FOR THE YEAR ENDED 31 DECEMBER 2011<br />
Working capital<br />
Net working capital decreased by R79 million from 31 December 2010<br />
to R2.8 billion. This decrease is due to an increase in payables as a<br />
result of the employees’ tax on the Envision payout, offset by<br />
the growth in the accounts receivable balance on the back of the<br />
higher export iron ore prices and an increase in sales volumes in<br />
December 2011 relative to December 2010.<br />
Net cash<br />
At 31 December 2011 the group was in a net cash position of<br />
R1.6 billion (R1.7 billion net cash at the end of 2010), with R3.2 billion<br />
of the total R8.6 billion long-term debt facilities drawn down to finance<br />
<strong>Kumba</strong>’s expansion. The R3.2 billion debt facility is due for repayment in<br />
2012. <strong>Kumba</strong> was not in breach of any of its covenants during the year.<br />
The group had undrawn long-term borrowing and uncommitted shortterm<br />
facilities at 31 December 2011 of R9.1 billion (2010: R9.3 billion).<br />
ACCOUNTING POLICIES<br />
The group adopted the following amendments to existing standards<br />
with effect from 1 January 2011.<br />
IAS 24, Related party disclosures<br />
(amendment)<br />
This amendment simplifies the definition of a related party, clarifying<br />
its intended meaning and eliminating inconsistencies from the<br />
definition and provides a partial exemption from the disclosure<br />
requirements for government-related entities. This amendment did<br />
not have a significant impact on the reported results for the year<br />
ended 31 December 2011.<br />
Annual Improvements Project 2010<br />
The group adopted the amendments to various issued accounting<br />
standards issued by the International Accounting Standards Board<br />
(IASB) as part of its Annual Improvements Project 2010 that are<br />
effective for reporting periods that commenced on 1 January 2011.<br />
These amendments have not had an effect on the reported results or<br />
the group accounting policies.<br />
SHARE CAPITAL<br />
Authorised capital<br />
The company’s authorised share capital of 500,000,000 shares<br />
remained unchanged during the year.<br />
Share movements<br />
Rand million 2011 2010<br />
Balance at beginning of year 153 208<br />
Total shares issued for<br />
cash consideration 16 74<br />
Net movement in treasury<br />
shares under employee share<br />
incentive schemes (139) (129)<br />
Purchase and treasury shares* (278) (191)<br />
Shares issued to employees 139 62<br />
Share capital and share premium 30 153<br />
During 2011, as part of the unwind and monetisation of Envision<br />
phase one, the company issued 5,377,770 <strong>Kumba</strong> shares for<br />
R2.68 billion and subsequently repurchased 5,230,867 of these<br />
<strong>Kumba</strong> shares for R2.67 billion.<br />
* The group acquired 550,781 (2010: 515,241) of its own shares<br />
through purchases on the JSE during the year. The total amount<br />
paid to acquire the shares was R278 million (2010: R191 million).<br />
The shares are held as treasury shares and the purchase<br />
consideration has been deducted from equity.<br />
Unissued shares<br />
The directors are authorised to issue unissued shares until the<br />
next annual general meeting. Shareholders will be asked to extend<br />
the authority of the directors to control the unissued shares of<br />
the company at the forthcoming annual general meeting, up to a<br />
maximum of 5% of the issued capital.<br />
DIVIDENDS<br />
An interim dividend of R21.70 per share was paid on 22 August 2011.<br />
A final dividend of R22.50 per share was declared on 7 February 2012<br />
from profits accrued during the financial year ended 31 December 2011.<br />
The total dividend for the year amounted to R44.20 per share.<br />
The estimated total cash flow of the final dividend of R22.50 per<br />
share, payable on 19 March 2012, is R7.2 billion for <strong>Kumba</strong> <strong>Iron</strong><br />
<strong>Ore</strong> Limited.<br />
The board of directors is satisfied that, after payment of the final<br />
dividend, the group is sufficiently liquid and solvent to support<br />
the current operations and to facilitate future development of<br />
the business.<br />
SUBSIDIARIES, JOINT VENTURES<br />
AND ASSOCIATES<br />
Full particulars of the group’s investment in subsidiaries, associates<br />
and joint ventures are set out in annexures 1 and 2.<br />
EQUITY COMPENSATION PLANS<br />
Refer to the detailed remuneration report on pages 19 to 26,<br />
note 22, ‘Equity-settled share-based payment reserve’, and<br />
Annexure 3 of the group annual financial statements for a detailed<br />
discussion and analysis of movements in the group’s various<br />
equity compensation plans available to executive directors and<br />
senior employees.<br />
14 <strong>Kumba</strong> <strong>Iron</strong> <strong>Ore</strong> Limited
SEGMENT RESULTS<br />
Refer to note 36, ‘Segment reporting’, for a detailed segmental<br />
analysis of the group’s operating results for the year ended and<br />
financial position as at 31 December 2011.<br />
HOLDING COMPANY AND<br />
RELATED PARTIES<br />
Anglo American plc is the group’s ultimate holding company.<br />
The interest in the group is held through a 65.22% holding by<br />
Anglo South Africa Capital (Pty) Limited (2010: 65.25%).<br />
The analysis of ordinary shareholders is given on pages 84 and 85.<br />
MANAGEMENT BY THIRD PARTIES<br />
None of the businesses of the company or its subsidiaries had,<br />
during the financial year, been managed by a third party or a<br />
company in which a director had an interest.<br />
CONTINGENT ASSETS AND LIABILITIES<br />
Falémé Project<br />
<strong>Kumba</strong> initiated arbitration proceedings against La Société des<br />
Mines De Fer Du Sénégal Oriental (Miferso) and the Republic<br />
of Senegal under the rules of the Arbitration of the International<br />
Chamber of Commerce in 2007, in relation to the Falémé Project.<br />
Following the arbitration award rendered in July 2010, a mutually<br />
agreed settlement was concluded between the parties. The parties<br />
agreed that the precise terms of the settlement agreement will<br />
remain confidential. The first settlement was paid by the Republic<br />
of Senegal in April 2011. The remaining settlement amount will be<br />
recovered in equal instalments from the Republic of Senegal over<br />
the remaining four-year period, on which contingent legal costs will<br />
be payable. A portion of the amount recovered was committed to<br />
social and community development projects to benefit the population<br />
of Senegal.<br />
Environmental obligations<br />
During the year Sishen <strong>Iron</strong> <strong>Ore</strong> Company (Pty) Limited (SIOC)<br />
issued financial guarantees to the Department of Mineral Resources<br />
(DMR) to the value of R286 million in respect of the environmental<br />
rehabilitation and decommissioning obligations of the group.<br />
There have been no other significant changes in the contingent<br />
assets and liabilities disclosed at 31 December 2010.<br />
LEGAL PROCEEDINGS<br />
Sishen Supply Agreement arbitration –<br />
ArcelorMittal<br />
SIOC notified ArcelorMittal on 5 February 2010 that it was no<br />
longer entitled to receive 6.25Mtpa of iron ore contract mined by<br />
SIOC at cost plus 3% from Sishen mine, as a result of the fact that<br />
ArcelorMittal had failed to convert its old order mining rights. This<br />
contract mining agreement, concluded in 2001, was premised on<br />
ArcelorMittal owning an undivided 21.4% interest in the mineral<br />
rights of Sishen mine. As a result of ArcelorMittal’s failure to<br />
convert its old order mining right, the contract mining agreement<br />
automatically lapsed and became inoperative in its entirety as of<br />
1 May 2009.<br />
As a result, a dispute arose between SIOC and ArcelorMittal, which<br />
SIOC has referred to arbitration. During 2011, three arbitrators were<br />
appointed and May 2012 was set as the date for the arbitration to<br />
begin. On 9 December 2011, SIOC and AMSA agreed to postpone<br />
the arbitration until the final resolution of the mining right dispute.<br />
SIOC and ArcelorMittal reached an interim pricing arrangement<br />
in respect of the supply of iron ore to ArcelorMittal from the<br />
Sishen mine. This interim arrangement endured until 31 July 2011.<br />
SIOC and ArcelorMittal agreed to an addendum to the interim supply<br />
agreement which extended the terms and conditions of the current<br />
interim pricing agreement. The new interim pricing agreement,<br />
which is on the same terms and conditions as the first interim<br />
pricing agreement, commenced on 1 August 2011 and will endure<br />
to 31 July 2012.<br />
21.4% undivided share of the Sishen mine<br />
mineral rights<br />
After ArcelorMittal failed to convert its old order rights, SIOC applied<br />
for the residual 21.4% mining right previously held by ArcelorMittal<br />
and its application was accepted by the DMR on 4 May 2009.<br />
A competing application for a prospecting right over the same area<br />
was also accepted by the DMR. SIOC objected to this acceptance.<br />
Notwithstanding this objection, a prospecting right over the 21.4%<br />
interest was granted by the DMR to Imperial Crown Trading 289<br />
(Pty) Limited (ICT). SIOC initiated a review application in the North<br />
Gauteng High Court on 21 May 2010 in relation to the decision of<br />
the DMR to grant a prospecting right to ICT.<br />
The High Court Review, in which SIOC challenged the award of the<br />
21.4% prospecting right over Sishen mine by the DMR to ICT, was<br />
presided over by Judge Raymond Zondo in the North Gauteng High<br />
Court in Pretoria, South Africa, from 15 – 18 August 2011.<br />
On 21 December 2011, judgment was delivered in the High Court<br />
regarding the status of the mining rights at the Sishen mine. The High<br />
Court held that, upon the conversion of SIOC’s old order mining right<br />
relating to the Sishen mine properties in 2008, SIOC became the<br />
<br />
in respect of the Sishen mine properties. The High Court held further<br />
that as a consequence, any decision taken by the DMR after such<br />
conversion in 2008 to accept or grant any further rights to iron ore at<br />
the Sishen mine properties was void. Finally, the High Court reviewed<br />
and set aside the decision of the Minister of Mineral Resources or<br />
her delegate to grant a prospecting right to ICT relating to the iron<br />
ore as a 21.4% share in respect of the Sishen mine properties.<br />
On 3 February 2012, both the DMR and ICT submitted applications<br />
for leave to appeal against the High Court judgment. SIOC has noted<br />
an application for leave to present a conditional cross appeal, in<br />
order to protect its rights. SIOC is awaiting a date for the hearing of<br />
the application for leave to appeal.<br />
The High Court order does not affect the interim supply agreement<br />
between AMSA and SIOC, which will endure until 31 July 2012.<br />
SIOC will continue to take the necessary steps to protect its<br />
shareholders’ interests in this regard.<br />
Audited annual financial statements<br />
Annual Financial Statements 2011<br />
15
DIRECTORS’ REPORT<br />
FOR THE YEAR ENDED 31 DECEMBER 2011<br />
Lithos Corporation (Pty) Limited<br />
Lithos Corporation (Pty) Limited is claiming USD421 million from<br />
<strong>Kumba</strong> for damages in relation to the Falémé Project in Senegal.<br />
<strong>Kumba</strong> continues to defend the merits of the claim and is of the<br />
view, and has been so advised, that the basis of the claim and<br />
the quantification thereof is fundamentally flawed. The trial date<br />
has been postponed indefinitely. There have been no further<br />
developments in this matter.<br />
COMPANY SECRETARY<br />
The company secretary of <strong>Kumba</strong> is Mr VF Malie. His business<br />
and postal addresses appear on the inside back cover of these<br />
financial statements.<br />
DIRECTORS<br />
The names of the directors in office during the year and at the date<br />
of this report are set out on page 86 of the Integrated Report 2011.<br />
The remuneration and fees of directors as well as the directors’<br />
beneficial interest in <strong>Kumba</strong> are set out in the detailed remuneration<br />
report on pages 19 to 26.<br />
The board of directors of <strong>Kumba</strong> announced the following changes<br />
in <strong>Kumba</strong>’s directorate during the year:<br />
<br />
non-executive director of <strong>Kumba</strong> on 14 June 2011.<br />
<br />
financial officer from the end of December 2011. He will continue<br />
to be employed by <strong>Kumba</strong> in 2012 and will work exclusively on<br />
the legal issues until 30 June 2012. Mr Martin Poggiolini, the<br />
company’s head of finance, was appointed to act in the position of<br />
chief financial officer with effect from 31 December 2011.<br />
<br />
director on 31 March 2012.<br />
PRESCRIBED OFFICERS<br />
The names of the prescribed officers during the year and at the date<br />
of this report are set out on page 24. The remuneration and fees of<br />
the prescribed officers are also set out in the detailed remuneration<br />
report on page 24.<br />
AUDITORS<br />
Deloitte & Touche continued in office as auditors of <strong>Kumba</strong> and<br />
its subsidiaries. At the annual general meeting on 4 May 2012,<br />
shareholders will be requested to reappoint Deloitte & Touche as<br />
auditors of <strong>Kumba</strong> for the 2012 financial year.<br />
SPECIAL RESOLUTION<br />
On 6 May 2011, the shareholders of <strong>Kumba</strong> resolved that the<br />
company and any of its subsidiaries may from time to time be<br />
authorised to acquire of the company’s own shares subject to<br />
the articles of association of the company, the provisions of the<br />
South African Companies Act No 71 of 2008 and the Listings<br />
Requirements of the JSE.<br />
GOING CONCERN STATEMENT<br />
The directors have reviewed the group’s financial budgets with their<br />
underlying business plans. In light of the current financial position<br />
and existing borrowing facilities, they consider it appropriate that the<br />
group and company annual financial statements be prepared on the<br />
going-concern basis.<br />
IR Page 86<br />
16 <strong>Kumba</strong> <strong>Iron</strong> <strong>Ore</strong> Limited
REPORT OF THE AUDIT COMMITTEE<br />
FOR THE YEAR ENDED 31 DECEMBER 2011<br />
REPORT OF THE AUDIT<br />
COMMITTEE<br />
INTRODUCTION<br />
The committee is pleased to present its report for the financial year<br />
ended 31 December 2011 as recommended by the King Report’s<br />
principles of good corporate governance and in line with the South<br />
African Companies Act No 71 of 2008. The Audit Committee is<br />
constituted as a statutory committee of the group as well as a board<br />
committee approved by the board.<br />
The committee has terms of reference in place, which include both<br />
its statutary duties and those assigned to it by the board, and its<br />
mandate includes:<br />
<br />
regarding all factors and risks that may impact on the reporting;<br />
<br />
the shareholders;<br />
<br />
audit function;<br />
<br />
of the finance function;<br />
<br />
co-ordinated approach to all assurance activities;<br />
<br />
<br />
strategy of the company; and<br />
<br />
COMPOSITION<br />
The Audit Committee, appointed by the board and approved by the<br />
shareholders in respect of the financial year ended 31 December<br />
2011, comprised the following independent non-executive directors,<br />
who have the requisite financial skills and experience to fulfill the<br />
committee’s duties:<br />
<br />
<br />
<br />
<br />
FREQUENCY AND ATTENDANCE OF AUDIT<br />
COMMITTEE MEETINGS<br />
In addition to the committee members, the chief executive, chief<br />
financial officer, the risk manager and head of internal audit and<br />
external audit attend meetings of the committee by invitation.<br />
The committee meets separately with management, internal audit<br />
and external audit at every meeting. During the year under review,<br />
the committee met five times. Attendance of meetings held during<br />
the year under review is presented in the following table:<br />
Member<br />
ZBM Bassa<br />
(chairman)<br />
07-Feb-<br />
11<br />
15-Mar-<br />
11<br />
11-May-<br />
11<br />
15-Jul-<br />
11<br />
09-Nov-<br />
11<br />
<br />
DD Mokgatle <br />
AJ Morgan * <br />
LM Nyhonyha n/a n/a n/a <br />
indicates attendance<br />
* indicates absence with apology<br />
OVERSIGHT FOR RISK MANAGEMENT<br />
Although the board has a risk committee to assist with the discharge<br />
of its duties with regard to the integrated risk management process,<br />
the Audit Committee has an interest in risk management as a<br />
result of its responsibility for internal controls. The chairman of the<br />
committee also chairs the Risk Committee and the committee is kept<br />
informed on the performance of risk management.<br />
INTERNAL AUDIT<br />
The group’s internal audit function is fulfilled by Anglo Business<br />
Assurance Services (ABAS) and provides the board with assurance<br />
on the key areas of the group’s internal financial controls.<br />
The internal audit charter was reviewed and approved by the<br />
committee. Internal audit provides assurance that the company<br />
operates in a responsibly governed manner by performing the<br />
following functions:<br />
<br />
<br />
internal control framework;<br />
<br />
controls; and<br />
<br />
the audit committee.<br />
Audited annual financial statements<br />
Annual Financial Statements 2011<br />
17
REPORT OF THE AUDIT COMMITTEE<br />
FOR THE YEAR ENDED 31 DECEMBER 2011<br />
ABAS participated in a Quality Assessment Review of Risk<br />
Management and Business Assurance conducted by Deloitte LLP.<br />
The independent review was aimed at assessing whether ABAS was<br />
aligned with industry and broader good practice using the FTSE 500<br />
as a peer group. The overall finding was satisfactory.<br />
The Committee is of the opinion, having considered the positive<br />
assurance statement provided by ABAS, that the group’s system<br />
of internal financial controls is effective and provides reasonable<br />
assurance that the financial records may be relied upon for the<br />
preparation of the annual financial statements.<br />
DUTIES CARRIED OUT IN 2011<br />
During the financial year ended 31 December 2011 the committee<br />
carried out its duties as required by section 94(2) of the South<br />
African Companies Act No 71 of 2008, the King Report, the<br />
committee’s terms of reference and in accordance with its<br />
annual plan.<br />
Statutory duties:<br />
<br />
auditors and approved their terms of engagement after<br />
consideration of the timing and scope of the audit;<br />
<br />
auditors for the year ended 31 December 2011;<br />
<br />
auditor is in compliance with the South African Companies Act<br />
No 71 of 2008, The Auditing Professional Act, 2005 and the<br />
Listings Requirements of the JSE Limited; and<br />
<br />
by the external auditors in terms of an established policy to ensure<br />
that the independence of the external auditors is not compromised.<br />
The committee performed the following duties:<br />
<br />
compliance with statutory requirements;<br />
<br />
price sensitive information;<br />
<br />
internal audit process as well as the positive assurance opinion of<br />
the internal auditor on internal financial controls;<br />
<br />
management responses;<br />
<br />
resulting from the audit, as well as any reporting decisions made;<br />
<br />
requirements;<br />
<br />
engagement partner were independent;<br />
<br />
engagement partner to shareholders;<br />
<br />
with all relevant legislation;<br />
<br />
ensured that they were fair and equitable;<br />
<br />
<br />
and monitoring of legal governance compliance within the<br />
company and ensured that the combined assurance model<br />
addressed the significant risks within the company including:<br />
– financial risks;<br />
– internal financial controls;<br />
– fraud risks;<br />
– strategic risks;<br />
– operational risks; and<br />
– IT governance risks.<br />
<br />
appropriateness of the finance function; and<br />
nd were satisfied with the expertise of the chief<br />
financial officer.<br />
FINANCE FUNCTION AND CHIEF<br />
FINANCIAL OFFICER<br />
The committee conducted an assessment of the appropriateness,<br />
skills, expertise and resourcing of the finance function and was<br />
satisfied with the overall adequacy and appropriateness of the<br />
function. The committee further reviewed the expertise and<br />
experience of the chief financial officer and was satisfied with<br />
the appropriateness of the expertise and experience of the chief<br />
financial officer, as well as the acting chief financial officer.<br />
ANNUAL FINANCIAL STATEMENTS<br />
The Audit Committee has evaluated the consolidated annual<br />
financial statements for the year ended 31 December 2011<br />
and concluded that it complies, in all material aspects, with the<br />
requirements of the South African Companies Act No 71 of 2008<br />
and International Financial Reporting Standards. The committee<br />
has therefore recommended the approval of the annual financial<br />
statements to the board.<br />
CONCLUSION<br />
The committee is satisfied that it has considered and discharged<br />
its responsibilities in accordance with its mandate and terms of<br />
reference during the year under review.<br />
ZBM Bassa<br />
Chairman, Audit Committee<br />
7 February 2012<br />
18 <strong>Kumba</strong> <strong>Iron</strong> <strong>Ore</strong> Limited
REMUNERATION REPORT<br />
FOR THE YEAR ENDED 31 DECEMBER 2011<br />
REMUNERATION REPORT<br />
KUMBA’S REMUNERATION PHILOSOPHY<br />
<strong>Kumba</strong>’s remuneration practices are based on the following tenets:<br />
<br />
<br />
<br />
element in support of <strong>Kumba</strong>’s strategy; and<br />
<br />
in relation to job responsibility, the employment market and<br />
personal performance.<br />
<strong>Kumba</strong>’s overall remuneration philosophy has remained unchanged<br />
since the listing of the company in 2006. However, some<br />
components of the remuneration elements were reviewed and<br />
amended during 2011.<br />
The Human Resources, Remuneration and Nomination Committee<br />
of the board of directors (Remco) has the task of applying principles<br />
of accountability and transparency to remuneration matters, so that<br />
the remuneration of directors and executive management is linked to<br />
performance and supports the group’s strategy, with the ultimate aim<br />
of creating value for shareholders.<br />
This report deals with the group’s Remuneration Policy, as well as<br />
the remuneration of directors and executive management for the<br />
2011 financial year. It includes:<br />
<br />
for directors and executive management and its support of<br />
group strategy;<br />
<br />
during 2011;<br />
<br />
directors and executive management;<br />
<br />
Committee, including executive directors;<br />
<br />
<br />
<br />
detailed descriptions of the various long-terms incentive awards<br />
and other information relating to 2011 payments.<br />
HIGHLIGHTS<br />
During the year the Remco focused specifically on:<br />
<br />
assessing pay for performance according to the targets set in<br />
terms of achieving <strong>Kumba</strong>’s goals;<br />
<br />
the principles and recommended practices of the King Code of<br />
Governance Principles for South Africa 2009 (King III);<br />
<br />
the SIOC Employee Share Participation Scheme which was<br />
implemented five years ago, and matured on 17 November 2011;<br />
<br />
mature in 2016; and<br />
<br />
THE REMCO<br />
The Remco has functioned as a sub-committee of the board since<br />
<strong>Kumba</strong>’s listing in 2006. When considering remuneration matters,<br />
it focuses on the company’s remuneration philosophy, on the<br />
determination of levels of remuneration and on annual and long-term<br />
incentive plans. The underlying philosophy is to offer remuneration<br />
that will attract, retain, motivate and reward directors, executive<br />
management and those employees who manifest the competencies<br />
required for the company to achieve its strategy, and to offer<br />
remuneration that is based on individual and company performance<br />
in accordance with competitive market practices.<br />
The role of the Remco in relation to the remuneration of directors<br />
and executive management is to:<br />
<br />
executive directors;<br />
<br />
pay and incentive schemes for directors and executive management;<br />
<br />
directors and executive management, including short-term<br />
incentive payments and long-term incentive share awards; and<br />
<br />
term incentive schemes are made.<br />
The role of the Remco in relation to the remuneration of employees<br />
generally is to:<br />
<br />
adjustments;<br />
<br />
are based;<br />
<br />
long-term incentive schemes to staff are made;<br />
<br />
employees; and<br />
<br />
to employees.<br />
During the year the members of the Remco comprised the<br />
following members:<br />
Mr AJ Morgan (chairman) and Mr PB Matlare. Both Mr Morgan and<br />
Mr Matlare are independent non-executive directors.<br />
Details of the directorate are available on page 86 of the Integrated<br />
Report 2011 as well as on the company’s website at:<br />
www.angloamericankumba.com/au_directorate.php.<br />
IR Page 86<br />
Audited annual financial statements<br />
Annual Financial Statements 2011<br />
19
REMUNERATION REPORT<br />
FOR THE YEAR ENDED 31 DECEMBER 2011<br />
The Remco meets at least three times a year and is empowered to<br />
obtain such external or other independent professional advice as it<br />
considers necessary to carry out its duties.<br />
When deliberating on the remuneration of directors and executive<br />
management, the Remco considers both external market surveys on<br />
remuneration matters and the interests of shareholders.<br />
In applying agreed remuneration principles, the Remco is committed<br />
to the principles of accountability, transparency and good<br />
governance, and seeks to ensure that the reward arrangements<br />
are linked to individual and group performance and that they are in<br />
support of the strategy.<br />
Three meetings of the Remco were held during 2011. Attendance at<br />
meetings was as follows:<br />
Member 03-Feb-11 10-May-11 03-Nov-11<br />
No. of<br />
meetings:<br />
AJ Morgan 3<br />
PB Matlare 3<br />
Indicates attendance.<br />
In 2011 the remuneration elements supported the strategy,<br />
contributing to the creation of short- and long-term value and high<br />
performance for shareholders by focusing on specific earnings<br />
before interest and tax (EBIT) and return on capital employed<br />
(ROCE) targets. Base pay is kept lean and targeted at the 50th<br />
percentile of the market while short-term incentives are capped at a<br />
maximum of 60% of basic employment cost (BEC). The long-term<br />
incentives are derived directly from the short-term incentives which<br />
fully support the pay for performance principle.<br />
The remuneration elements are structured to:<br />
<br />
aligned with shareholder needs;<br />
<br />
to incentivise them to achieve exceptional performance with the<br />
assurance that they will be appropriately rewarded and given<br />
opportunities to advance their careers; and<br />
<br />
strong performance culture with no encouragement of excessive<br />
risk-taking, to assess the appropriateness of deferral mechanisms<br />
to bring about long-term sustainability and to ensure that<br />
performance is rewarded.<br />
It should be noted that the Remco approved changes to the 2012<br />
short- and long-term performance incentive schemes, which include:<br />
<br />
participate in the schemes based on the new aligned Anglo<br />
American Performance Management Standard; and<br />
<br />
the mine’s Rapid Ramp-up Bonus Scheme, which is designed to<br />
incentivise the ramp up in production ahead of the original project<br />
plan for the year ending 31 December 2012.<br />
Overview of the group’s remuneration structure for executive<br />
directors and executive management:<br />
Element<br />
Fixed/<br />
variable Objective Delivery<br />
Salary Fixed Reflects scope<br />
and nature of role,<br />
performance and<br />
experience<br />
Non-monetary<br />
benefits<br />
(medical health<br />
care, vehicle<br />
allowance etc.)<br />
Fixed<br />
Provision of<br />
non-monetary<br />
items<br />
Pension Fixed Provision of<br />
retirement<br />
benefits<br />
Short-term<br />
incentives<br />
Long-term<br />
incentives<br />
Variable<br />
Variable<br />
Rewards and<br />
motivates<br />
achievement of<br />
agreed group<br />
and individual<br />
performance<br />
objectives<br />
Alignment with<br />
shareholder<br />
interests and<br />
creation of longterm<br />
value<br />
Cash<br />
Benefits in kind<br />
Contribution<br />
to pension and<br />
provident funds<br />
Cash of up to<br />
maximum of<br />
60% of basic<br />
employment cost*<br />
for achievement<br />
of maximum<br />
targets<br />
Shares<br />
* Basic employment cost: cost to company less employer retirement fund contributions.<br />
DIRECTORS’ FEES AND REMUNERATION<br />
The directors are appointed by the <strong>Kumba</strong> board based on their<br />
competence, ability and appropriate experience to contribute to<br />
achieving the company’s objectives as a leading value-adding iron<br />
ore supplier to the global steel industry. The policy is to ensure that<br />
executive directors receive remuneration that is appropriate to their<br />
scope of responsibility and contribution to operating and financial<br />
performance, taking into account industry norms and external market<br />
and country benchmarks.<br />
In applying the remuneration principles, the Remco aims to<br />
encourage long-term performance and the continual alignment of<br />
such performance with the strategic direction and specific value<br />
drivers of the business.<br />
Executive directors<br />
The remuneration of executive directors of <strong>Kumba</strong> consists of<br />
two components: a fixed and a variable component of an annual<br />
executive performance incentive and long-term incentives in terms<br />
of <strong>Kumba</strong>’s Bonus Share Plan and a Long-term Incentive Plan.<br />
20 <strong>Kumba</strong> <strong>Iron</strong> <strong>Ore</strong> Limited
Both fixed and variable components are designed to ensure that<br />
a substantial portion of the remuneration package is linked to the<br />
achievement of the company’s strategic objectives, thereby aligning<br />
incentives awarded to improving shareholder value.<br />
A portion of the approved cash salary and the annual performance<br />
incentive elements of the chief executive, Mr CI Griffith, and chief<br />
financial officer, Mr VP Uren, were determined and paid in terms<br />
of separate employment agreements concluded between <strong>Kumba</strong><br />
International Trading SA (KITSA) and the respective executive<br />
director for services rendered outside South Africa.<br />
The remuneration paid by KITSA is calculated according to the<br />
time spent by the director on services performed offshore.<br />
Fixed remuneration<br />
Following established practice, the fixed salaries of executive<br />
directors are reviewed every year in January. Adjustments to the<br />
fixed packages are determined with reference to the scope and<br />
nature of an individual’s role and their performance and experience.<br />
The fixed packages are also compared with the median pay<br />
<br />
ensure market competitiveness and performance excellence. The<br />
review also takes into account any change in the scope of the role<br />
performed by the individual, changes required to meet the principles<br />
of the remuneration policy and market competitiveness. Reward<br />
benchmarking is conducted bi-annually when reward elements are<br />
compared with those of peer mining companies.<br />
In addition to a basic cash salary, executive directors receive benefits<br />
that include a contribution towards membership of one of the group’s<br />
approved medical health care schemes, vehicle benefits, vehicle insurance<br />
and security services. There are no other material benefits paid.<br />
Retirement and risk benefits, including life cover and death-in-service<br />
benefits are provided to executive directors subject to the rules of<br />
the <strong>Kumba</strong> Selector Pension and Provident Funds. During the year,<br />
contributions calculated as a percentage of the pensionable income<br />
are paid to contributory retirement schemes established and/or<br />
approved by the group and subject to the rules of the pension and<br />
provident funds. The employer’s retirement contribution is 9.5% of<br />
cost to company. The rate of contribution for each executive director<br />
is calculated on the basis of the assumption that executive directors<br />
will retire at the age of 60 years.<br />
The basic salaries payable to the executive directors for the 2010<br />
and 2011 financial year and proposed 2012 basic salaries are set<br />
out in the table below:<br />
2012<br />
Basic<br />
salary 1 2011<br />
Basic<br />
salary 2 2010<br />
Basic<br />
salary<br />
CI Griffith 4,616 4,269 3,953<br />
VP Uren – 3,504 3,197<br />
1 Included in the 2012 salary above is EUR51,212 to CI Griffith by KITSA in<br />
respect of services to be rendered in 2012.<br />
2 Included in the 2011 salary above is EUR49,007 to CI Griffith and USD46,688<br />
to VP Uren by KITSA in respect of services rendered as directors in 2011.<br />
Annual performance incentives<br />
In addition to fixed remuneration, each executive director participates<br />
in an executive performance incentive scheme, the Bonus Share<br />
Plan (the BSP). This incentive scheme is designed to reward and<br />
motivate the achievement of agreed group financial, strategic and<br />
performance objectives linked to the key performance areas of their<br />
respective portfolios.<br />
Cash awards under the BSP are determined annually, based on<br />
performance in the previous financial year. Performance of the group<br />
is assessed on various financial, business and strategic performance<br />
criteria and metrics, targeting EBIT and ROCE. For executive directors’<br />
cash awards, 50% will reflect the extent to which the company<br />
achieved its financial targets in 2011. The balance of the cash awards<br />
is determined by the extent to which certain personal strategic and<br />
other performance objectives were achieved by each executive director<br />
in 2011. Maximum earnings potential is set at 60% of annual BEC.<br />
The group’s EBIT target is set at budgeted levels, with an entry<br />
threshold at 95% and maximum payout at 110%. The group’s ROCE<br />
target is set at budgeted levels, with an entry threshold at 30% and<br />
maximum payout at 100%.<br />
The performance targets for executive directors within <strong>Kumba</strong>’s<br />
business operations will vary depending on business-specific<br />
strategic value drivers and key objectives as approved by the board.<br />
Focused value drivers derived from group business objectives<br />
include targets agreed for growth, safety and employment equity to<br />
ensure continued focus on these important business objectives.<br />
In 2011 the CEO’s performance targets were as follows: <strong>Kumba</strong><br />
financial targets – 50%; Safety targets – 10%; Production and<br />
sales – 20%; Anglo American plc earnings per share (EPS) – 10%;<br />
strategic initiatives and projects – 10%.<br />
In 2011 the CFO’s performance targets were as follows: <strong>Kumba</strong><br />
financial targets – 50%; safety targets – 10%; strategy execution,<br />
asset optimisation and strategic projects – 40%.<br />
In February 2011, the Remco considered an overall assessment of<br />
the financial performance of the group for the 2010 financial year<br />
and considered the personal performances of the participants in this<br />
executive performance incentive scheme, against the agreed group<br />
financial targets and the levels of achievement against their strategic<br />
and other key performance objectives within their respective areas<br />
of accountability. Following this, the Remco reported the outcome to<br />
the board which then approved the annual incentives for 2010.<br />
Long-term incentive plans<br />
Executive directors and executive management participate in<br />
one or more of the long-term incentive schemes described below<br />
as proposed by the Remco and approved by the board:<br />
<br />
<br />
<br />
since 2008);<br />
<br />
<br />
<strong>Kumba</strong> Management Share Incentive Scheme (no grants awarded<br />
since unbundling).<br />
Audited annual financial statements<br />
Annual Financial Statements 2011<br />
21
REMUNERATION REPORT<br />
FOR THE YEAR ENDED 31 DECEMBER 2011<br />
Bonus share plan<br />
The BSP was approved by shareholders at the annual general meeting<br />
(AGM) on 20 March 2009 and was implemented in 2009. It is offered<br />
to directors and senior managers who have the opportunity and<br />
the responsibility to contribute towards the group’s overall strategic<br />
objectives. The rationale for implementing the BSP was to:<br />
<br />
linked to wealth creation for the group’s shareholders;<br />
<br />
between annual performance objectives and share-based incentives;<br />
<br />
and thus increase the alignment of employees’ interests with<br />
shareholders; and<br />
<br />
to enable the company to attract, motivate and retain key<br />
management talent.<br />
The BSP has two components:<br />
<br />
<br />
bonus award – these shares are known as bonus shares. The split<br />
between the cash and bonus share elements is determined with<br />
reference to the employees’ grade.<br />
The number of bonus shares awarded is determined with reference<br />
to the value of the annual cash bonus awarded to each participant.<br />
The bonus shares are held by an escrow agent and released to<br />
the participant three years after the award date (conditional upon<br />
the participant still being in the employment of the Anglo American<br />
Group). During the three-year period, the participant is entitled to all<br />
rights attaching to the bonus shares, including dividend entitlements<br />
and voting rights. There are no performance conditions linked to the<br />
bonus shares although the individuals’ performance determines the<br />
actual bonus amount on which these shares are based.<br />
The long-term incentive plan<br />
Executive directors (and, before 2009, senior management) may,<br />
each year, receive on a discretionary basis, a conditional award of<br />
<strong>Kumba</strong> shares. Conditional shares are awarded at 100% of annual<br />
BEC at the face value of the underlying <strong>Kumba</strong> share.<br />
Any vesting of each of the annual The Long-term Incentive Plan<br />
(LTIP) awards made since the inception of the plan in 2007 is subject<br />
to the achievement of stretching performance targets relating to<br />
total shareholder return (TSR) (50% of the award) and to a financial<br />
measure (ROCE) (50% of the award), over a fixed three-year period.<br />
No retesting of the performance conditions is allowed.<br />
The part of the share award that is subject to the TSR performance<br />
condition is determined to the extent that the company’s TSR<br />
performance reaches certain hurdles relative to the TSR of<br />
an agreed peer group over the same three-year performance<br />
period. During 2010, the Remuneration Committee assessed the<br />
appropriateness of the peer group and changed the peer group to<br />
be more representative of the mining sector of companies.<br />
The entire award will vest should TSR/ROCE performance be in<br />
the upper quartile as measured against peer group, while 30%<br />
will vest should TSR/ROCE performance be at the median of<br />
peer group performances. There will be linear vesting for a TSR/<br />
ROCE performance between the median and the upper quartile of<br />
the peer group performances. No vesting will occur if TSR/ROCE<br />
performance is below the median.<br />
Upon vesting the participant will be entitled to shares in <strong>Kumba</strong> to<br />
the value of the vested portion of the conditional award. Such portion<br />
of the conditional awards which does not vest at the end of the<br />
three-year period will lapse.<br />
Executive directors’ remuneration<br />
Executive directors’ remuneration for the year was as follows:<br />
Rand ’000<br />
Basic<br />
salary<br />
Short-term<br />
incentive 1<br />
Retirement<br />
funding and<br />
medical aid<br />
Other<br />
benefits 2<br />
Total<br />
2011<br />
Total<br />
2010<br />
CI Griffith 3 4,269 2,044 543 864 7,720 6,495<br />
VP Uren 3 3,504 1,618 446 661 6,229 5,255<br />
Total 7,773 3,662 989 1,525 13,949 11,750<br />
1<br />
Short-term incentives awarded, based on the group results for the 2011 financial year and including offshore bonuses accrued to Mr CI Griffith of ZAR121,122<br />
(EUR12,214) (six months) and Mr VP Uren of ZAR159,444 (USD21,641) by KITSA.<br />
2<br />
Includes the encashment of leave accrued by Mr CI Griffith of R139,758, and fringe benefit for use of a company car by Mr CI Griffith of R684,188 (2010 and 2011) and<br />
Mr VP Uren of R651,381(2010 and 2011) and reimbursed expense of R6,821 paid to Mr VP Uren.<br />
3<br />
Included in basic salary above is salary paid to Mr CI Griffith and Mr VP Uren by KITSA in respect of services rendered to that company in 2011.<br />
22 <strong>Kumba</strong> <strong>Iron</strong> <strong>Ore</strong> Limited
Executive directors’ short-term incentives<br />
The table below sets out the short-term incentives paid during 2011.<br />
The short-term incentives awarded are based on performance in<br />
the 2010 financial year and calculated as a percentage of basic<br />
employment cost approved for the pay cycle.<br />
Rand ’000<br />
2010<br />
Total fixed<br />
remuneration<br />
2010<br />
BEC<br />
used for<br />
calculating<br />
incentive<br />
2011<br />
Annual<br />
incentive<br />
paid<br />
CI Griffith 4,195 3,953 2,044<br />
VP Uren 3,527 3,197 1,618<br />
Executive directors’ service contracts<br />
Annual<br />
incentive as<br />
a percentage<br />
of 2010<br />
total fixed<br />
remuneration<br />
49%<br />
(52% of BEC)<br />
46%<br />
(51% of BEC)<br />
Executive directors are not employed on fixed-term contracts and<br />
have standard employment service agreements with notice periods<br />
of up to 12 months. No restraint of trade provisions apply and no<br />
restraint payments have been made during the year. There are no<br />
changes to control provisions or any provisions relating to payment<br />
on termination of employment.<br />
Mr VP Uren stepped down from his role as chief financial officer<br />
on 31 December 2011. He continues to be employed by <strong>Kumba</strong><br />
in 2012 and will work exclusively on the legal issues until<br />
30 June 2012.<br />
<br />
1 June 2012. The recruitment process was conducted by an<br />
extended nominations group and the appointment was made by the<br />
<strong>Kumba</strong> board.<br />
Employment<br />
date*<br />
Date first<br />
appointed<br />
to the board<br />
CI Griffith 1 July 2009 1 July 2009<br />
VP Uren 7 April 2006 7 April 2006<br />
* In terms of the board charter, the termination of an employment contract of an<br />
executive director will result ipso facto in the termination of his membership of<br />
the board, unless the board determines otherwise.<br />
Non-executive directors’ fees<br />
The Remco recommends fees payable to the non-executive directors<br />
for approval by the shareholders. Additional remuneration was paid<br />
retrospectively on a once-off basis in respect of additional board<br />
meetings held in 2010 in which various legal issues were discussed.<br />
The annual fees payable to non-executive directors for the period<br />
commencing 1 January 2011 were approved by the shareholders<br />
at the AGM in May 2011. Fees are approved for an annual period<br />
commencing on 1 January each year. The proposed fees for nonexecutive<br />
directors for 2012, as noted in the following table, will<br />
be submitted to the shareholders for approval at the next AGM in<br />
May 2012.<br />
The proposed fees were determined following a benchmarking<br />
exercise using market data, including a survey of the top 40<br />
companies listed on the JSE, which indicated a need for an<br />
adjustment to bring the fees in line with the market. The board also<br />
considered the increased scope of responsibilities for its committees,<br />
taking into account specifically, the fact that both the Remco and<br />
Safety, Sustainable Development, Social and Ethics Committees have<br />
additional roles as nominations, and social and ethics committees,<br />
thereby increasing the workload on the members of the respective<br />
committees. The board is of the view that the fee increase proposal<br />
is in line with the market and is appropriate.<br />
Board meeting fees are set annually and are informed by a market<br />
benchmark study conducted by an independent external service<br />
provider. These fees are not dependent upon attendance of meetings.<br />
No other supplementary fees are payable. Non-executive directors do<br />
not participate in any of the company’s incentive schemes.<br />
Non-executive directors’ fees approved for 2011 were as follows:<br />
Rand 2011 2012<br />
Chairman 1,100,000 1,116,000<br />
Director 177,375 188,000<br />
Audit Committee chairman 197,800 251,000<br />
Audit Committee member 117,175 124,800<br />
Risk Committee chairman 158,025 167,000<br />
Risk Committee member 78,475 83,500<br />
Safety, Sustainable Development,<br />
Social and Ethics Committee* chairman 158,025 251,000<br />
Safety, Sustainable Development,<br />
Social and Ethics Committee* member 78,475 124,800<br />
Human Resources, Remuneration and<br />
Nomination Committee chairman 158,025 251,000<br />
Human Resources, Remuneration and<br />
Nomination Committee member 78,475 124,800<br />
* Previously the Safety and Sustainable Development Committee<br />
Non-executive directors are subject to retirement by rotation and<br />
re-election by shareholders in accordance with the terms of the<br />
articles of association of the company.<br />
Executive Committee members’<br />
remuneration<br />
The fixed remuneration of members of the Executive Committee,<br />
other than executive directors, was reviewed by the Remco at its<br />
meeting held in November 2011. The fixed salaries were compared<br />
with the median pay levels of other South African mining companies,<br />
based on the scope and nature of each individual’s role and his or<br />
her performance and experience.<br />
The Remco at its meeting held in November 2011 approved the<br />
appointment of each Executive Committee member as a prescribed<br />
officer. The remuneration of each prescribing officer (excluding<br />
executive directors) is disclosed in the following table.<br />
As is the case with the executive directors, the members of the<br />
group Executive Committee participate in the BSP.<br />
Audited annual financial statements<br />
Annual Financial Statements 2011<br />
23
REMUNERATION REPORT<br />
FOR THE YEAR ENDED 31 DECEMBER 2011<br />
2011 emoluments<br />
The table below provides an analysis of the emoluments paid to executive and non-executive directors, as well as prescribed officers. The table<br />
also provides an analysis of the emoluments paid to executive and non-executive directors, as well as the top-earning managers of the company<br />
in 2011. The 2010 total emoluments have not been restated to include the fair value of long-term incentives awarded during that year.<br />
Names (ZAR 000)<br />
Base Benefits<br />
(retirement<br />
and medical<br />
aid)<br />
Benefits<br />
(retirement<br />
and medical<br />
aid)<br />
Incentives<br />
based<br />
on 2010<br />
performance<br />
paid in 2011<br />
Directors’<br />
fees<br />
Additional<br />
Directors’<br />
fees 8<br />
Committee<br />
fees<br />
Fair value of<br />
long-term<br />
incentive<br />
awards 7<br />
Total emoluments<br />
2011 2010<br />
Executive directors 25,394 11,750<br />
CI Griffith 4,269 543 2,044 7,073 13,929 6,495<br />
VP Uren 3,504 446 1,618 5,897 11,465 5,255<br />
Non-executive directors 3,918 3,416<br />
ZBM Bassa 1,2 177 75 356 608 496<br />
GS Gouws 1.2 177 90 79 346 165<br />
GG Gomwe 2,5 177 60 79 316 124<br />
DD Mokgatle 1,2,4 177 105 353 635 491<br />
DM Weston 6 177 75 – 252 165<br />
AJ Morgan 1,2,3,4 1,100 105 – 1,205 564<br />
PB Matlare 1,3,4 177 75 157 409 311<br />
LM Nyhonyha 1,2<br />
(appointed 14 June 2011) 89 – 58 147<br />
PL Zim – – – – – 1,100<br />
Prescribed officers<br />
(including top three earners) 44,246 27,680<br />
M Schottler 11 2,161 250 1,006 1,988 5,405<br />
RJ Botha 11 2,129 243 920 1,852 5,144<br />
C Van Loggerenberg 10 2,037 237 873 2,343 5,490<br />
FM Louw 10 2,007 234 879 2,337 5,457<br />
AC Loots 10 1,994 233 888 1,774 4,889<br />
SV Tyobeka 10 1,751 207 742 1,502 4,202<br />
A Van Den Brink 10 1,724 204 748 1,505 4,181<br />
9,10 1,520 183 – – 1,703<br />
10 1,487 160 682 1,360 3,689<br />
VF Malie 10 1,425 167 567 1,167 3,326<br />
Y Mfolo 10<br />
(appointed 1 August 2011) 678 82 – – 760<br />
Total 26,686 3,189 10,967 2,251 585 1,082 28,798 73,558 42,846<br />
Base salary includes cash and travel allowance<br />
Benefits include <strong>Kumba</strong> Retirement Fund and medical contributions<br />
1 Audit Committee member<br />
2 Risk Committee member<br />
3 Human Resources, Remuneration and Nomination Committee member<br />
4 Safety, Sustainable Development, Social and Ethics Committee member<br />
5 Directors’ fees ceded to Anglo Operations Limited (AOL), a wholly owned subsidiary of Anglo American plc.<br />
6 Directors’ fees ceded to Anglo American Services (UK) Limited, a wholly owned subsidiary of Anglo American plc.<br />
7 This relates to the fair value of grants made during the year in terms of the BSP and the LTIP share schemes. The LTIP is subject to stringent performance conditions.<br />
The LTIP awards to the extent of achievement of the performance conditions will vest in 2014. Bonus shares are included at 100% of face value and the LTIP awards<br />
(only for CEO and CFO) at 83.6% of face value, at a volume-weighted average share price of R502.36 as at 31 December 2011.<br />
8 Additional Directors’ board meeting fees paid in 2011 in respect of once-off additional board meetings held in 2010.<br />
9 Mr LLA Mgadzah was appointed 1 January 2011.<br />
10 Executive Committee member<br />
11 Mr M Schottler is employed in the position Legal Counsel Litigation and Mr RJ Botha is the Head of Legal.<br />
24 <strong>Kumba</strong> <strong>Iron</strong> <strong>Ore</strong> Limited
Long-term incentive schemes: interests of executive directors and the Executive Committee<br />
The interests of the executive directors and of the Executive Committee in shares of the company granted in terms of the various long-term<br />
incentive schemes are shown in the tables below.<br />
No variations have been made to the terms and conditions of the schemes during the year, including to the performance conditions to which the<br />
granting and vesting of the options, rights and conditional awards are subject.<br />
BONUS SHARE PLAN<br />
Balance at<br />
beginning<br />
of year<br />
Conditional<br />
awards<br />
granted<br />
Shares<br />
vested<br />
Balance<br />
at end<br />
of year<br />
Weighted<br />
average<br />
exercise<br />
price<br />
Rand<br />
Share-based payment<br />
expense<br />
2011<br />
Rand ’000<br />
2010<br />
Rand ’000<br />
Number of shares<br />
Vesting date<br />
Executive directors<br />
CI Griffith 15,007 6,025 – 21,032 – 2,028 1,084<br />
7,328 7,328 31 May 2012<br />
7,679 7,679 1 March 2013<br />
– 6,025 2 March 2014<br />
VP Uren 15,731 4,778 – 20,509 – – 1,843 1,080<br />
9,528 9,528 31 May 2012<br />
6,203 6,203 1 March 2013<br />
– 4,778 2 March 2014<br />
Total 30,738 10,803 – 41,541 – 3,871 2,164<br />
Executive<br />
Committee members 73,105* 38,114 (11,610) 1 99,609 – 11,931 6,248<br />
1<br />
A total of 11,610 share awards vested during the year 1 January 2011 to 31 December 2011 on which a gain of R1,013,032 was realised.<br />
LONG-TERM INCENTIVE PLAN<br />
Balance at<br />
beginning<br />
of year<br />
Conditional<br />
awards<br />
granted<br />
Shares<br />
vested<br />
Balance<br />
at end<br />
of year<br />
Weighted<br />
average<br />
exercise<br />
price<br />
Rand<br />
Share-based payment<br />
expense<br />
2011<br />
Rand ’000<br />
2010<br />
Rand ’000<br />
Number of shares<br />
Vesting date<br />
Executive directors<br />
CI Griffith 37,508 9,634 (7,548) 39,594 – 2,556 2,185<br />
7,548 18,586 1 April 2012<br />
18,586 11,374 2 March 2013<br />
11,374 9,634 1 March 2014<br />
VP Uren 31,286 8,326 (5,240) 34,372 – – 2,164 1,788<br />
5,240 16,858 1 April 2012<br />
16,858 9,188 2 March 2013<br />
9,188 8,326 1 March 2014<br />
Audited annual financial statements<br />
Total 68,794 17,960 (12,788) 73,966 – 4,720 3,973<br />
Executive<br />
Committee members 2,546* – (2,546) 1 – – – 1,592<br />
1<br />
A total of 15,334 conditional share awards vested during the year 1 January 2011 to 31 December 2011 on which a gain of R12,383,139 was realised.<br />
Annual Financial Statements 2011<br />
25
REMUNERATION REPORT<br />
FOR THE YEAR ENDED 31 DECEMBER 2011<br />
SHARE APPRECIATION RIGHTS SCHEME<br />
Balance at<br />
beginning<br />
of year<br />
Rights<br />
exercised<br />
Balance<br />
at end<br />
of year<br />
Weighted<br />
average<br />
exercise<br />
price<br />
Rand<br />
Share-based payment<br />
expense<br />
2011<br />
Rand ’000<br />
2010<br />
Rand ’000<br />
Number of rights<br />
Executive directors<br />
CI Griffith 7,540 – 7,540 259.87 38 243<br />
VP Uren 11,154 (11,154) 1 – 235.99 26 169<br />
4,990 –<br />
540 –<br />
5,624 –<br />
Total 18,694 (11,154) 7,540 233.14 64 412<br />
Executive<br />
Committee members 14,676* (12,496) 1 2,180 328.74 – 890<br />
1<br />
A total of 23,650 share appreciation rights with a weighted average exercise price of R284.15 were exercised during the year 1 January 2011 to 31 December 2011 on<br />
which a gain of R4,763,053 was realised (equal to 12,496 <strong>Kumba</strong> shares on date of vesting).<br />
* The differences in the balances at the beginning and at the end of the year to what was previously disclosed for Bonus Share Plan, Long-term Incentive Plan and Share<br />
Appreciation Rights Scheme are due to changes in the composition of the Executive Committee.<br />
Anglo American plc: Group long-term incentive schemes<br />
CI Griffith retained awards granted while he was a participant in certain Anglo American plc Group long-term incentive schemes. CI Griffith no<br />
longer receives awards under these schemes.<br />
As at 31 December 2011 the following awards in terms of the Anglo Platinum long-term incentives schemes were held by CI Griffith:<br />
Balance at beginning<br />
and end of year<br />
Number<br />
Weighted average<br />
exercise price<br />
Rand<br />
Anglo Platinum Executive Share Appreciation Scheme 8 211.05<br />
Anglo Platinum Executive Share Option Scheme 2,987 634.53<br />
DIRECTORS’ BENEFICIAL INTEREST IN KUMBA<br />
The aggregate beneficial interest in <strong>Kumba</strong> at 31 December 2011 of the directors of the company and their immediate families (none of<br />
which has a holding greater than 1%) in the issued shares of the company are detailed below. There have been no material changes in these<br />
shareholdings since 31 December 2011 and the date of approval of the annual financial statements.<br />
Number<br />
of shares 1<br />
2011 2010<br />
Long-term<br />
incentive<br />
scheme<br />
shares 1<br />
Total<br />
beneficial<br />
interest<br />
Number<br />
of shares 1<br />
Long-term<br />
incentive<br />
scheme<br />
shares 1<br />
Total<br />
beneficial<br />
interest<br />
Executive directors<br />
CI Griffith 330 68,166 68,496 330 60,055 60,385<br />
VP Uren 1,000 54,881 55,881 11,200 58,819 70,019<br />
Total 1,330 123,047 124,377 11,530 118,874 130,404<br />
1<br />
Granted under the Bonus Share Plan, Long-term Incentive Plan and Share Appreciation Rights Scheme as disclosed in the tables above.<br />
26 <strong>Kumba</strong> <strong>Iron</strong> <strong>Ore</strong> Limited
PRINCIPAL ACCOUNTING POLICIES<br />
FOR THE YEAR ENDED 31 DECEMBER 2011<br />
PRINCIPAL ACCOUNTING<br />
POLICIES<br />
1. GENERAL INFORMATION<br />
<strong>Kumba</strong> is the holding company of the <strong>Kumba</strong> Group. <strong>Kumba</strong> is a<br />
mining group of companies focusing on the exploration, extraction,<br />
beneficiation, marketing, sale and shipping of iron ore. <strong>Kumba</strong><br />
produces iron ore at Sishen and Kolomela mines in the Northern<br />
<br />
<strong>Kumba</strong> is a public company which is listed on the JSE Limited and is<br />
incorporated and domiciled in the Republic of South Africa.<br />
2. BASIS OF PREPARATION<br />
2.1 Accounting framework<br />
The consolidated financial statements are prepared in accordance<br />
with International Financial Reporting Standards (IFRS) and<br />
International Financial Reporting Interpretation Committee (IFRIC)<br />
interpretations of those Standards, the South African Companies<br />
Act No 71 of 2008, as amended, the Listings Requirements of the<br />
JSE Limited, and the AC 500 standards as issued by the Accounting<br />
Practices Board (APB).<br />
The financial statements have been prepared in accordance with the<br />
historical cost convention except for certain financial instruments,<br />
biological assets and share-based payments which are measured<br />
at fair value. The consolidated financial statements are prepared on<br />
the basis that the group will continue to be a going concern. These<br />
accounting policies are consistently applied throughout the group.<br />
The following principal accounting policies and methods of<br />
computation were applied by the company and the group in the<br />
preparation of the consolidated and stand-alone financial statements<br />
for the financial year ended 31 December 2011. Except as disclosed<br />
below, these accounting policies are consistent in all material<br />
respects with those applied for the year ended 31 December 2010.<br />
2.2 Statement of compliance<br />
2.2.1 ADOPTION OF AMENDMENTS TO EXISTING<br />
ACCOUNTING STANDARDS<br />
The following amendments and revisions to issued accounting<br />
standards which are relevant to the group were adopted and are<br />
effective from 1 January 2011:<br />
IAS 24, Related party disclosures (amendment)<br />
This amendment simplifies the definition of a related party, clarifying<br />
its intended meaning and eliminating inconsistencies from the<br />
definition and provides a partial exemption from the disclosure<br />
requirements for government-related entities. This amendment did<br />
not have a significant impact on the reported results for the year<br />
ended 31 December 2011.<br />
Annual Improvements Project 2010<br />
The group adopted the amendments to various issued accounting<br />
standards issued by the International Accounting Standards Board<br />
(IASB) as part of its Annual Improvements Project 2010 that are<br />
effective for reporting periods that commenced on 1 January 2011.<br />
These amendments did not have an effect on the reported results or<br />
the group accounting policies.<br />
Other<br />
A number of other amendments to accounting interpretations issued<br />
by the IASB were applicable for annual periods beginning on or after<br />
1 January 2011 and have consequently been adopted. They have<br />
not had a material impact on the accounting policies, methods of<br />
computation or presentation applied by the group.<br />
2.2.2 NEW ACCOUNTING STANDARDS AND<br />
INTERPRETATIONS NOT YET ADOPTED<br />
At balance sheet date, the following new standards, revisions and<br />
amendments to issued accounting standards and interpretations,<br />
which are relevant to the group but not yet effective, have not been<br />
adopted by the group:<br />
IFRS 9, Financial Instruments: Classification and Measurement<br />
IFRS 9 is the first step in the process to replace IAS 39, ‘Financial<br />
Instruments: Recognition and Measurement’. IFRS 9 introduces new<br />
requirements for classifying and measuring financial assets, financial<br />
liabilities, derecognition and hedge accounting. The standard is not<br />
applicable until 1 January 2013 but is available for early adoption.<br />
IFRS 9 requires all recognised financial assets that are within the<br />
scope of IAS 39 to be subsequently measured at amortised cost<br />
or fair value. With regards to financial liabilities, the accounting for<br />
changes in the fair value of a financial liability that is designated as<br />
at fair value through profit or loss and are attributable to changes<br />
in the credit risk of that liability are recognised in comprehensive<br />
income, unless it creates or enlarges an accounting mismatch in<br />
profit or loss.<br />
It is anticipated that IFRS 9 will be adopted in the group’s<br />
consolidated financial statements for the annual period beginning<br />
1 January 2013. It is not anticipated that the application of the<br />
new standard will have a significant impact on amounts reported<br />
in respect of the group’s financial assets and financial liabilities as<br />
the majority of financial assets and financial liabilities are carried at<br />
amortised cost as disclosed in note 29. However, it is not practicable<br />
to provide a reasonable estimate of that effect until a detailed review<br />
has been completed.<br />
IFRS 10, Consolidated financial statements<br />
This standard builds on existing principles by identifying the concept<br />
of control as the determining factor in whether an entity should be<br />
included within the consolidated financial statements. The standard<br />
provides additional guidance to assist in determining control where<br />
this is difficult to assess. The standard is effective for annual periods<br />
beginning on or after 1 January 2013.<br />
Audited annual financial statements<br />
Annual Financial Statements 2011<br />
27
PRINCIPAL ACCOUNTING POLICIES<br />
FOR THE YEAR ENDED 31 DECEMBER 2011<br />
The group is currently in the process of evaluating the detailed<br />
requirements of this new standard in order to assess whether this<br />
new standard potentially impacts on the entities that the group<br />
consolidates as its subsidiaries.<br />
IFRS 11, Joint arrangements<br />
This standard provides for a more realistic reflection of joint<br />
arrangements by focusing on the rights and obligations of the<br />
arrangement, rather than its legal form. There are two types of<br />
joint arrangements: joint operations and joint ventures. Proportional<br />
consolidation of joint ventures will no longer be allowed. The<br />
standard is effective for annual periods beginning on or after<br />
1 January 2013.<br />
The group is currently in the process of evaluating the detailed<br />
requirements of this new standard in order to assess the possible<br />
impact on the group’s financial statements.<br />
IFRS 12, Disclosures of interests in other entities<br />
This standard includes the disclosure requirements for all forms of<br />
interests in other entities, including joint arrangements, associates,<br />
special purpose vehicles and other off-balance sheet vehicles. The<br />
standard is effective for annual periods beginning on or after<br />
1 January 2013.<br />
The group is currently in the process of evaluating the detailed<br />
requirements of this new standard in order to assess the possible<br />
impact on the group’s financial statements.<br />
IFRS 13, Fair value measurement<br />
This standard aims to improve consistency and reduce complexity<br />
by providing a precise definition of fair value and a single source<br />
of fair value measurement and disclosure requirements for use<br />
across IFRSs. The requirements do not extend the use of fair value<br />
accounting but provide guidance on how it should be applied where<br />
its use is already required or permitted by other standards within<br />
IFRS. The standard is effective for annual periods beginning on or<br />
after 1 January 2013.<br />
The group is currently in the process of evaluating the detailed<br />
requirements of this new standard in order to assess the possible<br />
impact on the group’s financial statements.<br />
IFRIC 20, Stripping costs in the production phase of a<br />
surface mine<br />
In surface mining operations, entities may find it necessary to<br />
remove mine waste materials (overburden) to gain access to mineral<br />
ore deposits. This waste removal activity is known as stripping.<br />
The interpretation clarifies there can be benefits accruing to an<br />
entity from stripping activity: usable ore that can be used to produce<br />
inventory and improved access to further quantities of material that<br />
will be mined in future periods. The interpretation considers when<br />
and how to account separately for these benefits arising from the<br />
stripping activity, as well as how to measure these benefits both<br />
initially and subsequently. The standard is effective for annual<br />
periods beginning on or after 1 January 2013.<br />
The group is currently in the process of evaluating the detailed<br />
requirements of this new interpretation in order to assess the<br />
possible impact on the group’s financial statements. It is anticipated<br />
that the application of the interpretation will not have a significant<br />
impact on the group’s operations as the interpretation is in line with<br />
the group’s current accounting policy on waste stripping cost.<br />
Amendment to IFRS 7, ‘Financial Instruments: Disclosures’<br />
The amendments to IFRS 7 increase the disclosure requirements<br />
for transactions involving transfers of financial assets. These<br />
amendments are intended to provide greater transparency around<br />
risk exposures when a financial asset is transferred but the<br />
transferor retains some level of continuing exposure in the asset.<br />
The amendments also require disclosures where transfers of<br />
financial assets are not evenly distributed throughout the period. The<br />
amendment is effective for periods beginning on or after 1 July 2011.<br />
It is not anticipated that this amendment will have a significant effect<br />
on the group’s disclosures.<br />
Amendment to IAS 12, ‘Income Taxes’ on Deferred Tax<br />
The amendment introduces an exception to the existing principle<br />
for the measurement of deferred tax assets or liabilities arising<br />
on investment property measured at fair value. As a result of the<br />
amendments, SIC 21, ‘Income Taxes – Recovery of Revalued<br />
Non-depreciable Assets’, would no longer apply to investment<br />
properties carried at fair value. The amendments also incorporate<br />
into IAS 12 the remaining guidance previously contained in SIC 21,<br />
which is accordingly withdrawn. The amendment is effective<br />
for periods beginning on or after 1 January 2012.<br />
It is not expected that this amendment will have any impact on<br />
the group’s financial statements as the group does not have any<br />
investment properties at present.<br />
Other<br />
A number of other amendments to accounting standards and<br />
interpretations issued by the IASB are effective for annual periods<br />
beginning on or after 1 January 2012. They are not expected to<br />
have an impact on the accounting policies, methods of computation<br />
or presentation applied by the group.<br />
2.3 Foreign currencies<br />
Items included in the financial results of each group entity are<br />
measured using the functional currency of that entity. The functional<br />
currency of an entity is the currency of the primary economic<br />
environment in which the entity operates. The consolidated financial<br />
results are presented in rand, which is <strong>Kumba</strong>’s functional and the<br />
group’s presentation currency.<br />
FOREIGN CURRENCY TRANSACTIONS<br />
Transactions are translated into the functional currency of an entity<br />
at the rate of exchange ruling at the transaction date.<br />
Monetary assets and liabilities that are denominated in foreign<br />
currencies are translated into the functional currency of an entity at<br />
the rate of exchange ruling at the balance sheet date.<br />
Foreign exchange gains and losses arising on translation are<br />
recognised in the income statement, except where they relate to<br />
cash flow hedging activities in which case they are recognised in the<br />
statement of changes in equity.<br />
FOREIGN OPERATIONS<br />
The financial results of all entities that have a functional currency<br />
different from the presentation currency of their parent entity are<br />
translated into the presentation currency.<br />
All assets and liabilities, including fair value adjustments arising on<br />
acquisitions, are translated at the rate of exchange ruling at the balance<br />
sheet date. Income and expenditure transactions of foreign operations<br />
are translated at the average rate of exchange. Resulting foreign<br />
exchange gains and losses arising on translation are recognised in the<br />
foreign currency translation reserve (FCTR) as a separate component<br />
of equity. Goodwill and fair value adjustments arising on the acquisition<br />
of a foreign entity are treated as assets and/or liabilities of the foreign<br />
entity and translated at the closing rate.<br />
28 <strong>Kumba</strong> <strong>Iron</strong> <strong>Ore</strong> Limited
On disposal of part or all of the investment, the proportionate share of the<br />
related cumulative gains and losses previously recognised in the foreign<br />
currency translation reserve in the statement of changes in equity are<br />
recognised in the income statement on disposal of that investment.<br />
2.4 Segment reporting<br />
Operating segments are reported in a manner consistent with the<br />
internal reporting provided to the chief operating decision-maker.<br />
The chief operating decision-maker, who is responsible for allocating<br />
resources and assessing performance of the operating segments,<br />
has been identified as the <strong>Kumba</strong> Executive Committee.<br />
Management has determined the operating segments of the group<br />
based on the reports reviewed by the Executive Committee that<br />
are used to make strategic decisions. The Executive Committee<br />
considers the business principally according to the nature of the<br />
products and service provided, with the segment representing a<br />
strategic business unit. The reportable operating segments derive<br />
their revenue primarily from mining, extraction, production and selling<br />
of iron ore and shipping operations charged to external clients.<br />
2.5 Post-balance sheet events<br />
Recognised amounts in the financial statements are adjusted to<br />
reflect events arising after the balance sheet date that provide<br />
evidence of conditions that existed at the balance sheet date. Events<br />
after the balance sheet that are indicative of conditions that arose<br />
after the balance sheet date are dealt with by way of a note.<br />
SUBSIDIARIES<br />
Subsidiaries are those entities (including special purpose entities)<br />
over which the group has the power to exercise control. Control<br />
is achieved where the group has the ability, directly or indirectly,<br />
to govern the financial and operating policies of an entity so as to<br />
obtain benefits from its activities.<br />
The financial results of subsidiaries acquired or disposed of during<br />
the year are included in the consolidated income statement from the<br />
effective date of acquisition or up to the effective date of disposal,<br />
as appropriate.<br />
NON-CONTROLLING INTERESTS<br />
The effects of transactions with non-controlling interests are<br />
recorded in equity as transactions with equity owners of the group.<br />
For purchases from non-controlling interests, the difference between<br />
any consideration paid and the relevant share acquired of the<br />
carrying value of net assets of the subsidiary is recorded in equity.<br />
Gains or losses on disposals to non-controlling interests are also<br />
recorded in equity.<br />
When the group ceases to have control or significant influence, any<br />
retained interest in the entity is remeasured to its fair value, with<br />
the change in carrying amount recognised in profit or loss. The fair<br />
value is the initial carrying amount for the purposes of subsequently<br />
accounting for the retained interest as an associate, joint venture<br />
or financial asset. In addition, any amounts previously recognised<br />
in comprehensive income in respect of that entity are accounted<br />
for as if the group had directly disposed of the related assets or<br />
liabilities. This may mean that amounts previously recognised in<br />
comprehensive income are reclassified to profit or loss.<br />
2.6 Comparative figures<br />
Comparative figures are restated in the event of a change in<br />
accounting policy.<br />
3. COMPANY FINANCIAL STATEMENTS<br />
Subsidiaries, associates and joint ventures<br />
Investments in subsidiaries, associates and joint ventures in the<br />
separate financial statements presented by <strong>Kumba</strong> are recognised<br />
at cost less accumulated impairment.<br />
4. CONSOLIDATED FINANCIAL STATEMENTS<br />
4.1 Basis of consolidation<br />
The consolidated financial statements present the financial position<br />
and changes therein, operating results and cash flow information of<br />
the group. The group comprises <strong>Kumba</strong>, its subsidiaries and interests<br />
in joint ventures and associates.<br />
Where necessary, adjustments are made to the results of<br />
subsidiaries, joint ventures and associates to ensure the consistency<br />
of their accounting policies with those used by the group.<br />
Intercompany transactions, balances and unrealised profits and<br />
losses between group companies are eliminated on consolidation.<br />
In respect of joint ventures and associates, unrealised profits and<br />
losses are eliminated to the extent of the group’s interest in these<br />
entities. Unrealised profits and losses arising from transactions with<br />
associates are eliminated against the investment in the associate.<br />
ASSOCIATES<br />
Associates are investments over which the group is in a position to<br />
exercise significant influence, but not control or joint control, through<br />
participation in the financial and operating policy decisions of the<br />
investee. Typically the group owns between 20% and 50% of the<br />
voting equity.<br />
Investments in associates are accounted for using the equity<br />
method of accounting from the date on which significant influence<br />
commences until the date that significant influence ceases, and are<br />
initially recognised at cost.<br />
Under this method the group’s share of post-acquisition profits or<br />
losses of associates is recognised in the income statement as equity<br />
accounted earnings and its share of movements in post-acquisition<br />
equity reserves is recognised in the statement of changes in<br />
equity. All cumulative post-acquisition movements in the equity of<br />
associates are adjusted against the carrying value of the investment.<br />
When the group’s share of losses in associates equals or exceeds<br />
its interest in those associates, the group does not recognise<br />
further losses, unless the group has incurred a legal or constructive<br />
obligation or made payments on behalf of those associates.<br />
If the ownership interest in an associate is reduced but significant<br />
influence is retained, only a proportionate share of the amounts<br />
previously recognised in comprehensive income are reclassified to<br />
profit or loss where appropriate.<br />
Goodwill identified on acquisition relating to associates is included in<br />
the carrying value of those associates.<br />
The total carrying value of associates, including goodwill, is evaluated<br />
annually for impairment or when conditions indicate that a decline<br />
in fair value below the carrying amount is other than temporary. If<br />
impaired, the carrying value of the group’s share of the underlying<br />
net assets of associates is written down to its estimated recoverable<br />
Audited annual financial statements<br />
Annual Financial Statements 2011<br />
29
PRINCIPAL ACCOUNTING POLICIES<br />
FOR THE YEAR ENDED 31 DECEMBER 2011<br />
amount in accordance with the accounting policy on impairment and<br />
recognised in the income statement as part of equity accounted<br />
earnings of those associates.<br />
Results of associates are equity accounted from their most<br />
recent audited annual financial statements or unaudited interim<br />
financial statements.<br />
JOINT VENTURES<br />
A joint venture is an economic entity in which the group holds a<br />
long-term interest and shares joint control over strategic, financial<br />
and operating decisions with one or more other venturers established<br />
under a contractual arrangement. It may involve a corporation,<br />
partnership or other entity in which the group has an interest.<br />
The group’s share of the assets, liabilities, income, expenditure<br />
and cash flows of joint ventures are accounted for using the<br />
proportionate consolidation method. The proportionate share<br />
of the financial results of joint ventures is consolidated into the<br />
consolidated financial statements from date on which joint control<br />
commences until such time as joint control ceases. Proportionate<br />
consolidation combines the group’s share of the financial results<br />
of the joint venture on a line-by-line basis with similar items in the<br />
consolidated financial statements.<br />
BALANCE SHEET<br />
4.2 Property, plant and equipment<br />
Land and assets that are in the process of being constructed,<br />
which include capitalised development and mineral exploration and<br />
evaluation costs, are measured at cost less accumulated impairment<br />
and are not depreciated.<br />
All other classes of property, plant and equipment are stated at cost<br />
less accumulated depreciation and accumulated impairment.<br />
The cost of an item of property, plant and equipment shall be<br />
recognised as an asset if it is probable that future economic benefits<br />
associated with the item will flow to the entity and the cost of the<br />
item can be measured reliably.<br />
The cost of items of property, plant and equipment include all costs<br />
incurred to bring the assets to the location and condition necessary<br />
for their intended use by the group. The cost of self-constructed<br />
assets includes expenditure on materials, direct labour and an<br />
allocated proportion of project overheads.<br />
The cost of property, plant and equipment may also include:<br />
<br />
rehabilitation costs to the extent that they relate to the asset;<br />
<br />
that asset;<br />
<br />
<br />
The cost of items of property, plant and equipment is capitalised into<br />
its various components where the useful life of the components differ<br />
from the main item of property, plant and equipment to which the<br />
component can be logically assigned. Expenditure incurred to replace<br />
or modify a significant component of property, plant and equipment<br />
is capitalised and any remaining carrying value of the component<br />
replaced is written off as an expense in the income statement.<br />
Subsequent expenditure on property, plant and equipment is<br />
capitalised only when the expenditure enhances the value or output of<br />
the asset beyond original expectations and it can be measured reliably.<br />
Costs incurred on repairing and maintaining assets are recognised in<br />
the income statement in the period in which they are incurred.<br />
Gains and losses on the disposal of property, plant and equipment, which<br />
are represented by the proceeds on disposal of such assets less their<br />
carrying values at that date, are recognised in the income statement.<br />
DEPRECIATION<br />
Depreciation is charged on a systematic basis over the estimated useful<br />
lives of the assets after taking into account the estimated residual value<br />
of the assets. Depreciation commences on self-constructed assets<br />
when they are ready for their intended use by the group. The useful life<br />
of an asset is the period of time over which the asset is expected to be<br />
used (straight-line method of depreciation). The estimated useful lives<br />
of assets and their residual values are reassessed annually, with any<br />
changes in such accounting estimates being adjusted in the year of<br />
reassessment and applied prospectively.<br />
The estimated useful lives of items of property, plant and<br />
equipment are:<br />
Mineral properties<br />
10 – 23 years<br />
Residential buildings<br />
5 – 23 years<br />
Buildings and infrastructure<br />
5 – 23 years<br />
Mobile equipment, built-in process<br />
computers and reconditionable spares<br />
2 – 23 years<br />
Fixed plant and equipment<br />
4 – 23 years<br />
Loose tools and computer equipment<br />
5 years<br />
Mineral exploration, site preparation and development 5 – 23 years<br />
RESEARCH, DEVELOPMENT, MINERAL<br />
EXPLORATION AND EVALUATION COSTS<br />
Research, development, mineral exploration and evaluation costs are<br />
expensed in the year in which they are incurred until they result in<br />
projects that the group:<br />
<br />
<br />
<br />
Once these criteria are met, all directly attributable development<br />
costs and ongoing mineral exploration and evaluation costs are<br />
capitalised within property, plant and equipment. Capitalisation of<br />
pre-production expenditure ceases when the mining property is<br />
capable of commercial production.<br />
During the development of a mine, before production commences,<br />
stripping expenses are capitalised as part of the investment in<br />
construction of the mine.<br />
Capitalised pre-production expenditure prior to commercial<br />
production is assessed for impairment in accordance with the group<br />
accounting policy stated below.<br />
WASTE STRIPPING EXPENSES<br />
The removal of overburden or waste is required to obtain access to<br />
the ore body. To the extent that the actual stripping ratio is higher<br />
than the average LOM stripping ratio in the early years of a mine’s<br />
production phase, the mining costs associated with this process<br />
are deferred and charged to operating costs using the expected<br />
average stripping ratio over the average life of the area being<br />
mined. The effect of this will therefore be that the cost of stripping<br />
in profit or loss will be reflective of the average stripping rates for<br />
the ore body as a whole. This reflects the fact that waste removal<br />
is necessary to gain access to the ore body and therefore realise<br />
future economic benefit.<br />
30 <strong>Kumba</strong> <strong>Iron</strong> <strong>Ore</strong> Limited
The average LOM stripping ratio is calculated as the number of tonnes<br />
of waste material expected to be removed during the LOM, per tonne<br />
of ore mined. The average LOM cost per tonne is calculated as the<br />
total expected mining costs to be incurred to mine the ore body<br />
divided by the number of tonnes expected to be mined. Where the<br />
pit profile is such that the actual stripping ratio is below the average<br />
LOM stripping ratio in the early years no deferral takes place as this<br />
would result in recognition of a liability for which there is no obligation.<br />
Instead this position is monitored and when the cumulative calculation<br />
reflects a debit balance deferral commences.<br />
4.3 Business combinations and goodwill<br />
BUSINESS COMBINATIONS<br />
The purchase method of accounting is used when a business is acquired.<br />
On acquisition date, fair values are attributed to the identifiable<br />
assets, liabilities and contingent liabilities. The non-controlling<br />
interest at acquisition date is determined as the non-controlling<br />
shareholders’ proportionate share of the fair value of the net assets<br />
of subsidiaries acquired.<br />
The cost of acquisition is measured as the fair value of the group’s<br />
contribution to the business combination in the form of assets<br />
transferred, shares issued or liabilities assumed at the acquisition<br />
date plus all costs directly attributable to the acquisition.<br />
Fair values of the identifiable assets and liabilities are determined by<br />
reference to market values of those or similar items at the acquisition<br />
date, irrespective of the extent of any non-controlling interests, where<br />
these values are available. Alternatively, these values are determined<br />
by discounting expected future cash flows to present values.<br />
GOODWILL<br />
Goodwill is measured at cost less accumulated impairment, if any.<br />
Goodwill represents the excess of the cost of an acquisition over the<br />
fair value of the group’s share of the identifiable net assets of the<br />
acquired entity at the date of acquisition.<br />
Goodwill is assessed for impairment on an annual basis. Once any<br />
impairment has occurred on a specific goodwill item, the impairment<br />
losses will not be reversed in future periods.<br />
Negative goodwill arises when the cost of acquisition is less that the<br />
fair value of the net identifiable assets and contingent liabilities of<br />
the entity acquired. Negative goodwill is recognised directly in the<br />
income statement.<br />
The gain or loss on disposal of an entity includes the balance of<br />
goodwill relating to the entity sold.<br />
Goodwill is allocated to cash-generating units for the purpose of<br />
impairment testing. The allocation is made to those cash-generating<br />
units or groups of cash-generating units that are expected to benefit<br />
from the business combination from which the goodwill arose<br />
identified according to operating segment.<br />
4.4 Impairment of non-financial assets<br />
The group’s non-financial assets, other than inventories and deferred<br />
tax, are reviewed to determine whether there is any indication<br />
that those assets are impaired whenever events or changes in<br />
circumstances indicate that the carrying value may not be recoverable.<br />
If any such indication exists, the recoverable amount of the asset<br />
is estimated in order to determine the extent of the impairment.<br />
Recoverable amounts are estimated for individual assets. Where an<br />
individual asset cannot generate cash inflows independently, the<br />
assets are grouped at the lowest level for which there are separately<br />
identifiable cash flows (cash-generating units). The recoverable<br />
amount is determined for the cash-generating unit to which the<br />
asset belongs.<br />
The impairment loss recognised in the income statement is<br />
the excess of the carrying value over the recoverable amount.<br />
Recoverable amount is the higher of fair value less costs to sell and<br />
value in use.<br />
In assessing value in use, the estimated future cash flows are<br />
discounted to their present value using a pre-tax discount rate.<br />
The discount rate reflects the current market assessments of the<br />
time value of money and the risks specific to the asset for which<br />
estimates of future cash flows have not been adjusted. If the<br />
recoverable amount of an asset or cash-generating unit is estimated<br />
to be less than its carrying amount, the carrying amount of the asset<br />
or cash-generating unit is reduced to its recoverable amount and an<br />
impairment loss is recognised in the income statement.<br />
A previously recognised impairment will be reversed insofar as<br />
estimates change as a result of an event occurring after the<br />
impairment was recognised. An impairment is reversed only to the<br />
extent that the asset or cash-generating unit’s carrying amount does<br />
not exceed the carrying amount that would have been determined<br />
had no impairment been recognised. A reversal of an impairment is<br />
recognised in the income statement.<br />
Exploration and evaluation assets are tested for impairment when<br />
development of the property commences or whenever facts and<br />
circumstances indicate impairment. An impairment is recognised<br />
for the amount by which the exploration assets’ carrying amount<br />
exceeds their recoverable amount. For the purpose of assessing<br />
impairment, the relevant exploration and evaluation assets are<br />
included in the existing cash-generating units of producing<br />
properties that are located in the same region.<br />
4.5 Biological assets<br />
Biological assets are measured on initial recognition and at each<br />
balance sheet date at their fair value less estimated costs to sell, with<br />
these fair value adjustments recognised as income and expenditure<br />
in the income statement in the period in which they occur.<br />
Biological assets comprise livestock and game. The fair value of<br />
livestock is determined based on market prices taking into account<br />
<br />
commercially. The fair value of game is the market price for the game,<br />
determined using auction selling prices achieved for live game.<br />
Both livestock and game held for sale are classified as consumable<br />
biological assets.<br />
4.6 Financial instruments<br />
Purchases and sales of financial instruments are recognised on the<br />
trade-date, being the date on which the group becomes party to<br />
the contractual provisions of the relevant instrument. The financial<br />
instruments are initially measured at fair value plus transaction<br />
costs that are directly attributable to the acquisition or issue of the<br />
financial asset or financial liability, with the exception of at fair value<br />
through profit or loss assets which are initially recognised at fair<br />
value, and transaction costs are expensed in the income statement.<br />
The fair values are based on quoted bid prices or amounts derived<br />
using discounted cash flow models. Subsequent to initial recognition,<br />
the instruments are measured as set out on the next page.<br />
Audited annual financial statements<br />
Annual Financial Statements 2011<br />
31
PRINCIPAL ACCOUNTING POLICIES<br />
FOR THE YEAR ENDED 31 DECEMBER 2011<br />
Financial assets (other than derivative<br />
financial instruments)<br />
The group classifies all of its financial assets into the ‘at fair<br />
value through profit or loss’ (FVTPL) and ‘loans and receivables’<br />
categories. This classification is dependent on the purpose for<br />
which the financial asset is acquired. Management determines<br />
the classification of its financial assets at the time of the initial<br />
recognition and re-evaluates such designation annually.<br />
FVTPL financial assets are financial assets that are designated<br />
by the group as at FVTPL on initial recognition. A financial asset<br />
is designated in this category if it is managed and its performance<br />
is evaluated on a fair value basis, in accordance with documented<br />
risk management policies. Assets in this category are included in<br />
non-current assets unless the investment matures or management<br />
intends to dispose of it within 12 months of the end of the<br />
reporting period.<br />
Financial assets at FVTPL are subsequently carried at fair value.<br />
Gains or losses arising from changes in the fair value of this<br />
category are presented in the income statement within ‘finance<br />
gains/(losses)’ in the period in which they arise.<br />
Loans and receivables are non-derivative financial assets with fixed<br />
or determinable payments that are not quoted in an active market.<br />
They are included in current assets, except for maturities greater<br />
than 12 months after the end of the reporting period. These are<br />
classified as non-current assets.<br />
Loans and receivables are subsequently carried at amortised cost<br />
using the effective interest method.<br />
TRADE RECEIVABLES<br />
Trade receivables are amounts due from customers for iron ore sold<br />
or shipping services rendered in the ordinary course of business.<br />
CASH AND CASH EQUIVALENTS<br />
Cash and cash equivalents comprise cash on hand, deposits held on<br />
call, and investments in money market instruments that are readily<br />
convertible to a known amount of cash, all of which are available for<br />
use by the group unless otherwise stated.<br />
IMPAIRMENT<br />
Loans and receivables are assessed at each balance sheet date to<br />
determine whether objective evidence exists that a financial asset is<br />
impaired. A financial asset or a group of financial assets is impaired<br />
and impairment losses are incurred only if there is objective evidence<br />
of impairment as a result of one or more events that occurred after<br />
the initial recognition of the asset and that loss has an impact on<br />
the estimated future cash flows of the financial asset or group of<br />
financial assets that can be reliably estimated.<br />
To the extent that the carrying value of an individual or group<br />
of assets exceeds the present value of estimated future cash<br />
flows (excluding future credit losses that have not been incurred)<br />
discounted at the financial asset’s original effective interest rate<br />
of those assets, an impairment loss is recognised by way of an<br />
allowance account in the income statement.<br />
An impairment is reversed when evidence exists that an impairment<br />
has decreased. The reversal does not result in the carrying amount<br />
of the financial asset exceeding what the amortised cost would<br />
have been had the impairment not been recognised at the date the<br />
impairment is reversed. The amount of the reversal is recognised in<br />
the income statement.<br />
DERECOGNITION: FINANCIAL ASSETS<br />
Financial assets are derecognised when the rights to receive cash<br />
flows from the assets have expired, the right to receive cash flows<br />
has been retained but an obligation to on-pay them in full without<br />
material delay has been assumed or the right to receive cash flows<br />
has been transferred together with substantially all the risks and<br />
rewards of ownership.<br />
Financial liabilities (other than derivative<br />
financial instruments)<br />
A financial liability is a contractual obligation to deliver cash or<br />
another financial asset to another entity or to exchange financial<br />
assets or financial liabilities with another entity under conditions that<br />
are potentially unfavourable to the entity. They are included in current<br />
liabilities, except for maturities greater than 12 months after the<br />
balance sheet date. These are classified as non-current liabilities.<br />
Financial liabilities comprise short-term and long-term interestbearing<br />
borrowings and trade and other payables (excluding income<br />
received in advance).<br />
Financial liabilities are subsequently carried at amortised cost using<br />
the effective interest method. Interest calculated using the effective<br />
interest rate method is recognised in profit or loss.<br />
BORROWINGS<br />
Borrowings comprise short-term and long-term interest-bearing<br />
borrowings. Premiums or discounts arising from the difference<br />
between the fair value of borrowings raised and the amount<br />
repayable at maturity date are recognised in the income statement<br />
as borrowing costs based on the effective interest rate method.<br />
TRADE PAYABLES<br />
Trade payables are obligations to pay for goods or services that have<br />
been acquired in the ordinary course of business from suppliers.<br />
DERECOGNITION: FINANCIAL LIABILITIES<br />
Financial liabilities are derecognised when the associated obligation<br />
has been discharged, cancelled or has expired.<br />
EQUITY INSTRUMENTS<br />
An equity instrument is any contract that evidences a residual<br />
interest in the assets of the group after deducting all of its liabilities,<br />
and includes ordinary share capital.<br />
Equity instruments issued by the group are recorded at the proceeds<br />
received, net of direct issue costs.<br />
DERIVATIVE FINANCIAL INSTRUMENTS<br />
Derivative instruments are categorised as at FVTPL financial<br />
instruments held for trading and are classified as current assets<br />
or liabilities. All derivative instruments are initially recognised at<br />
fair value on the date a derivative contract is entered into and<br />
are subsequently remeasured at fair value at balance sheet date.<br />
Resulting gains or losses on derivative instruments, excluding<br />
designated and effective hedging instruments, are recognised in the<br />
income statement.<br />
32 <strong>Kumba</strong> <strong>Iron</strong> <strong>Ore</strong> Limited
The group’s criteria for a derivative instrument to be designated as a<br />
hedging instrument require that:<br />
<br />
effective in achieving offsetting changes in fair value or cash flows<br />
attributable to the hedged risk;<br />
<br />
throughout the duration of the hedge;<br />
<br />
of the hedge; and<br />
<br />
of the hedge is highly probable.<br />
A derivative instrument is classified as a cash flow hedge<br />
when it is designated and qualifies as hedge of a particular risk<br />
associated with a recognised asset or liability or highly probable<br />
forecasted transaction.<br />
The effective portion of any fair value gain or loss arising on such<br />
a derivative instrument is classified in comprehensive income as a<br />
cash flow hedge accounting reserve until the underlying transaction<br />
occurs. The ineffective part of any gain or loss is recognised<br />
immediately in the income statement within ‘finance gains/(losses)’.<br />
If the forecasted transaction results in the recognition of a nonfinancial<br />
asset or non-financial liability, the associated gain or loss<br />
is transferred from the cash flow hedge accounting reserve and<br />
included in the initial measurement of the cost of the underlying<br />
asset or liability on the transaction date. For hedges that do not<br />
result in the recognition of a non-financial asset or liability, amounts<br />
deferred in equity are recognised in the income statement in the<br />
same period in which the hedged item affects profits or loss.<br />
Hedge accounting is discontinued when the hedging instrument<br />
expires or is sold, terminated, exercised, revoked, or no longer<br />
qualifies for hedge accounting. At that time, any cumulative gain or<br />
loss on the hedging instrument recognised in equity is retained in<br />
equity until the forecast transaction occurs. If a hedge transaction<br />
is no longer expected to occur, the net cumulative gain or loss<br />
previously recognised in equity is included in the income statement<br />
within ‘finance gains/(losses)’ for the period.<br />
OFFSET<br />
Where a legally enforceable right of offset exists for recognised<br />
financial assets and financial liabilities, and there is an intention to<br />
settle the liability and realise the asset simultaneously, or to settle on<br />
a net basis, all related financial effects are offset and the net amount<br />
is reported in the balance sheet.<br />
4.7 Inventories<br />
Inventories, which comprise finished products, work-in-progress,<br />
plant spares and stores, raw material and merchandise, are<br />
measured at the lower of cost, determined on a weighted average<br />
basis, and net realisable value.<br />
The cost of finished goods and work-in-progress comprises raw<br />
materials, direct labour, other direct costs and fixed production<br />
overheads, but excludes finance costs. Fixed production overheads<br />
are allocated on the basis of normal capacity.<br />
Plant spares and consumable stores are capitalised to the balance<br />
sheet and expensed to the income statement as they are utilised.<br />
Net realisable value is the estimated selling price in the ordinary<br />
course of business, less the cost of completion and selling expenses.<br />
Write-downs to net realisable value and inventory losses are<br />
expensed in the income statement in the period in which the writedowns<br />
or losses occur.<br />
4.8 Share capital<br />
Ordinary shares are classified as equity instruments.<br />
Incremental costs directly attributable to the issue of new shares are<br />
shown in equity as a deduction there from, net of tax. Incremental<br />
costs directly attributable to the issue of new shares for the<br />
acquisition of a business are included in the cost of acquisition as<br />
part of the purchase consideration.<br />
4.9 Treasury shares<br />
When the group acquires its own share capital, the amount of the<br />
consideration paid, including directly attributable costs, net of any<br />
related tax benefit, is recognised as a change in equity. Shares<br />
repurchased by the issuing entity are cancelled.<br />
Shares repurchased by group entities are classified as treasury<br />
shares and are held at cost. These shares are treated as a deduction<br />
from the issued and weighted average number of shares, and the<br />
cost price of the shares is presented as a deduction from total<br />
equity. The par value of the shares is presented as a deduction from<br />
ordinary share capital and the remainder of the cost is presented<br />
as a deduction from ordinary share premium. Dividends received on<br />
treasury shares are eliminated on consolidation.<br />
4.10 Dividends payable<br />
Dividends payable and the related taxation thereon are recognised<br />
by the group when the dividend is declared. These dividends are<br />
recorded and disclosed as dividends in the statement of changes<br />
in equity. Secondary Taxation on Companies (STC) in respect of<br />
such dividends is recognised as a liability when the dividends are<br />
recognised as a liability and are included in the taxation charge in<br />
profit or loss.<br />
Dividends proposed or declared subsequent to the balance sheet<br />
date are not recognised, but are disclosed in the notes to the<br />
consolidated financial statements.<br />
4.11 Provisions<br />
Provisions are recognised when the group has a present legal or<br />
constructive obligation as a result of past events, for which it is<br />
probable that an outflow of economic benefits will be required to<br />
settle the obligation, and a reliable estimate can be made of the<br />
amount of the obligation. Provisions are not recognised for future<br />
operating losses.<br />
ENVIRONMENTAL REHABILITATION<br />
Environmental rehabilitation provisions<br />
The provision for environmental rehabilitation is recognised as and<br />
when an obligation to incur rehabilitation and mine closure costs<br />
arises from environmental disturbance caused by the development<br />
or ongoing production of a mining property. Estimated long-term<br />
environmental rehabilitation provisions are measured based on<br />
the group’s environmental policy taking into account current<br />
technological, environmental and regulatory requirements. Any<br />
subsequent changes to the carrying amount of the provision<br />
resulting from changes to the assumptions applied in estimating the<br />
obligation are recognised in the income statement.<br />
Audited annual financial statements<br />
Annual Financial Statements 2011<br />
33
PRINCIPAL ACCOUNTING POLICIES<br />
FOR THE YEAR ENDED 31 DECEMBER 2011<br />
Contributions to rehabilitation trust<br />
Annual contributions are made to a dedicated environmental<br />
rehabilitation trust to fund the estimated cost of rehabilitation during<br />
and at the end of the life of the group’s mines. The group exercises<br />
full control over this trust and therefore the trust is consolidated. The<br />
trust’s assets are recognised separately on the balance sheet as<br />
non-current assets at fair value. Interest earned on funds invested in<br />
the environmental rehabilitation trust is accrued on a time-proportion<br />
basis and recognised as interest income.<br />
Ongoing rehabilitation expenditure<br />
Ongoing rehabilitation expenditure is recognised in the income<br />
statement as incurred.<br />
DECOMMISSIONING PROVISION<br />
The estimated present value of costs relating to the future<br />
decommissioning of plant or other site preparation work, taking<br />
into account current environmental and regulatory requirements, is<br />
capitalised as part of property, plant and equipment, to the extent<br />
that it relates to the construction of an asset, and the related<br />
provisions are raised in the balance sheet, as soon as the obligation<br />
to incur such costs arises.<br />
These estimates are reviewed at least annually and changes in<br />
the measurement of the provision that result from the subsequent<br />
changes in the estimated timing or amount of cash flows, or a<br />
change in discount rate, are added to, or deducted from, the cost of<br />
the related asset in the current period. If a decrease in the liability<br />
exceeds the carrying amount of the asset, the excess is recognised<br />
immediately in the income statement. If the asset value is increased<br />
and there is an indication that the revised carrying value is not<br />
recoverable, an impairment test is performed in accordance with the<br />
accounting policy on ‘Impairment of non-financial assets’ above.<br />
EMPLOYEE BENEFITS CASH-SETTLED<br />
SHARE-BASED PAYMENTS<br />
Refer to the ‘Employee benefits – equity compensation benefits’<br />
accounting policy note below.<br />
4.12 Deferred tax<br />
Deferred tax is recognised using the liability method, on all<br />
temporary differences between the carrying values of assets and<br />
liabilities for accounting purposes and the tax bases of these assets<br />
and liabilities used for tax purposes and on any tax losses. No<br />
deferred tax is provided on temporary differences relating to:<br />
<br />
<br />
asset or liability to the extent that neither accounting nor taxable<br />
profit is affected on acquisition; and<br />
<br />
reverse in the foreseeable future.<br />
Deferred tax liabilities are generally recognised for all taxable<br />
temporary differences and deferred tax assets are recognised to the<br />
extent that it is probable that taxable profits will be available against<br />
which deductible temporary differences can be utilised.<br />
Deferred tax liabilities are recognised for taxable temporary<br />
differences arising from investments in subsidiaries, associates and<br />
joint ventures, except where the group is able to control the reversal<br />
of the temporary difference and it is probable that the temporary<br />
difference will not reverse in the foreseeable future.<br />
When dividends received during the current year can be offset<br />
against future dividend payments to reduce the secondary tax (STC)<br />
liability, a deferred tax asset is recognised to the extent of the future<br />
reduction in STC.<br />
The carrying amount of deferred tax assets is reviewed at each<br />
balance sheet date and is adjusted to the extent that it is no longer<br />
probable that sufficient taxable profit will be available to allow all of<br />
the assets to be recovered.<br />
Deferred tax is calculated at the tax rates that are expected to apply<br />
in the period when the liability is settled or the asset is realised.<br />
Deferred tax is recognised in the income statement, except when<br />
it relates to items recognised directly to equity, in which case the<br />
deferred tax is also taken directly to equity.<br />
Deferred tax assets and liabilities are offset when they relate to income<br />
taxes levied by the same taxation authority and the group intends, and<br />
is able to, settle its current tax assets and liabilities on a net basis.<br />
4.13 Employee benefits<br />
LONG-TERM BENEFITS<br />
The vesting portion of long-term benefits is recognised and provided<br />
at balance sheet date, based on the current total cost to the group.<br />
POST-EMPLOYMENT BENEFITS<br />
The group operates defined contribution plans for the benefit of its<br />
employees, the assets of which are held in separate funds. A defined<br />
contribution plan is a pension plan under which the group pays<br />
fixed contributions into a separate entity. The group has no legal or<br />
constructive obligations to pay further contributions if the fund does<br />
not hold sufficient assets to pay all employees the benefits relating<br />
to employee service in the current and prior periods.<br />
The plan is funded by payments from employees and the group.<br />
The group’s contribution to the funds is recognised as employee<br />
benefit expense in the income statement in the year to which it relates.<br />
The group does not provide guarantees in respect of the returns<br />
in the defined contribution funds and has no further payment<br />
obligations once the contributions have been paid.<br />
The group is also a participating employer in two closed defined<br />
benefit plans for its pensioner members who retired before 2001.<br />
The group does not, however, provide defined employee benefits to<br />
its current employees. A defined benefit plan is a pension plan that<br />
is not a defined contribution plan. Typically defined benefit plans<br />
define an amount of pension benefit that an employee will receive<br />
on retirement, usually dependent on one or more factors such as<br />
age, years of service and compensation.<br />
Statutory actuarial valuations on the defined benefit plans are<br />
performed every three years, using the projected unit credit method.<br />
Valuations are performed on a date which coincides with the balance<br />
sheet date. Consideration is given to any event that could impact the<br />
funds up to balance sheet date.<br />
TERMINATION BENEFITS<br />
Termination benefits are payable whenever an employee’s<br />
employment is terminated before the normal retirement date or<br />
whenever an employee accepts voluntary redundancy in exchange<br />
for these benefits.<br />
34 <strong>Kumba</strong> <strong>Iron</strong> <strong>Ore</strong> Limited
The group recognises termination benefits when it has demonstrated<br />
its commitment to either terminate the employment of current<br />
employees according to a detailed formal plan without possibility of<br />
withdrawal or to provide termination benefits as a result of an offer<br />
made to encourage voluntary redundancy. If the benefits are due<br />
more than 12 months after balance sheet date, they are discounted<br />
to present value.<br />
4.15 Cost of sales<br />
When inventories are sold, the carrying amount is recognised as part<br />
of cost of sales. Any write-down of inventories to net realisable value<br />
and all losses of inventories or reversals of previous write downs or<br />
losses are recognised in cost of sales in the period the write down,<br />
loss or reversal occurs.<br />
EQUITY COMPENSATION BENEFITS<br />
The various equity compensation schemes operated by the group<br />
allow certain senior employees, including executive directors, the<br />
option to acquire shares in <strong>Kumba</strong> over a prescribed period in<br />
return for services rendered. These options are settled by means<br />
of the issue of shares. Such equity-settled share-based payments<br />
are measured at fair value at the date of the grant. The fair value<br />
determined at the grant date of the equity-settled share-based<br />
payments is charged as employee costs on a straight-line basis over<br />
the period that the employees become unconditionally entitled to the<br />
options, based on management’s estimate of the shares that will vest<br />
and adjusted for the effect of non market-based vesting conditions.<br />
These share options are not subsequently revalued.<br />
The fair value of the share options is measured using option<br />
pricing models. The expected life used in the models has been<br />
adjusted, based on management’s best estimate, for the effects<br />
of non-transferability, exercise restrictions and behavioural<br />
considerations such as volatility, dividend yield and the vesting period.<br />
The fair value takes into account the terms and conditions on which<br />
these incentives are granted and the extent to which the employees<br />
have rendered services to balance sheet date.<br />
INCOME STATEMENT<br />
4.14 Revenue<br />
Revenue is derived principally from the sale of iron ore and shipping<br />
services rendered. Revenue is measured at the fair value of the<br />
consideration received or receivable for the sale of goods and service<br />
in the ordinary course of the group’s activities. Revenue excludes<br />
value-added tax (VAT), discounts, volume rebates and sales between<br />
group companies, and represents the gross value of goods invoiced.<br />
The group recognises revenue when the amount of revenue can be<br />
reliably measured, it is probable that future economic benefits will<br />
flow to the entity and when specific criteria have been met for each<br />
of the group’s activities as described below.<br />
SALES OF GOODS – IRON ORE<br />
Revenue from the sale of iron ore is recognised when significant<br />
risks and rewards of ownership of the goods are transferred to the<br />
buyer. Export revenues are recorded when the risks and rewards of<br />
ownership are transferred as indicated by the relevant sales terms<br />
stipulated in the sales contract.<br />
4.16 Income from investments<br />
INTEREST INCOME<br />
Interest is recognised on the time proportion basis, taking into<br />
account the principal amount outstanding and the effective interest<br />
rate over the period to maturity, when it is determined that such<br />
income will accrue to the group.<br />
DIVIDEND INCOME<br />
Dividends received are recognised when the right to receive<br />
payment is established.<br />
4.17 Borrowing costs<br />
Interest on borrowings directly relating to the financing of qualifying<br />
capital projects under construction is added to the capitalised cost<br />
of those projects during the construction phase, until such time<br />
as the assets are substantially ready for their intended use or sale<br />
which, in the case of mining properties, is when they are capable<br />
of commercial production. Where funds have been borrowed<br />
specifically to finance a project, the amount capitalised represents<br />
the actual borrowing costs incurred. Where the funds used to<br />
finance a project form part of general borrowings, the amount<br />
capitalised is calculated using a weighted average of rates applicable<br />
to relevant general borrowings of the group during the period.<br />
All other borrowing costs are recognised in profit or loss in the<br />
period in which they are incurred.<br />
4.18 Employee benefits: short-term benefits<br />
The cost of all short-term employee benefits, such as salaries,<br />
bonuses, housing allowances, medical and other contributions is<br />
recognised in the income statement during the period in which the<br />
employee renders the related service.<br />
4.19 Operating leases<br />
The group leases property and equipment. Under the leasing<br />
agreements all the risks and benefits of ownership are effectively<br />
retained by the lessor and are classified as operating leases.<br />
Payments made under operating leases are expensed in the income<br />
statement on a straight-line basis over the period of the lease.<br />
Audited annual financial statements<br />
SHIPPING SERVICES<br />
Revenue arising from shipping services rendered is recognised<br />
based on the percentage of completion method based on the<br />
services performed to date as a percentage of the total services to<br />
be performed, and is only recognised when the stage of completion<br />
can be measured reliably.<br />
Annual Financial Statements 2011<br />
35
PRINCIPAL ACCOUNTING POLICIES<br />
FOR THE YEAR ENDED 31 DECEMBER 2011<br />
4.20 Taxation<br />
The income tax charge for the period is determined based on profit<br />
before tax for the year and comprises current, deferred tax and STC.<br />
Tax is recognised in the income statement, except to the extent that<br />
it relates to items recognised in comprehensive income or directly<br />
in equity. In this case the tax is also recognised in comprehensive<br />
income or directly in equity, respectively.<br />
CURRENT TAX<br />
The current tax charge is the calculated tax payable on the taxable<br />
income for the year using tax rates that have been enacted or<br />
substantively enacted by the balance sheet date and any adjustments<br />
to tax payable in respect of prior years. Taxable profit differs from net<br />
profit as reported in the income statement because it excludes items<br />
of income or expense that are taxable or deductible in other years<br />
and it further excludes items that are not taxable or deductible.<br />
STC<br />
STC is recognised as part of the current tax charge in the income<br />
statement when the related dividend is declared. When dividends<br />
received during the current year can be offset against future<br />
dividend payments to reduce the STC liability, a deferred tax asset<br />
is recognised to the extent of the future reduction in STC.<br />
Also refer to the ‘Deferred tax’ accounting policy note above.<br />
4.21 Earnings per share<br />
The group presents basic and diluted earnings per share (EPS) data<br />
for its ordinary shares. Basic EPS is calculated by dividing the profit or<br />
loss attributable to ordinary shareholders of <strong>Kumba</strong> by the weighted<br />
average number of ordinary shares outstanding during the year.<br />
Diluted EPS is determined by adjusting the profit or loss attributable<br />
to ordinary shareholders and the weighted average number of ordinary<br />
shares outstanding for the effects of all dilutive potential ordinary<br />
shares, which comprises share options granted to employees.<br />
4.22 Convenience translation from Rand<br />
to US dollars<br />
The presentation currency of the group is Rand.<br />
Supplementary US dollar information is provided for convenience<br />
only. The conversion to US dollar is performed as follows:<br />
<br />
on balance sheet date.<br />
<br />
for the years presented.<br />
<br />
is translated at the closing rate on each balance sheet date.<br />
The resulting translation differences are included in shareholders’ equity.<br />
5. SIGNIFICANT ACCOUNTING JUDGEMENTS<br />
AND ESTIMATES<br />
The preparation of the financial statements requires the group’s<br />
management to make estimates and assumptions that affect the<br />
reported amounts of assets and liabilities, disclosure of contingent<br />
assets and liabilities at the date of the financial statements, and the<br />
reported amounts of revenues and expenses during the reporting<br />
period. The determination of estimates requires the exercise of<br />
judgement based on various assumptions and other factors such as<br />
historical experience, current and expected economic conditions, and<br />
in some cases actuarial techniques. Actual results could differ from<br />
those estimates.<br />
Estimates and judgements are continually evaluated and are based on<br />
historical experience and other factors, including expectations of future<br />
events that are believed to be reasonable under the circumstances.<br />
The following key assumptions concerning the future, and other key<br />
sources of estimation uncertainty at the balance sheet date, have a<br />
risk of causing an adjustment to the carrying amounts of assets and<br />
liabilities within the next financial year:<br />
5.1 Property, plant and equipment<br />
The depreciable amount of property, plant and equipment is<br />
allocated on a systematic basis over its useful life. In determining<br />
the depreciable amount management makes certain assumptions<br />
with regard to the residual value of assets based on the expected<br />
estimated amount that the group would currently obtain from<br />
disposal of the asset, after deducting the estimated cost of disposal.<br />
If an asset is expected to be abandoned the residual value is<br />
<br />
In determining the useful life of items of property, plant and<br />
equipment that is depreciated, management considers the expected<br />
usage of assets, expected physical wear and tear, legal or similar<br />
limits of assets such as mineral rights as well as obsolescence.<br />
This estimate is further impacted by management’s best estimation<br />
of proved and probable iron ore reserves and the expected future life<br />
of each of the mines within the group. The forecast production could<br />
be different from the actual iron ore mined. This would generally<br />
result from significant changes in the factors or assumptions used in<br />
estimating iron ore reserves. These factors could include:<br />
<br />
<br />
<br />
<br />
logistics costs, discount rates and foreign exchange rates.<br />
Also refer to the unaudited <strong>Ore</strong> Reserves and Mineral Resources<br />
statement included in the Integrated Report 2011 for a more<br />
detailed discussion on iron ore reserve estimation.<br />
IR Page 70<br />
Any change in management’s estimate of the useful lives and residual<br />
values of assets would impact the depreciation charge. Any change in<br />
management’s estimate of the total expected future life of each of the<br />
mines would impact the depreciation charge as well as the estimated<br />
rehabilitation and decommissioning provisions.<br />
36 <strong>Kumba</strong> <strong>Iron</strong> <strong>Ore</strong> Limited
5.2 Waste stripping costs<br />
The rate at which costs associated with the removal of overburden or<br />
waste material is capitalised as development costs or charged as an<br />
operating costs is calculated using management’s best estimates of the:<br />
<br />
<br />
<br />
The average LOM stripping ratio and the average LOM mining cost are<br />
recalculated annually in light of additional knowledge and changes in<br />
estimates. Any change in management’s estimates would impact the<br />
stripping costs capitalised charged to operating costs.<br />
5.3 Impairment of non-financial assets<br />
The group reviews and tests the carrying value of assets when<br />
events or changes in circumstances indicate that the carrying<br />
amount may not be recoverable by comparing expected future cash<br />
flows to these carrying values. Such events or circumstances include<br />
movements in exchange rates, iron ore prices and the economic<br />
environment in which its businesses operate. Assets are grouped<br />
at the lowest level for which identifiable cash flows are largely<br />
independent of cash flows of other assets and liabilities. If there<br />
are indications that impairment may have occurred, estimates are<br />
prepared of expected future cash flows of each group of assets.<br />
Expected future cash flows used to determine the value in use of<br />
non-financial assets are inherently uncertain and could materially<br />
change over time. They are significantly affected by a number<br />
of factors including iron ore reserves and production estimates,<br />
together with economic factors such as future iron ore prices,<br />
discount rates, foreign currency exchange rates, estimates of<br />
production and logistics costs, future capital expenditure and<br />
discount rates used.<br />
5.4 Provision for environmental<br />
rehabilitation and decommissioning<br />
The provisions for environmental rehabilitation and decommissioning<br />
are calculated using management’s best estimate of the costs to be<br />
incurred based on the group’s environmental policy taking into account<br />
current technological, environmental and regulatory requirements<br />
discounted to a present value. Estimates are based upon costs that<br />
are regularly reviewed, by internal and external experts, and adjusted<br />
as appropriate for new circumstances. Actual costs incurred in future<br />
periods could differ from the estimates. Additionally, future changes to<br />
environmental laws and regulations, LOM estimates and discount rates<br />
used could affect the carrying amount of this provision. As a result, the<br />
liabilities that we report can vary if our assessment of the expected<br />
expenditures changes.<br />
5.6 Equity-settled share-based<br />
payment reserve<br />
Management makes certain judgements in respect of selecting<br />
appropriate fair value option pricing models to be used in estimating<br />
the fair value of the various share-based payment arrangements in<br />
respect of employees and special purpose entities. Judgements and<br />
assumptions are also made in calculating the variable elements used<br />
as inputs in these models. The inputs that are used in the models<br />
include, but are not limited to, the expected vesting period and<br />
related conditions, share price, dividend yield, share option life, risk<br />
free interest rate and annualised share price volatility (refer note 22).<br />
5.7 Estimation of deemed gross sales value<br />
of revenue for calculating mineral royalty<br />
In terms of The Mineral and Petroleum Resources Royalty Act,<br />
No. 28 of 2008 and the Mineral and Petroleum Resources Royalty<br />
Administration Act, No. 29 of 2008, the specified condition for iron<br />
ore used to calculate the mining royalty payable will be deemed to<br />
have been extracted at a 61.5% Fe specified condition. Management<br />
is required to make certain judgements and estimates in determining<br />
the gross sales value of the ore extracted at the group’s mines.<br />
5.8 Discount rates<br />
The discount rates used are the appropriate pre-tax rates that reflect<br />
the current market assessment of the time value of money and the<br />
risks specific to the assets and liabilities being measured for which<br />
the future cash flow estimates have not been adjusted.<br />
5.9 Segment reporting<br />
In applying IFRS 8, ‘Operating segments’, management makes<br />
judgements with regard to the identification of reportable operating<br />
segments of the group.<br />
5.10 Going concern<br />
Management considers key financial metrics and loan covenant<br />
compliance in its approved medium-term budgets, together with<br />
its existing-term facilities, to conclude that the going-concern<br />
assumption used in the compiling of its annual financial statements,<br />
is appropriate.<br />
Audited annual financial statements<br />
5.5 Deferred tax assets<br />
The group recognises the net future tax benefit related to deferred<br />
income tax assets to the extent that it is probable that the deductible<br />
temporary differences will reverse in the foreseeable future, or the<br />
probability of utilising assessed losses. Assessing the recoverability<br />
of deferred income tax assets requires the group to make significant<br />
estimates related to expectations of future taxable income on a<br />
subsidiary by subsidiary level. Estimates of future taxable income<br />
are based on forecast cash flows from operations. To the extent that<br />
future cash flows differ significantly from estimates, the ability of the<br />
group to realise the net deferred tax assets recorded at the balance<br />
sheet date could be impacted.<br />
Annual Financial Statements 2011<br />
37
GROUP BALANCE SHEET<br />
AS AT 31 DECEMBER<br />
BALANCE<br />
SHEET<br />
Rand million Notes 2011 2010<br />
Assets<br />
Property, plant and equipment 1 20,878 15,866<br />
Biological assets 2 6 6<br />
Investments in associates and joint ventures 3 33 29<br />
Investments held by environmental trust 4 568 372<br />
Long-term prepayments and other receivables 5 95 53<br />
Deferred tax assets 11 658 472<br />
Non-current assets 22,238 16,798<br />
Inventories 6 3,864 3,102<br />
Trade and other receivables 7 3,537 3,096<br />
Current tax assets 26 32 24<br />
Cash and cash equivalents 8 4,742 4,855<br />
Current assets 12,175 11,077<br />
Total assets 34,413 27,875<br />
Equity and liabilities<br />
Shareholders’ equity 15,833 14,338<br />
Non-controlling interest 23 4,759 4,038<br />
Total equity 20,592 18,376<br />
Liabilities<br />
Interest-bearing borrowings 9 – 3,185<br />
Provisions 10 901 672<br />
Deferred tax liabilities 11 4,942 2,272<br />
Non-current liabilities 5,843 6,129<br />
Short-term portion of interest-bearing borrowings 9 3,191 –<br />
Short-term portion of provisions 10 11 11<br />
Trade and other payables 12 4,556 3,274<br />
Current tax liabilities 26 220 85<br />
Current liabilities 7,978 3,370<br />
Total liabilities 13,821 9,499<br />
Total equity and liabilities 34,413 27,875<br />
38 <strong>Kumba</strong> <strong>Iron</strong> <strong>Ore</strong> Limited
GROUP INCOME STATEMENT/ STATEMENT OF COMPREHENSIVE INCOME<br />
FOR THE YEAR ENDED 31 DECEMBER<br />
INCOME<br />
STATEMENT<br />
Rand million Notes 2011 2010<br />
Revenue 14 48,553 38,704<br />
Operating expenses 15 (16,587) (13,573)<br />
Operating profit 16 31,966 25,131<br />
Finance income 18 241 149<br />
Finance costs 18 (149) (178)<br />
Profit before taxation 32,058 25,102<br />
Taxation 19 (9,760) (6,813)<br />
Profit for the year 22,298 18,289<br />
Attributable to:<br />
Owners of <strong>Kumba</strong> 17,042 14,323<br />
Non-controlling interest 5,256 3,966<br />
22,298 18,289<br />
Earnings per share for profit attributable to the owners of <strong>Kumba</strong> (Rand per share) 20<br />
Basic 53.11 44.66<br />
Diluted 52.97 44.52<br />
STATEMENT OF<br />
COMPREHENSIVE INCOME<br />
Audited annual financial statements<br />
Rand million Notes 2011 2010<br />
Profit for the year 22,298 18,289<br />
Other comprehensive income/(losses) for the year, net of tax 13 404 (217)<br />
Exchange differences on translation of foreign operations 363 (215)<br />
Net effect of cash flow hedges 41 (2)<br />
Total comprehensive income for the year 22,702 18,072<br />
Attributable to:<br />
Owners of <strong>Kumba</strong> 17,340 14,143<br />
Non-controlling interest 5,362 3,929<br />
22,702 18,072<br />
Annual Financial Statements 2011<br />
39
GROUP STATEMENT OF CHANGES IN EQUITY<br />
FOR THE YEAR ENDED 31 DECEMBER<br />
STATEMENT OF<br />
CHANGES IN EQUITY<br />
Equitysettled<br />
Rand million<br />
Share<br />
capital<br />
and share<br />
premium<br />
(note 21)<br />
Treasury<br />
shares<br />
(note 21)<br />
share-based<br />
payments<br />
reserve<br />
(note 22)<br />
Foreign<br />
currency<br />
translation<br />
reserve<br />
Cash<br />
flow hedge<br />
accounting<br />
reserve<br />
Retained<br />
earnings<br />
Shareholders’<br />
equity<br />
Noncontrolling<br />
interest<br />
Total<br />
equity<br />
Balance at 31 December 2009 270 (62) 466 318 (8) 6,322 7,306 1,650 8,956<br />
Shares issued during the year 80 (6) – – – – 74 – 74<br />
Net movement in treasury shares<br />
under employee share incentive<br />
schemes – (129) – – – – (129) – (129)<br />
Equity-settled share-based<br />
payments expense – – 203 – – – 203 (8) 195<br />
Vesting of shares under employee<br />
share incentive schemes – – (13) – – (50) (63) – (63)<br />
Total comprehensive income for<br />
the year – (165) (15) 14,323 14,143 3,929 18,072<br />
Change in effective ownership<br />
of SIOC – – (16) (11) (1) (273) (301) 301 –<br />
Share-based payment vesting<br />
upon deconsolidation of the SIOC<br />
Community Development SPV – (153) – – 14 (139) – (139)<br />
Dividends paid – – – – – (6,756) (6,756) (1,834) (8,590)<br />
Balance at 31 December 2010 350 (197) 487 142 (24) 13,580 14,338 4,038 18,376<br />
Shares issued during the year 16 – – – – – 16 – 16<br />
Net movement in treasury shares<br />
under employee share incentive<br />
schemes – (139) – – – – (139) – (139)<br />
Equity-settled share-based<br />
payments expense – – 265 – – – 265 87 352<br />
Vesting of shares under employee<br />
share incentive schemes – – (445) – – (1,712) (2,157) (646) (2,803)<br />
Total comprehensive income for<br />
the year – – – 280 18 17,042 17,340 5,362 22,702<br />
Change in effective ownership<br />
of SIOC – – – – – 4 4 (4) –<br />
Dividends paid – – – – – (13,834) (13,834) (4,078) (17,912)<br />
Balance at 31 December 2011 366 (336) 307 422 (6) 15,080 15,833 4,759 20,592<br />
Rand 2011 2010<br />
Dividend per share (note 20)<br />
Interim 21.70 13.50<br />
Final* 22.50 21.00<br />
Total 44.20 34.50<br />
* The final dividend was declared subsequent to the year-end and is presented for information purposes only.<br />
Equity-settled share-based payments reserve<br />
The equity-settled share-based payment reserve comprises the fair value of goods received or services rendered that has been settled through<br />
the issue of shares or share options.<br />
Foreign currency translation reserve<br />
The foreign currency translation reserve comprises all foreign exchange differences arising from the translation of the financial results of foreign<br />
operations to the presentation currency of <strong>Kumba</strong>.<br />
Cash flow hedge accounting reserve<br />
The cash flow hedge accounting reserve comprises the effective portion of the cumulative net change in the fair value of derivative financial<br />
instruments designated as cash flow hedges where the forecasted transaction has not yet occurred.<br />
40 <strong>Kumba</strong> <strong>Iron</strong> <strong>Ore</strong> Limited
GROUP CASH FLOW STATEMENT<br />
FOR THE YEAR ENDED 31 DECEMBER<br />
CASH FLOW<br />
STATEMENT<br />
Rand million Notes 2011 2010<br />
Cash flows from operating activities<br />
Cash receipts from customers 48,788 37,325<br />
Cash paid to suppliers and employees (16,157) (11,770)<br />
Cash generated from operations 24 32,631 25,555<br />
Net finance costs paid 25 (96) (283)<br />
Taxation paid 26 (7,035) (7,031)<br />
25,500 18,241<br />
Cash flows from investing activities<br />
Additions to property, plant and equipment 28 (5,849) (4,723)<br />
Investment in associates and joint ventures 3 (4) (9)<br />
Proceeds from disposal of non-current assets 2 1<br />
Net cash outflow on disposal of subsidiaries – (2)<br />
(5,851) (4,733)<br />
Cash flows from financing activities<br />
Shares issued 21 16 74<br />
Purchase of treasury shares 21 (278) (191)<br />
Vesting of Envision share scheme 22 (1,694) –<br />
Dividends paid to owners of <strong>Kumba</strong> 27 (13,742) (6,714)<br />
Dividends paid to non-controlling shareholders 27 (4,170) (1,876)<br />
Change in effective ownership of SIOC – (147)<br />
Interest-bearing borrowings raised 9 – 4,771<br />
Interest-bearing borrowings repaid 9 – (5,500)<br />
(19,868) (9,583)<br />
Net (decrease)/increase in cash and cash equivalents (219) 3,925<br />
Cash and cash equivalents at beginning of year 4,855 891<br />
Exchange differences on translation of cash and cash equivalents 106 39<br />
Cash and cash equivalents at end of year 8 4,742 4,855<br />
Audited annual financial statements<br />
Annual Financial Statements 2011<br />
41
GROUP – NOTES TO THE ANNUAL FINANCIAL STATEMENTS<br />
FOR THE YEAR ENDED 31 DECEMBER<br />
NOTES TO THE ANNUAL<br />
FINANCIAL STATEMENTS<br />
1. PROPERTY, PLANT AND EQUIPMENT<br />
Buildings<br />
and infrastructure<br />
Machinery,<br />
plant and<br />
equipment<br />
Mineral<br />
exploration,<br />
site<br />
preparation<br />
and development<br />
Assets<br />
under<br />
construction<br />
Rand million<br />
Land<br />
Mineral<br />
properties<br />
Residential<br />
buildings<br />
Total<br />
2011<br />
Cost<br />
Balance at beginning of year 105 621 139 382 11,013 59 6,980 19,299<br />
Additions (refer to note 28) 22 – 6 1 132 18 5,804 5,983<br />
Changes in decommissioning provision<br />
(refer to note 10) – – – 18 13 – 7 38<br />
Disposals and scrapping – – – – (58) – – (58)<br />
Transfers between asset classes 101 – 316 2,482 6,053 – (8,952) –<br />
Exchange differences on translation – – – 1 – – – 1<br />
Balance at 31 December 2011 228 621 461 2,884 17,153 77 3,839 25,263<br />
Accumulated depreciation<br />
Balance at beginning of year – 212 44 120 3,006 51 – 3,433<br />
Depreciation – 20 7 35 934 2 – 998<br />
Disposals and scrapping – – – – (46) – – (46)<br />
Transfers between asset classes – – – – – – – –<br />
Balance at 31 December 2011 – 232 51 155 3,894 53 – 4,385<br />
Carrying amount at 31 December 2011 228 389 410 2,729 13,259 24 3,839 20,878<br />
2010<br />
Cost<br />
Balance at beginning of year 64 658 88 271 9,435 81 3,741 14,338<br />
Additions (refer to note 28) 41 – 1 17 209 – 4,751 5,019<br />
Changes in decommissioning provision<br />
(refer to note 10) – – 3 24 16 – 7 50<br />
Disposals and scrapping – (33) – (1) (48) (22) – (104)<br />
Transfers between asset classes – – 47 71 1,401 – (1,519) –<br />
Exchange differences on translation – (4) – – – – – (4)<br />
Balance at 31 December 2010 105 621 139 382 11,013 59 6,980 19,299<br />
Accumulated depreciation<br />
Balance at beginning of year – 195 40 94 2,335 69 – 2,733<br />
Depreciation – 17 4 18 722 4 – 765<br />
Disposals and scrapping – – – (1) (42) (22) – (65)<br />
Transfers between asset classes – – – 9 (9) – – –<br />
Balance at 31 December 2010 – 212 44 120 3,006 51 – 3,433<br />
Impairment of assets<br />
Balance at beginning of year – 37 – – – – – 37<br />
Disposals and scrapping – (33) – – – – (33)<br />
Exchange differences on translation – (4) – – – – – (4)<br />
Balance at 31 December 2010 – – – – – – – –<br />
Carrying amount at 31 December 2010 105 409 95 262 8,007 8 6,980 15,866<br />
42 <strong>Kumba</strong> <strong>Iron</strong> <strong>Ore</strong> Limited
1. PROPERTY, PLANT AND EQUIPMENT continued<br />
Additional disclosures<br />
Included in the above items of property, plant and equipment are fully depreciated assets still in use with an original cost price of R337 million<br />
(2010: R143 million).<br />
During the year the group scrapped fully depreciated assets with an original cost price of R9.1 million (2010: R49 million).<br />
The group generated proceeds from the disposal of items of property, plant and equipment of R1.8 million (2010: R0.7 million).<br />
The estimated replacement value of assets for insurance purposes and assets under construction at cost amounts to R29.9 billion (2010: R26.1 billion).<br />
A register of land and buildings is available for inspection at the registered office of the company.<br />
None of the assets are encumbered as security for any of the group’s liabilities.<br />
Rand million 2011 2010<br />
Capital commitments<br />
Capital commitments include all items of capital expenditure for which specific board approval has been<br />
obtained up to balance sheet date. Capital expenditure still under investigation for which specific board<br />
approvals have not yet been obtained are excluded.<br />
Capital expenditure contracted for plant and equipment 1,988 1,727<br />
Capital expenditure authorised for plant and equipment but not contracted 2,168 4,965<br />
Capital expenditure will be financed principally from borrowing facilities and cash generated from operations<br />
<br />
Capital expenditure contracted for plant and equipment 29 38<br />
Capital expenditure authorised for plant and equipment but not contracted 7 48<br />
2. BIOLOGICAL ASSETS<br />
Rand million Livestock Game Total<br />
Balance at beginning of year 2 4 6<br />
Gains attributable to physical changes and price changes – 1 1<br />
Disposals – (1) (1)<br />
Balance at 31 December 2011 2 4 6<br />
Balance at beginning of year 4 3 7<br />
Acquisitions 2 – 2<br />
Gains attributable to physical changes and price changes – 1 1<br />
Disposals (4) – (4)<br />
Balance at 31 December 2010 2 4 6<br />
Biological assets comprise mature livestock and game and are measured at fair value.<br />
Livestock consists of cattle, sheep and goats and game consists of giraffe, ostrich and a variety of antelope.<br />
Audited annual financial statements<br />
3. INVESTMENTS IN ASSOCIATES AND JOINT VENTURES<br />
Rand ’000 2011 2010<br />
Associates<br />
Unlisted 50 50<br />
Joint ventures<br />
Unlisted 33,251 28,952<br />
Total 33,301 29,002<br />
Refer to annexure 2 for details of associated companies and joint ventures and directors’ valuations.<br />
Rand ’000 Investments Loans Total<br />
Associates<br />
Balance at beginning of year 50 – 50<br />
Balance at 31 December 2011 50 – 50<br />
Balance at beginning of year 50 – 50<br />
Balance at 31 December 2010 50 – 50<br />
No income was earned or expense was incurred by the associate during the year as the entity is dormant.<br />
Annual Financial Statements 2011<br />
43
GROUP – NOTES TO THE ANNUAL FINANCIAL STATEMENTS<br />
FOR THE YEAR ENDED 31 DECEMBER<br />
3. INVESTMENTS IN ASSOCIATES AND JOINT VENTURES continued<br />
Rand ’000 2011 2010<br />
Balance sheet information of associates<br />
Non-current assets 2,893 2,893<br />
Total assets 2,893 2,893<br />
Shareholders' equity 2,847 2,847<br />
Non-current liabilities 46 46<br />
Total equity and liabilities 2,893 2,893<br />
The financial information presented represents the group’s effective interest.<br />
Rand ’000 Investments Loans Total<br />
Joint ventures<br />
Balance at beginning of year – 28,952 28,952<br />
Increase in loans to joint ventures – 4,299 4,299<br />
Balance at 31 December 2011 – 33,251 33,251<br />
Balance at beginning of year – 19,840 19,840<br />
Increase in loans to joint ventures – 9,112 9,112<br />
Balance at 31 December 2010 – 28,952 28,952<br />
Rand ’000 2011 2010<br />
Income statement information of joint ventures<br />
Revenue – 173,772<br />
Operating expenses (24,167) (26,923)<br />
Operating (loss)/profit (24,167) 146,849<br />
Net financing income 4 278<br />
Profit before taxation (24,163) 147,127<br />
Taxation 6,771 3,819<br />
(Loss)/profit for the year (17,392) 150,946<br />
Balance sheet information of joint ventures<br />
Non-current assets 23,527 16,762<br />
Current assets 82 3,129<br />
Total assets 23,609 19,891<br />
Shareholders' deficit (44,634) (25,862)<br />
Non-current liabilities 33,251 28,951<br />
Current liabilities 34,992 16,802<br />
Total equity and liabilities 23,609 19,891<br />
Cash flow information of joint ventures<br />
Cash flows utilised in operating activities (7,488) (22,475)<br />
Cash flows from investing activities 4,299 7,402<br />
Cash flows from financing activities (105) –<br />
Foreign currency translations 257 (9,718)<br />
Net decrease in cash and cash equivalents (3,037) (24,791)<br />
The financial information presented represents the group’s effective interest.<br />
4. INVESTMENTS HELD BY ENVIRONMENTAL TRUST<br />
Rand million 2011 2010<br />
Balance at beginning of year 372 279<br />
Contributions 183 68<br />
Growth in environmental trusts 13 25<br />
Balance at end of year 568 372<br />
Cash investments 285 301<br />
Equity investments 283 71<br />
568 372<br />
44 <strong>Kumba</strong> <strong>Iron</strong> <strong>Ore</strong> Limited
4. INVESTMENTS HELD BY ENVIRONMENTAL TRUST continued<br />
These investments may only be utilised for the purposes of settling decommissioning and rehabilitation obligations relating to the group’s mining<br />
operations. The investment returns are reinvested by the trust. Refer to note 10 for the environmental rehabilitation and decommissioning provisions.<br />
Rand million 2011 2010<br />
Maturity profile of the investments held by environmental trust<br />
5 years 222 –<br />
More than 5 years 346 372<br />
Currency analysis of investments held by environmental trust<br />
Rand 568 372<br />
Fair value of investments held by environmental trust<br />
The fair value of investments held by the environmental trust is determined using quoted market values at 31 December 2011.<br />
Rand million Carrying value Fair value<br />
Investments held by environmental trust – 2011 568 568<br />
Investments held by environmental trust – 2010 372 372<br />
Credit risk<br />
Investments held by the environmental trust are managed by a financial institution with long-term investment grade credit rating and with the<br />
capacity for payment of financial commitments considered strong. The trustees of the environmental trust continuously review the investment<br />
strategy of the trust with its investment advisors to ensure that the strategy remains appropriate in light of changing market conditions.<br />
Equity securities price risk<br />
The equity instruments values are determined with reference to quoted market values (level 1).<br />
5. LONG-TERM PREPAYMENTS AND OTHER RECEIVABLES<br />
Rand million 2011 2010<br />
Long-term receivables 1 1<br />
Prepayments 94 52<br />
95 53<br />
Maturity profile of long-term prepayments and other receivables<br />
1 to 2 years 10 7<br />
2 to 5 years 28 17<br />
More than 5 years 57 29<br />
95 53<br />
6. INVENTORIES<br />
Rand million 2011 2010<br />
Finished products 1,472 1,310<br />
Work-in-progress 1,864 1,375<br />
Plant spares and stores 528 417<br />
3,864 3,102<br />
Audited annual financial statements<br />
No inventories are carried at net realisable value or were encumbered during the year.<br />
7. TRADE AND OTHER RECEIVABLES<br />
Rand million 2011 2010<br />
Trade receivables 2,249 2,058<br />
Other receivables 1,198 960<br />
Derivative financial instruments (refer to note 29) 90 78<br />
3,537 3,096<br />
Annual Financial Statements 2011<br />
45
GROUP – NOTES TO THE ANNUAL FINANCIAL STATEMENTS<br />
FOR THE YEAR ENDED 31 DECEMBER<br />
7. TRADE AND OTHER RECEIVABLES continued<br />
Credit risk<br />
Trade receivables are exposed to the credit risk of end-user customers within the steel manufacturing industry.<br />
Significant concentrations of credit risk exist in respect of trade receivables, where R1,862 million (2010: R1,609 million) or 83% (2010: 78%)<br />
of the total outstanding trade receivables balance of R2,249 million (2010: R2,058 million) consists of individual end-user customers with an<br />
outstanding balance in excess of 5% of the total trade receivables balance as at 31 December 2011.<br />
The group has an established credit policy under which customers are analysed for creditworthiness before the group’s payment and delivery<br />
terms and conditions are offered. Customer balances are monitored on an ongoing basis to ensure that they remain within the negotiated terms<br />
and conditions offered.<br />
Rand million 2011 2010<br />
Trade receivables credit risk exposure by geographical area<br />
Asia 1,316 1,436<br />
South Africa 486 291<br />
Europe 447 331<br />
2,249 2,058<br />
Credit quality of trade receivables<br />
Not past due 2,249 2,054<br />
Past due 0 to 30 days – 4<br />
2,249 2,058<br />
Currency analysis of trade receivables<br />
US dollar 1,763 1,768<br />
Rand 486 283<br />
Other – 7<br />
2,249 2,058<br />
Other receivables consists of the following<br />
Prepayments 55 36<br />
Value-added tax receivable 895 660<br />
Interest receivable 21 29<br />
Provision for doubtful other receivables – (5)<br />
Opening balance (5) –<br />
Income statement reversal/(charge) for the year 5 (5)<br />
Other 227 240<br />
1,198 960<br />
8. CASH AND CASH EQUIVALENTS<br />
Rand million 2011 2010<br />
Bank balance and cash 4,742 4,855<br />
Rand million 2011 2010<br />
Currency analysis of cash and cash equivalents<br />
Rand 4,041 3,346<br />
US dollar 692 1,501<br />
Euro 6 8<br />
Other 3 –<br />
4,742 4,855<br />
Credit risk<br />
Cash and cash equivalents are held in various financial institutions with long-term investment grade credit rating and with the capacity for<br />
payment of financial commitments considered strong. <strong>Kumba</strong> has a R3,885 million short-term deposit facility as at 31 December 2011 that was<br />
placed with Anglo American SA Finance Limited (2010: R1,391 million), a subsidiary of the group’s ultimate holding company (refer to note 35).<br />
46 <strong>Kumba</strong> <strong>Iron</strong> <strong>Ore</strong> Limited
9. INTEREST-BEARING BORROWINGS<br />
Rand million 2011 2010<br />
Non-current interest-bearing borrowings<br />
Long-term interest-bearing borrowings 3,191 3,185<br />
Current portion included in current interest-bearing borrowings (3,191) –<br />
– 3,185<br />
Current interest-bearing borrowings<br />
Current portion of interest-bearing borrowings 3,191 –<br />
3,191 –<br />
Total interest-bearing borrowings 3,191 3,185<br />
Reconciliation<br />
Balance at beginning of year 3,185 3,914<br />
Interest-bearing borrowings raised – 4,771<br />
Interest-bearing borrowings repaid – (5,527)<br />
Deferred transaction cost recognised 6 27<br />
Balance at end of year 3,191 3,185<br />
Maturity profile of interest-bearing borrowings<br />
Within 1 year 3,191 –<br />
2 to 3 years – 3,185<br />
Balance at end of year 3,191 3,185<br />
Rand million<br />
Unsecured loans<br />
Maturity<br />
date<br />
Interest<br />
rate at<br />
31 Dec 2011<br />
(%) Facility<br />
Outstanding<br />
balance<br />
2011<br />
Outstanding<br />
balance<br />
2010<br />
Revolving facility “C” at a floating interest rate of<br />
3-month Jibar + 240 basis points, reset quarterly but<br />
payable semi-annually (2010: 7.98%)<br />
Maturity date 28 November 2013 2013 * 5,400 – –<br />
Term facility at a floating interest rate of 3-month<br />
Jibar + 285 basis points, reset quarterly but payable<br />
semi-annually (2010: 8.43%)<br />
Maturity date 31 July 2012 2012 8.43 3,195 3,195 3,195<br />
Call loan facility 2012 – 3,690 – –<br />
Fair value at end of year 12,285 3,195 3,195<br />
Deferred transaction costs (4) (10)<br />
Carrying value at end of year 12,285 3,191 3,185<br />
* There were no funds drawn down against the facility during the year ended 31 December 2011.<br />
The Jibar rate at 31 December 2011 was 5.584% (2010: 5.549%).<br />
Audited annual financial statements<br />
Financial covenants<br />
The group is in compliance with its debt covenants (total debt/earnings before interest, tax, depreciation and amortisation (EBITDA);<br />
EBITDA/Net interest expense). This was also the case in 2010.<br />
Currency analysis of interest-bearing borrowings<br />
All interest-bearing borrowings of the group are denominated in Rand.<br />
Annual Financial Statements 2011<br />
47
GROUP – NOTES TO THE ANNUAL FINANCIAL STATEMENTS<br />
FOR THE YEAR ENDED 31 DECEMBER<br />
10. PROVISIONS<br />
Employee<br />
benefits<br />
Rand million<br />
cash-settled<br />
share-based<br />
payments<br />
Contract for<br />
affreightment<br />
Environmental<br />
rehabilitation<br />
Decommis-<br />
-sioning Total<br />
Non-current provisions 1 – 710 190 901<br />
Current portion of provisions 11 – – – 11<br />
Total provisions 12 – 710 190 912<br />
2011<br />
Balance at beginning of the year 11 – 532 140 683<br />
Notional interest – – 46 13 59<br />
Charged to income statement – – 132 – 132<br />
Capitalised to property, plant and equipment – – – 37 37<br />
Utilised during the year (17) – – – (17)<br />
Cash-settled share-based payments 18 – – – 18<br />
Balance at 31 December 2011 12 – 710 190 912<br />
Expected timing of future cash flows<br />
Within 1 year 11 – – – 11<br />
5 years – – 192 13 205<br />
More than 5 years 1 – 518 177 696<br />
12 – 710 190 912<br />
Estimated undiscounted obligation 12 – 1,222 369 1,603<br />
2010<br />
Non-current provisions – – 532 140 672<br />
Current portion of provisions 11 – – – 11<br />
Total provisions 11 – 532 140 683<br />
Balance at beginning of the year 10 2 377 83 472<br />
Notional interest – – 35 7 42<br />
(Reversed)/charged to income statement – (2) 120 – 118<br />
Capitalised to property, plant and equipment – – – 50 50<br />
Utilised during the year (10) – – – (10)<br />
Cash-settled share-based payments 11 – – – 11<br />
Balance at 31 December 2010 11 – 532 140 683<br />
Expected timing of future cash flows<br />
Within 1 year 11 – – – 11<br />
More than 5 years – – 532 140 672<br />
11 – 532 140 683<br />
Estimated undiscounted obligation 11 – 1,082 334 1,427<br />
Cash-settled share-based payments (refer to note 22)<br />
At 31 December 2011 the current provision represents amounts payable to deceased beneficiaries on the Envision share scheme. The non-current<br />
provision represents amounts payable to beneficiaries of certain conditional share awards under the Bonus share scheme which vests in 2014.<br />
Environmental rehabilitation<br />
Provision is made for environmental rehabilitation costs where either a legal or constructive obligation is recognised as a result of past events.<br />
Estimates are based upon costs that are reviewed regularly and adjusted as appropriate for new circumstances.<br />
Decommissioning<br />
The decommissioning provision relates to decommissioning of property, plant and equipment where either a legal or constructive obligation is<br />
recognised as a result of past events. Estimates are based upon costs that are regularly reviewed and adjusted.<br />
Funding of environmental rehabilitation and decommissioning (refer to note 4)<br />
Contributions towards the cost of mine closure are also made to the <strong>Kumba</strong> <strong>Iron</strong> <strong>Ore</strong> Rehabilitation Trust and the balance of the trust amounted<br />
to R568 million at 31 December 2011 (2010: R372 million).<br />
Significant accounting estimates<br />
The estimation of the environmental rehabilitation and decommissioning provisions are a key area where management’s judgement is required.<br />
A change of 1% in the discount rate used in estimating the environmental rehabilitation and decommissioning provisions would result in an<br />
increase of R147.4 million (2010: R43.4 million) or a decrease of R122.3 million (2010: R35.6 million) in the carrying value of the provision.<br />
A change of one year in the expected timing of the commencement of environmental rehabilitation and decommissioning would result in an<br />
increase of R34.7 million (2010: R26.9 million) or a decrease of R33.4 million (2010: R25.8 million) in the carrying value of the provision.<br />
48 <strong>Kumba</strong> <strong>Iron</strong> <strong>Ore</strong> Limited
10. PROVISIONS continued<br />
Change in accounting estimate<br />
<br />
mines. The effect of these changes are detailed below:<br />
Rand million<br />
Environmental<br />
rehabilitation Decommissioning Total<br />
Amount of the closure cost 64 18 82<br />
Expected timing of future cash flows 67 20 87<br />
131 38 169<br />
The change in estimate in the environmental rehabilitation provision resulted in a decrease in attributable profit for 2011 of R72 million<br />
(effect on earnings per share R0.22 per share) after taking into account taxation of R37 million and minority interest of R22 million.<br />
The change in estimate in the decommissioning provision has been capitalised to the related property, plant and equipment (refer to note 1).<br />
11. DEFERRED TAX<br />
Rand million 2011 2010<br />
Deferred tax assets<br />
Reconciliation<br />
Balance at beginning of year 472 129<br />
Foreign exchange translation differences 130 (37)<br />
Current year charge per the income statement 56 380<br />
Balance at end of year 658 472<br />
Expected timing<br />
Deferred tax assets to be recovered after 12 months 504 327<br />
Deferred tax assets to be recovered within 12 months 154 145<br />
Balance at end of year 658 472<br />
Deferred tax assets attributable to the following temporary differences<br />
Estimated tax losses 639 459<br />
Other 19 13<br />
Total deferred tax assets 658 472<br />
There was no unused tax losses for which a deferred tax asset was recognised at 31 December 2011 (2010: R681 million).<br />
Rand million 2011 2010<br />
Deferred tax liabilities<br />
Reconciliation<br />
Balance at beginning of year 2,272 2,282<br />
Prior year adjustment – 9<br />
Current year charge/(credit) per the income statement 2,670 (19)<br />
Balance at end of year 4,942 2,272<br />
Expected timing<br />
Deferred tax liabilities to be recovered after 12 months 4,495 2,064<br />
Deferred tax liabilities to be recovered within 12 months 447 208<br />
4,942 2,272<br />
Audited annual financial statements<br />
Deferred tax liabilities attributable to the following temporary differences<br />
Property, plant and equipment 5,061 2,460<br />
Environmental rehabilitation provision (199) (149)<br />
Decommissioning provision (20) (16)<br />
Environmental rehabilitation trust asset 159 104<br />
Leave pay accrual (46) (40)<br />
Other (13) (87)<br />
Total deferred tax liabilities 4,942 2,272<br />
Annual Financial Statements 2011<br />
49
GROUP – NOTES TO THE ANNUAL FINANCIAL STATEMENTS<br />
FOR THE YEAR ENDED 31 DECEMBER<br />
12. TRADE AND OTHER PAYABLES<br />
Rand million 2011 2010<br />
Trade payables 1,672 1,595<br />
Other payables 2,704 1,510<br />
Leave pay accrual 166 139<br />
Derivative financial instruments (refer to note 29) 14 30<br />
4,556 3,274<br />
Currency analysis of trade and other payables<br />
Rand 4,197 3,094<br />
US dollar 340 143<br />
Euro 19 37<br />
4,556 3,274<br />
Other payables consist mainly of accruals for goods and services received, as well as a R968 million accrual for PAYE on the Envision distribution<br />
paid in January 2012.<br />
13. OTHER COMPREHENSIVE INCOME/(LOSSES)<br />
Rand million Before tax Tax Net of tax<br />
2011<br />
Foreign currency translation differences<br />
Net gains arising during the year 363 – 363<br />
Net effect of cash flow hedges<br />
Net gains arising during the year 41 – 41<br />
Other comprehensive income for the year 404 – 404<br />
2010<br />
Foreign currency translation differences<br />
Net losses arising during the year (215) – (215)<br />
Net effect of cash flow hedges<br />
Net losses arising during the year (2) – (2)<br />
Other comprehensive losses for the year (217) – (217)<br />
14. REVENUE<br />
Rand million 2011 2010<br />
Sale of iron ore 45,842 35,825<br />
Services rendered – shipping 2,711 2,879<br />
48,553 38,704<br />
Sale of iron ore<br />
Domestic – South Africa 3,388 2,874<br />
Export 42,454 32,951<br />
China 27,193 20,233<br />
Rest of Asia 9,274 7,465<br />
Europe 5,450 4,896<br />
Middle East 227 300<br />
Americas/other 310 57<br />
Services rendered – shipping (China) 2,711 2,879<br />
48,553 38,704<br />
50 <strong>Kumba</strong> <strong>Iron</strong> <strong>Ore</strong> Limited
15. OPERATING EXPENSES<br />
Rand million 2011 2010<br />
Operating expenditure by function<br />
Production costs 9,477 7,317<br />
Movement in work-in-progress inventories (396) (288)<br />
Cost of goods produced 9,081 7,029<br />
Movement in finished product inventories 247 (171)<br />
Finance gains (refer to note 17) (587) (286)<br />
Other 20 (2)<br />
Cost of goods sold 8,761 6,570<br />
Mineral royalty 1,762 1,410<br />
Selling and distribution costs 3,698 3,041<br />
Distribution costs 3,393 2,760<br />
Selling costs 305 281<br />
Cost of services rendered – shipping 2,374 2,560<br />
Sublease rentals received (8) (8)<br />
Operating expenses 16,587 13,573<br />
Cost of goods sold comprises:<br />
Staff costs 2,777 2,284<br />
Salaries and wages 2,159 1,883<br />
Equity-settled share-based payments 352 195<br />
Cash-settled share-based payments 17 11<br />
Pension and medical costs 249 195<br />
Raw materials and consumables 2,233 1,509<br />
Depreciation of property, plant and equipment 998 765<br />
Mineral properties 20 17<br />
Residential buildings 7 4<br />
Buildings and infrastructure 35 18<br />
Machinery, plant and equipment 934 722<br />
Site preparation and development 2 4<br />
Repairs and maintenance 968 701<br />
Legal 103 79<br />
Professional fees 330 194<br />
Outside services 1,887 1,288<br />
Technical services and project studies 326 99<br />
General expenses 599 788<br />
Finance gains (refer to note 17) (587) (286)<br />
Energy costs 247 189<br />
Own work capitalised (971) (581)<br />
Movement in inventories (149) (459)<br />
Cost of goods sold 8,761 6,570<br />
Audited annual financial statements<br />
Annual Financial Statements 2011<br />
51
GROUP – NOTES TO THE ANNUAL FINANCIAL STATEMENTS<br />
FOR THE YEAR ENDED 31 DECEMBER<br />
16. OPERATING PROFIT<br />
Rand million 2011 2010<br />
Operating profit includes the following amounts, some of which are also included in the analysis of<br />
operating expenses disclosed in note 15:<br />
Staff costs<br />
Employee expenses 2,408 2,078<br />
Share-based payments expenses 369 206<br />
Directors’ emoluments (refer to remuneration report on page 24) 18 15<br />
Executive directors<br />
– Emoluments received as directors of the company (excluding fair value of incentive awards) 10 8<br />
– Bonuses and cash incentives 4 4<br />
Non-executive directors – emoluments received as directors of the company 4 3<br />
Prescribed officers remuneration (excluding executive directors – refer to remuneration report on page 24) 28 28<br />
Depreciation of property, plant and equipment (refer to note 1) 998 765<br />
Operating lease rental expenses<br />
Property 67 45<br />
Equipment 56 34<br />
Borrowings facility fee 6 12<br />
Auditors' remuneration<br />
Audit fees 8 6<br />
Other services 1 1<br />
Provision for doubtful other receivables – 5<br />
Impairment of trade receivables – 1<br />
Research and development cost 1 3<br />
Reconditioned spares usage 4 2<br />
Net loss on disposal of investment – 2<br />
Net loss on disposal or scrapping of property, plant and equipment 10 5<br />
Operating sublease rentals received<br />
Property (8) (6)<br />
Other – (2)<br />
17. FINANCE GAINS/(LOSSES)<br />
Rand million 2011 2010<br />
Finance (losses)/gains recognised in operating profit<br />
Net (losses)/gains on derivative financial instruments<br />
Realised (473) 626<br />
Unrealised (14) 10<br />
Net foreign currency gains/(losses)<br />
Realised 1,000 (279)<br />
Unrealised 74 (71)<br />
587 286<br />
18. FINANCE INCOME/(COSTS)<br />
Rand million 2011 2010<br />
Interest expense (337) (432)<br />
Notional interest on non-current provisions (refer to note 10) (59) (42)<br />
Capitalisation of borrowing costs (refer to note 28) 247 296<br />
Finance costs (149) (178)<br />
Interest received 241 149<br />
Net finance income/(costs) 92 (29)<br />
52 <strong>Kumba</strong> <strong>Iron</strong> <strong>Ore</strong> Limited
19. TAXATION<br />
Rand million 2011 2010<br />
Taxation expense<br />
Current taxation 5,344 6,318<br />
Deferred taxation 2,614 (390)<br />
STC 1,802 885<br />
9,760 6,813<br />
Charge to the income statement<br />
South African normal taxation<br />
Current year 5,389 6,292<br />
Prior year (120) –<br />
Foreign taxation<br />
Current year 74 44<br />
Prior year 1 (18)<br />
STC 1,802 885<br />
Income taxation 7,146 7,203<br />
Deferred taxation<br />
Current year 2,614 (399)<br />
Prior years – 9<br />
9,760 6,813<br />
% 2011 2010<br />
Reconciliation of taxation rates<br />
Taxation as a percentage of profit before taxation 30.4 27.1<br />
Taxation effect of:<br />
Disallowable expenditure (0.1) (0.1)<br />
Exempt income 2.2 2.6<br />
Deferred tax asset raised in the current year on unrecognised taxation losses brought forward 0.7 1.8<br />
Rate difference on tax rate 0.2 0.2<br />
STC (5.6) (3.5)<br />
Prior year underprovision 0.4 –<br />
Equity-settled share-based payments (0.2) (0.3)<br />
Foreign exchange translation differences – 0.2<br />
Standard taxation rate 28.0 28.0<br />
20. PER SHARE INFORMATION<br />
Attributable earnings per share is calculated by dividing profit attributable to shareholders of <strong>Kumba</strong> by the weighted average number of ordinary<br />
shares in issue during the year, excluding ordinary shares purchased by the group and held as treasury shares.<br />
Audited annual financial statements<br />
For the diluted earnings per share, the weighted average number of ordinary shares in issue is adjusted to assume conversion of all potential<br />
dilutive ordinary shares as a result of share options granted to employees under the employee share incentive schemes. A calculation is<br />
performed to determine the number of shares that could have been acquired at fair value, determined as the average annual market share price<br />
of the company’s shares based on the monetary value of the subscription rights attached to the outstanding share options.<br />
Rand million 2011 2010<br />
Profit attributable to equity holders of <strong>Kumba</strong> 17,042 14,323<br />
Number of shares<br />
Weighted average number of ordinary shares in issue 320,895,696 320,727,067<br />
Potential dilutive effect of outstanding share options 836,000 964,068<br />
Diluted weighted average number of ordinary shares in issue 321,731,696 321,691,135<br />
Annual Financial Statements 2011<br />
53
GROUP – NOTES TO THE ANNUAL FINANCIAL STATEMENTS<br />
FOR THE YEAR ENDED 31 DECEMBER<br />
20. PER SHARE INFORMATION continued<br />
Rand million<br />
2011<br />
Gross<br />
adjustment<br />
2011<br />
Net<br />
attributable<br />
2010<br />
Gross<br />
adjustment<br />
2010<br />
Net<br />
attributable<br />
Profit attributable to equity holders of <strong>Kumba</strong> 17,042 17,042 14,323 14,323<br />
Net loss on disposal or scrapping of property, plant and equipment 10 6 5 3<br />
Net loss on disposal of investment – – 2 2<br />
17,052 17,048 14,330 14,328<br />
Taxation effect of adjustments (3) (1)<br />
Minority interest in adjustments (1) (1)<br />
Headline earnings 17,048 17,048 14,328 14,328<br />
Rand million 2011 2010<br />
Attributable earnings per share<br />
Basic 53.11 44.66<br />
Diluted 52.97 44.52<br />
Headline earnings per share<br />
Basic 53.13 44.67<br />
Diluted 52.99 44.54<br />
Dividend per share 44.20 34.50<br />
Interim 21.70 13.50<br />
Final 22.50 21.00<br />
21. SHARE CAPITAL AND SHARE PREMIUM (including treasury shares)<br />
Number of shares 2011 2010<br />
Authorised<br />
Ordinary shares of R0.01 each 500,000,000 500,000,000<br />
Issued<br />
Ordinary shares of R0.01 each 322,058,624 321,911,721<br />
Reconciliation of issued shares<br />
Number of shares at beginning of year 321,911,721 320,415,081<br />
Number of ordinary shares issued 5,377,770 1,496,640<br />
Number of ordinary shares repurchased and cancelled (5,230,867) –<br />
Number of shares at end of year 322,058,624 321,911,721<br />
Shares held in reserve reconciliation<br />
Authorised shares at the beginning of year not issued 178,088,279 179,584,919<br />
Shares issued (140,000) (1,342,852)<br />
Shares held by the <strong>Kumba</strong> <strong>Iron</strong> <strong>Ore</strong> Management Share Trust (6,903) (153,788)<br />
Unissued shares 177,941,376 178,088,279<br />
The unissued shares are under the control of the directors of <strong>Kumba</strong> until the next AGM.<br />
Rand million 2011 2010<br />
Reconciliation of share capital and premium<br />
Balance at beginning of year 153 208<br />
Total shares issued for cash consideration 16 74<br />
Shares issued – share premium 16 80<br />
Net movement in shares held by <strong>Kumba</strong> <strong>Iron</strong> <strong>Ore</strong> Management Share Trust – (6)<br />
Net movement in treasury shares under employee share incentive schemes (139) (129)<br />
Purchase of treasury shares employee share incentive schemes (278) (191)<br />
Shares issued to employees under employee share incentive schemes 139 62<br />
Share capital and premium at end of year 30 153<br />
Consists of:<br />
Share capital 3 3<br />
Share premium 27 150<br />
54 <strong>Kumba</strong> <strong>Iron</strong> <strong>Ore</strong> Limited
22. EQUITY-SETTLED SHARE-BASED PAYMENTS RESERVE<br />
Unrecognised share-based<br />
payment expense at<br />
31 December<br />
Recognised share-based<br />
payment expense<br />
Rand million 2011 2010 2011 2010<br />
Balance at beginning of year 487 466<br />
Equity-settled share-based payments expense<br />
Employee share incentive schemes 2,327 200 352 195<br />
– Envision Phase 1 – 119 168 123<br />
– Envision Phase 2 2,227 – 104 –<br />
– Bonus Share Plan (BSP) 94 69 71 39<br />
– Long-term Incentive Plan (LTIP) 6 11 8 24<br />
– Share Appreciation Rights Scheme (SARS) – 1 1 7<br />
– Deferred Bonus Plan (2011 and 2010: < R1 million) – – – –<br />
– Management Share Option Scheme – – – 2<br />
Vesting of shares under employee share incentive schemes (445) (166)<br />
Change in effective ownership of SIOC (refer to note 23) – (16)<br />
Non-controlling interest (87) 8<br />
Balance at end of year 307 487<br />
Employee share incentive schemes<br />
Employees of the group participate in the following share incentive schemes. Refer to annexure 3: share-based payments for details of each<br />
share scheme.<br />
Bonus Share Plan<br />
The BSP for executive directors and senior employees was implemented during 2009. The adoption and implementation of the scheme was<br />
approved by shareholders at the AGM on 20 March 2009. The BSP is offered to senior managers and key executives who have the opportunity<br />
and the responsibility to contribute towards the <strong>Kumba</strong>’s overall strategic objectives. The BSP has two components:<br />
– a payment of an annual cash bonus; and<br />
– a forfeitable award of shares linked to the participant’s annual cash bonus award known as Bonus Shares.<br />
The number of Bonus Shares awarded is determined with reference to the amount of the annual cash bonus an employee receives which is<br />
directly linked to the employee’s personal performance and potential. The shares are held by an escrow agent and released to the employee<br />
three years after the award date (subject to continuous employment). During the three-year period, the employee is entitled to all rights attaching<br />
to the Bonus Shares including dividend entitlements and voting rights.<br />
Long-term Incentive Plan<br />
Senior employees receive annual grants of conditional awards of <strong>Kumba</strong> shares.<br />
The conditional award will vest after the performance period of three years, and to the extent that specific performance conditions have been<br />
satisfied. No retesting of the performance conditions is allowed. The performance conditions for the LTIP awards made to date are subject to the<br />
achievement of stretching performance targets relating to total shareholder return (TSR) and to an operating measure, currently return on capital<br />
employed (ROCE), over a fixed three-year period.<br />
Audited annual financial statements<br />
The performance conditions will determine if, and to what extent, the conditional award will vest. Upon vesting the employee will be entitled to<br />
shares in <strong>Kumba</strong> to settle the value of the vested portion of the conditional award. The conditional awards which do not vest at the end of the<br />
three-year period will lapse.<br />
Upon retrenchment, ill-health, disability, retirement or death a proportion of unvested conditional awards shall vest on the date of cessation<br />
of employment. The proportion of awards that vest under the LTIP would reflect the number of months’ service and in the opinion of the<br />
Remuneration Committee the extent to which the performance conditions have been met. On resignation or termination of employment all<br />
unexercised (vested and unvested) conditional awards will lapse on the date of cessation of employment.<br />
The main intention of the LTIP is to settle the benefits by delivering shares in <strong>Kumba</strong> to employees.<br />
The aggregate number of shares which may be allocated under the LTIP when added to the total number of unvested conditional awards,<br />
unexercised SARS and share options allocated to employees under any other managerial share scheme, may not exceed 10% of the number of<br />
issued ordinary shares of <strong>Kumba</strong>.<br />
Share Appreciation Rights Scheme<br />
During 2007 and 2008 senior employees received annual grants of share appreciation rights, which are rights to receive <strong>Kumba</strong> shares equal to<br />
the value of the difference between the market value of a <strong>Kumba</strong> share on the day immediately preceding the date of exercise (exercise price)<br />
of the right and market value of the <strong>Kumba</strong> share on the day immediately preceding the date of grant of the right (grant price). No new grants<br />
have been made as the SARS was replaced with the BSP.<br />
Annual Financial Statements 2011<br />
55
GROUP – NOTES TO THE ANNUAL FINANCIAL STATEMENTS<br />
FOR THE YEAR ENDED 31 DECEMBER<br />
22. EQUITY-SETTLED SHARE-BASED PAYMENTS RESERVE continued<br />
The vesting of the rights is subject to specific performance conditions. The duration and specific nature of the conditions as determined by the<br />
Remuneration Committee of <strong>Kumba</strong> are stated in the letter of grant for each annual grant. The measurement of the performance conditions<br />
will be tested after three years. Retesting of the performance condition is permitted on the first and second anniversary of the end of the<br />
performance period. After vesting, the rights will become exercisable.<br />
<strong>Kumba</strong> will settle the value of the difference between the exercise price and the grant price, by delivering shares to the employee. Rights not<br />
exercised within seven years will lapse.<br />
Upon retrenchment, ill-health, disability, retirement or death a proportion of unvested rights shall vest on the date of cessation of employment.<br />
The proportion of awards that vest under the SARS would reflect the number of months’ service and in the opinion of the Remuneration<br />
Committee the extent to which the performance conditions have been met. On resignation or termination of employment all unexercised (vested<br />
and unvested) rights will lapse on the date of cessation of employment.<br />
Envision<br />
The implementation objective of Envision was to provide an incentive and retention initiative to employees who do not participate in the other<br />
share schemes of the group that are permanently employed by SIOC in South Africa.<br />
The acquisition of the interest in SIOC by Envision was funded by SIOC company in terms of a contribution agreement. The scheme’s first phase<br />
matured on 17 November 2011. A second phase was implemented on 10 November 2011, on the same terms and conditions as the first phase.<br />
Employee beneficiaries of Envision are entitled to receive 50% of any dividend received by Envision in respect of its underlying shareholding in<br />
SIOC and a distribution at the end of the first term (five years) of the SIOC shares remaining in Envision after the repurchase of certain SIOC<br />
shares in terms of the subscription agreement. Each employee will be entitled to receive <strong>Kumba</strong> shares which were swapped for the SIOC<br />
shares using the specific price earnings ratio of <strong>Kumba</strong> and the most recent earnings of SIOC at the end of the first term.<br />
Envision was structured as a ten-year scheme, divided into two capital appreciation periods. The first capital appreciation period vested on<br />
17 November 2011. The second capital appreciation period commenced on 10 November 2011 with the issue of 3.09% in the share capital of<br />
SIOC to the Envision trust. This resulted in a net increase in the non-controlling interest in SIOC of R4 million.<br />
The unwind of phase one resulted in a net cash outflow for the group through the implementation of the specific share repurchase by <strong>Kumba</strong><br />
undertaken to monetise the value for employee participants. The actual monetary impact was R2.7 billion, based on a <strong>Kumba</strong> five-day average<br />
share price of R508.82 per share on 17 November 2011. Included in the R2.7 billion is employees’ tax of R968 million paid to SARS during<br />
January 2012.<br />
Management Share Option Scheme<br />
Prior to the unbundling of <strong>Kumba</strong> Resources, senior employees and directors of Sishen <strong>Iron</strong> <strong>Ore</strong> Company participated in the <strong>Kumba</strong> Resources<br />
Management Share Option Scheme. At the time of unbundling in order to place, as far as possible, all participants in the <strong>Kumba</strong> Resources<br />
Management Share Option Scheme in the position they would have been in if they remained shareholders of the then <strong>Kumba</strong> Resources<br />
Limited, the schemes continued in <strong>Kumba</strong> and in Exxaro Resources Limited (Exxaro). The Management Share Option Scheme was adopted by<br />
the group post unbundling subject to certain amendments that were made to the <strong>Kumba</strong> Resources Management Share Option Scheme. As a<br />
result the senior employees and directors that participated in the <strong>Kumba</strong> Resources Management Share Option Scheme subsequently became<br />
participants of the new <strong>Kumba</strong> <strong>Iron</strong> <strong>Ore</strong> Management Share Option Scheme.<br />
Under the <strong>Kumba</strong> Resources Management Share Option Scheme, share options in <strong>Kumba</strong> Resources were granted to eligible employees at the<br />
market price of the underlying <strong>Kumba</strong> Resources shares at the date of the grant.<br />
The options granted under the scheme vest over a period of five years commencing on the first anniversary of the offer date except for some<br />
share options granted in 2005 that vest in multiples of 33.3% per year over a three-year period commencing on the first anniversary of the offer<br />
date. The vesting periods of these share options are as follows:<br />
<br />
<br />
<br />
<br />
<br />
Share options not exercised lapse by the seventh anniversary of the offer date.<br />
Participants of the <strong>Kumba</strong> <strong>Iron</strong> <strong>Ore</strong> Management Share Option Scheme and the Exxaro Resources Management Share Option Scheme<br />
exchanged each of their <strong>Kumba</strong> Resources share options for a share option in <strong>Kumba</strong> and Exxaro. The strike price of each <strong>Kumba</strong> Resources<br />
option was apportioned between <strong>Kumba</strong> and Exxaro share options with reference to the volume weighted average price (VWAP) at which<br />
<strong>Kumba</strong> (67.19%) and Exxaro Resources (32.81%) traded for the first 22 days post the implementation of the unbundling transaction.<br />
56 <strong>Kumba</strong> <strong>Iron</strong> <strong>Ore</strong> Limited
23. NON-CONTROLLING INTEREST<br />
Rand million 2011 2010<br />
Balance at beginning of year 4,038 1,650<br />
Profit for the year 5,256 3,966<br />
Exxaro 4,461 3,671<br />
SIOC Community Development SPV 669 234<br />
Envision 126 61<br />
Dividends paid (4,078) (1,834)<br />
Exxaro (3,516) (1,811)<br />
SIOC Community Development SPV (528) (4)<br />
Envision (126) (61)<br />
Recoupment of Envision dividend 92 42<br />
Interest in movement in equity reserves (457) 256<br />
Change in effective ownership of SIOC (refer to note 22 – Envision) (4) 301<br />
Equity-settled share-based payments reserve 87 (8)<br />
Vesting of shares under share incentive schemes (excluding Envision) (146) –<br />
Vesting of shares under Envision (500) –<br />
Foreign currency translation reserve 83 (49)<br />
Cash flow hedge accounting reserve 23 12<br />
Balance at end of year 4,759 4,038<br />
The recoupment of the Envision dividend of R92 million (2010: R42 million) arises from SIOC’s participation as income beneficiary in Envision.<br />
24. CASH GENERATED FROM OPERATIONS<br />
Rand million 2011 2010<br />
Operating profit 31,966 25,131<br />
Adjusted for<br />
Foreign exchange differences on translation of foreign operations (733) 155<br />
Depreciation of property, plant and equipment 998 765<br />
Movement in provisions 113 108<br />
Unrealised foreign currency revaluations and fair value adjustments (62) 61<br />
Reconditionable spares used 4 2<br />
Loss on disposal or scrapping of property, plant and equipment 10 5<br />
Movement in non-current financial assets and prepayments (235) (118)<br />
Equity-settled share-based payment expenses 352 195<br />
Cash-settled share-based payment provision 18 11<br />
Cash flows from operations 32,431 26,315<br />
Working capital movements<br />
Increase in inventories (429) (607)<br />
Decrease/(increase) in trade and other receivables 235 (1,379)<br />
Increase in trade and other payables 394 1,226<br />
32,631 25,555<br />
Audited annual financial statements<br />
Annual Financial Statements 2011<br />
57
GROUP – NOTES TO THE ANNUAL FINANCIAL STATEMENTS<br />
FOR THE YEAR ENDED 31 DECEMBER<br />
25. NET FINANCE COSTS PAID<br />
Rand million 2011 2010<br />
Net financing costs as per income statement 92 (29)<br />
Adjusted for:<br />
Notional interest on non-current provisions (refer to note 10) 59 42<br />
Capitalisation of borrowing costs (refer to note 18) (247) (296)<br />
(96) (283)<br />
26. TAXATION PAID<br />
Rand million 2011 2010<br />
Net taxation (liability)/receivable at beginning of year (61) 109<br />
Income taxation per the income statement (refer to note 19) (7,146) (7,203)<br />
Translation of taxation for foreign operations (16) 2<br />
(7,223) (7,092)<br />
Net current taxation liability per balance sheet 188 61<br />
Taxation paid per the cash flow statement (7,035) (7,031)<br />
Comprising normal taxation:<br />
South Africa (7,033) (7,029)<br />
Foreign (2) (2)<br />
(7,035) (7,031)<br />
27. DIVIDENDS PAID<br />
Rand million 2011 2010<br />
Dividends per the statement of changes in equity (13,834) (6,756)<br />
Recoupment of Envision dividend (refer to note 23) 92 42<br />
(13,742) (6,714)<br />
Dividends paid to non-controlling shareholders<br />
Dividends per the statement of changes in equity (4,078) (1,834)<br />
Recoupment of Envision dividend (refer to note 23) (92) (42)<br />
(4,170) (1,876)<br />
28. ADDITIONS TO PROPERTY, PLANT AND EQUIPMENT<br />
Rand million 2011 2010<br />
Replacement of property, plant and equipment (2,745) (1,560)<br />
Reconditionable spares – (64)<br />
Investments to maintain operations (2,745) (1,624)<br />
Investment to expand operations (3,104) (3,099)<br />
Additions per the cash flow statement (5,849) (4,723)<br />
Borrowing costs capitalised (refer to note 18) (247) (296)<br />
Movement in capital creditor 112 –<br />
Additions per note 1 (5,984) (5,019)<br />
58 <strong>Kumba</strong> <strong>Iron</strong> <strong>Ore</strong> Limited
29. FINANCIAL INSTRUMENTS<br />
The group is exposed to credit risk, liquidity risk and market risk (currency risk and interest rate risk) from the use of financial instruments.<br />
Overall responsibility for establishment and oversight of the risk management framework rests with the board of directors. The Risk Committee,<br />
a committee of the board, is responsible for the development and monitoring of the group’s risk management process.<br />
The group maintains an integrated, enterprise-wide, risk management programme (IRM). The group applies a logical, systematic and repetitive<br />
methodology to identify, analyse, assess, treat and monitor all risks, whether they are insurable or not. The risk management process is<br />
continuous, with well-defined steps, which support better decision-making by contributing a greater insight into risks and their impacts. Risks<br />
from all sources are identified and once they pass the materiality threshold, a formal process begins in which causal factors and consequences<br />
are identified and the correlation with other risks and the current risk-mitigating strategy is reviewed. One of the challenges is to ensure that<br />
mitigating strategies are geared to deliver reliable and timely risk information to support better decision-making.<br />
The risk assessment and reporting criteria are designed to provide the Executive Committee and the board, via the Risk Committee, with a<br />
consistent, enterprise-wide perspective of the key risks. The reports which are submitted monthly to the Executive Committee and quarterly to the<br />
Risk Committee include an assessment of the likelihood and impact of risks materialising, as well as risk mitigation initiatives and their effectiveness.<br />
In conducting its review of the effectiveness of risk management, the board considers the key findings from the ongoing monitoring and<br />
reporting processes, management assertions and independent assurance reports. The board also takes into account material changes and<br />
trends in the risk profile and consider whether the control system, including reporting, adequately supports the board in achieving its risk<br />
management objectives.<br />
SIOC in conjunction with Anglo American SA Finance Limited (a subsidiary of the ultimate holding company) provide a treasury function to the<br />
group, co-ordinates access to domestic and international financial markets, and manages the financial risks relating to the group’s operations.<br />
MEASUREMENT BASIS OF FINANCIAL INSTRUMENTS<br />
Fair value<br />
Rand million<br />
Notes<br />
Amortised<br />
cost<br />
through<br />
profit or loss Total<br />
2011<br />
Financial assets<br />
Investments held by the environmental trust 4 285 283 568<br />
Trade receivables 7 2,249 – 2,249<br />
Other receivables (excluding VAT and prepayments) 7 248 – 248<br />
Derivative financial instruments 7 – 90 90<br />
Cash and cash equivalents 8 4,742 – 4,742<br />
Financial liabilities<br />
Interest-bearing borrowings 9 (3,191) – (3,191)<br />
Trade payables 12 (1,672) – (1,672)<br />
Other payables 12 (2,870) – (2,870)<br />
Derivative financial instruments 12 – (14) (14)<br />
(209) 359 150<br />
2010<br />
Financial assets<br />
Investments held by the environmental trust 4 301 71 372<br />
Trade receivables 7 2,058 – 2,058<br />
Other receivables (excluding VAT and prepayments) 7 265 – 265<br />
Derivative financial instruments 7 – 78 78<br />
Cash and cash equivalents 8 4,855 – 4,855<br />
Financial liabilities<br />
Interest-bearing borrowings 9 (3,185) – (3,185)<br />
Trade payables 12 (1,595) – (1,595)<br />
Other payables 12 (1,510) – (1,510)<br />
Derivative financial instruments 12 – (30) (30)<br />
1,189 119 1,308<br />
Audited annual financial statements<br />
Annual Financial Statements 2011<br />
59
GROUP – NOTES TO THE ANNUAL FINANCIAL STATEMENTS<br />
FOR THE YEAR ENDED 31 DECEMBER<br />
29. FINANCIAL INSTRUMENTS continued<br />
Credit risk<br />
Credit risk is the risk of financial loss to the group if a counterparty to a financial instrument fails to meet its contractual obligations. The group<br />
limits its counterparty exposure arising from money market and derivative instruments by dealing only with well-established financial institutions<br />
of high credit standing.<br />
The group’s exposure and the credit ratings of its counterparties are continuously monitored and the aggregate value of transactions concluded are<br />
spread amongst approved counterparties. Credit exposure is controlled by counterparty limits that are reviewed and approved by the board annually.<br />
The group has established policies and guidelines that are followed for specific exposure limits when transacting in derivative financial instruments.<br />
The carrying amount of the financial assets as set out above, represents the group’s maximum exposure to credit risk.<br />
An analysis of the credit risk of these financial assets is provided under the individual notes specified above. The group does not hold any<br />
collateral in respect of its financial assets subject to credit risk.<br />
Liquidity risk<br />
Liquidity risk is the risk that the group will be unable to meet its financial obligations as they become due. The group manages liquidity risk by<br />
ensuring sufficient cash is available to meet expected operational expenses as well as sufficient cash resources and credit facilities to meet its<br />
liabilities when due. The group’s credit facilities are detailed under note 9.<br />
MATURITY PROFILE OF THE GROUP’S FINANCIAL INSTRUMENTS:<br />
Rand million Notes Within 1 year 1 to 2 years<br />
3 or<br />
more years Total<br />
2011<br />
Financial assets<br />
Investments held by the environmental trust 4 – – 568 568<br />
Trade receivables 7 2,249 – – 2,249<br />
Other receivables (excluding VAT and prepayments) 7 247 – 1 248<br />
Cash and cash equivalents 8 4,742 – – 4,742<br />
Derivative financial instruments 7 90 – – 90<br />
Financial liabilities<br />
Interest-bearing borrowings 9 (3,191) – – (3,191)<br />
Trade payables 12 (1,672) – – (1,672)<br />
Other payables 12 (2,870) – – (2,870)<br />
Derivative financial instruments 12 (14) – – (14)<br />
(419) – 569 150<br />
2010<br />
Financial assets<br />
Investments held by the environmental trust 4 – – 372 372<br />
Trade receivables 7 2,058 – – 2,058<br />
Other receivables (excluding VAT and prepayments) 7 264 – 1 265<br />
Cash and cash equivalents 8 4,855 – – 4,855<br />
Derivative financial instruments 7 78 – – 78<br />
Financial liabilities<br />
Interest-bearing borrowings 9 – (3195) (3,195)<br />
Trade payables 12 (1,595) – – (1,595)<br />
Other payables 12 (1,510) – – (1,510)<br />
Derivative financial instruments 12 (30) – – (30)<br />
4,120 (3,195) 373 1,298<br />
Market risk<br />
Market risk includes currency risk, interest rate risk and other price risk.<br />
Currency risk<br />
Currency risk is the risk that the fair value or future cash flows of a financial instrument will fluctuate in rands due to changes in foreign<br />
exchange rates. The group undertakes transactions denominated in currencies other than the respective functional currencies of the entities<br />
within the group. Through these transactions the group is exposed to currency risk.<br />
<strong>Kumba</strong>’s iron ore export prices are determined in US dollars and the company negotiates iron ore prices in that currency with customers.<br />
Currency movements of the US dollar against the rand therefore could have a significant effect on the financial position and results of <strong>Kumba</strong>.<br />
The group undertakes transactions denominated in foreign currencies, hence exposures to exchange rate fluctuations arise which may expose<br />
it to economic or accounting losses. Treasury continues to sell US dollar export proceeds on a short term rolling forward basis with the view of<br />
reducing any short term cash borrowings and matching the cash requirements of the company on a day to day basis. US dollar export proceeds<br />
acts as a natural hedge for operating activities while major capital expenditure is hedged.<br />
60 <strong>Kumba</strong> <strong>Iron</strong> <strong>Ore</strong> Limited
29. FINANCIAL INSTRUMENTS continued<br />
The average US dollar/rand exchange rate for 2011 of USD1: R7.25 (2010: USD1: R7.30) has been used to translate income and cash flow<br />
statements, whilst the balance sheet has been translated at the closing rate at the last day of the reporting year using an exchange rate of<br />
USD1: R8.18 (2010: USD1: R6.63). The group’s financial instrument exposure to currency risk is analysed under the individual note for each<br />
financial instrument at balance sheet date.<br />
NET CURRENCY EXPOSURE OF THE GROUP’S FINANCIAL INSTRUMENTS, EXCLUDING DERIVATIVES<br />
Rand million<br />
Financial<br />
assets<br />
Financial<br />
liabilities<br />
Net<br />
exposure<br />
2011<br />
Rand 5,343 (7,374) (2,031)<br />
US dollar 2,455 (340) 2,115<br />
Euro 6 (19) (13)<br />
Other 3 – 3<br />
7,807 (7,733) 74<br />
2010<br />
Rand 4,265 (6,110) (1,845)<br />
US dollar 3,270 (143) 3,127<br />
Euro 8 (37) (29)<br />
Other 7 – 7<br />
7,550 (6,290) 1,260<br />
The group uses derivative financial instruments to reduce the uncertainty over future cash flows arising from movements in currencies in which<br />
it transacts. Currency risk is managed within board-approved policies and guidelines, which restrict the use of derivative financial instruments<br />
to the hedging of specific underlying currencies. Exchange rate exposures are managed within approved policy parameters utilising forward<br />
exchange contracts (FECs).<br />
The group maintains a fully covered exchange rate position in respect of imported capital equipment resulting in these exposures being fully<br />
converted to rand. Trade-related import exposures are managed through the use of natural hedges arising from export revenue as well as<br />
through short-term FECs.<br />
OUTSTANDING EXPOSURE AT 31 DECEMBER IN RESPECT OF DERIVATIVE FINANCIAL INSTRUMENTS<br />
Rand million<br />
Foreign<br />
amount<br />
(million)<br />
Market<br />
related value<br />
Contract<br />
value<br />
Recognised<br />
fair value<br />
in equity<br />
Derivative instruments – cash flow hedges<br />
FECs related to commitments for the import of capital equipment<br />
2011<br />
US dollar 40 328 286 42<br />
Euro 1 13 14 (1)<br />
341 300 41<br />
2010<br />
US dollar – 2 2 –<br />
Euro 3 27 30 3<br />
29 32 3<br />
Audited annual financial statements<br />
Rand million<br />
Foreign<br />
amount<br />
(million)<br />
Market<br />
related value<br />
Contract<br />
value<br />
Recognised<br />
fair value in<br />
profit or loss<br />
Derivative instruments – held for trading<br />
2011<br />
FECs related to the repatriation of foreign cash receipts<br />
US dollar 180 1,466 1,505 39<br />
1,466 1,505 39<br />
2010<br />
FECs related to the repatriation of foreign cash receipts<br />
US dollar 130 863 925 62<br />
FECs related to future commitments for the import of capital equipment<br />
US dollar (15) (99) (107) (8)<br />
Euro – (3) (6) (3)<br />
761 812 51<br />
Annual Financial Statements 2011<br />
61
GROUP – NOTES TO THE ANNUAL FINANCIAL STATEMENTS<br />
FOR THE YEAR ENDED 31 DECEMBER<br />
29. FINANCIAL INSTRUMENTS continued<br />
Sensitivity analysis<br />
A movement in exchange rates of 5%, with all other variables held constant, against the US dollar would have increased/(decreased) profit or<br />
loss and equity by the amounts shown below.<br />
The impact on equity includes the after-tax impact of the movements in profit or loss. The analysis has been performed on the basis of the<br />
change occurring at the start of the reporting period and is performed on the same basis for 2010.<br />
This analysis considers the impact of changes in foreign exchange rates on profit or loss and equity, excluding foreign exchange translation<br />
differences resulting from the translation of group entities that have a functional currency different from the presentation currency, into the<br />
group’s presentation currency (and recognised in the foreign currency translation reserve).<br />
Impact on profit or loss Impact on equity<br />
Rand million<br />
Increase Decrease Increase Decrease<br />
2011<br />
US dollar 91 (91) 66 (66)<br />
2010<br />
US dollar 58 (58) 42 (42)<br />
Interest rate risk<br />
Interest rate risk arises from the group’s floating rate borrowings and the floating rate cash balances which exist. The company is not exposed to fair<br />
value interest rate risk as the company does not have any fixed interest bearing financial instruments carried at fair value. As part of the process of<br />
managing the company’s interest rate risk, interest rate characteristics of new borrowings and the refinancing of existing borrowings are positioned<br />
according to expected movements in interest rates. For further details on long-term borrowings refer to note 9 ‘Interest-bearing borrowings’.<br />
Sensitivity analysis<br />
Changes in market interest rates affect the interest income or expense of floating rate financial instruments. A change in the market interest rate<br />
of 50 basis points, with all other variables held constant, would have increased/(decreased) profit or loss and equity by the amounts shown below.<br />
The impact on equity includes the after-tax impact of the movements in profit or loss. The analysis has been performed on the basis of the<br />
change occurring at the start of the reporting period and is performed on the same basis for 2010.<br />
Impact on profit or loss Impact on equity<br />
Rand million<br />
Increase Decrease Increase Decrease<br />
2011<br />
Floating interest rate instruments (8) 8 (6) 6<br />
2010<br />
Floating interest rate instruments (8) 8 (6) 6<br />
Price risk<br />
The group is not exposed to commodity price risk, as the value of its financial assets or liabilities are not subject to commodity price movements.<br />
The group is exposed to equity securities price risk from equity investments held by the environmental trust. Refer to note 4 ‘Investments held by<br />
environmental trust’.<br />
Fair value<br />
The fair values of cash and cash equivalents, trade and other receivables and trade and other payables approximate the respective carrying<br />
amounts of these financial assets and financial liabilities because of the short period to maturity of these instruments. The fair value of interestbearing<br />
borrowings is disclosed in note 9.<br />
Level 1 1 Level 2 2 Level 3 3<br />
Fair value measurements recognised in the consolidated balance sheet<br />
2011<br />
Investments held by the environmental trust (refer to note 4) 283 – –<br />
Derivative financial assets 90 – –<br />
Derivative financial liabilities (14) – –<br />
359 – –<br />
2010<br />
Investments held by the environmental trust (refer to note 4) – 71 –<br />
Derivative financial assets 78 – –<br />
Derivative financial liabilities (30) – –<br />
48 71 –<br />
1 Level 1 fair value measurements are derived from unadjusted quoted prices in active markets for identical assets or liabilities.<br />
2 Level 2 fair value measurements are derived from inputs other than quoted prices included within level 1 that are observable either directly or indirectly (i.e. derived from prices).<br />
3 Level 3 fair value measurements are derived from valuation techniques that include inputs that are not based on observable market data.<br />
There were no transfers between level 1 and level 2 during the year. This was also the case in 2010.<br />
62 <strong>Kumba</strong> <strong>Iron</strong> <strong>Ore</strong> Limited
29. FINANCIAL INSTRUMENTS continued<br />
Fair value gains and losses recognised in operating profit are disclosed in note 17, ‘Finance gains/(losses)’. All gain and losses included in other<br />
comprehensive income relate to cash flow hedges in respect of future commitments for the import of capital equipment held at the end of the<br />
reporting period.<br />
Capital management<br />
The group strives to maintain strong credit ratings. In managing its capital, the group focuses on a sound net debt position, return on<br />
shareholders’ equity (or return on capital employed) and the level of dividends to shareholders. Neither the company nor any of its subsidiaries<br />
are subject to externally imposed capital requirements.<br />
The group’s net cash position at balance sheet dates was as follows:<br />
Rand million 2011 2010<br />
Long-term interest-bearing borrowings – 3,185<br />
Short-term interest-bearing borrowings 3,191 –<br />
Total 3,191 3,185<br />
Cash and cash equivalents (4,742) (4,855)<br />
Net cash (1,551) (1,670)<br />
Total equity 20,592 18,376<br />
It is the intention of management to fund <strong>Kumba</strong>’s capital projects through debt financing and available cash resources.<br />
The undrawn short- and long-term borrowing facilities available to the group are R9.1 billion (2010: R9.3 billion). <strong>Kumba</strong> was not in breach of<br />
any of its covenants during the current year.<br />
30. EMPLOYEE BENEFITS<br />
Retirement fund<br />
Independent funds provide pension and other benefits for all permanent employees and their dependants. At the end of 2011 and 2010 the<br />
following funds were in existence:<br />
– <strong>Kumba</strong> <strong>Iron</strong> <strong>Ore</strong> Selector Pension Fund and <strong>Kumba</strong> <strong>Iron</strong> <strong>Ore</strong> Selector Provident Fund, both operating as defined contribution funds; and<br />
– Iscor Employees Umbrella Provident Fund, operating as a defined contribution fund.<br />
Members pay contributions of 7% and an employers’ contribution of 9.5% is expensed as incurred.<br />
All funds are governed by the South African Pension Funds Act of 1956.<br />
Defined contribution funds<br />
Membership of each fund and employer contributions to each fund were as follows:<br />
Working<br />
members<br />
2011<br />
Rand million<br />
Number<br />
Employer<br />
contributions<br />
2011<br />
Working<br />
members<br />
2010<br />
Number<br />
Employer<br />
contributions<br />
2010<br />
<strong>Kumba</strong> <strong>Iron</strong> <strong>Ore</strong> Selector Pension and Provident Funds 2,242 83 2,066 68<br />
Iscor Employees Umbrella Provident Fund 3,508 60 3,779 50<br />
Total 5,750 143 5,845 118<br />
Audited annual financial statements<br />
Due to the nature of these funds, the accrued liabilities definition equates to the total assets under control of these funds.<br />
Medical fund<br />
The group contributes to defined benefit medical aid schemes for the benefit of permanent employees and their dependants. The contributions<br />
charged against income amounted to R93 million (2010: R76 million). The group has no obligation to fund medical aid contributions for current<br />
or retired employees.<br />
Annual Financial Statements 2011<br />
63
GROUP – NOTES TO THE ANNUAL FINANCIAL STATEMENTS<br />
FOR THE YEAR ENDED 31 DECEMBER<br />
31. GUARANTEES AND LEGAL PROCEEDINGS<br />
Rand million 2011 2010<br />
Guarantees<br />
Environmental trust closure liability 868 583<br />
868 583<br />
Environmental obligations<br />
During 2011 SIOC issued financial guarantees to the DMR to the value of R286 million (2010: R567 million) in respect of the environmental<br />
rehabilitation and decommissioning obligations of the group.<br />
Legal proceedings<br />
ArcelorMittal SA Limited (ArcelorMittal)<br />
SIOC notified ArcelorMittal on 5 February 2010, that it was no longer entitled to receive 6.25Mtpa of iron ore contract mined by SIOC at<br />
cost plus 3% from Sishen mine, as a result of the fact that ArcelorMittal had failed to convert its old order mining rights. This contract mining<br />
agreement, concluded in 2001, was premised on ArcelorMittal owning an undivided 21.4% interest in the mineral rights of Sishen mine. As a<br />
result of ArcelorMittal’s failure to convert its old order mining right, the contract mining agreement automatically lapsed and became inoperative<br />
in its entirety as of 1 May 2009.<br />
As a result, a dispute arose between SIOC and ArcelorMittal, which SIOC has referred to arbitration. During 2011, three arbitrators were<br />
appointed and May 2012 was set as the date for the arbitration to begin. On 9 December 2011, SIOC and ArcelorMittal agreed to postpone the<br />
arbitration until the final resolution of the mining right dispute.<br />
SIOC and ArcelorMittal reached an interim pricing arrangement in respect of the supply of iron ore to ArcelorMittal from Sishen mine. This<br />
interim arrangement endured until 31 July 2011. SIOC and ArcelorMittal agreed to an addendum to the interim supply agreement which<br />
extended the terms and conditions of the current interim pricing agreement. The new interim pricing agreement, which is on the same terms and<br />
conditions as the first interim pricing agreement, commenced on 1 August 2011 and will endure to 31 July 2012.<br />
21.4% undivided share of Sishen mine mineral rights<br />
After ArcelorMittal failed to convert its old order rights, SIOC applied for the residual 21.4% mining right previously held by ArcelorMittal and its<br />
application was accepted by the DMR on 4 May 2009. A competing application for a prospecting right over the same area was also accepted<br />
by the DMR. SIOC objected to this acceptance. Notwithstanding this objection, a prospecting right over the 21.4% interest was granted by the<br />
DMR to Imperial Crown Trading 289 (Pty) Limited (‘ICT’). SIOC initiated a review application in the North Gauteng High Court on 21 May 2010<br />
in relation to the decision of the DMR to grant a prospecting right to ICT.<br />
The High Court Review, in which SIOC challenged the award of the 21.4% prospecting right over Sishen mine by the DMR to ICT, was presided<br />
over by Judge Raymond Zondo in the North Gauteng High Court in Pretoria, South Africa, from 15 – 18 July 2011.<br />
On 21 December 2011, judgment was delivered in the High Court regarding the status of the mining rights at the Sishen mine. The High Court<br />
held that, upon the conversion of SIOC’s old order mining right relating to the Sishen mine properties in 2008, SIOC became the exclusive holder<br />
<br />
any decision taken by the DMR after such conversion in 2008 to accept or grant any further rights to iron ore at the Sishen mine properties was<br />
void. Finally, the High Court reviewed and set aside the decision of the Minister of Mineral Resources or her delegate to grant a prospecting right<br />
to ICT relating to the iron ore as a 21.4% share in respect of the Sishen mine properties. On 3 February 2012, both the DMR and ICT submitted<br />
applications for leave to appeal against the High Court judgment. SIOC has noted an application for leave to present a conditional cross appeal, in<br />
order to present its rights. SIOC is awaiting a date for the hearing of the application for leave to appeal.<br />
The High Court order does not affect the interim supply agreement between AMSA and SIOC, which will endure until 31 July 2012 as indicated above.<br />
SIOC will continue to take the necessary steps to protect its shareholders’ interests in this regard.<br />
Lithos Corporation (Pty) Limited (Lithos)<br />
Lithos Corporation (Pty) Limited is claiming USD421 million from <strong>Kumba</strong> for damages in relation to the Falémé Project in Senegal. <strong>Kumba</strong><br />
continues to defend the merits of the claim and is of the view, and has been so advised, that the basis of the claim and the quantification thereof<br />
is fundamentally flawed. The trial date has been postponed indefinitely. There have been no further developments in this matter.<br />
64 <strong>Kumba</strong> <strong>Iron</strong> <strong>Ore</strong> Limited
32. COMMITMENTS<br />
Rand million 2011 2010<br />
Operating lease commitments<br />
The future minimum lease payments under non-cancellable operating leases are as follows:<br />
Property<br />
Within 1 year 8 14<br />
Between 1 and 2 years 40 40<br />
2 to 5 years 27 47<br />
75 101<br />
Plant and equipment<br />
Within 1 year 11 2<br />
Between 1 and 2 years 2 –<br />
2 to 5 years 1 –<br />
14 2<br />
Other<br />
2 to 5 years – 1<br />
Total operating lease commitments 89 104<br />
Commitments – shipping services<br />
The future commitments under contracts for affreightment are as follows:<br />
Within 1 year 943 –<br />
Between 1 and 2 years 924 –<br />
2 to 5 years 2,817 –<br />
More than 5 years 4,784 –<br />
The future commitments for spot vessels are as follows:<br />
Within 1 year 148 73<br />
9,616 73<br />
33. CONTINGENT ASSETS AND LIABILITIES<br />
Falémé Project<br />
<strong>Kumba</strong> initiated arbitration proceedings against La Société des Mines De Fer Du Sénégal Oriental (Miferso) and the Republic of Senegal under<br />
the rules of the Arbitration of the International Chamber of Commerce in 2007, in relation to the Falémé Project.<br />
Following the arbitration award rendered in July 2010, a mutually agreed settlement was concluded between the parties. The parties agreed that<br />
the precise terms of the settlement agreement will remain confidential. The first settlement was paid by the Republic of Senegal in April 2011.<br />
The remaining settlement amount will be recovered in equal instalments from the Republic of Senegal over the remaining four-year period, on<br />
which contingent legal costs will be payable. A portion of the amount recovered was committed to social and community development projects to<br />
benefit the population of Senegal.<br />
Audited annual financial statements<br />
Other<br />
There have been no other significant changes in the contingent assets and liabilities disclosed at 31 December 2010.<br />
34. POST-BALANCE SHEET EVENTS<br />
The directors are not aware of any other matter or circumstance arising since the end of the year and up to the date of this report, not otherwise<br />
dealt with in this report.<br />
Annual Financial Statements 2011<br />
65
GROUP – NOTES TO THE ANNUAL FINANCIAL STATEMENTS<br />
FOR THE YEAR ENDED 31 DECEMBER<br />
35. RELATED PARTY TRANSACTIONS<br />
During the year the company and its subsidiaries, in the ordinary course of business, entered into various sale and purchase of goods and<br />
services with the ultimate holding company, Anglo American plc, its subsidiaries, associates and joint ventures. Certain deposits are also placed<br />
with the holding company (refer to note 8). The effect of these transactions is included in the results of the group. These transactions occurred<br />
under terms that are no less favourable than those arranged with third parties.<br />
Holding company<br />
Anglo American plc is the group’s ultimate holding company. The interest in the group is held through a 65.22% holding by Anglo South Africa<br />
Capital (Pty) Limited (2010: 65.25%).<br />
Subsidiaries<br />
Details of investments in and loans to/from subsidiaries are disclosed in annexure 1.<br />
Associates and joint ventures<br />
Details of investments in associates and joint ventures are disclosed in note 3 of the group financial statements and in annexure 2.<br />
Entities with significant influence over SIOC<br />
Exxaro is SIOC’s 20% Black Economic Empowerment shareholder. Details of dividends paid to Exxaro as well as its proportionate share of<br />
earnings for the year are detailed in note 23 of the group financial statements.<br />
Special purpose entities<br />
The group has an interest in the following special purpose entities which are consolidated:<br />
Entity<br />
SIOC Employee Share Participation Scheme (Envision)<br />
<strong>Kumba</strong> <strong>Iron</strong> <strong>Ore</strong> Rehabilitation Trust<br />
<strong>Kumba</strong> BSP Trust<br />
<strong>Kumba</strong> <strong>Iron</strong> <strong>Ore</strong> Management Share Trust<br />
Nature of business<br />
Investment vehicle<br />
Trust fund for mine closure<br />
Share incentive scheme administration<br />
Share incentive scheme administration<br />
Directors and prescribed officers<br />
Details relating to directors’ and the group’s Executive Committee remuneration and shareholdings (including share options) are disclosed in the<br />
remuneration report on pages 19 to 26.<br />
Shareholders<br />
The principal shareholders of the company are detailed under ‘Shareholder analyses’ on page 84.<br />
Material related party transactions<br />
Rand million 2011 2010<br />
Purchase of goods and services and finance charges<br />
Subsidiary of the ultimate holding company – 22<br />
Fellow subsidiaries 259 166<br />
Aircraft services 95 69<br />
Research 59 27<br />
Technical services 21 7<br />
Corporate Operations (including shared services) 67 42<br />
Scaw metals 16 21<br />
Other 1 –<br />
Associates and joint ventures – 174<br />
Enitities with significant influence over SIOC 1 58 53<br />
Finance income<br />
317 415<br />
Holding company 2 197 4<br />
Amounts owing to related parties (after eliminating intercompany balances)<br />
197 4<br />
Holding company<br />
Derivative financial instruments 14 30<br />
Fellow subsidiaries<br />
Trade payables 49 15<br />
63 45<br />
1 Goods were purchased from Exxaro and consisted mainly of ferrosilicon.<br />
2 Interest was earned at an average rate of 5.37% (2010: 5.30%) on cash deposits held with Anglo American SA Finance Ltd.<br />
66 <strong>Kumba</strong> <strong>Iron</strong> <strong>Ore</strong> Limited
35. RELATED PARTY TRANSACTIONS continued<br />
Rand million 2011 2010<br />
Amounts owing by related parties (after eliminating intercompany balances)<br />
Subsidiaries of ultimate holding company 3,980 1,472<br />
Interest receivable 5 3<br />
Cash and cash equivalents 3,885 1,391<br />
Derivative financial instruments 90 78<br />
Fellow subsidiaries<br />
Trade receivables 5 3<br />
Associates and joint ventures<br />
Loans 33 29<br />
4,018 1,504<br />
36. SEGMENT REPORTING<br />
The <strong>Kumba</strong> Executive Committee considers the business principally according to the nature of the products and service provided, with the<br />
identified segments each representing a strategic business unit.<br />
The total reported segment revenue comprises revenue from external customers as the group does not have any inter-segment revenue and is<br />
measured in a manner consistent with that disclosed in the income statement.<br />
The performance of the operating segments are assessed based on a measure of earnings before interest and tax (EBIT), which is consistent<br />
with ‘Operating profit’ in the financial statements. Finance income and finance costs are not allocated to segments, as treasury activity is<br />
managed on a central group basis.<br />
Total segment assets comprise finished goods inventory only, which is allocated based on the operations of the segment and the physical<br />
location of the asset.<br />
‘Other segments’ comprise corporate, administration and other expenditure not allocated to the reported segments.<br />
Rand million<br />
Sishen<br />
mine<br />
Thabazimbi<br />
mine<br />
Kolomela<br />
mine*<br />
Shipping<br />
operations Total<br />
2011<br />
Revenue (from external customers) 44,903 907 32 2,711 48,553<br />
EBIT 32,661 112 (80) 337 33,030<br />
Total segment assets 392 268 133 – 793<br />
2010<br />
Revenue (from external customers) 35,159 666 – 2,879 38,704<br />
EBIT 25,540 (44) – 319 25,815<br />
Total segment assets 682 306 – – 988<br />
* Kolomela mine represents a strategic business unit for <strong>Kumba</strong>, although it does not yet qualify as a reportable segment in terms of IFRS 8, Operating Segments.<br />
Audited annual financial statements<br />
Annual Financial Statements 2011<br />
67
GROUP – NOTES TO THE ANNUAL FINANCIAL STATEMENTS<br />
FOR THE YEAR ENDED 31 DECEMBER<br />
36. SEGMENT REPORTING continued<br />
REVENUE FROM EXTERNAL CUSTOMERS ANALYSED BY GOODS AND SERVICES<br />
Rand million 2011 2010<br />
Sale of products* 45,842 35,825<br />
Shipping services 2,711 2,879<br />
Revenue per the income statement 48,553 38,704<br />
Reconciliation of EBIT to total profit before taxation<br />
Total EBIT for reportable segments 33,030 25,815<br />
Other segments (1,064) (684)<br />
Operating profit 31,966 25,131<br />
Net finance costs/(income) 92 (29)<br />
Profit before taxation per the income statement 32,058 25,102<br />
Reconciliation of reportable segments' assets to total assets<br />
Segment assets for reportable segments 793 988<br />
Other segments and WIP inventory 3,071 2,114<br />
Inventory per balance sheet 3,864 3,102<br />
Other current assets 8,311 7,975<br />
Non-current assets 22,238 16,798<br />
Total assets per the balance sheet 34,413 27,875<br />
* Derived from extraction, production and selling of iron ore.<br />
GEOGRAPHICAL ANALYSIS<br />
<strong>Kumba</strong> is domiciled in South Africa. The result of its revenue from external customers and its non-current assets disclosed on a geographical<br />
basis, are set out below.<br />
Rand million 2011 2010<br />
Revenue from external customers<br />
South Africa 3,388 2,874<br />
Export 45,165 35,830<br />
China 29,904 23,112<br />
Rest of Asia 9,274 7,465<br />
Europe 5,450 4,896<br />
Middle East 227 300<br />
Americas/other 310 57<br />
Total revenue 48,553 38,704<br />
Non-current assets*<br />
South Africa 21,450 16,243<br />
China 2 2<br />
Total non-current assets 21,452 16,245<br />
* Excluding pre-payments, investments in associates and joint ventures and deferred tax assets.<br />
68 <strong>Kumba</strong> <strong>Iron</strong> <strong>Ore</strong> Limited
COMPANY BALANCE SHEET<br />
AS AT 31 DECEMBER<br />
BALANCE<br />
SHEET<br />
Rand million Notes 2011 2010<br />
Assets<br />
Investments in subsidiaries 1 213 834<br />
Deferred tax assets 2 1 1<br />
Non-current assets 214 835<br />
Other receivables – 8<br />
Current tax assets 10 23 4<br />
Cash and cash equivalents 3 147 543<br />
Current assets 170 555<br />
Total assets 384 1,390<br />
Equity and liabilities<br />
Share capital and premium 4 366 350<br />
Reserves (74) 993<br />
Total equity 292 1,343<br />
Liabilities<br />
Provisions 5 – –<br />
Non-current liabilities – –<br />
Loans from subsidiary companies 1 18 –<br />
Other payables 74 47<br />
Current liabilities 92 47<br />
Total liabilities 92 47<br />
Total equity and liabilities 384 1,390<br />
Audited annual financial statements<br />
Annual Financial Statements 2011<br />
69
COMPANY INCOME STATEMENT / STATEMENT OF CHANGES IN EQUITY<br />
FOR THE YEAR ENDED 31 DECEMBER<br />
INCOME<br />
STATEMENT<br />
Rand million Notes 2011 2010<br />
Net operating expenses 6 (44) (33)<br />
Operating loss (44) (33)<br />
Finance income 71 122<br />
Finance costs (1) –<br />
Income from investments 7 13,016 6,705<br />
Profit before taxation 13,042 6,794<br />
Taxation 8 (95) (35)<br />
Profit for the year 12,947 6,759<br />
Total comprehensive income for the year 12,947 6,759<br />
The company did not have any non-owner changes in equity during the year other than the profit for the year, therefore no separate statement of<br />
other comprehensive income is presented for the years ended 31 December 2011 and 2010.<br />
STATEMENT OF<br />
CHANGES IN EQUITY<br />
Share<br />
premium<br />
(note 4)<br />
Equity-settled<br />
share-based<br />
payment<br />
Rand million<br />
Share capital<br />
(note 4)<br />
Retained<br />
earnings Total<br />
Balance at beginning of year 3 267 202 518 990<br />
Shares issued during the period – 80 – – 80<br />
Equity-settled share-based payments – – 246 – 246<br />
Vesting of shares under employee share incentive schemes – – (3) (9) (12)<br />
Total comprehensive income for the year – – – 6,759 6,759<br />
Dividends paid – – – (6,720) (6,720)<br />
Balance at 31 December 2010 3 347 445 548 1,343<br />
Shares issued during the period – 16 – – 16<br />
Equity-settled share-based payments – – (244) – (244)<br />
Vesting of shares under employee share incentive schemes – – (7) (14) (21)<br />
Total comprehensive income for the year – – – 12,947 12,947<br />
Dividends paid – – – (13,749) (13,749)<br />
Balance at 31 December 2011 3 363 194 (268) 292<br />
70 <strong>Kumba</strong> <strong>Iron</strong> <strong>Ore</strong> Limited
COMPANY CASH FLOW STATEMENT<br />
FOR THE YEAR ENDED 31 DECEMBER<br />
CASH FLOW<br />
STATEMENT<br />
Rand million Notes 2011 2010<br />
Cash flows from operating activities<br />
Cash utilised by operations 9 3 6<br />
Net finance income 71 122<br />
Income from investments 13,016 6,705<br />
Taxation paid 10 (114) (16)<br />
Dividends paid (13,749) (6,720)<br />
(773) 97<br />
Cash flows from investing activities<br />
Redemption of long-term asset – 458<br />
Net increase/(decrease) in loans to subsidiaries 364 (164)<br />
364 294<br />
Cash flows from financing activities<br />
Share capital issued 4 16 80<br />
Increase in loans from subsidiaries 18 –<br />
Vesting of shares under employee share incentive schemes (21) (12)<br />
13 68<br />
Net (decrease)/increase in cash and cash equivalents (396) 459<br />
Cash and cash equivalents at beginning of year 543 84<br />
Cash and cash equivalents at end of year 3 147 543<br />
Audited annual financial statements<br />
Annual Financial Statements 2011<br />
71
COMPANY – NOTES TO THE ANNUAL FINANCIAL STATEMENTS<br />
FOR THE YEAR ENDED 31 DECEMBER<br />
NOTES TO THE ANNUAL<br />
FINANCIAL STATEMENTS<br />
1. INVESTMENTS IN SUBSIDIARIES<br />
Rand million 2011 2010<br />
Reflected as non-current assets<br />
Shares at cost 3 3<br />
Share-based payment expenditure* 149 406<br />
Long-term loans to subsidiaries 61 425<br />
Short-term loans from subsidiaries (18) –<br />
Net investments in subsidiaries 195 834<br />
* Arising from the accounting for share-based payment transactions in terms of IFRS 2.<br />
Investments in subsidiaries are accounted for at cost.<br />
For further details of interests in significant subsidiaries, refer to annexure 1.<br />
2. DEFERRED TAX ASSET<br />
Rand million 2011 2010<br />
Balance at beginning of year 1 1<br />
Balance at end of year 1 1<br />
Deferred tax asset attributable to the following temporary differences<br />
Leave pay accrual 1 1<br />
Total deferred tax assets 1 1<br />
3. CASH AND CASH EQUIVALENTS<br />
Rand million 2011 2010<br />
Cash 147 543<br />
Currency analysis of cash and cash equivalents<br />
Rand 147 543<br />
Credit risk<br />
Cash and cash equivalents are held in various financial institutions with long-term investment grade credit rating and with the capacity for<br />
payment of financial commitments considered strong.<br />
Fair value of cash and cash equivalents<br />
The carrying amount of cash and cash equivalents approximate their fair value because of the short period maturity of these instruments.<br />
72 <strong>Kumba</strong> <strong>Iron</strong> <strong>Ore</strong> Limited
4. SHARE CAPITAL AND SHARE PREMIUM<br />
Number of shares 2011 2010<br />
Authorised<br />
500,000,000 ordinary shares of R0.01 each 500,000,000 500,000,000<br />
Issued<br />
Ordinary shares of R0.01 each 322,058,624 321,911,721<br />
Reconciliation of issued shares<br />
Number of shares at beginning of year 321,911,721 320,415,081<br />
Number of ordinary shares issued 5,377,770 1,496,640<br />
Number of ordinary shares repurchased and cancelled (5,230,867) –<br />
Number of shares at end of year 322,058,624 321,911,721<br />
For further detail refer to the group annual financial statements.<br />
Rand million 2011 2010<br />
Reconciliation of share capital and premium<br />
Share capital 3 3<br />
Share premium 363 347<br />
366 350<br />
5. PROVISIONS<br />
Rand million 2011 2010<br />
Balance at beginning of year – 1<br />
Amounts utilised against provision 2 (2)<br />
Cash-settled share-based payments (2) 1<br />
Balance at end of year – –<br />
6. OPERATING (EXPENSES)/INCOME<br />
Rand million 2011 2010<br />
Cost by type<br />
Salaries and wages (18) (26)<br />
Equity-settled share-based payments (13) (14)<br />
Cash-settled share-based payments (2) (1)<br />
Pension and medical costs (9) (2)<br />
General charges (8) 4<br />
Cost recoveries 6 6<br />
(44) (33)<br />
The above costs are stated after including:<br />
Directors’ emoluments 18 15<br />
Executive directors<br />
Emoluments received as directors of the company 10 8<br />
Bonuses and cash incentives 4 4<br />
Non-executive directors – emoluments as directors of the company 4 3<br />
Audited annual financial statements<br />
7. INCOME FROM INVESTMENTS<br />
Rand million 2011 2010<br />
Dividends received from subsidiaries 13,016 6,705<br />
Annual Financial Statements 2011<br />
73
COMPANY – NOTES TO THE ANNUAL FINANCIAL STATEMENTS<br />
FOR THE YEAR ENDED 31 DECEMBER<br />
8. TAXATION<br />
Rand million 2011 2010<br />
Charge to income<br />
SA normal tax<br />
Current year 21 35<br />
STC 74 –<br />
Total 95 35<br />
% 2011 2010<br />
Reconciliation of taxation rates<br />
Taxation as a percentage of profit before taxation 0.7 0.5<br />
Taxation effect of:<br />
Capital profits (0.6) –<br />
Disallowable expenditure (0.1) (0.1)<br />
Exempt income 28.0 27.6<br />
Standard tax rate 28.0 28.0<br />
9. CASH UTILISED BY OPERATIONS<br />
Rand million 2011 2010<br />
Operating loss (44) (33)<br />
Adjusted for:<br />
Movement in provisions – (1)<br />
Share-based payment expense 13 15<br />
Cash flows from operations (31) (19)<br />
Working capital movements:<br />
Decrease in other receivables 8 12<br />
Increase in other payables 26 13<br />
3 6<br />
10. NORMAL TAXATION PAID<br />
Rand million 2011 2010<br />
Amounts unpaid at beginning of year (4) (23)<br />
Amounts charged to the income statement 95 35<br />
Amount paid during the period (114) (16)<br />
Current tax asset at end of year (23) (4)<br />
74 <strong>Kumba</strong> <strong>Iron</strong> <strong>Ore</strong> Limited
11. RELATED PARTY TRANSACTIONS<br />
During the year <strong>Kumba</strong> in the ordinary course of business, entered into various sale and purchase of goods and services transactions with its<br />
subsidiaries SIOC and Main Street 576 (Pty) Ltd as well as its holding company, Anglo American plc. The effects of these transaction is included<br />
in the results of <strong>Kumba</strong>. These transactions occurred under terms that are no less favourable than those arranged with third parties.<br />
Holding company<br />
Anglo American plc is <strong>Kumba</strong>’s ultimate holding company. The interest in <strong>Kumba</strong> is held through a 65.22% holding by Anglo South Africa Capital<br />
(Pty) Limited (2010: 65.25%).<br />
Subsidiaries<br />
Details of investments in and loans to/from subsidiaries are disclosed in annexure 1.<br />
Shareholders<br />
The principal shareholders of the company are detailed under “Shareholder analyses” on page 84.<br />
Material related party transactions<br />
Rand million 2011 2010<br />
Purchase of goods and services and finance charges<br />
Holding company – Anglo American plc 1 (2011 and 2010
ANNEXURE 1: INVESTMENTS IN SUBSIDIARIES<br />
FOR THE YEAR ENDED 31 DECEMBER<br />
ANNEXURE 1:<br />
INVESTMENTS IN SUBSIDIARIES<br />
Rand million<br />
Direct investments<br />
Country of<br />
incorporation 1<br />
Nature of %<br />
business 2 holding<br />
Nominal<br />
issued<br />
capital<br />
Investments at cost<br />
2011<br />
Rand<br />
2010<br />
Rand<br />
2011<br />
Rand<br />
Loans (from)/to<br />
subsidiaries<br />
Sishen <strong>Iron</strong> <strong>Ore</strong> Company<br />
(Pty) Limited RSA A 74 100 3,008,810 3,008,810 (17,940,816) 385,646,729<br />
Main Street 576 (Pty) Limited RSA E 100 100 100 100 60,613,188 39,050,027<br />
Indirect investments<br />
Groler Investments Limited SWL E 100 258,958 – – – –<br />
<strong>Kumba</strong> Hong Kong Limited HK B 100 915 – – – –<br />
<strong>Kumba</strong> Hong Kong Shipping Limited HK C 100 897 – – – –<br />
<strong>Kumba</strong> International BV NE B 100 10,806,511 – – – –<br />
<strong>Kumba</strong> International Trading SA LUX B 100 55,335,369 – – – –<br />
<strong>Kumba</strong> <strong>Iron</strong> <strong>Ore</strong> Holdings SARL NE E 100 154,654 – – – –<br />
Mineco Limited MAU F 100 21 – – – –<br />
<strong>Ore</strong>co Leasing Limited MAU F 75 17 – – – –<br />
Sibelo Resources Development<br />
(Pty) Limited RSA D 100 2 – – – –<br />
Sishen South Mining (Pty) Limited RSA F 100 1 – – – –<br />
Vulcan Leasing Limited MAU F 100 19 – – – –<br />
Total investments in subsidiaries 3,008,910 3,008,910 42,672,372 424,696,756<br />
Rand million 2011 2010<br />
Aggregate attributable after tax profits/(losses) of subsidiaries:<br />
Profits 19,347 17,653<br />
Losses 3 – (745)<br />
1<br />
RSA – South Africa, NE – Netherlands, SWL – Switzerland, HK – Hong Kong, LUX – Luxembourg, MAU – Mauritius<br />
2<br />
A – Mining, B – <strong>Iron</strong> ore marketing and sales, C – Shipping charter, D – Exploration, E – Investment holding, F – Dormant<br />
3<br />
Includes the impairment of investments in subsidiaries.<br />
2010<br />
Rand<br />
76 <strong>Kumba</strong> <strong>Iron</strong> <strong>Ore</strong> Limited
ANNEXURE 2: INVESTMENTS IN ASSOCIATES, JOINT VENTURES AND OTHER INVESTMENTS<br />
FOR THE YEAR ENDED 31 DECEMBER<br />
ANNEXURE 2:<br />
INVESTMENTS IN ASSOCIATES<br />
Group<br />
Loan balance<br />
Company<br />
Loan balance<br />
Rand ’000<br />
Nature of<br />
business 1<br />
Number of<br />
shares held<br />
%<br />
holding<br />
Investment<br />
at cost<br />
2011<br />
Rand ’000<br />
2010<br />
Rand ’000<br />
2011<br />
Rand ’000<br />
2010<br />
Rand ’000<br />
Associates<br />
Unlisted<br />
Manganore <strong>Iron</strong> Mining Limited 2 A 25,000 50 50 – – – –<br />
Incorporated joint ventures<br />
Unlisted<br />
Polokwane <strong>Iron</strong> <strong>Ore</strong> Company<br />
(Pty) Limited 2 A 4,000 50 3,740 33,251 28,952 – –<br />
Safore (Pty) Limited 3 B 400 40 – – – – –<br />
Sishen Shipping (Pty) Limited 3 B 400 40 – – – – –<br />
Trans Orient <strong>Ore</strong> Supplies Limited 3 C 2000 50 – – – – –<br />
3,740 33,251 28,952 – –<br />
Group<br />
Loan balance<br />
Company<br />
Loan balance<br />
Rand ’000<br />
Investment<br />
at cost<br />
2011<br />
Rand ’000<br />
2010<br />
Rand ’000<br />
2011<br />
Rand ’000<br />
2010<br />
Rand ’000<br />
Directors’ valuation of investments at 31 December<br />
Unlisted investments in associates 50 – – – –<br />
Unlisted investments in joint ventures 3,740 33,251 28,952 – –<br />
The financial year-end for Manganore <strong>Iron</strong> <strong>Ore</strong> Mining Limited and Sibelo Resources Development (Pty) Limited is 30 June. Where the financial<br />
year-ends are not co-terminous with that of the group, financial information has been obtained from published information or management<br />
accounts as appropriate.<br />
All above entities are incorporated in South Africa other than Trans Orient <strong>Ore</strong> Supplies Limited which is incorporated in Hong Kong.<br />
1 A – Mining, B –Shipping charter, C – <strong>Iron</strong> ore merchant, D – Community development<br />
2 On 5 July 2011 the company changed its name from Pietersburg <strong>Iron</strong> Company (Pty) Limited to Polokwane <strong>Iron</strong> <strong>Ore</strong> Company (Pty) Limited.<br />
3 Dormant<br />
Annexures<br />
Annual Financial Statements 2011<br />
77
ANNEXURE 3: SHARE - BASED PAYMENTS<br />
FOR THE YEAR ENDED 31 DECEMBER<br />
ANNEXURE 3:<br />
SHARE-BASED PAYMENTS<br />
BONUS SHARE PLAN<br />
Grant 2011 2010 2009<br />
Movement in the number of awards granted<br />
Balance at beginning of year – 225,874 310,777<br />
Bonus shares awarded 223,868 16,241 –<br />
Awards exercised* (4,878) (17,611) (11,549)<br />
Awards forfeited (2,302) (3,787) (1,325)<br />
Balance at 31 December 2011 216,688 220,717 297,903<br />
Balance at beginning of year – – 299,138<br />
Bonus shares awarded – 231,573 26,564<br />
Awards exercised* – (512) (4,360)<br />
Awards forfeited – (5,187) (10,565)<br />
Balance at 31 December 2010 – 225,874 310,777<br />
* This relates to the pro-rata portion of the Bonus Shares granted to employees who are considered good leavers in terms of the share rules.<br />
Number of<br />
awards<br />
Expiry<br />
date<br />
Vesting period of awards granted<br />
Less than 1 year 297,903 2012<br />
1 to 2 years 220,717 2013<br />
2 to 5 years 216,688 2014<br />
The share awards granted under the BSP are considered equity-settled. The share-based payment expense is measured using the fair value of<br />
the share awards issued under the BSP which was determined using the grant date share price of <strong>Kumba</strong>’s shares.<br />
Grant 2011 2010 2009<br />
Fair value assumptions<br />
Share price on date of grant (Rand) 439.82 346.68 172.60<br />
Expected share option life (years) 3.00 3.00 3.00<br />
Expected dividend yield (%) 5.25 6.94 10.28<br />
Risk-free interest rate (%) 5.63 6.50 6.14<br />
The risk-free interest rate for the period within the contractual term of the awards is based on South African government bonds.<br />
The historical volatility of the <strong>Kumba</strong> share price is used in determining the expected volatility.<br />
LONG-TERM INCENTIVE PLAN<br />
Awards<br />
Number of conditional awards 2011 2010 2009 2008 2007 1<br />
Movement in the number of conditional awards granted<br />
Balance at beginning of year – 23,365 36,490 210,845 388<br />
Conditional awards issued 17,960 – – 2,314 –<br />
Conditional awards vested – – – (208,775) –<br />
Conditional awards forfeited – – – (4,384) (388)<br />
Balance at 31 December 2011 17,960 23,365 36,490 – –<br />
Balance at beginning of year – 36,490 217,175 74,913<br />
Conditional awards issued 24,219 – – –<br />
Conditional awards vested 2 – – – (74,525)<br />
Conditional awards forfeited (854) – (6,330) –<br />
Balance at 31 December 2010 23,365 36,490 210,845 388<br />
1<br />
The balance of 2007 awards remaining at 31 December 2010 represents a pro-rata allocation of LTIP awards made to employees that joined <strong>Kumba</strong> after the original<br />
award and these awards will vest on the third anniversary.<br />
2<br />
This relates to employees who are considered good leavers in terms of the share rules.<br />
78 <strong>Kumba</strong> <strong>Iron</strong> <strong>Ore</strong> Limited
LONG-TERM INCENTIVE PLAN continued<br />
Number of<br />
conditional<br />
awards<br />
Expiry<br />
date<br />
Vesting period of conditional awards granted<br />
Less than 1 year 36,490 2012<br />
1 to 2 years 23,365 2013<br />
2 to 5 years 17,960 2014<br />
The conditional awards granted under the LTIP are considered equity-settled. The share-based payment expense is measured using the fair<br />
value of the conditional award issued under the LTIP which was determined using the Monte Carlo option pricing model.<br />
Grant 2011 2010 2009 2008 2007<br />
Fair value assumptions<br />
Share price on date of grant (Rand) 439.82 361.97 172.06 332.06 126.50<br />
Annualised expected volatility (%) 46.55 45.00 51.66 38.95 37.20<br />
Expected share option life (years) 3.00 3.00 3.00 3.00 3.00<br />
Expected dividend yield (%) 5.25 6.94 10.28 5.81 2.65<br />
Risk-free interest rate (%) 7.08 6.50 6.14 8.96 7.70<br />
The risk-free interest rate for the period within the contractual term of the conditional awards is based on South African government bonds.<br />
The historical volatility of the <strong>Kumba</strong> and, where applicable, the <strong>Kumba</strong> Resources share price is used in determining the expected volatility.<br />
SHARE APPRECIATION RIGHTS SCHEME<br />
Number<br />
of rights<br />
2008 award<br />
Number<br />
of rights<br />
2007 award<br />
Exercise<br />
price range<br />
Rand<br />
Movement in the number of rights granted<br />
Balance at beginning of year 210,524 104,987 124.27 – 332.06<br />
Rights exercised (111,230) (43,377) 124.27 – 332.06<br />
Rights forfeited (1,130) – –<br />
Balance at 31 December 2011 98,164 61,610 124.27 – 332.06<br />
Balance at beginning of year 215,894 252,501 124.27 – 332.06<br />
Rights exercised* – (145,514) 124.27 – 267.61<br />
Rights forfeited (5,370) (2,000) 124.27 – 332.06<br />
Balance at 31 December 2010 210,524 104,987 124.27 – 332.06<br />
* This relates to employees who are considered good leavers in terms of the share rules.<br />
Exercise<br />
price range<br />
Rand<br />
Number<br />
of rights<br />
Expiry<br />
date<br />
Vesting period of rights granted<br />
2 to 5 years 124.27 – 332.06 61,610 2014<br />
2 to 5 years 247.30 – 332.06 98,164 2015<br />
The rights granted under the SARS are considered equity-settled. The share-based payment expense is measured using the fair value of the<br />
rights issued under the SARS which was determined using the Black-Scholes option pricing model.<br />
Annexures<br />
Annual Financial Statements 2011<br />
79
ANNEXURE 3: SHARE - BASED PAYMENTS<br />
FOR THE YEAR ENDED 31 DECEMBER<br />
2008 award 2007 award<br />
Fair value assumptions<br />
Share price on date of grant (Rand) 332.06 126.50<br />
Weighted average exercise price (Rand) 332.06 124.27<br />
Annualised expected volatility (%) 38.95 37.20<br />
Expected share option life (years) 5.50 4.50<br />
Expected dividend yield (%) 6.30 2.66<br />
Risk-free interest rate (%) 9.12 7.66<br />
The risk-free interest rate for the period within the contractual term of the rights is based on South African government bonds.<br />
The historical volatility of the <strong>Kumba</strong> share price is used in determining the expected volatility.<br />
DEFERRED BONUS PLAN<br />
Number<br />
of rights<br />
Exercise<br />
price range<br />
Rand<br />
Movement in the number of pledged shares<br />
Balance at beginning of year 1,578 232.75 – 342.25<br />
Exercised (1,578)<br />
Balance at 31 December 2011 – –<br />
Balance at beginning of year 1,578 232.75 – 342.25<br />
Balance at 31 December 2010 1,578 232.75 – 342.25<br />
Exercise<br />
price range<br />
Rand<br />
Number<br />
of pledged<br />
shares<br />
Expiry<br />
date<br />
Vesting period of pledged shares<br />
1 to 2 years 232.75 – 342.25 1,578 2011<br />
The shares awarded under the DBP are considered equity-settled. The share-based payment expense is measured using the fair value of the<br />
shares issued under the DBP which was determined using the Black-Scholes option pricing model.<br />
MANAGEMENT SHARE OPTION SCHEME<br />
Number of<br />
share options<br />
Option<br />
price range<br />
(Rand)<br />
Movement in the number of share options granted<br />
Balance at beginning of year 321,148 15.38 – 97.74<br />
Share options exercised (149,218) 15.38 – 97.74<br />
Share options forfeited – 75<br />
Balance at 31 December 2011 171,930 15.38 – 97.74<br />
Balance at beginning of year 798,620 15.38 – 97.74<br />
Share options exercised (462,752) 15.38 – 97.74<br />
Share options forfeited (14,720) 75<br />
Balance at 31 December 2010 321,148 15.38 – 97.74<br />
Number of share options 2011 2010<br />
Vesting period of share options granted<br />
Already vested 171,930 177,168<br />
Within 1 year – 143,980<br />
171,930 321,148<br />
Range of exercise prices (rand)<br />
Weighted<br />
average<br />
option price<br />
Rand<br />
Number of<br />
share options<br />
Expiry<br />
date<br />
37.62 – 67.26 39.78 46,260 2012<br />
68.53 – 97.74 78.58 125,670 2013<br />
171,930<br />
The share options granted under the Management Share Option Scheme are considered equity-settled. The share-based payment expense is<br />
measured using the fair value of the share options issued under the Management Share Option Scheme which was determined using the Black-<br />
Scholes option pricing model.<br />
80 <strong>Kumba</strong> <strong>Iron</strong> <strong>Ore</strong> Limited
MANAGEMENT SHARE OPTION SCHEME continued<br />
Before<br />
After unbundling<br />
unbundling <strong>Kumba</strong> Exxaro<br />
Fair value assumptions<br />
Share price (Rand) 142.00 110.00 39.00<br />
Weighted average exercise price (Rand) 58.78 39.49 19.29<br />
Annualised expected volatility (%) 37.90 37.90 37.90<br />
Expected share option life (years) 4.34 4.34 4.34<br />
Expected dividend yield (%) 4.00 4.00 4.00<br />
Risk-free interest rate 8.24 8.24 8.24<br />
The risk-free interest rate for the period within the contractual term of the share options is based on South African government bonds.<br />
The historical volatility of the <strong>Kumba</strong> Resources share price is used in determining the expected volatility.<br />
ENVISION<br />
Number<br />
of share<br />
options<br />
Phase 2 Phase 1<br />
Weighted<br />
average<br />
option price<br />
Rand<br />
Number<br />
of share<br />
options<br />
Weighted<br />
average<br />
option price<br />
Rand<br />
Movement in the number of share options granted<br />
Balance at beginning of year – 170.11 15,622,571 22.84<br />
Share options issued 22,618,800 170.11 98,127 22.84<br />
Share options vested – 170.11 (15,614,606) 22.84<br />
Share options lapsed – 170.11 (106,092) 22.84<br />
Balance at 31 December 2011 22,618,800 170.11 – 22.84<br />
Balance at beginning of year – – 15,353,793 22.84<br />
Share options issued – – 655,811 22.84<br />
Share options lapsed – – (387,033) 22.84<br />
Balance at 31 December 2010 – – 15,622,571 22.84<br />
Number of<br />
share options<br />
Expiry<br />
date<br />
Vesting period of share options granted<br />
Within 5 years 22,618,800 2016<br />
Envision is considered equity-settled. The share-based payment expense is measured using the fair value of the awards issued under the scheme<br />
which was determined using the Monte Carlo option pricing model.<br />
Phase 2 Phase 1<br />
Share price on date of grant (Rand) 170.29 39.48<br />
Weighted average exercise price (Rand) 170.11 22.84<br />
Annualised expected volatility (%) 45.00 45.00<br />
Expected share option life (years) 5.00 5.00<br />
Expected dividend yield (%) 5.25 5.25<br />
Risk-free interest rate (%) 7.06 8.00<br />
The risk-free interest rate for the period within the contractual term of the share options is based on South African government bonds.<br />
The historical volatility of the <strong>Kumba</strong> and <strong>Kumba</strong> Resources share price is used in determining the expected volatility.<br />
Annexures<br />
Annual Financial Statements 2011<br />
81
ANNEXURE 4: BALANCE SHEET – US DOLLAR CONVENIENCE TRANSLATION<br />
AS AT 31 DECEMBER<br />
ANNEXURE 4:<br />
BALANCE SHEET<br />
US DOLLAR CONVENIENCE TRANSLATION<br />
(Unaudited supplementary information)<br />
US dollar million 2011 2010<br />
Assets<br />
Property, plant and equipment 2,552 2,395<br />
Biological assets 1 1<br />
Investments in associates and joint ventures 4 4<br />
Investments held by environmental trust 69 56<br />
Long-term prepayments and other receivables 12 8<br />
Deferred tax assets 80 71<br />
Non-current assets 2,718 2,535<br />
Inventories 472 468<br />
Trade and other receivables 433 467<br />
Current tax assets 4 4<br />
Cash and cash equivalents 580 733<br />
Current assets 1,489 1,672<br />
Total assets 4,207 4,207<br />
Equity and liabilities<br />
Shareholders’ equity 1,936 2,164<br />
Non-controlling interest 582 610<br />
Total equity 2,518 2,774<br />
Liabilities<br />
Interest-bearing borrowings – 481<br />
Provisions 110 101<br />
Deferred tax liabilities 604 343<br />
Non-current liabilities 714 925<br />
Short-term portion of interest-bearing borrowings 390 –<br />
Short-term portion of provisions 1 2<br />
Trade and other payables 557 493<br />
Current tax liabilities 27 13<br />
975 508<br />
Total liabilities 1,689 1,433<br />
Total equity and liabilities 4,207 4,207<br />
Exchange rate<br />
Translated at closing rand/US dollar exchange rate 8.18 6.63<br />
82 <strong>Kumba</strong> <strong>Iron</strong> <strong>Ore</strong> Limited
ANNEXURE 5: INCOME STATEMENT – US DOLLAR CONVENIENCE TRANSLATION<br />
FOR THE YEAR ENDED 31 DECEMBER<br />
ANNEXURE 5:<br />
INCOME STATEMENT<br />
US DOLLAR CONVENIENCE TRANSLATION<br />
(Unaudited supplementary information)<br />
US dollar million 2011 2010<br />
Revenue 6,697 5,299<br />
Operating expenses (2,288) (1,858)<br />
Operating profit 4,409 3,441<br />
Finance income 33 20<br />
Finance costs (21) (24)<br />
Profit before taxation 4,421 3,437<br />
Taxation (1,346) (933)<br />
Profit for the year 3,075 2,504<br />
Attributable to:<br />
Owners of <strong>Kumba</strong> 2,351 1,961<br />
Non-controlling interest 724 543<br />
3,075 2,504<br />
(Cents per share)<br />
Basic 7.32 6.11<br />
Diluted 7.31 6.10<br />
Exchange rate<br />
Translated at average rand/US dollar exchange rate 7.25 7.30<br />
Annexures<br />
Annual Financial Statements 2011<br />
83
SHAREHOLDER ANALYSIS<br />
SHAREHOLDER ANALYSIS<br />
REGISTER DATE: 30 DECEMBER 2011<br />
ISSUED SHARE CAPITAL: 322 058 624<br />
No of<br />
shareholdings % No of shares %<br />
Shareholder spread<br />
1 – 1 000 shares 20,951 89.61 4,641,663 1.44<br />
1 001 – 10 000 shares 2,046 8.75 5,797,699 1.80<br />
10 001 – 100 000 shares 314 1.34 8,813,690 2.74<br />
100 001 – 1 000 000 shares 56 0.24 15,564,330 4.83<br />
1 000 001 shares and over 12 0.05 287,241,242 89.19<br />
Totals 23,379 99.99 322,058,624 100.00<br />
Distribution of shareholders<br />
Banks/Brokers 200 0.86 25,338,283 7.87<br />
Close corporations 215 0.92 137,472 0.04<br />
Endowment funds 112 0.48 165,049 0.05<br />
Individuals 18,834 80.56 7,776,453 2.41<br />
Insurance companies 39 0.17 1,001,151 0.31<br />
Investment companies 35 0.15 4,988,524 1.55<br />
Medical schemes 2 0.01 4,771 0.00<br />
Mutual funds 263 1.12 6,813,503 2.12<br />
Nominees and trusts 2,966 12.69 4,195,893 1.30<br />
Other corporations 114 0.49 64,191 0.02<br />
Private companies 412 1.76 212,267,538 65.91<br />
Public companies 21 0.09 42,659,948 13.25<br />
Retirement funds 164 0.70 16,401,417 5.09<br />
Share trust 2 0.01 244,431 0.08<br />
Totals 23,379 100.01 322,058,624 100.0<br />
Public / non-public shareholders<br />
Non-public shareholders 10 0.04 253,694,200 78.77<br />
Directors and associates of the company holdings 4 0.02 42,871 0.01<br />
Strategic holdings 2 0.01 251,547,711 78.11<br />
Related holdings 4 0.02 2,103,618 0.65<br />
Public shareholders 23,369 99.95 68,364,424 21.23<br />
Totals 23,379 99.99 322,058,624 100.0<br />
Beneficial shareholders holding 3% or more<br />
Anglo American plc 210,052,454 65.22<br />
Industrial Development Corporation of South Africa Ltd 41,498,615 12.89<br />
Government Employees Pension Fund 13,409,670 4.16<br />
Totals 264,960,739 82.27<br />
84 <strong>Kumba</strong> <strong>Iron</strong> <strong>Ore</strong> Limited
BREAKDOWN OF NON-PUBLIC HOLDINGS<br />
BREAKDOWN OF<br />
NON-PUBLIC HOLDINGS<br />
No of shares %<br />
Directors of the company<br />
Uren, VP 21,509 0.01<br />
Uren, VP 20,509 0.01<br />
V.N Centurien Trust 1,000 0.00<br />
Griffith, CI 21,362 0.01<br />
Griffith, CI 21,032 0.01<br />
Griffith, CL 330 0.00<br />
Totals 42,871 0.01<br />
Strategic Holdings<br />
Anglo American South Africa Capital (Pty) Ltd 210,049,096 65.22<br />
Industrial Development Corporation of South Africa Ltd 41,498,615 12.89<br />
Totals 251,547,711 78.11<br />
Related Holdings<br />
Mercantile Shareholder Nominees - Exxaro 1,630,802 0.51<br />
<strong>Kumba</strong> Bonus Share Plan Trust 244,046 0.08<br />
Sishen <strong>Iron</strong> <strong>Ore</strong> Company (Pty) Ltd 139,400 0.04<br />
Exxaro Resources Limited (No8) 88,985 0.03<br />
SIOC Employee Share Participation Scheme 385 0.00<br />
Totals 2,103,618 0.66<br />
BREAKDOWN OF BENEFICIAL SHAREHOLDERS HOLDING 3% OR MORE<br />
No of shares %<br />
Beneficial Shareholders<br />
Anglo American plc 210,052,454 65.22<br />
Anglo American South Africa Capital (Pty) Ltd 210,052,454 65.22<br />
Industrial Development Corporation of South Africa Ltd 41,498,615 12.89<br />
Industrial Development Corporation of South Africa Ltd 41,498,615 12.89<br />
Government Employees Pension Fund 14,530,159 4.51<br />
Government Employees Pension Fund - PIC 13,383,011 4.16<br />
Government Employees Pension Fund - Investec Asset Management 530,328 0.16<br />
Government Employees Pension Fund - Prudential Portfolio Managers 448,371 0.14<br />
Government Employees Pension Fund - Taquanta Asset Mangers 65,899 0.02<br />
Government Employees Pension Fund - Sentio Capital Management 41,200 0.01<br />
Government Employees Pension Fund - AEON Investment Management 32,850 0.01<br />
Government Employees Pension Fund - Mergence Africa Investments 28,500 0.01<br />
Totals 266,081,228 82.62<br />
Corporate information<br />
Annual Financial Statements 2011<br />
85
ADMINISTRATION<br />
COMPANY REGISTRATION<br />
NUMBER:<br />
2005/015852/06<br />
JSE share code:<br />
KIO<br />
ISIN code:<br />
ZAE000085346<br />
SECRETARY AND REGISTERED<br />
OFFICE<br />
Vusani Malie<br />
Centurion Gate – Building 2B<br />
124 Akkerboom Road<br />
Centurion, Pretoria, 0157<br />
Republic of South Africa<br />
Tel: +27 (0) 12 683 7000<br />
Fax: +27 (0) 12 683 7009<br />
AUDITORS<br />
Deloitte & Touche<br />
Chartered Accountants (SA)<br />
Registered Auditors<br />
Deloitte Place, The Woodlands Office Park<br />
20 Woodlands Drive, Woodmead, 2146<br />
South Africa<br />
Private Bag X46, Gallo Manor, 2052<br />
ASSURANCE PROVIDERS<br />
PricewaterhouseCoopers SA<br />
Registered Auditors<br />
2 Eglin Road, Sunninghill, 2157<br />
South Africa<br />
Private Bag X36, Sunninghill, 2157<br />
Tel: +27 (0) 11 797 4000<br />
Fax: +27 (0) 11 797 5800<br />
SPONSOR<br />
Rand Merchant Bank<br />
(A division of FirstRand Bank Limited)<br />
Registration number: 1929/001225/06<br />
1 Merchant Place<br />
Corner Rivonia Road and Fredman Drive<br />
Sandton, 2146<br />
South Africa<br />
CORPORATE LAW ADVISORS<br />
<br />
82 Maude Street<br />
Sandton, 2196<br />
South Africa<br />
PO Box 784903, Sandton, 2146<br />
UNITED STATES ADR DEPOSITORY<br />
BNY Mellon<br />
Depositary Receipts Division<br />
101 Barclay Street, 22nd Floor<br />
New York, New York 10286<br />
Tel: 212 815 2293<br />
Fax: 212 571 3050/1/2<br />
www.adrbny.com<br />
TRANSFER SECRETARIES<br />
Computershare Investor Services (Pty) Limited<br />
70 Marshall Street<br />
Johannesburg, 2001<br />
South Africa<br />
PO Box 61051, Marshalltown, 2107<br />
INVESTOR RELATIONS<br />
Esha Mansingh<br />
Email: esha.mansingh@angloamerican.com<br />
Tel: +27 (0) 12 683 7257<br />
Mobile: +27 (0) 83 488 9427<br />
FORWARD-LOOKING<br />
STATEMENTS<br />
Certain statements made in this report<br />
constitute forward-looking statements.<br />
Forward-looking statements are typically<br />
identified by the use of forwardlooking<br />
terminology such as ‘believes’,<br />
‘expects’, ‘may’, ‘will’, ‘could’, ‘should’,<br />
‘intends’, ‘estimates’, ‘plans‘, ‘assumes’ or<br />
‘anticipates’ or the negative thereof or<br />
other variations thereon or comparable<br />
terminology, or by discussions of, e.g.<br />
future plans, present or future events,<br />
or strategy that involves risks and<br />
uncertainties. Such forward-looking<br />
statements are subject to a number of<br />
risks and uncertainties, many of which<br />
are beyond the company’s control and<br />
all of which are based on the company’s<br />
current beliefs and expectations about<br />
future events. Such statements are<br />
based on current expectations and, by<br />
their nature, are subject to a number of<br />
risks and uncertainties that could cause<br />
actual results and performance to differ<br />
materially from any expected future<br />
results or performance, expressed or<br />
implied, by the forward-looking statement.<br />
No assurance can be given that such<br />
future results will be achieved; actual<br />
events or results may differ materially as<br />
a result of risks and uncertainties facing<br />
the company and its subsidiaries. The<br />
forward-looking statements contained in<br />
this report speak only as of the date of<br />
this report and the company undertakes<br />
no duty to, and will not necessarily, update<br />
any of them in light of new information<br />
or future events, except to the extent<br />
required by applicable law or regulation.<br />
PO Box 786273, Sandton, 2146<br />
86 <strong>Kumba</strong> <strong>Iron</strong> <strong>Ore</strong> Limited
NOTES<br />
Annual Financial Statements 2011<br />
87<br />
Corporate information
NOTES<br />
88 <strong>Kumba</strong> <strong>Iron</strong> <strong>Ore</strong> Limited
4771/11


![English PDF [ 189KB ] - Anglo American](https://img.yumpu.com/50470814/1/184x260/english-pdf-189kb-anglo-american.jpg?quality=85)


![pdf [ 595KB ] - Anglo American](https://img.yumpu.com/49420483/1/184x260/pdf-595kb-anglo-american.jpg?quality=85)
![pdf [ 1.1MB ] - Anglo American](https://img.yumpu.com/49057963/1/190x240/pdf-11mb-anglo-american.jpg?quality=85)

