059 - MIT Haystack Observatory
059 - MIT Haystack Observatory
059 - MIT Haystack Observatory

You also want an ePaper? Increase the reach of your titles
YUMPU automatically turns print PDFs into web optimized ePapers that Google loves.
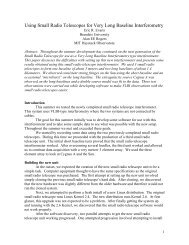
0.03<br />
0.025<br />
Antenna temperature (K)<br />
0.02<br />
0.015<br />
0.01<br />
0.005<br />
0<br />
-0.005<br />
8 10 12 14 16 18 20 22 24 26<br />
Effective time (hr)<br />
Figure 4: Black: Best-fit model. Red: The same model with D replaced by D ± σ D , where<br />
σ D is the estimate of the error in fitting D. The value of σ D obtained from fitting is actually<br />
a very good estimate of the true random error in estimating D because D is only very weakly<br />
correlated with the other model parameters. See Section 5.5.<br />
t 0 not equal to 18 h exactly Hint: What is the elevation of the Sun at sunset at the surface<br />
How does this differ at the altitude of the mesosphere Why are just after sunset and just<br />
before sunrise the best times to see flashes from low-orbiting satellites (such as from the Iridium<br />
satellites)<br />
6 Theory<br />
6.1 Minimizing the sum of the square of the residuals<br />
In most contexts, random noise can be thought of as coming from a Gaussian (also called<br />
normal) distribution. A general Gaussian function with independent variable x has the form<br />
Ae −(x−µ)2 2σ 2 , (2)<br />
where A represents the amplitude, µ is the center of the distribution, and σ is the width of the<br />
distribution. A probability density function is required to have unit area. For a Gaussian pdf,<br />
A = 1/( √ 2πσ), since<br />
∫<br />
1<br />
√ e −(x−µ)2 2σ 2 = 1. (3)<br />
2πσ<br />
Suppose we have a set of data points d i that can be fit by a model whose predicted value at<br />
each data point is m i . In general, d i = m i + ǫ i , where ǫ i is the contribution due to noise in the<br />
data point. Suppose that the noise is expected to follow a Gaussian distribution with errors σ i .<br />
8