Willard Bleything.pdf - Optometric Extension Program Foundation
Willard Bleything.pdf - Optometric Extension Program Foundation
Willard Bleything.pdf - Optometric Extension Program Foundation
Create successful ePaper yourself
Turn your PDF publications into a flip-book with our unique Google optimized e-Paper software.
Background and Aims<br />
• Studies support the notion that socially disadvantaged<br />
children are especially at risk for poor health including<br />
vision disorders<br />
• Most of the visual problems are functional involving<br />
binocular vision and visual processing dysfunction<br />
• Lenses and vision therapy remain the treatment of choice<br />
for such disorders, however ….<br />
• Limited access to visual care is a major concern,<br />
particularly in the socially‐at‐risk population of youth
Socially –At‐Risk Populations<br />
• Solon and Mozlin looked at the impact of poverty on<br />
health, vision development and school failure 1<br />
• Zaba examined the linkage between children’s vision, and<br />
learning problems, delinquency, illiteracy, social and<br />
emotional problems 2<br />
• Duckman and Festinger made an in‐depth effort to deliver<br />
vision care to children in foster care 3<br />
• 1 Solan H, Mozlin R. Children in poverty; impact on health, visual development, and school failure. J Optom Devel<br />
1997;28:7‐28.<br />
• 2 Zaba J. Social, emotional, and educational consequences of undetected children’s vision problems. J Behav<br />
Optom 2001;12:66‐70.<br />
• 3 Duckman R, Festinger T. Delivery of vision care in foster care placements in New York City. J Optom Vis Devel<br />
2002;33:116‐125.
Socially –At‐Risk – Populations<br />
Adolescents<br />
• Inner‐city youth: visual screening resulted in 52% referral<br />
rate 4<br />
• Middle /high school at‐risk children: visual screening<br />
resulted in 97 % referral rate 5<br />
• Socially‐at‐risk 17‐19 YO: visual screening resulted in a<br />
80% referral rate 6<br />
• 4 Suchoff I, Mozlin R. visual screening of an adolescent inner city population. J Behav Optom 2001; 3:71‐74.<br />
• 5 Johnson R, Nottingham D, Stratton R, et al. The vision screening of academically and behaviorally at‐risk<br />
pupils. J Behav Optom 1996:7:39‐42.<br />
• 6 Johnson R, Zaba J. Visual screening of at risk college students. J Behav Optom 1995; 6:63‐65.
Health Care Delivery<br />
• Think public health vs. private office<br />
• Most of our experience in providing ‘private practice’ care<br />
is with a single patient being examined followed by a<br />
customized treatment plan of lenses and vision therapy<br />
• The socially‐at‐risk population p has limited access to the<br />
private practice health care delivery model<br />
• This population is often subject to health care delivery<br />
p p j y<br />
under a public health model
Health Care Delivery<br />
• How effective would it be to provide optometric care in a<br />
group setting, based upon the enhancement of basic<br />
visual skills, utilizing a single ‘serves all’ treatment plan<br />
• In a sense, we are posing a question similar il to the delivery<br />
of educational instruction<br />
• The well‐to‐do might hire a private tutor to teach their<br />
children, the program of studies being customized for<br />
each student<br />
• The public schools use a standardized ‘serves all’<br />
curriculum that is aimed at being most effective for most<br />
students
Aim of Study<br />
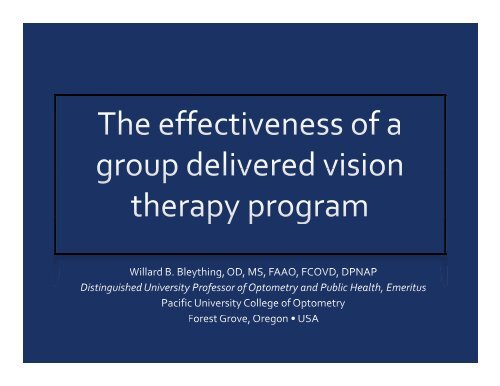
• The aim of this project was to determine the effectiveness<br />
of a visual intervention program, involving prescription<br />
lenses and group delivered – visual skills based‐ single<br />
treatment planned – vision therapy on a socially‐at‐risk at population of youth
Methods • Study Population<br />
In 1993, Congress authorized the National Guard<br />
to conduct alternative schools for the high school<br />
drop out population – a group now recognized as a<br />
key public concern.<br />
As can be expected, learning disabilities are a<br />
common characteristic in this special population.<br />
Of particular significance to this project is the<br />
research that has shown visual dysfunction to be a<br />
key risk factor in learning disabilities, especially<br />
reading skills.
Methods • Study Population<br />
• Socially‐at‐risk youth between 16 – 18 years of age<br />
• All subjects were high school dropouts and performing 4 –<br />
6 grades below expectations<br />
• All subjects were enrolled in the Youth ChalleNGe High<br />
School program operated by the Oregon National Guard<br />
near Bend, Oregon during the period of January –June<br />
2006<br />
• Following the tenets of the Declaration of Helsinki,<br />
informed consent was arranged through the<br />
administrative offices of the Youth ChalleNGe High School
Methods • Screening Protocol<br />
• All students enrolled (n=123) were screened<br />
• A modified version of the New York State <strong>Optometric</strong><br />
Association (NYSOA) Vision Screening Battery was used<br />
• Tests omitted were color perception and form perception<br />
• Tests added were distance retinoscopy (non‐cycloplegic),<br />
Berry Visual‐Motor‐Integration (VMI), and the College of<br />
Optometrists in Vision Development‐ Quality of Life<br />
Outcomes (COVD‐QOL) questionnaire
Methods • Follow‐Up Exams<br />
• Those referred by screening (n=55)[46%] were given<br />
comprehensive optometric examinations by a team of 6<br />
optometrists and 6 technicians within 6 days of the initial<br />
screening<br />
• Prescription lenses/frames were provided as indicated<br />
• Of the 55 examined, 32 [58%] were provided with a new<br />
lens prescription; an additional 7 were told to wear their<br />
current Rx<br />
• A total of 71% were in need of a lens Rx
Methods • Vision Therapy<br />
• 24 of those receiving a comprehensive exam were placed<br />
into a vision therapy intervention group<br />
• The remaining 31 were placed into a control group with<br />
vision therapy being made available following the study<br />
• The vision therapy group and control group were matched<br />
on age, gender, and VMI Standard Scores<br />
• Exclusion criteria selected out subjects with strabismus<br />
j<br />
and corneal scars from prior trauma
Methods • Vision Therapy<br />
• Vision therapy consisted of two 1‐hour sessions per week<br />
for 12 weeks<br />
• Half of the therapy session was devoted to developing<br />
basic visual skills such as eye movements,<br />
accommodative/vergence ranges and flexibility, fusion<br />
and stereopsis<br />
• The remaining time was spent on computerized visual<br />
perceptual procedures (PTS II)<br />
• The control group spent an equal amount of time in a<br />
structured study hall working on assignments from the<br />
courses taken at the special high school
Methods • Vision Therapy<br />
• A room was set‐aside within the school to treat 6 subjects at a<br />
time<br />
• Subjects rotated from one treatment station to another every<br />
few minutes for a period of 30 minutes and kept a log of their<br />
performance at each station<br />
• In an adjoining i room, another 6 subjects received computerbased<br />
visual perceptual training; this also went for 30 minutes<br />
• At the midpoint of the 60 minute session, the two groups<br />
switched places thus each subject received vision training in<br />
each of the two treatment rooms for a total of 60 minutes twice<br />
each week
Methods • Vision Therapy<br />
Weeks 1 2 3 4 5 6 7 8 9 10 1<br />
1<br />
Visual Skill Areas<br />
Ocular Motility • • • • • • • • • • •<br />
Accommodative Facility • • • • •<br />
Hand/Eye Coordination • • • •<br />
Ocular Motility / Balance Board • • •<br />
CheiroscopicTracing • •<br />
Fusion / Vergence • • • •<br />
Stereopsis /Vergence • • • • •<br />
12
Methods • Vision Therapy<br />
• Perceptual Therapy (Perceptual Therapy System II)<br />
• Sequential Processing<br />
• Temporal Vision Perception Processing<br />
• Speed of Information Processing<br />
• Rapid Automatized Naming
Results<br />
• Pre and post results were compared for:<br />
• Near accommodative and vergence measures<br />
• Saccades<br />
• COVD Quality of Life Outcomes Questionnaire<br />
• Two‐ tailed Paired Student’s t‐Test comparisons were<br />
made to test statistical significance<br />
• While general improvement was noted in most areas<br />
measured only those that achieved statistical significance<br />
will be reported
Results • Accommodative Facility<br />
• Accommodative facility<br />
• Pre test: 7.83 cycles per minute (mean of VT Group)<br />
• Post test: 11.67 cycles per minute (mean of VT Group)<br />
• t=3.48 ; df=23; p=0.002
Results • NPC<br />
• Near point of convergence • Break<br />
• Pre test : 2.29 inches (mean of VT Group)<br />
• Post test : 0.48 inches (mean of VT Group)<br />
• t= 3.29; df= 23; p= 0.003<br />
• Near point of convergence • Recovery<br />
• Pre test : 4.83 inches (mean of VT Group)<br />
• Post test : 1.76 inches (mean of VT Group)<br />
• t= 3.71; df= 23; p= 0.001
Results • Saccades<br />
• King‐Devick Total time<br />
• Pre test : 55.09 seconds (mean of VT Group)<br />
• Post test : 43.96 seconds (mean of VT Group)<br />
• t= 3.66; df= 21; p= 0.001
Results • Quality of Life<br />
• COVD Quality‐of‐Life Questionnaire<br />
• Pre test symptoms score: 34.8 (mean of VT Group)<br />
• Post test symptoms score; 20.8 (mean of VT Group)<br />
• t= 4.37; df= 22; p= 0.0001<br />
• For a more complete discussion see:<br />
• <strong>Bleything</strong> WB, Landis SL. Effectiveness of the College of Optometrists in Vision Development –QOL<br />
Questionnaire in a socially at risk population of youth. Optom Vis Dev 2008;39(1)33‐41
Conclusions<br />
• While a group delivered – visual skills based – single<br />
treatment plan delivery system has obvious limitations<br />
measured against individualized therapy, such an<br />
approach can have positive results in building visual skills<br />
when the access to care limits delivery mode options.
Pacific University<br />
Project Site<br />
You are here
Mount Hood
Near base of Cascade Mountains
Former US Army Communications<br />
Center
Vision Screening Station
Vision Screening Station
Vision Screening Station
Vision Screening Station
Therapy Room
Therapy Room
Hand – Eye Coordination
Eye Pursuits with Yoked Prism
Eye Fixations
Fusion with Accomm‐Vergence
Optometry Students Included in<br />
Project
Core Team Members
Acknowledgements<br />
• This project was funded, in part, by the College of<br />
Optometrists in Vision Development Research Fund,<br />
and the Kikuchi Research Fund at Pacific University. A<br />
beginning pilot project received funding from the<br />
<strong>Optometric</strong> <strong>Extension</strong> <strong>Program</strong> <strong>Foundation</strong>.<br />
• Appreciation is extended to volunteers from the<br />
Children’s Vision <strong>Foundation</strong>, the staff at the Youth<br />
ChalleNGe High School, the general optometric<br />
community, and especially to the staff at Integrated<br />
Eye Care for use of facilities.<br />
• A special note of appreciation for the work of Sandra<br />
Landis, OD who supervised much of the on‐site<br />
therapy.


