Factors influencing performance of hard rock tunnel boring machines
Factors influencing performance of hard rock tunnel boring machines
Factors influencing performance of hard rock tunnel boring machines

Create successful ePaper yourself
Turn your PDF publications into a flip-book with our unique Google optimized e-Paper software.
Rock Engineering in Difficult Ground Conditions – S<strong>of</strong>t Rocks and Karst – Vrkljan (ed)<br />
© 2010 Taylor & Francis Group, London, ISBN 978-0-415-80481-3<br />
<strong>Factors</strong> <strong>influencing</strong> <strong>performance</strong> <strong>of</strong> <strong>hard</strong> <strong>rock</strong> <strong>tunnel</strong> <strong>boring</strong><br />
<strong>machines</strong><br />
S. Yagiz<br />
Geological Engineering Department, Pamukkale University, Denizli, Turkey<br />
J. Rostami<br />
Energy and Mineral Engineering, Pennsylvania State University, University Park, PA, USA<br />
T. Kim<br />
Parsons Brinckerh<strong>of</strong>f, Inc., New York City, NY, USA<br />
L. Ozdemir<br />
Earth Mechanics Institute <strong>of</strong> Colorado School <strong>of</strong> Mines, Golden, CO, USA<br />
C. Merguerian<br />
Geology Department, H<strong>of</strong>stra University, Duke Geological Lab., Westbury, NY, USA<br />
ABSTRACT: Intact <strong>rock</strong> properties together with <strong>rock</strong> mass characteristics should be well investigated<br />
for selection <strong>of</strong> proper <strong>tunnel</strong> <strong>boring</strong> machine (TBM) for <strong>tunnel</strong>ing in various ground conditions. This is<br />
due to the significant impact <strong>of</strong> <strong>rock</strong> mass characteristics on machine <strong>performance</strong>. TBMs are site specific<br />
and designed for optimal <strong>performance</strong> in given ground conditions. When selected and put to work at a<br />
specific site, TBM parameters including thrust and power are the controlling factors for excavation rate.<br />
These two parameters along with <strong>rock</strong> properties and <strong>rock</strong> mass characteristics converge to define the<br />
operating point <strong>of</strong> a machine. To investigate the factors influence on TBM <strong>performance</strong> in <strong>rock</strong> mass, a<br />
database including two <strong>tunnel</strong> projects, the Queens Water Tunnel in the City <strong>of</strong> New York, USA and the<br />
Second Manapouri Tailrace Tunnel in New Zealand, have been compiled and studied. The relationship<br />
between the penetration rate, <strong>rock</strong> mass properties, and thrust and power consumption <strong>of</strong> the machine<br />
was examined. The obtained relationships together with the Colorado School <strong>of</strong> Mines TBM <strong>performance</strong><br />
prediction model are discussed herein.<br />
1 INTRODUCTION<br />
Prediction <strong>of</strong> TBM <strong>performance</strong> depends on<br />
machine specifications and both <strong>rock</strong> properties and<br />
<strong>rock</strong> mass characterizations encountered at the site.<br />
Accurate TBM <strong>performance</strong> estimation is necessary<br />
in estimation <strong>of</strong> construction schedule and cost for<br />
any mechanical <strong>tunnel</strong>ing. Performance prediction<br />
refers to the estimation <strong>of</strong> the rate <strong>of</strong> penetration<br />
(ROP) that is the excavated distance when machine<br />
is actively mining or <strong>boring</strong> the face, and advanced<br />
rate (AR) which is the distance mined on a daily basis<br />
while including machine maintenance and other<br />
support activities (Yagiz, 2008). Many models and<br />
equations have been introduced where machine and<br />
<strong>rock</strong> properties are used to the estimation <strong>of</strong> TBM<br />
<strong>performance</strong> in terms <strong>of</strong> ROP and AR (Ozdemir,<br />
1977; Nelson and O’Rourke 1983; Snowdon et al.,<br />
1983, Lislerud, 1988; Rostami and Ozdemir, 1993;<br />
Rostami 97; Bruland, 1999; Barton, 2000; Yagiz,<br />
2002, 2006a, 2006b; Yagiz et al., 2009). Further,<br />
numerous researches have conducted investigation<br />
on quantifying the <strong>rock</strong> mass properties that affects<br />
on machine <strong>performance</strong> (Bruland, 1999; Yagiz and<br />
Ozdemir, 2001; Cigla et al., 2001; Merguerian and<br />
Ozdemir, 2003; Merguerian, 2001, 2008a, 2008b;<br />
Yagiz, 2008, 2009).<br />
In this paper, TBM <strong>performance</strong> parameters,<br />
including machine specifications, <strong>rock</strong> properties<br />
and encountered ground conditions, have been<br />
investigated by using a database <strong>of</strong> TBM field<br />
<strong>performance</strong>. This database was established using<br />
information from two <strong>tunnel</strong> projects, the Queens<br />
Water <strong>tunnel</strong> in New York City, USA and the<br />
Second Tailrace Tunnel <strong>of</strong> the Manapouri Hydro-<br />
Power Station in New Zealand. The data includes<br />
machine <strong>performance</strong>, detailed information on<br />
machine thrust and power consumption, and<br />
695
geological information from <strong>tunnel</strong> back mapping<br />
and laboratory physical property testing on <strong>rock</strong><br />
samples. Analysis <strong>of</strong> available data has been the<br />
basis for development <strong>of</strong> new <strong>performance</strong> prediction<br />
models <strong>of</strong> related adjustment factors.<br />
2 TUNNEL PROJECTS<br />
The Queens Water Tunnel # 3 was constructed to<br />
improve distribution <strong>of</strong> fresh water throughout the<br />
City <strong>of</strong> New York, especially in borough <strong>of</strong> Queens.<br />
The excess capacity <strong>of</strong>fered by the new <strong>tunnel</strong> allows<br />
for the maintenance <strong>of</strong> two existing <strong>tunnel</strong>s that<br />
have been operating since 1917 and 1936 and will be<br />
an important connecting link for operation <strong>of</strong> the<br />
New York City water <strong>tunnel</strong> system (Yagiz, 2002).<br />
Here, beneath Brooklyn and Queens, an 8 km long<br />
concrete-lined pressure <strong>tunnel</strong> was excavated at an<br />
average depth <strong>of</strong> 200 m below sea level through<br />
<strong>hard</strong>, Proterozoic metamorphic <strong>rock</strong>s <strong>of</strong> the Appalachian<br />
mountain belt by utilizing an open-beam<br />
TBM (Robbins, Model 235-282). The machine<br />
bored through <strong>hard</strong> jointed formations <strong>of</strong> varying<br />
metamorphic and igneous <strong>rock</strong> types, including<br />
diorite gneiss, tonalite, pyroxene-garnet gneiss, and<br />
biotite-hornblende gneiss, intermixed with granite<br />
gneiss, amphibolite, pegmatite, biotite schist as well<br />
as mafic and rhyodacite dikes. (Yagiz, 2002, 2008;<br />
B<strong>rock</strong>, et al., 2001; Merguerian and Ozdemir, 2003).<br />
The Second Tailrace Tunnel <strong>of</strong> the Manapouri<br />
hydro-power station was excavated along the<br />
Table 1. Averaged thrust and <strong>rock</strong> properties in the<br />
Queens Water Tunnel.<br />
Rock type<br />
UCS<br />
(MPa)<br />
BTS<br />
(MPa)<br />
PS kN<br />
(mm)<br />
DPW<br />
(cm)<br />
Alpha<br />
(degree)<br />
Thrust<br />
(Tonne)<br />
Rhyodacite 151 8.9 34 10 42.5 1300<br />
dike<br />
Granitoid 158 9.3 34 102 46.1 1650<br />
gneiss<br />
Amphibolite 161 9.9 43 56 28.3 1460<br />
Orthogneiss 137 9.4 35 111 45.8 1625<br />
Gneiss/schist 148 9.7 33 110 46.7 1610<br />
Table 2. Averaged thrust and <strong>rock</strong> properties in the<br />
Second Manapouri Tailrace Tunnel.<br />
Rock type<br />
UCS BTS PS KN DPW Alpha Thrust<br />
(MPa) (MPa) (mm) (cm) (degree) (Tonne)<br />
Calc-silicate 162 7.7 36 132 37 1564<br />
Granitic gneiss 97 7.1 32 116 34 1537<br />
Meta dolorite 124 12.2 29 163 25 1571<br />
Meta-andesite 147 10.5 33 134 36 1435<br />
Paragneiss 111 10.0 31 333 27 1550<br />
calcslicate, metadolorite, meta-andesite, paragneiss,<br />
and granitic gneiss type <strong>of</strong> <strong>rock</strong> mass in the Southwestern<br />
New Zealand. The objective <strong>of</strong> adding the<br />
tailrace <strong>tunnel</strong> was to increase the overall crosssectional<br />
area <strong>of</strong> flow, thereby reducing the flow<br />
velocities and associated frictional head losses (Kim,<br />
2004; Macfarlane, et al., 2008). The <strong>tunnel</strong> is about<br />
9.8 km long with 10 m diameter and was excavated<br />
with open type TBM (Robbins, Model 323-288).<br />
3 PERFORMANCE FACTORS<br />
FOR HARD ROCK TBM<br />
TBM parameters including thrust and power<br />
together with <strong>rock</strong> material properties and <strong>rock</strong><br />
mass characteristics are main parameters used for<br />
TBM <strong>performance</strong> estimation. Therefore, these key<br />
parameters should be quantified carefully for any<br />
type <strong>of</strong> <strong>hard</strong> <strong>rock</strong> TBM projects. The impact <strong>of</strong><br />
these factors on TBM <strong>performance</strong> and the basis<br />
<strong>of</strong> the existing TBM <strong>performance</strong> prediction models<br />
such as the Colorado School <strong>of</strong> Mines (CSM)<br />
model are discussed herein.<br />
3.1 Machine specifications<br />
The machine specifications and in particular<br />
operational parameters including applied thrust<br />
and power represent the amount <strong>of</strong> forces and<br />
torque delivered to the <strong>rock</strong> via cutterhead and<br />
disc cutters to initiate fracture propagation<br />
in <strong>rock</strong>. Therefore, the cutting geometry/wear<br />
characteristics <strong>of</strong> the cutters installed on the<br />
cutterhead have a significant effect on the efficiency<br />
<strong>of</strong> energy transfer to the <strong>rock</strong> and the attainable<br />
rate <strong>of</strong> penetration. Single disc cutters are the most<br />
commonly used roller cutters for <strong>hard</strong> <strong>rock</strong> TBMs.<br />
The cut spacing and the depth <strong>of</strong> penetration per<br />
cutter head revolution define the efficiency <strong>of</strong> <strong>rock</strong><br />
cutting by disc cutters. As would be expected, the<br />
spacing <strong>of</strong> cutters has a significant impact on the<br />
chipping mechanism and the efficiency <strong>of</strong> <strong>boring</strong>.<br />
Geometry <strong>of</strong> disc cutters, thrust, and power are<br />
the main machine parameters utilized in the CSM<br />
model together with intact <strong>rock</strong> properties; UCS<br />
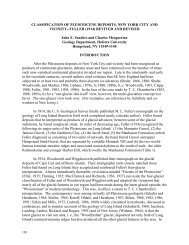
and BTS. Figure 1 is an example <strong>of</strong> <strong>performance</strong><br />
prediction by the CSM <strong>hard</strong> <strong>rock</strong> TBM<br />
<strong>performance</strong> prediction model, where machine<br />
ROP and operational parameters are estimated for<br />
a given <strong>rock</strong> strength. It is important to note that<br />
this graph does not represent the effects <strong>of</strong> <strong>rock</strong><br />
mass or joints present at the face.<br />
3.2 Rock material properties<br />
The UCS and BTS are frequently measured intact<br />
<strong>rock</strong> properties to be utilized for TBM <strong>performance</strong><br />
696
9.0<br />
8.0<br />
7.0<br />
3000<br />
2500<br />
2.5<br />
2.0<br />
ROP (m/hr)<br />
6.0<br />
5.0<br />
4.0<br />
3.0<br />
2.0<br />
ROP (m/hr)<br />
500<br />
1.0<br />
Cutterhead Power (kW)<br />
Thrust (ton)<br />
0.0<br />
0<br />
0 50 100 150 200 250 300<br />
Uniaxial Compressive Strength (MPa)<br />
Figure 1. Typical TBM <strong>performance</strong> curve in the existing<br />
CSM model.<br />
prediction (Ozdemir, 1977; Rostami, 1997; Cigla,<br />
et al., 2001; Yagiz et al., 2008). Furthermore, the ease<br />
or difficulty <strong>of</strong> crack propagation in <strong>rock</strong>, which<br />
is <strong>of</strong>ten referred to as brittleness has significant<br />
effect on <strong>rock</strong> boreability. There is no universal<br />
test accepted quantitative measurement for <strong>rock</strong><br />
brittleness; however, several different indices have<br />
been introduced, including UCS/BTS ratio (Hucka<br />
and Das, 1974), Sievers’ J value and S 20<br />
by the NTNU<br />
(Bruland, 1999) <strong>rock</strong> brittleness index obtained via<br />
punch penetration test (Yagiz, 2009). Dollinger,<br />
et al., (1998) stated that the punch penetration<br />
test is a useful tool for studying various machine<br />
parameters including the effect <strong>of</strong> cutter tip width,<br />
cutter spacing and depth <strong>of</strong> penetration on the force<br />
required for <strong>rock</strong> excavation. Nevertheless, these<br />
concepts have not been accepted by the extended<br />
<strong>rock</strong> mechanics testing community as yet. Reference<br />
intact <strong>rock</strong> properties, including UCS and BTS,<br />
have been usually measured in <strong>rock</strong> mechanic<br />
laboratories by following relevant standards. These<br />
<strong>rock</strong> properties are then used as input intact <strong>rock</strong><br />
variables to estimate the rate <strong>of</strong> penetration in many<br />
TBM <strong>performance</strong> prediction methods (i.e. the<br />
CSM model). But these tests, although have some<br />
indication <strong>of</strong> <strong>rock</strong> brittleness behavior, the need<br />
an adjustment for <strong>rock</strong> brittleness to represent this<br />
specific intrinsic property <strong>of</strong> the <strong>rock</strong>. Hence an<br />
adjustment factor has been introduced as one <strong>of</strong> the<br />
input parameters for use in the Modified CSM model<br />
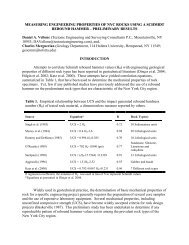
(MCSM) for predicting the ROP. Figure 2 shows the<br />
variation <strong>of</strong> the Brittleness Index (BI) as a function<br />
<strong>of</strong> peak slope which is measured by the punch test.<br />
The use <strong>of</strong> this adjustment factor allows for more<br />
accurate prediction TBM <strong>performance</strong> based on<br />
intact <strong>rock</strong> properties, thus more reasonable predictions<br />
are possible in massive <strong>rock</strong> conditions.<br />
3.3. Rock mass characteristics<br />
Rock mass properties including distance between<br />
the planes <strong>of</strong> weakness (DPW), orientation<br />
2000<br />
1500<br />
1000<br />
CH. Power (kW) / Thrust (ton)<br />
Adjustment for BI<br />
1.5<br />
1.0<br />
0.5<br />
0.0<br />
0 10 20 30 40 50 60<br />
PS (kN/mm)<br />
Figure 2. Adjustment factor for <strong>rock</strong> brittleness in the<br />
MCSM model (Yagiz, 2002).<br />
<strong>of</strong> these planes, as well as presence, frequency,<br />
and orientation <strong>of</strong> faults, joints, and foliations<br />
play a significant role in TBM <strong>performance</strong>.<br />
Orientation <strong>of</strong> weakness zone with respect to<br />
the direction <strong>of</strong> machine advance can control on<br />
TBM <strong>performance</strong> (Bruland, 1999; Yagiz, 2002).<br />
Therefore, both orientation <strong>of</strong> joints and faults<br />
together with direction <strong>of</strong> machine advancement<br />
needs to be quantified for estimation <strong>of</strong> TBM<br />
<strong>performance</strong>. Since 1980’s (Lislerud, 1988;<br />
Bruland, 1999), Norwegian University <strong>of</strong> Science<br />
and Technology (NTNU) has developed a <strong>hard</strong><br />
<strong>rock</strong> TBM prognosis model that count orientation<br />
<strong>of</strong> joint and direction <strong>of</strong> machine advancement via<br />
alpha angle that is the angle measured between the<br />
plane <strong>of</strong> weakness and <strong>tunnel</strong> axis.<br />
Likewise, the joint/fissure system could be<br />
quantified by using fracture class designation<br />
introduced by the NTNU. As a result, orientation<br />
<strong>of</strong> discontinuities via alpha angle and distance<br />
between the planes <strong>of</strong> weakness have been<br />
quantified and used to make correlation between<br />
geological condition and the rate <strong>of</strong> penetration<br />
for investigated projects. Further, those <strong>rock</strong> mass<br />
properties are utilized as in put variables into<br />
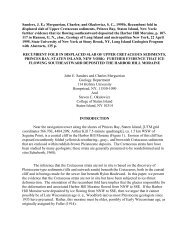
the MCSM model (Yagiz, 2002). Therefore, <strong>rock</strong><br />
fracture index (RFI) has been introduced and used<br />
as an adjustment factor that especially significant<br />
for fractured <strong>rock</strong> mass condition (Figure 3).<br />
It should be noted that direct use <strong>of</strong> the NTNU<br />
fracture and joint classes in other modeling systems<br />
are fairly difficult and needs a deep understanding<br />
<strong>of</strong> both systems to allow their efficient<br />
and accurate use in adjustment <strong>of</strong> estimated rates<br />
by the existing models such as CSM model. This<br />
is because <strong>of</strong> the inherently different approaches<br />
used in each system to estimate the penetration rate<br />
and thus each seem to be most effective in a certain<br />
ground conditions. This refers to CSM model to be<br />
697
Adjustment for RFI<br />
3.0<br />
2.0<br />
90 ο<br />
80 ο<br />
70 ο<br />
1.0<br />
60 o<br />
50 ο<br />
40 ο<br />
DPW (cm)<br />
30 ο<br />
20 0.0<br />
ο<br />
10 ο<br />
0 20 40 60 80 100 120 140 160 180 200<br />
-1.0<br />
-2.0<br />
-3.0<br />
Alpha 0 10 Degree 20 Degree 30 Degree 40 Degree<br />
50 Degree 60 Degree 70 Degree 80 Degree 90 Degree<br />
Figure 3. Adjustment factor for <strong>rock</strong> mass properties in<br />
the MCSM model (Yagiz, 2002).<br />
more efficient in massive <strong>rock</strong> types and sedimentary<br />
<strong>rock</strong> while the NTNU system is more suitable<br />
in jointed <strong>rock</strong> masses and metamorphic <strong>rock</strong> with<br />
known fissures and related features.<br />
Each model can predict machine <strong>performance</strong><br />
when all the conforming input parameters <strong>of</strong> pertinent<br />
model are used in the process. Meanwhile,<br />
many attempts has been made to use other <strong>rock</strong><br />
mass characterization methods including joint<br />
systems, RQD, and <strong>rock</strong> mass classification for<br />
adjustment <strong>of</strong> ROP from the CSM models (Yagiz,<br />
2006b; Ramezanzadeh et al., 2008). A recent study<br />
by Hassanzadeh et al. (2009) has <strong>of</strong>fered a new<br />
model for adjustment <strong>of</strong> ROP predicted by CSM<br />
model based on Geological Strength Index (GSI)<br />
which was introduced by Hoek et al. (1995). This<br />
adjustment factor seems to be reasonable in prediction<br />
<strong>of</strong> the anticipated penetration rate. Same<br />
study has <strong>of</strong>fered a new relationship between Field<br />
Penetration Index (FPI) and GSI for various sedimentary<br />
<strong>rock</strong>s that allows machine <strong>performance</strong><br />
prediction using the applied cutterload.<br />
4 DISCUSSION AND RESULTS<br />
The CSM model has been developed by Ozdemir,<br />
(1977) and it is updated as field and laboratory<br />
data became available to increase its accuracy for<br />
various <strong>rock</strong> types (Rostami and Ozdemir, 1993;<br />
Rostami, 1997; Cheema, 1999; Yagiz, 2002). The<br />
model gives promising result for predicting ROP<br />
for massive <strong>rock</strong> mass; however, <strong>rock</strong> behavior is<br />
<strong>of</strong>ten controlled by the structural features such<br />
as joins and planes <strong>of</strong> discontinuities and weaknesses.<br />
Since most <strong>of</strong> the geological conditions<br />
encountered in the <strong>tunnel</strong>ing operation involve<br />
<strong>rock</strong> mass with fractures and discontinuities that<br />
makes <strong>rock</strong> weaker than expected, the model may<br />
provide inaccurate result. Therefore, it requires<br />
α<br />
0 o<br />
relevant adjustments to account for <strong>rock</strong> mass<br />
behavior.<br />
As result, developed adjustment factors for<br />
RFI, BI, and similar approaches explained in<br />
this paper should be used in conjunction with the<br />
actual model to achieve better accuracies in <strong>performance</strong><br />
prediction. For this purpose, one can<br />
estimate the ROP from the CSM model as function<br />
<strong>of</strong> the UCS, BTS, cutter and cutting geometry,<br />
and thrust and power <strong>of</strong> TBM, then use<br />
adjustment factors such as RFI and BI to fine tune<br />
the estimated rates for given <strong>rock</strong> mass characteristics.<br />
An example <strong>of</strong> such equations for adjustment<br />
<strong>of</strong> the estimated ROP is provided below. In<br />
this formula the ROP could be estimated from the<br />
base CSM model and adjusted for fractured/<strong>rock</strong><br />
mass conditions.<br />
ROP (m/h) = 0.097 × ROP(CSM) + RFI + BI<br />
ROP (m/hr) = 0.097 × ROP (CSM) + RFI + BI (1)<br />
In this formula, ROP (CSM) is the basic penetration<br />
rate obtained from the CSM model as in<br />
m/hr; both RFI and BI can be estimated from the<br />
charts given in this paper. Obtained ROP (m/hr)<br />
reported as the result <strong>of</strong> Modified CSM model.<br />
The Modified model <strong>of</strong>fers better result for case<br />
study <strong>of</strong> <strong>tunnel</strong>s in the described database where the<br />
<strong>tunnel</strong> has passed through fractured <strong>rock</strong> masses<br />
(Tables 3 and 4). As excavated <strong>rock</strong> mass is highly<br />
fractured and faulted, the ROP mainly depends on<br />
the <strong>rock</strong> mass fractures properties including orientation,<br />
spacing and brittleness rather than <strong>rock</strong><br />
strength (UCS and BTS) that are used as inputs for<br />
the CSM model.<br />
Even though introduced models (i.e., CSM and<br />
MCSM) are acceptable for predicting TBM <strong>performance</strong>,<br />
further improvement <strong>of</strong> these models is<br />
needed.<br />
Various research groups are dealing with<br />
machine-<strong>rock</strong> interaction and <strong>performance</strong> prediction<br />
<strong>of</strong> <strong>hard</strong> <strong>rock</strong> TBMs and have been focusing on<br />
improvement <strong>of</strong> models especially in jointed <strong>rock</strong><br />
masses. This effort is underway by expanding and<br />
sharing database as well as developing new models<br />
Table 3. Actual and predicted TBM <strong>performance</strong> for<br />
the Queens Water Tunnel.<br />
Rock<br />
type<br />
Cutter<br />
Load<br />
(kNf)<br />
ROP<br />
(Field)<br />
(m/hr)<br />
ROP<br />
(CSM)<br />
(m/hr)<br />
ROP<br />
(MCSM)<br />
(m/hr)<br />
Rhyodacite dike 260 2.42 4.07 2.27<br />
Granitoid gneiss 330 2.02 3.86 2.06<br />
Amphibolite 292 2.35 3.71 2.30<br />
Orthogneiss 325 2.05 4.31 2.11<br />
Gneiss/schist 322 1.99 4.00 2.03<br />
698
Table 4. Actual and predicted TBM <strong>performance</strong> for<br />
the Second Manapouri Tailrace Tunnel.<br />
Rock<br />
type<br />
and adjustment factors to allow for more accurate<br />
representation <strong>of</strong> the <strong>rock</strong> mass parameters and<br />
ground conditions.<br />
ACKNOWLEDGEMENTS<br />
Partial grant provided by the Scientific Research<br />
Center <strong>of</strong> Pamukkale University (PAU-BAP) to<br />
attend the conference is acknowledged.<br />
REFERENCES<br />
Cutter<br />
Load<br />
(kNf)<br />
ROP<br />
(Field)<br />
(m/hr)<br />
ROP<br />
(CSM)<br />
(m/hr)<br />
ROP<br />
(MCSM)<br />
(m/hr)<br />
Calc-silicate 230 1.04 2.31 1.86<br />
Granitic gneiss 226 1.26 3.66 1.90<br />
Meta dolorite 231 0.94 2.43 1.55<br />
Meta-andesite 211 1.32 2.28 1.77<br />
Paragneiss 228 1.11 2.85 1.27<br />
Barton, N. 2000. TBM <strong>tunnel</strong>ing in jointed and faulted<br />
<strong>rock</strong>. Balkema. Netherlands, 173p.<br />
B<strong>rock</strong>, P.C., B<strong>rock</strong>, P.W.G., Merguerian, C. 2001. The<br />
Queens Tunnel Complex: a newly discovered granulite<br />
facies Fordham orthogneiss complex that dominates<br />
the subsurface <strong>of</strong> western Queens. 8th Annual Conference<br />
on Geology <strong>of</strong> Long Island and Metropolitan New<br />
York, 1–8p, SUNY, New York USA.<br />
Bruland, A. 1999. Hard <strong>rock</strong> <strong>tunnel</strong> <strong>boring</strong>: Advance<br />
rate and cutter wear. Trondheim: Norwegian Institute<br />
<strong>of</strong> Technology (NTNU), Trondheim, Norway.<br />
Cheema, S. 1999. Development <strong>of</strong> a <strong>rock</strong> mass boreability<br />
index for the <strong>performance</strong> <strong>of</strong> <strong>tunnel</strong> <strong>boring</strong> <strong>machines</strong>.<br />
PhD Thesis. 262p., Department <strong>of</strong> Mining Engineering,<br />
Colorado School <strong>of</strong> Mines, Co USA.<br />
Cigla M., Yagiz, S., Ozdemir, L. 2001. Application <strong>of</strong><br />
<strong>tunnel</strong> <strong>boring</strong> <strong>machines</strong> in underground mining development.<br />
In: Unal, E. et al. (eds), Proceedings <strong>of</strong> 17th<br />
International Mining Congress and Exhibition <strong>of</strong> Turkey,<br />
155–164, Ankara, Turkey.<br />
Dollinger, G.L., Handewith, H.J., Breeds, C.D. 1999. Use<br />
<strong>of</strong> punch test for estimating TBM <strong>performance</strong>. Tunneling<br />
Underground Space Technol. 13: 403–408.<br />
Hassanpour, J., Rostami, J., Khamechian, M., Bruland, A.,<br />
Tavakoli, H.R. 2009. TBM <strong>performance</strong> analysis in<br />
pyroclastic <strong>rock</strong>s, a case history <strong>of</strong> Karaj Water Conveyance<br />
Tunnel (KWCT). Rock Mechanics and Rock<br />
Engineering Journal, (online in July 2009).<br />
Hoek, E., Kaiser, P.K., Bawden, W.F. 1995. Support<br />
<strong>of</strong> underground excavations in <strong>hard</strong> <strong>rock</strong>. Balkema.<br />
Netherlands, 215p.<br />
Hucka, V., Das, B. 1974. Brittleness determination <strong>of</strong><br />
<strong>rock</strong>s by different methods. Int. Journal <strong>of</strong> Rock Mech.<br />
Mining Sciences. 11: 389–392.<br />
Kim, T. 2004. Development <strong>of</strong> a fuzzy logic based utilization<br />
predictor model for <strong>hard</strong> <strong>rock</strong> <strong>tunnel</strong> <strong>boring</strong><br />
<strong>machines</strong>. PhD Thesis, 254p., Department <strong>of</strong> Mining<br />
Engineering Colorado School <strong>of</strong> Mines, Colorado,<br />
USA.<br />
Lislerud, A. 1988. Hard <strong>rock</strong> <strong>tunnel</strong> <strong>boring</strong>: Prognosis<br />
and Costs. Tunneling and Underground Space Technology,<br />
3(1): 9–17.<br />
MacFarlane, D.F., Watts, C.R., Nilsen, B. 2008. Field<br />
application <strong>of</strong> NTH fracture classification at the<br />
Second Manapouri Tailrace <strong>tunnel</strong>, New Zealand.<br />
In: Roach, M.F. et al. (eds), Proceedings <strong>of</strong> North<br />
American Tunneling Conference, 236–242.<br />
Merguerian, C. 2001. Young rhyodacite dikes found in<br />
the Queens Tunnel, beneath Woodside, Queens. In:<br />
Hanson, G. N., (eds). 8th Annual Conference on Geology<br />
<strong>of</strong> Long Island and metropolitan New York, SUNY,<br />
9–11. New York, USA.<br />
Merguerian, C. 2008a. Evaluating geological controls<br />
on <strong>hard</strong> <strong>rock</strong> excavation, New York City, NY. In:<br />
A Specialty Seminar <strong>of</strong> Manhattan on the Rocks,<br />
Geotechnical Group <strong>of</strong> Metropolitan Section, ASCE,<br />
31p, New York City USA.<br />
Merguerian, C. 2008b. Geological controls on means<br />
and methods <strong>of</strong> <strong>hard</strong> <strong>rock</strong> excavation, New York City,<br />
NY. In: Gorring, M.L. (ed), 25th Annual Conference<br />
Proceedings <strong>of</strong> Environmental and Engineering Geology<br />
<strong>of</strong> Northeastern New Jersey, Geological Society <strong>of</strong><br />
New Jersey, 79–109.<br />
Merguerian, C., Ozdemir, L. 2003. Rock mass properties<br />
and <strong>hard</strong> <strong>rock</strong> TBM penetration rate investigations,<br />
Queens Tunnel Complex, NYC Water Tunnel #3,<br />
Stage 2, In: Robinson, R.A. and Marquardt, J.M.<br />
(eds.) Proceedings <strong>of</strong> Rapid Excavation and Tunneling<br />
Conferences, 1019–1036.<br />
Nelson, P.P., O’Rourke, T.D. 1983. Tunnel <strong>boring</strong><br />
machine <strong>performance</strong> in sedimentary <strong>rock</strong>s, Report<br />
to Goldberg-Zoino Associates <strong>of</strong> New York, P.C., by<br />
School <strong>of</strong> Civil and Environmental <strong>of</strong> Civil Engineering.<br />
Cornell University, 438p, Ithaca, NY.<br />
Ozdemir, L. 1977. Development <strong>of</strong> theoretical equations<br />
for predicting <strong>tunnel</strong> borability. PhD. Thesis, T-1969,<br />
Colorado School <strong>of</strong> mines, Golden, Co<br />
Ramezanzadeh, A., Rostami, J., Tadic, D. 2008. Impact<br />
<strong>of</strong> <strong>rock</strong> mass characteristics on <strong>hard</strong> <strong>rock</strong> TBM<br />
<strong>performance</strong>. 13th Australian Tunneling Conference.<br />
213–220, Melbourne, Australia.<br />
Rostami, J., Ozdemir, L. 1993. A new model for <strong>performance</strong><br />
prediction <strong>of</strong> <strong>hard</strong> <strong>rock</strong> TBMs. In: Bowerman,<br />
L.D. et al. (eds), Proceedings <strong>of</strong> Rapid Excavation and<br />
Tunneling Conferences, chapter 50, 793–809, Boston<br />
MA USA.<br />
Rostami, J. 1997. Development <strong>of</strong> a force estimation<br />
model for <strong>rock</strong> fragmentation with disc cutters<br />
through theoretical modeling and physical measurement<br />
<strong>of</strong> crushed zone pressure. PhD. Thesis, 382p.,<br />
Department <strong>of</strong> Mining Engineering, Colorado School<br />
<strong>of</strong> Mines. Colorado USA.<br />
Snowdon, A. R., Ryley, D.M., Temporal, J. 1982. Study<br />
<strong>of</strong> disc cutting in selected British <strong>rock</strong>s, Int. J. <strong>of</strong> Rock<br />
Mechanics and Mining Science and Abstracts. 19:<br />
107–121.<br />
Yagiz, S., Ozdemir, L. 2001. Geotechnical parameters<br />
<strong>influencing</strong> the TBM <strong>performance</strong> in various <strong>rock</strong>s. In:<br />
699
program with abstract, 44th Annual Meeting <strong>of</strong> Association<br />
<strong>of</strong> Engineering Geologists; Technical Session<br />
10; Engineering Geology for Construction Practices.<br />
79. Saint Louis, Missouri, USA.<br />
Yagiz, S. 2002. Development <strong>of</strong> <strong>rock</strong> fracture & brittleness<br />
indices to quantifying the effects <strong>of</strong> <strong>rock</strong> mass features &<br />
toughness in the CSM Model basic penetration for <strong>hard</strong><br />
<strong>rock</strong> <strong>tunnel</strong>ing <strong>machines</strong>. PhD. Thesis. T-5605, 289p.,<br />
Department <strong>of</strong> Mining and Earth Systems Engineering,<br />
Colorado School <strong>of</strong> Mines, Co USA<br />
Yagiz, S. 2006a. TBM <strong>performance</strong> prediction based on<br />
<strong>rock</strong> properties. In: Cotthem, A.V. et al. (ed), Proceedings<br />
<strong>of</strong> Multiphysics Coupling and Long Term Behavior<br />
in Rock Mechanics, EUROCK’06, 663–670. Liege,<br />
Belgium.<br />
Yagiz, S. 2006b. A Model for prediction <strong>of</strong> <strong>tunnel</strong> <strong>boring</strong><br />
machine <strong>performance</strong>. Proceedings <strong>of</strong> 10th IAEG Congress,<br />
paper no. 383, (in DVD), the Geological Society<br />
<strong>of</strong> London, Nottingham, U.K.<br />
Yagiz, S. 2008. Utilizing <strong>rock</strong> mass properties for predicting<br />
TBM <strong>performance</strong> in <strong>hard</strong> <strong>rock</strong> condition.<br />
Tunneling and Underground Space Technology, 23:<br />
326–339.<br />
Yagiz, S., Rostami, J., Ozdemir, L. 2008. Recommended<br />
<strong>rock</strong> testing methods for predicting TBM <strong>performance</strong>:<br />
Focus on the CSM and NTNU Models. In:<br />
Majdi, A. and Ghazvinian A., (eds), Proceedings <strong>of</strong> the<br />
ISRM International Symposium 2008, 5th Asian Rock<br />
Mechanics Symposium, 1523–1530, Tehran, Iran.<br />
Yagiz, S. 2009. Assessment <strong>of</strong> brittleness using <strong>rock</strong><br />
strength and density with punch penetration test. Tunneling<br />
and Underground Space Technology, 24: 66–74.<br />
Yagiz, S., Gokceoglu, C., Sezer, E., Iplikci, S. 2009.<br />
Application <strong>of</strong> two non-linear prediction tools to the<br />
estimation <strong>of</strong> <strong>tunnel</strong> <strong>boring</strong> machine <strong>performance</strong>.<br />
Engineering Application <strong>of</strong> Artificial Intelligence, 22:<br />
818–824.<br />
700