<strong>the</strong> average room rate since 1997 (an average 3.4 percent increase per year), <strong>the</strong> room-night increase led to a 19 percent rise in total lodging expenses by nonresident attendees. Exhibitors are estimated to have rented 229,000 room-nights, leading to an additional $17.6 million in room sales, an increase <strong>of</strong> 20 percent over 1997 exhibitor lodging expenses. The implied average room rate for exhibitors was $77.08. Multiplier analysis shows that <strong>the</strong> spending and respending <strong>of</strong> this $59.9 million in room sales generated roughly $128 million in total “new” sales dollars for <strong>the</strong> Louisville economy. Even after adjusting for inflation, <strong>the</strong> sales impact appears to have grown by 11.8 percent over <strong>the</strong> past four years. These new sales dollars support almost 2,500 jobs, with a total payroll <strong>of</strong> just over $42 million. Food Expenditures It was estimated that nonresident attendees spent about $50 million on meals during <strong>the</strong>ir stays in Louisville. This is a 33.6 percent increase over our estimate for 1997. However, in this year’s study, we added in an estimate <strong>of</strong> <strong>the</strong> meal expenditures for nonresident daytrippers. This amounted to about $8 million. Without that amount in <strong>the</strong> total, <strong>the</strong> increase is 12 percent over 1997. We also estimated that nonresident exhibitors spent nearly $13 million on food, about <strong>the</strong> same as in 1997. The implied food per diem for attendees was $38.84 while it was $36.71 for exhibitors. Applying <strong>the</strong> appropriate multipliers to this $62.6 million in food expenditures results in a net new sales impact <strong>of</strong> about $122 million to <strong>the</strong> Louisville metro economy, which supported over 2,600 jobs having a total payroll <strong>of</strong> about $36 million. Even after adjusting for inflation, <strong>the</strong> total direct and indirect effects from food expenditures appears to have grown by about 17.4 percent (however, taking out <strong>the</strong> daytripper expenditures reduces <strong>the</strong> inflation adjusted gain to just 2.4 percent). O<strong>the</strong>r Expenditures by Nonresident Attendees and Exhibitors Per diem rates for personal shopping, entertainment, and o<strong>the</strong>r expenses were derived from survey information received from event organizers and interviews with exhibitors and attendees, supplemented with common sense. For attendees, <strong>the</strong> per diem rate used was $50 for most conventions and trade shows, and $20 for livestock events, events attended almost exclusively by Kentuckians, events drawing a lot <strong>of</strong> families (such as <strong>the</strong> <strong>Kentucky</strong> <strong>State</strong> <strong>Fair</strong>), family attractions, most public expositions and sales, and single day sporting events. The various events at <strong>the</strong> KFEC and KICC attract attendees with varying levels <strong>of</strong> income and propensities to spend money on entertainment while <strong>the</strong>y are in town. For exhibitors, <strong>the</strong> per diem rate used was $20 for all events except <strong>the</strong> largest trade shows where it was $50. We estimate that nonresident attendees spent about $38 million on o<strong>the</strong>r personal expenditures in <strong>2001</strong>, an increase <strong>of</strong> about 17 percent over 1997. The implied rate per day was $35.57. Personal shopping, entertainment, and o<strong>the</strong>r expenses in <strong>2001</strong> by nonresident exhibitors were estimated to be just over $7 million, a six percent increase over 1997. The multiplier analysis shows that <strong>the</strong> spending and respending <strong>of</strong> this $45.5 million <strong>of</strong> personal expenditures generated roughly $89 million in “new” sales dollars for <strong>the</strong> Louisville economy. After adjusting for inflation, <strong>the</strong> sales impact appears to have grown by about eight percent over <strong>the</strong> past four years. These new sales dollars support about 1,850 jobs, with a total payroll <strong>of</strong> over $32 million. In our exhibitor interviews, we found a surprising similarity among disparate types <strong>of</strong> events in terms <strong>of</strong> what exhibitors spent locally on items associated with <strong>the</strong> setup, operation, and tear-down <strong>of</strong> <strong>the</strong>ir exhibits. We used a cost <strong>of</strong> $600 per nonresident business for conventions, public expositions, and trade shows. For public sales we based our estimates on information received from <strong>the</strong> largest flea market promoter. We assumed $50 per nonresident business if <strong>the</strong> event organizer was not from <strong>the</strong> Louisville area and $300 per nonresident business when <strong>the</strong> event organizer was local (in order to cover booth space rental). Nonresident exhibitor business expenses were estimated to be $9 million for <strong>2001</strong>, an increase <strong>of</strong> 19 percent over <strong>the</strong> estimate for 1997. Estimates for event organizer expenses were derived from survey information received from and telephone interviews with event organizers. This was supplemented with information on <strong>the</strong> <strong>Fair</strong> <strong>Board</strong>’s own external expenditures for its in-house produced events. Livestock events, a few very low-key conventions, and public sales are <strong>the</strong> cheapest types <strong>of</strong> events to put on. Public expositions cost a little more (on a per attendee basis). Trade shows and conventions with a lot <strong>of</strong> <strong>of</strong>ficial functions are <strong>the</strong> most costly, with lower pr<strong>of</strong>ile pr<strong>of</strong>essional conventions between public expositions and fancy conventions. In addition, moderately sized trade shows and conventions are more costly on a per attendee basis than <strong>the</strong> largest events due to economies <strong>of</strong> scale. We estimate event organizer expenses to be over $13 million for <strong>2001</strong>. This represents an increase <strong>of</strong> 48 percent over <strong>the</strong> 1997 estimate. Multiplier analysis <strong>of</strong> Exhibitor and Event Organizer Business Expenses shows that <strong>the</strong> spending and respending <strong>of</strong> <strong>the</strong> $22 million in combined sales generated roughly $44 million in “new” sales dollars for <strong>the</strong> Louisville economy. After adjusting for inflation, <strong>the</strong> impact <strong>of</strong> <strong>the</strong>se expenditures appears to have grown by 26 percent over <strong>the</strong> past four years. These new sales dollars support about 650 jobs, with a total payroll <strong>of</strong> over $14 million. Spending to bed, feed, and o<strong>the</strong>rwise care for animals housed at <strong>the</strong> KFEC during events was estimated to be over $3 million in <strong>2001</strong>. This is an increase <strong>of</strong> $1.7 million over 1997. Applying <strong>the</strong> multipliers results in an overall impact <strong>of</strong> over $7 million in new sales, supporting about 120 jobs with a payroll <strong>of</strong> $2.3 million. <strong>Fair</strong> <strong>Board</strong> Receipts The <strong>Fair</strong> <strong>Board</strong> provided accounting information by event on receipts for tickets, admission, parking, fees, concessions, novelties, space rental, and o<strong>the</strong>r goods and services. In most cases, concession proceeds to <strong>the</strong> <strong>Fair</strong> <strong>Board</strong> are actually a commission paid by concessionaires operating on <strong>the</strong> premises. The commissions vary by event and product category. After consultation with our <strong>Fair</strong> <strong>Board</strong> data provider, we decided to continue using <strong>the</strong> estimate <strong>of</strong> average commission from <strong>the</strong> 1992 study, which was 33%. We use that figure to blow up <strong>Fair</strong> <strong>Board</strong> concessions receipts to a gross sales value. 14 K E N T U C K Y S T A T E F A I R B O A R D
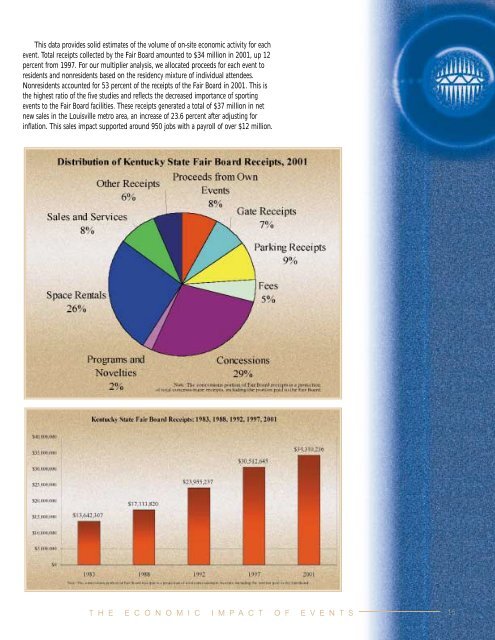
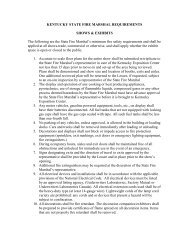
This data provides solid estimates <strong>of</strong> <strong>the</strong> volume <strong>of</strong> on-site economic activity for each event. Total receipts collected by <strong>the</strong> <strong>Fair</strong> <strong>Board</strong> amounted to $34 million in <strong>2001</strong>, up 12 percent from 1997. For our multiplier analysis, we allocated proceeds for each event to residents and nonresidents based on <strong>the</strong> residency mixture <strong>of</strong> individual attendees. Nonresidents accounted for 53 percent <strong>of</strong> <strong>the</strong> receipts <strong>of</strong> <strong>the</strong> <strong>Fair</strong> <strong>Board</strong> in <strong>2001</strong>. This is <strong>the</strong> highest ratio <strong>of</strong> <strong>the</strong> five studies and reflects <strong>the</strong> decreased importance <strong>of</strong> sporting events to <strong>the</strong> <strong>Fair</strong> <strong>Board</strong> facilities. These receipts generated a total <strong>of</strong> $37 million in net new sales in <strong>the</strong> Louisville metro area, an increase <strong>of</strong> 23.6 percent after adjusting for inflation. This sales impact supported around 950 jobs with a payroll <strong>of</strong> over $12 million. T H E E C O N O M I C I M P A C T O F E V E N T S 15