2001 Economic Impact Study of the Kentucky State Fair Board
2001 Economic Impact Study of the Kentucky State Fair Board
2001 Economic Impact Study of the Kentucky State Fair Board

You also want an ePaper? Increase the reach of your titles
YUMPU automatically turns print PDFs into web optimized ePapers that Google loves.
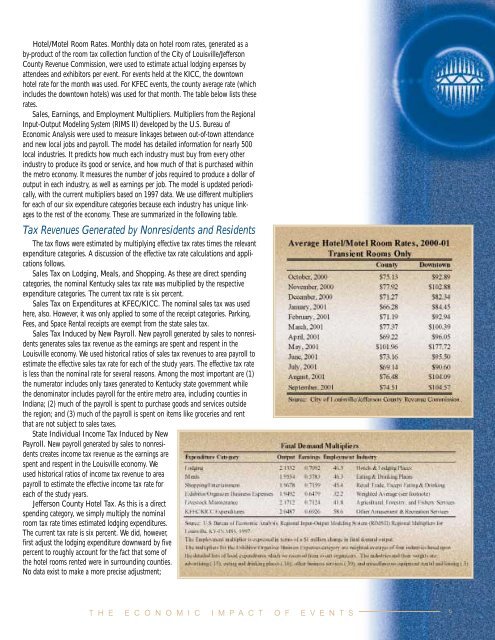
Hotel/Motel Room Rates. Monthly data on hotel room rates, generated as a<br />
by-product <strong>of</strong> <strong>the</strong> room tax collection function <strong>of</strong> <strong>the</strong> City <strong>of</strong> Louisville/Jefferson<br />
County Revenue Commission, were used to estimate actual lodging expenses by<br />
attendees and exhibitors per event. For events held at <strong>the</strong> KICC, <strong>the</strong> downtown<br />
hotel rate for <strong>the</strong> month was used. For KFEC events, <strong>the</strong> county average rate (which<br />
includes <strong>the</strong> downtown hotels) was used for that month. The table below lists <strong>the</strong>se<br />
rates.<br />
Sales, Earnings, and Employment Multipliers. Multipliers from <strong>the</strong> Regional<br />
Input-Output Modeling System (RIMS II) developed by <strong>the</strong> U.S. Bureau <strong>of</strong><br />
<strong>Economic</strong> Analysis were used to measure linkages between out-<strong>of</strong>-town attendance<br />
and new local jobs and payroll. The model has detailed information for nearly 500<br />
local industries. It predicts how much each industry must buy from every o<strong>the</strong>r<br />
industry to produce its good or service, and how much <strong>of</strong> that is purchased within<br />
<strong>the</strong> metro economy. It measures <strong>the</strong> number <strong>of</strong> jobs required to produce a dollar <strong>of</strong><br />
output in each industry, as well as earnings per job. The model is updated periodically,<br />
with <strong>the</strong> current multipliers based on 1997 data. We use different multipliers<br />
for each <strong>of</strong> our six expenditure categories because each industry has unique linkages<br />
to <strong>the</strong> rest <strong>of</strong> <strong>the</strong> economy. These are summarized in <strong>the</strong> following table.<br />
Tax Revenues Generated by Nonresidents and Residents<br />
The tax flows were estimated by multiplying effective tax rates times <strong>the</strong> relevant<br />
expenditure categories. A discussion <strong>of</strong> <strong>the</strong> effective tax rate calculations and applications<br />
follows.<br />
Sales Tax on Lodging, Meals, and Shopping. As <strong>the</strong>se are direct spending<br />
categories, <strong>the</strong> nominal <strong>Kentucky</strong> sales tax rate was multiplied by <strong>the</strong> respective<br />
expenditure categories. The current tax rate is six percent.<br />
Sales Tax on Expenditures at KFEC/KICC. The nominal sales tax was used<br />
here, also. However, it was only applied to some <strong>of</strong> <strong>the</strong> receipt categories. Parking,<br />
Fees, and Space Rental receipts are exempt from <strong>the</strong> state sales tax.<br />
Sales Tax Induced by New Payroll. New payroll generated by sales to nonresidents<br />
generates sales tax revenue as <strong>the</strong> earnings are spent and respent in <strong>the</strong><br />
Louisville economy. We used historical ratios <strong>of</strong> sales tax revenues to area payroll to<br />
estimate <strong>the</strong> effective sales tax rate for each <strong>of</strong> <strong>the</strong> study years. The effective tax rate<br />
is less than <strong>the</strong> nominal rate for several reasons. Among <strong>the</strong> most important are (1)<br />
<strong>the</strong> numerator includes only taxes generated to <strong>Kentucky</strong> state government while<br />
<strong>the</strong> denominator includes payroll for <strong>the</strong> entire metro area, including counties in<br />
Indiana; (2) much <strong>of</strong> <strong>the</strong> payroll is spent to purchase goods and services outside<br />
<strong>the</strong> region; and (3) much <strong>of</strong> <strong>the</strong> payroll is spent on items like groceries and rent<br />
that are not subject to sales taxes.<br />
<strong>State</strong> Individual Income Tax Induced by New<br />
Payroll. New payroll generated by sales to nonresidents<br />
creates income tax revenue as <strong>the</strong> earnings are<br />
spent and respent in <strong>the</strong> Louisville economy. We<br />
used historical ratios <strong>of</strong> income tax revenue to area<br />
payroll to estimate <strong>the</strong> effective income tax rate for<br />
each <strong>of</strong> <strong>the</strong> study years.<br />
Jefferson County Hotel Tax. As this is a direct<br />
spending category, we simply multiply <strong>the</strong> nominal<br />
room tax rate times estimated lodging expenditures.<br />
The current tax rate is six percent. We did, however,<br />
first adjust <strong>the</strong> lodging expenditure downward by five<br />
percent to roughly account for <strong>the</strong> fact that some <strong>of</strong><br />
<strong>the</strong> hotel rooms rented were in surrounding counties.<br />
No data exist to make a more precise adjustment;<br />
T H E E C O N O M I C I M P A C T O F E V E N T S<br />
9