International Securities Exchange First Quarter 2006 ... - Ise.com
International Securities Exchange First Quarter 2006 ... - Ise.com
International Securities Exchange First Quarter 2006 ... - Ise.com
You also want an ePaper? Increase the reach of your titles
YUMPU automatically turns print PDFs into web optimized ePapers that Google loves.
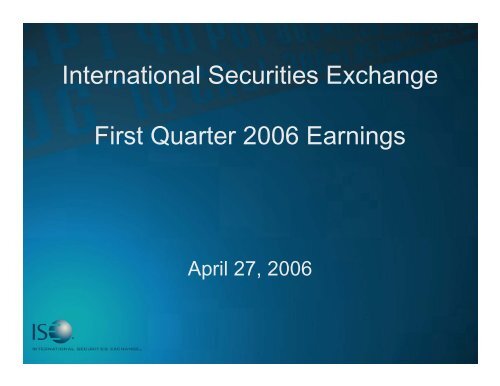
<strong>International</strong> <strong>Securities</strong> <strong>Exchange</strong><br />
<strong>First</strong> <strong>Quarter</strong> <strong>2006</strong> Earnings<br />
April 27, <strong>2006</strong>
Forward Looking Statements<br />
Certain matters discussed in this presentation are “forward<br />
looking statements” intended to qualify for the safe harbor from<br />
liability established by the Private <strong>Securities</strong> Litigation Reform<br />
Act of 1995. These statements relate to future events or our<br />
future financial performance, and involve known and unknown<br />
risks, uncertainties and other factors that may cause our actual<br />
results, levels of activity, performance or achievements, to be<br />
materially different from those contemplated by the forward<br />
looking statements. We undertake no ongoing obligation, other<br />
than that imposed by law, to update these statements. Factors<br />
that could affect our results, levels of activity, performance or<br />
achievements and cause them to materially differ from those<br />
contained in the forward looking statements can be found in our<br />
filings with the <strong>Securities</strong> and <strong>Exchange</strong> Commission, including<br />
our annual report on Form 10-K, current reports on Form 8-K<br />
and quarterly reports on Form 10-Q, as amended.
<strong>First</strong> <strong>Quarter</strong> <strong>2006</strong> Highlights<br />
• Record quarterly results: record volume, record<br />
revenues, record net in<strong>com</strong>e<br />
• Record daily trading volume of 4.6 million equity<br />
and index contracts on January 20, <strong>2006</strong><br />
• Announced launch of new market data offering<br />
of <strong>com</strong>prehensive historical market data<br />
• Declared initial quarterly dividend of $0.05
Summary <strong>Quarter</strong>ly Financials<br />
(in millions)<br />
3.0<br />
2.5<br />
2.0<br />
1.5<br />
Average Daily Volume<br />
1.7<br />
+ 37.6%<br />
2.4<br />
$45<br />
$40<br />
$35<br />
Net Revenues<br />
(Gross Margin)<br />
$33.3<br />
+ 25.0%<br />
$41.6<br />
1.0<br />
Q1 05 Q1 06<br />
$30<br />
Q1 05 Q1 06<br />
$15<br />
Net In<strong>com</strong>e<br />
$12.4<br />
$12<br />
$9<br />
$8.9<br />
40.1%<br />
$6<br />
Q1 05 Q1 06<br />
Record financial results; Pre-Tax Margin of 53.3%
Premium Products<br />
Average Daily Volume of Premium Products<br />
(in thousands)<br />
250<br />
225<br />
200<br />
175<br />
150<br />
125<br />
100<br />
75<br />
50<br />
25<br />
0<br />
209.3<br />
199.4<br />
137.1<br />
12.7<br />
50.9<br />
11.6<br />
53.8<br />
121.8<br />
89.2<br />
40.5<br />
5.6 *<br />
36.9<br />
24.3<br />
111.7<br />
116.2<br />
62.9<br />
72.1<br />
59.5<br />
5.4<br />
18.4<br />
22.5<br />
24.1<br />
27.7<br />
Q1 05 Q2 05 Q3 05 Q4 05 Q1 06<br />
Indexes Other ETFs** SPDRS Diamonds<br />
Growth in Premium Products<br />
®<br />
®<br />
* Listed on 9/1/05 ** For <strong>com</strong>parison purposes, prior periods are adjusted to include volume for all current premium priced ETF’s
Institutional Opportunities<br />
500,000<br />
450,000<br />
400,000<br />
350,000<br />
300,000<br />
250,000<br />
200,000<br />
150,000<br />
100,000<br />
50,000<br />
Incremental Trading Volume from ISE Functionalities<br />
Special Functionality ADV<br />
% of Total ADV<br />
January 2002 – March <strong>2006</strong><br />
20%<br />
18%<br />
16%<br />
14%<br />
12%<br />
10%<br />
8%<br />
6%<br />
4%<br />
2%<br />
0<br />
Jan<br />
2002<br />
Jan<br />
2003<br />
Jan<br />
2004<br />
Jan<br />
2005<br />
Jan<br />
<strong>2006</strong><br />
0%<br />
Growing Institutional Investor Interest<br />
• Liquid markets<br />
• Better prices<br />
• Lower costs<br />
• Risk management opportunities<br />
• Enhanced returns
Summary Financial Performance<br />
($MM)<br />
Q1 06<br />
Q1 05<br />
Change<br />
Total Revenues<br />
$ 47.5<br />
$ 36.9<br />
28.9%<br />
Total Cost of Revenues<br />
6.0<br />
3.6<br />
64.3%<br />
Net Revenues (Gross Margin)<br />
$ 41.6<br />
$ 33.3<br />
25.0%<br />
Total Expenses<br />
21.0<br />
17.2<br />
22.6%<br />
Operating In<strong>com</strong>e<br />
$ 20.5<br />
$ 16.1<br />
27.7%<br />
Interest and investment in<strong>com</strong>e<br />
1.6<br />
0.3<br />
400.3%<br />
In<strong>com</strong>e before provision for in<strong>com</strong>e taxes<br />
$ 22.2<br />
$ 16.4<br />
35.0%<br />
Provision for in<strong>com</strong>e taxes<br />
9.7<br />
7.6<br />
28.9%<br />
Net In<strong>com</strong>e<br />
$ 12.4<br />
$ 8.9<br />
40.1%<br />
EPS (Fully Diluted)<br />
$ 0.32<br />
$ 0.25<br />
28.0%<br />
Pre-Tax Margin<br />
53.3%<br />
49.4%<br />
3.9 pts<br />
• Net In<strong>com</strong>e up 40.1%<br />
• Pre-Tax Margin of 53.3%
Trading Volume (Equity and Index)<br />
(MM)<br />
Q1 06<br />
Q1 05<br />
Change<br />
Average Daily Volume<br />
2.4<br />
1.7<br />
37.6%<br />
Trading Volume Mix<br />
Customer<br />
43.1%<br />
41.4%<br />
1.7 pts<br />
Firm Proprietary<br />
10.9%<br />
8.6%<br />
2.3 pts<br />
Market Maker<br />
46.0%<br />
50.0%<br />
(4.0) pts<br />
Average net transaction fee per side<br />
$ 0.105<br />
$ 0.109<br />
(3.7)%<br />
Average fee per revenue side<br />
$ 0.176<br />
$ 0.180<br />
(2.2)%<br />
Average number of issues traded<br />
854<br />
705<br />
21.1%<br />
• Record average daily volume; up 37.6%<br />
• Record number of issues traded; up 21.1%
Net Revenues<br />
Revenues ($MM)<br />
Q1 06<br />
Q1 05<br />
Change<br />
Net Transaction Fees<br />
$ 30.9<br />
$ 23.1<br />
33.9%<br />
Other Members Fees<br />
5.6<br />
5.5<br />
1.4%<br />
Market Data<br />
5.1<br />
4.6<br />
9.3%<br />
Net Revenues<br />
41.6<br />
33.3<br />
25.0%<br />
• Strong top line growth:<br />
• Net transaction fees +33.9%<br />
• Net Revenues +25.0%
Expenses<br />
($MM)<br />
Q1 06<br />
Q1 05<br />
Change<br />
Compensation and benefits<br />
$ 11.4<br />
$ 8.2<br />
38.2%<br />
Technology and <strong>com</strong>munications<br />
3.5<br />
3.4<br />
4.0%<br />
Occupancy<br />
1.3<br />
1.1<br />
19.3%<br />
Professional fees<br />
1.6<br />
1.5<br />
9.5%<br />
Marketing and business development<br />
0.6<br />
0.6<br />
6.1%<br />
Depreciation and amortization<br />
1.5<br />
1.5<br />
1.3%<br />
Other<br />
1.0<br />
0.8<br />
34.3%<br />
Total direct expenses<br />
$ 21.0<br />
$ 17.1<br />
23.2%<br />
Reorganization<br />
0.0<br />
0.1<br />
(76.5)%<br />
Total expenses<br />
$ 21.0<br />
$ 17.2<br />
22.6%<br />
ISE Stock <strong>Exchange</strong>, LLC Expenses<br />
$ 0.9<br />
$ 0.1<br />
N/M<br />
Expenses less ISE Stock <strong>Exchange</strong>, LLC<br />
$ 20.1<br />
$ 17.0<br />
18.1%<br />
Tax rate<br />
44.0%<br />
46.0%<br />
(2.0) pts<br />
• Q1 06 reflects full quarter of stock based <strong>com</strong>pensation
Summary Cash Flow<br />
($MM)<br />
Net In<strong>com</strong>e<br />
Net cash provided by other operating activities<br />
Net cash provided by/(used in) investing activities<br />
Net cash provided by/(used in) financing activities<br />
Increase in cash and cash equivalents<br />
Cash and cash equivalents, beginning of period<br />
Cash and cash equivalents, end of period<br />
3/31/<strong>2006</strong><br />
$ 12.4<br />
(5.9)<br />
2.1<br />
(0.3)<br />
8.4<br />
170.9<br />
$ 179.3<br />
3/31/2005<br />
$ 8.9<br />
15.5<br />
(0.3)<br />
58.9<br />
83.0<br />
44.8<br />
$ 127.9<br />
Continued strong cash flow performance
Summary Balance Sheet<br />
($MM)<br />
Cash and Cash Equivalents<br />
Total Assets<br />
Total Liabilities<br />
Stockholders’ Equity<br />
3/31/<strong>2006</strong><br />
$ 179.3<br />
289.1<br />
87.0<br />
$ 199.2<br />
12/31/2005<br />
$ 170.9<br />
280.5<br />
95.5<br />
$ 185.0<br />
Highly liquid, debt-free balance sheet
Summary<br />
• Delivered strong financial performance with<br />
double-digit growth in all key metrics, excellent<br />
cash flow and operating leverage<br />
• Continued success in new growth initiatives in<br />
core business<br />
• Progress in executing multi-faceted growth<br />
strategy<br />
Strong performance in core business;<br />
solid progress on strategic initiatives
Appendix<br />
1. DIAMONDS® is a registered trademark of Dow Jones & Company, Inc. ("Dow Jones") for<br />
securities issued by the Diamonds® Trust, Series 1 and has been licensed for use for certain<br />
purposes by Dow Jones to PDR Services Corporation ("PDR") and the American Stock<br />
<strong>Exchange</strong> LLC ("Amex") pursuant to a license agreement with Dow Jones. DIAMONDS and<br />
options which have DIAMONDS as their sole underlying interest ("DIAMONDS Options") are<br />
not sponsored, endorsed, sold or promoted by Dow Jones. Dow Jones, PDR, and Amex have<br />
not licensed or authorized ISE to (i) engage in the creation, listing, provision of a market for<br />
trading, marketing, and promotion of DIAMONDS Options or (ii) to use and refer to the<br />
DIAMONDS® trademark in connection with the listing, provision of a market for trading,<br />
marketing, and promotion of DIAMONDS Options or with making disclosures concerning<br />
DIAMONDS Options under any applicable federal or state laws, rules or regulations, and do<br />
not sponsor, endorse, or promote such activity by ISE. ISE is not affiliated in any manner with<br />
Dow Jones, PDR or Amex.<br />
2. The <strong>International</strong> <strong>Securities</strong> <strong>Exchange</strong> analyzes its performance using non-GAAP results<br />
that exclude certain non-operating charges that were incurred in connection with the<br />
Company’s plan to reorganize into a holding <strong>com</strong>pany structure as well as expenses related to<br />
its secondary offering. These non-GAAP measures should be considered in context with<br />
GAAP results. A reconciliation of GAAP results to non-GAAP results can be found in the<br />
Company’s earnings release dated April 27, <strong>2006</strong>.
GAAP to Non-GAAP Reconciliation<br />
Three Months Ended<br />
March 31, March 31,<br />
<strong>2006</strong> 2005<br />
GAAP Transaction fees, as reported $ 36,867 $ 26,714<br />
Less activity remittance fees 4,345 2,702<br />
Less license fees 1,625 931<br />
Net transaction fees, as adjusted 30,897 23,081<br />
GAAP Total expenses, as reported $ 21,028 $ 17,157<br />
Less ISE Stock <strong>Exchange</strong> direct expenses 900 117<br />
Total expenses excluding ISE Stock <strong>Exchange</strong> expenses 20,128 17,040<br />
GAAP In<strong>com</strong>e before provision for in<strong>com</strong>e taxes, as reported 22,157 16,417<br />
Less ISE Stock <strong>Exchange</strong> direct expenses 900 117<br />
In<strong>com</strong>e before provision for in<strong>com</strong>e taxes excluding ISE Stock <strong>Exchange</strong> expenses 23,057 16,534<br />
GAAP Net in<strong>com</strong>e, as reported $ 12,418 $ 8,861<br />
Less ISE Stock <strong>Exchange</strong> direct expenses, net of tax 495 64<br />
Net in<strong>com</strong>e excluding ISE Stock <strong>Exchange</strong> expenses 12,913 8,925<br />
GAAP Diluted earnings per share, as reported $ 0.32 $ 0.25<br />
Less ISE Stock <strong>Exchange</strong> direct expenses, net of tax 0.01 0.01<br />
Diluted earnings per share excluding ISE Stock <strong>Exchange</strong> expenses $ 0.33 $ 0.26<br />
Gross Margin 41,574 33,252<br />
GAAP pre-tax margins, as reported 53.3% 49.4%<br />
Pre-tax margins excluding ISE Stock <strong>Exchange</strong> expenses 55.5% 49.7%


