The Condition of Minority Access and Participation in Arizona: 2004
The Condition of Minority Access and Participation in Arizona: 2004
The Condition of Minority Access and Participation in Arizona: 2004

You also want an ePaper? Increase the reach of your titles
YUMPU automatically turns print PDFs into web optimized ePapers that Google loves.
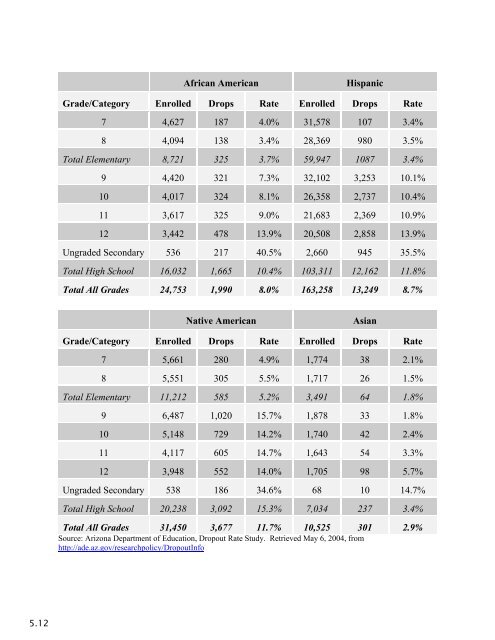
African American<br />
Hispanic<br />
Grade/Category Enrolled Drops Rate Enrolled Drops Rate<br />
7 4,627 187 4.0% 31,578 107 3.4%<br />
8 4,094 138 3.4% 28,369 980 3.5%<br />
Total Elementary 8,721 325 3.7% 59,947 1087 3.4%<br />
9 4,420 321 7.3% 32,102 3,253 10.1%<br />
10 4,017 324 8.1% 26,358 2,737 10.4%<br />
11 3,617 325 9.0% 21,683 2,369 10.9%<br />
12 3,442 478 13.9% 20,508 2,858 13.9%<br />
Ungraded Secondary 536 217 40.5% 2,660 945 35.5%<br />
Total High School 16,032 1,665 10.4% 103,311 12,162 11.8%<br />
Total All Grades 24,753 1,990 8.0% 163,258 13,249 8.7%<br />
Native American<br />
Asian<br />
Grade/Category Enrolled Drops Rate Enrolled Drops Rate<br />
7 5,661 280 4.9% 1,774 38 2.1%<br />
8 5,551 305 5.5% 1,717 26 1.5%<br />
Total Elementary 11,212 585 5.2% 3,491 64 1.8%<br />
9 6,487 1,020 15.7% 1,878 33 1.8%<br />
10 5,148 729 14.2% 1,740 42 2.4%<br />
11 4,117 605 14.7% 1,643 54 3.3%<br />
12 3,948 552 14.0% 1,705 98 5.7%<br />
Ungraded Secondary 538 186 34.6% 68 10 14.7%<br />
Total High School 20,238 3,092 15.3% 7,034 237 3.4%<br />
Total All Grades 31,450 3,677 11.7% 10,525 301 2.9%<br />
Source: <strong>Arizona</strong> Department <strong>of</strong> Education, Dropout Rate Study. Retrieved May 6, <strong>2004</strong>, from<br />
http://ade.az.gov/researchpolicy/DropoutInfo<br />
5.12