Small foveal targets for studies of accommodation and the Stiles ...
Small foveal targets for studies of accommodation and the Stiles ...
Small foveal targets for studies of accommodation and the Stiles ...

Create successful ePaper yourself
Turn your PDF publications into a flip-book with our unique Google optimized e-Paper software.
Vision Research 44 (2004) 2757–2767<br />
www.elsevier.com/locate/visres<br />
<strong>Small</strong> <strong>foveal</strong> <strong>targets</strong> <strong>for</strong> <strong>studies</strong> <strong>of</strong> <strong>accommodation</strong><br />
<strong>and</strong> <strong>the</strong> <strong>Stiles</strong>–Craw<strong>for</strong>d effect q<br />
Philip B. Kruger a, *<br />
, Lawrence R. Stark a,b , Hai Nhu Nguyen a<br />
a Schnurmacher Institute <strong>for</strong> Vision Research, College <strong>of</strong> Optometry, State University <strong>of</strong> New York, 33 West 42 Street, New York, NY 10036, USA<br />
b School <strong>of</strong> Optometry, Queensl<strong>and</strong> University <strong>of</strong> Technology, Victoria Park Road, Kelvin Grove, Queensl<strong>and</strong> 4059, Australia<br />
Received 14 August 2003; received in revised <strong>for</strong>m 15 June 2004<br />
Abstract<br />
The properties <strong>of</strong> small monochromatic <strong>targets</strong> as accommodative stimuli are not well understood. We used a dynamic optometer<br />
to record <strong>accommodation</strong> responses to monochromatic disc <strong>targets</strong> (1.0–27.3 min arc) <strong>and</strong> to a Maltese cross. Accommodation<br />
responded adequately to points as small as 13.6 minarc. The response to <strong>the</strong>se small <strong>targets</strong> is relevant to <strong>the</strong> question <strong>of</strong> whe<strong>the</strong>r<br />
<strong>the</strong> <strong>Stiles</strong>–Craw<strong>for</strong>d (SC) effect could provide a stimulus to <strong>accommodation</strong>. Previous <strong>studies</strong> have used pupil apodizing filters to<br />
neutralise <strong>the</strong> natural SC function <strong>and</strong> so determine how visual per<strong>for</strong>mance or <strong>accommodation</strong> is influenced by <strong>the</strong> SC effect. However,<br />
<strong>the</strong>se filters cannot correct <strong>for</strong> known inhomogeneities in <strong>the</strong> SC function across <strong>the</strong> retina <strong>for</strong> extended <strong>targets</strong>. There<strong>for</strong>e, we<br />
calculated <strong>the</strong> SC function inhomogeneities across <strong>the</strong> retinal image <strong>of</strong> a smaller 13.6-minarc target. Un<strong>for</strong>tunately, even this small<br />
target is too large to permit a homogenous SC function across its extent. Alternatives to <strong>the</strong> apodizing filter approach are discussed.<br />
Ó 2004 Elsevier Ltd. All rights reserved.<br />
Keywords: Accommodation; Blur; Defocus; Light vergence; <strong>Stiles</strong>–Craw<strong>for</strong>d<br />
1. Introduction<br />
The adequacy <strong>of</strong> small monochromatic <strong>targets</strong> as<br />
stimuli to <strong>accommodation</strong> is important to our current<br />
line <strong>of</strong> research that investigates whe<strong>the</strong>r <strong>the</strong> <strong>Stiles</strong>–<br />
Craw<strong>for</strong>d effect (<strong>of</strong> <strong>the</strong> first kind) can provide a signed<br />
stimulus to <strong>accommodation</strong>. However <strong>the</strong> properties<br />
<strong>of</strong> small monochromatic <strong>targets</strong> as accommodative stimuli<br />
are not well understood. In addition, <strong>studies</strong> <strong>of</strong> <strong>the</strong><br />
effect <strong>of</strong> target size on <strong>accommodation</strong> with polychro-<br />
q Presented in part at <strong>the</strong> meeting <strong>of</strong> <strong>the</strong> Association <strong>for</strong> Research in<br />
Vision <strong>and</strong> Ophthalmology, Fort Lauderdale, Florida, April 29–May<br />
4, 2001. Portions <strong>of</strong> this study were presented by Hai Nhu Nguyen in<br />
his entry to <strong>the</strong> Intel Science Talent Search (2000).<br />
* Corresponding author. Tel.: +1 212 780 5123; fax: +1 212 780<br />
5124.<br />
E-mail address: pkruger@sunyopt.edu (P.B. Kruger).<br />
matic <strong>targets</strong> have yielded conflicting results. For example,<br />
while <strong>accommodation</strong> becomes poorer as disc<br />
diameter increases beyond 30 min arc, <strong>the</strong> reported rate<br />
<strong>of</strong> this loss with eccentricity differs widely (see Ciuffreda,<br />
1991). Studies with small polychromatic disc <strong>targets</strong> (4.3<br />
sarc–90 min arc) differ in <strong>the</strong>ir conclusions as to <strong>the</strong> target<br />
sizes that provide an adequate accommodative stimulus<br />
(Campbell, 1954; Fincham, 1951, 1953; Miller,<br />
1980; Owens & Leibowitz, 1975). In <strong>the</strong> present study,<br />
<strong>the</strong> response under monochromatic illumination is <strong>of</strong><br />
interest <strong>and</strong> only two <strong>studies</strong> have used this illumination.<br />
Fincham (1951) observed qualitatively that participants<br />
required a spot size <strong>of</strong> at least 8 min arc to respond robustly<br />
to <strong>the</strong> interposition <strong>of</strong> a 0.75 D lens in monochromatic<br />
sodium light. In a later study, <strong>the</strong> minimum<br />
target size required <strong>for</strong> a robust response to <strong>the</strong> interposition<br />
<strong>of</strong> a 1 D lens in sodium light (15.4 cdm 2 )<br />
was on average 6.6 min arc <strong>for</strong> normal trichromatic<br />
0042-6989/$ - see front matter Ó 2004 Elsevier Ltd. All rights reserved.<br />
doi:10.1016/j.visres.2004.06.013
2758 P.B. Kruger et al. / Vision Research 44 (2004) 2757–2767<br />
participants (Fincham, 1953). These two <strong>studies</strong> were<br />
limited to some extent by <strong>the</strong> subjective nature <strong>of</strong> <strong>the</strong><br />
<strong>accommodation</strong> measurements.<br />
An ongoing issue in both <strong>accommodation</strong> <strong>and</strong> emmetropization<br />
research is whe<strong>the</strong>r <strong>the</strong> defocused retinal<br />
image indicates <strong>the</strong> sign <strong>of</strong> defocus. While <strong>the</strong>re is evidence<br />
<strong>for</strong> a non-directional stimulus based on defocus<br />
blur (Phillips & Stark, 1977; Stark & Takahashi,<br />
1965), o<strong>the</strong>r directional stimuli to <strong>accommodation</strong> such<br />
as longitudinal chromatic aberration (LCA; <strong>for</strong> reviews<br />
see Kruger, Ma<strong>the</strong>ws, Aggarwala, & Sanchez, 1993; Lee,<br />
Stark, Cohen, & Kruger, 1999) <strong>and</strong> a so-called Ôachromatic<br />
stimulusÕ (Kruger, Ma<strong>the</strong>ws, Katz, Aggarwala,<br />
& Nowbotsing, 1997) have been documented. The nature<br />
<strong>of</strong> this Ôachromatic stimulusÕ is not yet known, but<br />
some possibilities include <strong>the</strong> monochromatic aberrations<br />
<strong>of</strong> <strong>the</strong> eye (Campbell, Priest, & Hunter, 2001;<br />
Chen, Kruger, & Williams, 2002; Fern<strong>and</strong>ez & Artal,<br />
2002; Wilson, Decker, & Roorda, 2002), ocular astigmatism<br />
(Allen, 1955; Campbell & Wes<strong>the</strong>imer, 1959; Walsh<br />
& Charman, 1988) <strong>and</strong> <strong>the</strong> <strong>Stiles</strong>–Craw<strong>for</strong>d effect (Fincham,<br />
1951; Kruger, López-Gil, & Stark, 2001; Kruger<br />
et al., 1997; Kruger, Stark, & Hu, 2000).<br />
Fincham (1951) proposed a model by which <strong>the</strong><br />
<strong>accommodation</strong> system might extract a directional signal<br />
from <strong>the</strong> <strong>Stiles</strong>–Craw<strong>for</strong>d effect <strong>of</strong> <strong>the</strong> first kind<br />
(<strong>Stiles</strong> & Craw<strong>for</strong>d, 1933). However, his model assumes<br />
that cone photoreceptors point approximately towards<br />
<strong>the</strong> centre <strong>of</strong> <strong>the</strong> globe, while more recent evidence<br />
shows that <strong>the</strong>y align approximately to a point <strong>of</strong>f-centre<br />
within <strong>the</strong> entrance pupil (Applegate & Lakshminarayanan,<br />
1993; Dunnewold, 1964; Enoch, 1957; Enoch &<br />
Hope, 1972a, 1972b; Enoch & Lakshminarayanan,<br />
1991; Gorr<strong>and</strong> & Delori, 1995; Laties & Enoch, 1971;<br />
<strong>Stiles</strong> & Craw<strong>for</strong>d, 1933; Wes<strong>the</strong>imer, 1968). Instead,<br />
Kruger et al. (2001) hypo<strong>the</strong>sised a more realistic model<br />
which uses a decentred SC function to extract a signed<br />
input to <strong>accommodation</strong>. The principles <strong>of</strong> this method<br />
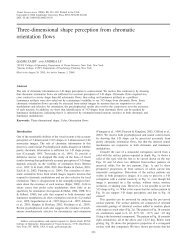
<strong>for</strong> an on-axis optical system free <strong>of</strong> aberrations <strong>and</strong><br />
with all <strong>the</strong> cone receptors tilted toward <strong>the</strong> nasal side<br />
<strong>of</strong> <strong>the</strong> pupil (N, dashed lines) are illustrated schematically<br />
in Fig. 1 (after Kruger et al., 2001). Although <strong>the</strong><br />
defocused spread-functions on <strong>the</strong> retina are symmetrical<br />
(Fig. 1b), after weighting <strong>for</strong> <strong>the</strong> nasal decentration<br />
<strong>of</strong> <strong>the</strong> SC peak, <strong>the</strong> effective blur spread-function is skewed<br />
nasally in hyperopic defocus <strong>and</strong> temporally in<br />
myopic defocus (Fig. 1c), <strong>and</strong> thus might identify <strong>the</strong><br />
sign <strong>of</strong> defocus.<br />
One way to test whe<strong>the</strong>r <strong>the</strong> <strong>Stiles</strong>–Craw<strong>for</strong>d function<br />
provides an input to <strong>accommodation</strong> is to alter <strong>the</strong> function<br />
with a static apodizing filter (Rynders, Thibos,<br />
Bradley, & López-Gil, 1997; Scott, Atchison, & Pejski,<br />
2001); as was done <strong>for</strong> <strong>the</strong> first time by Kruger et al.<br />
(2001). A neutralising apodizing filter alters <strong>the</strong> transmittance<br />
<strong>of</strong> light at each point in <strong>the</strong> pupil to provide<br />
a uni<strong>for</strong>m SC function (Scott et al., 2001). However, a<br />
N T N T<br />
(a)<br />
(b)<br />
(c)<br />
Hyperopic Defocus<br />
Symmetrical Point Spread-Function<br />
Myopic Defocus<br />
Images Weighted by Decentered S—C Effect<br />
Fig. 1. Method <strong>for</strong> distinguishing <strong>the</strong> sign <strong>of</strong> defocus using a decentred<br />
SC effect (after Kruger et al., 2001). See Section 1 <strong>for</strong> a description <strong>of</strong><br />
this figure.<br />
single apodizing filter cannot neutralise <strong>the</strong> SC effect<br />
simultaneously at all points across <strong>the</strong> retinal image because<br />
<strong>the</strong> SC effect is not homogeneous across <strong>the</strong> retina.<br />
For example, directionality (q) is reduced at <strong>the</strong> very<br />
centre <strong>of</strong> <strong>the</strong> fovea <strong>and</strong> increases para<strong>foveal</strong>ly (Enoch<br />
& Hope, 1973; Wes<strong>the</strong>imer, 1967), reaching an asymptote<br />
at 2° with no significant changes out to 10° in <strong>the</strong><br />
parafovea (Enoch & Hope, 1973). In addition, <strong>the</strong>re<br />
are local variations in <strong>the</strong> position <strong>of</strong> <strong>the</strong> SC function<br />
peak in a 1° diameter annular region around <strong>the</strong> <strong>foveal</strong><br />
centre in some individuals (Williams, 1980). In this region<br />
<strong>the</strong> SC function peak <strong>for</strong> cones on <strong>the</strong> nasal <strong>and</strong><br />
temporal sides <strong>of</strong> <strong>the</strong> <strong>foveal</strong> pit tends towards <strong>the</strong> nasal<br />
<strong>and</strong> temporal sides <strong>of</strong> <strong>the</strong> pupil respectively, <strong>and</strong> <strong>the</strong><br />
peak <strong>for</strong> cones above <strong>and</strong> below <strong>the</strong> central fovea tends<br />
towards <strong>the</strong> superior <strong>and</strong> inferior parts <strong>of</strong> <strong>the</strong> pupil<br />
respectively. In some myopic eyes <strong>the</strong>re is a progressive<br />
increase in <strong>the</strong> nasal decentration <strong>of</strong> <strong>the</strong> SC function<br />
peak as measurements are made closer to <strong>the</strong> optic nerve<br />
head (Choi & Garner, 2000; Wes<strong>the</strong>imer, 1968). Finally,<br />
<strong>the</strong>re is local disarray in <strong>the</strong> pointing directions <strong>of</strong> individual<br />
cones over small retinal areas (Roorda & Williams,<br />
2002).<br />
In a previous study (Kruger et al., 2001), we used a<br />
sine-wave grating target 11.5° in diameter, <strong>and</strong> so <strong>the</strong>re
P.B. Kruger et al. / Vision Research 44 (2004) 2757–2767 2759<br />
may be concerns that a static apodizing filter could not<br />
neutralise known inhomogeneities in <strong>the</strong> SC function<br />
over such an extended area <strong>of</strong> <strong>the</strong> central retina. An<br />
alternative might be to substitute a point target with a<br />
diameter so small that <strong>the</strong> SC function is effectively<br />
homogenous over its extent. Accommodation to this<br />
small target would <strong>the</strong>n be measured with ei<strong>the</strong>r an intact<br />
or a neutralised SC function. However, as noted<br />
previously, <strong>the</strong> properties <strong>of</strong> small monochromatic<br />
points as accommodative stimuli are not known. Fur<strong>the</strong>rmore,<br />
it is not known whe<strong>the</strong>r <strong>the</strong> SC function<br />
would indeed be homogenous over <strong>the</strong> blur-spread functions<br />
<strong>of</strong> <strong>the</strong>se small <strong>targets</strong>.<br />
Accordingly, two experiments were per<strong>for</strong>med. The<br />
aim <strong>of</strong> <strong>the</strong> first experiment was to determine <strong>the</strong> efficacy<br />
<strong>of</strong> small monochromatic point <strong>targets</strong> as stimuli to<br />
<strong>accommodation</strong>. Objectively measured dynamic <strong>accommodation</strong><br />
responses to a large st<strong>and</strong>ard monochromatic<br />
target (a Maltese cross, 6.3° in diameter) were compared<br />
with those <strong>for</strong> centrally fixated monochromatic spot <strong>targets</strong><br />
<strong>of</strong> 1.0–27.3 min arc diameter. The eyeÕs SC function<br />
was left intact <strong>and</strong> unaltered. With a pupil size <strong>of</strong> 3 mm<br />
<strong>and</strong> a retinal illuminance <strong>of</strong> 141 trol<strong>and</strong>s, <strong>accommodation</strong><br />
responses were robust to <strong>targets</strong> as small as 13.6<br />
min arc.<br />
The aims <strong>of</strong> <strong>the</strong> second experiment were to estimate<br />
<strong>the</strong> sizes <strong>of</strong> <strong>the</strong> retinal blur-spread functions <strong>for</strong> small<br />
point <strong>targets</strong>, <strong>and</strong> to estimate <strong>the</strong> degree <strong>of</strong> SC function<br />
inhomogeneity over such blur-spread functions. It was<br />
found that spots sufficiently large to stimulate <strong>accommodation</strong><br />
adequately have blur-spread functions that<br />
are typically too large to allow adequate neutralisation<br />
<strong>of</strong> <strong>the</strong> SC function with a static apodizing filter.<br />
2. Methods<br />
2.1. Accommodation experiment<br />
2.1.1. Participants<br />
Forty-four individuals volunteered <strong>for</strong> <strong>the</strong> study, <strong>and</strong><br />
14 were excluded <strong>for</strong> various reasons. Two participants<br />
were excluded <strong>for</strong> reduced visual acuity, four due to a<br />
history <strong>of</strong> strabismus, one due to amplitudes <strong>of</strong> <strong>accommodation</strong><br />
below DuaneÕs (1922) clinical norms in both<br />
eyes, <strong>and</strong> two participants due to over-<strong>accommodation</strong><br />
in <strong>the</strong> Badal optical system, one <strong>of</strong> whom had a history<br />
<strong>of</strong> symptomatic near-work induced transient myopia.<br />
One participant was unable to per<strong>for</strong>m <strong>the</strong> calibration<br />
procedure with <strong>the</strong> stigmatoscope (see Section 2.1.4),<br />
one participant was unable to sit com<strong>for</strong>tably in <strong>the</strong><br />
apparatus, <strong>and</strong> three participants withdrew from <strong>the</strong><br />
study.<br />
The 30 remaining participants took part in preliminary<br />
trials to determine whe<strong>the</strong>r <strong>the</strong>y could accommodate<br />
effectively in monochromatic light (Section 2.1.4).<br />
Some individuals accommodate very poorly in <strong>the</strong> absence<br />
<strong>of</strong> LCA, <strong>and</strong> accommodative gain varies widely<br />
among individuals (Kruger et al., 1993). Since <strong>the</strong> aim<br />
<strong>of</strong> <strong>the</strong> present line <strong>of</strong> investigation is to underst<strong>and</strong><br />
how <strong>the</strong> eye responds to light vergence in monochromatic<br />
light—<strong>and</strong> thus in <strong>the</strong> absence <strong>of</strong> <strong>the</strong> chromatic<br />
mechanism <strong>of</strong> <strong>accommodation</strong> (Kruger, Ma<strong>the</strong>ws,<br />
Aggarwala, Yager, & Kruger, 1995; Lee et al., 1999)—<br />
participants were recruited who appeared to respond<br />
well in monochromatic light. Participants were included<br />
if, on visual examination <strong>of</strong> chart recorder traces by <strong>the</strong><br />
examiner during <strong>the</strong> preliminary trials (Section 2.1.4),<br />
<strong>the</strong>ir response in monochromatic light was easily distinguishable<br />
from <strong>the</strong> normal low-frequency fluctuations <strong>of</strong><br />
<strong>accommodation</strong>, <strong>and</strong> if <strong>the</strong> response to monochromatic<br />
<strong>targets</strong> was present in most <strong>of</strong> <strong>the</strong> preliminary trials.<br />
Seven participants were found to respond well in monochromatic<br />
light according to <strong>the</strong>se criteria with gains<br />
ranging between 0.25 <strong>and</strong> 0.72, corresponding to percentage<br />
ranks within <strong>the</strong> larger group (n = 30) in <strong>the</strong><br />
range 51.7%–100%. Thus, <strong>the</strong> seven participants were<br />
in <strong>the</strong> upper half <strong>of</strong> this population with respect to dynamic<br />
<strong>accommodation</strong> in monochromatic light. They<br />
were 21–24 years <strong>of</strong> age. Six were optometry students<br />
<strong>and</strong> one was a member <strong>of</strong> <strong>the</strong> public. All were visually<br />
normal with no history <strong>of</strong> amblyopia, strabismus, ocular<br />
trauma or disease, cataract, ocular surgery, or head,<br />
neck, or back injury. Six participants had no history<br />
<strong>of</strong> binocular vision complaints or vision <strong>the</strong>rapy, <strong>and</strong><br />
one participant had vision <strong>the</strong>rapy <strong>for</strong> slight as<strong>the</strong>nopic<br />
complaints one year prior to testing. Visual acuities were<br />
normal (logMAR: OD, 0.10 to +0.04; OS, 0.10 to<br />
+0.04), amplitudes <strong>of</strong> <strong>accommodation</strong> were within<br />
DuaneÕs (1922) clinical norms, <strong>and</strong> colour vision was<br />
normal in both eyes by Nagel Anomaloscope. Dark<br />
focus <strong>of</strong> <strong>accommodation</strong> varied in <strong>the</strong> range 0.2–2.9 D<br />
(except that dark focus data <strong>for</strong> two participants were<br />
lost). Participants were in good health <strong>and</strong> were not taking<br />
any medication that might have side effects on<br />
<strong>accommodation</strong>. Participants gave in<strong>for</strong>med consent to<br />
participation in <strong>the</strong> study, which was approved by <strong>the</strong><br />
Institutional Review Board <strong>of</strong> <strong>the</strong> College <strong>and</strong> followed<br />
<strong>the</strong> tenets <strong>of</strong> <strong>the</strong> Declaration <strong>of</strong> Helsinki.<br />
2.1.2. Apparatus<br />
An infrared optometer was used to monitor <strong>accommodation</strong><br />
continuously along <strong>the</strong> vertical meridian <strong>of</strong><br />
<strong>the</strong> eye (100 Hz, Kruger, 1979) while <strong>the</strong> participant<br />
viewed <strong>targets</strong> in a Badal stimulus system (Kruger<br />
et al., 1993). This stimulus system was modified <strong>for</strong> <strong>the</strong><br />
present experiment to allow a non-Maxwellian view <strong>of</strong><br />
<strong>the</strong> target. Unlike Maxwellian view, where irregularities<br />
in <strong>the</strong> filament <strong>of</strong> <strong>the</strong> light source are imaged in <strong>the</strong> pupil<br />
plane, <strong>the</strong> present method ensures a uni<strong>for</strong>mly illuminated<br />
pupil (Wes<strong>the</strong>imer, 1966). This design feature is<br />
essential if, as we hypo<strong>the</strong>sise, <strong>the</strong> <strong>Stiles</strong>–Craw<strong>for</strong>d effect
2760 P.B. Kruger et al. / Vision Research 44 (2004) 2757–2767<br />
S1<br />
NMA<br />
CL1<br />
IF<br />
D1<br />
ND<br />
IB<br />
P1<br />
D2<br />
L1<br />
M<br />
L6<br />
L2 T<br />
L3 AP<br />
L4 P2 T' L5<br />
E<br />
CL2<br />
S2<br />
MA<br />
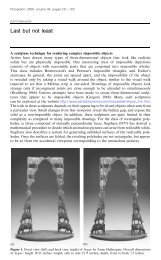
Fig. 2. Badal stimulus system. Key: AP, artificial pupil; CL1, CL2, condensing lenses; D1, D2, opal diffusers; E, eye; IB, integrating bar (Coren,<br />
1970); IF, interference filter (548 nm with 12 nm b<strong>and</strong>width at half-height) mounted in filter wheel; L1–L6, achromatic lenses; M, front-surface<br />
mirror; MA, Maxwellian view arm; ND, neutral density filter mounted in filter wheel; NMA, non-Maxwellian view arm; P1, P2, right angle prisms<br />
with mirror coating on surfaces o<strong>the</strong>r than hypotenuses; S1, S2, tungsten–halogen sources; T, target; T 0 , real image <strong>of</strong> target. See Section 2.1.2 <strong>for</strong><br />
fur<strong>the</strong>r descriptions.<br />
provides a stimulus to <strong>accommodation</strong>. The primary<br />
components <strong>of</strong> <strong>the</strong> stimulus system are illustrated in<br />
Fig. 2.<br />
Mirror M is placed to use ei<strong>the</strong>r <strong>the</strong> Maxwellian<br />
(MA) or <strong>the</strong> non-Maxwellian arm (NMA) <strong>of</strong> <strong>the</strong> optical<br />
system. In <strong>the</strong> Maxwellian arm, light from a tungsten–<br />
halogen source (S2) was collimated by lens CL2 <strong>and</strong><br />
brought to a focus at <strong>the</strong> artificial pupil plane (AP) by<br />
lenses L6, L2 <strong>and</strong> L3. Lenses L4 <strong>and</strong> L5 <strong>and</strong> prisms<br />
P1 <strong>and</strong> P2 <strong>the</strong>n imaged <strong>the</strong> artificial pupil at <strong>the</strong> natural<br />
pupil plane <strong>of</strong> <strong>the</strong> eye (E), thus providing a Maxwellian<br />
view <strong>of</strong> source S2 (Wes<strong>the</strong>imer, 1966).<br />
In <strong>the</strong> non-Maxwellian arm, light from a tungsten–<br />
halogen source (S1) was focused by a condensing lens<br />
(CL1) <strong>and</strong> <strong>the</strong>n filtered by ei<strong>the</strong>r an interference filter<br />
(IF) or a neutral density filter (ND) to illuminate an opal<br />
diffuser (D1) with pseudo-monochromatic light (548 nm<br />
with 12 nm b<strong>and</strong>width at half-height) or white light<br />
(2674 K) respectively (Spectrascan PR-704, Photo<br />
Research, Chatsworth, Cali<strong>for</strong>nia). An integrating bar<br />
(IB, Coren, 1970) provided uni<strong>for</strong>m illumination <strong>of</strong> a<br />
second opal diffuser (D2) <strong>and</strong> an image <strong>of</strong> this diffuser<br />
was <strong>for</strong>med by lenses L1 <strong>and</strong> L2 in <strong>the</strong> plane <strong>of</strong> <strong>the</strong> target<br />
(T, see also Section 2.1.3).<br />
In both Maxwellian <strong>and</strong> non-Maxwellian views, light<br />
from <strong>the</strong> target (T) was collimated by lens L3 <strong>and</strong><br />
focused by lens L4 at <strong>the</strong> point T 0 after reflection by <strong>the</strong><br />
mirrored surfaces <strong>of</strong> two prisms (P1 <strong>and</strong> P2). Target<br />
image T 0 was <strong>for</strong>med close to <strong>the</strong> focal plane <strong>of</strong> <strong>the</strong><br />
Badal lens (L5). Motion <strong>of</strong> prism P1 (as shown by <strong>the</strong><br />
arrow) moved <strong>the</strong> target image T 0 toward <strong>and</strong> away<br />
from <strong>the</strong> Badal lens (L5) to alter <strong>the</strong> vergence <strong>of</strong> <strong>the</strong> target<br />
at <strong>the</strong> eye. The limiting field stop <strong>of</strong> <strong>the</strong> optometer<br />
(not shown) subtended 6.3° at <strong>the</strong> eye <strong>and</strong> was blurred<br />
by defocus +5.2 D beyond <strong>the</strong> far point <strong>of</strong> <strong>the</strong> eye. An<br />
artificial pupil (AP) was imaged close to <strong>the</strong> entrance pupil<br />
<strong>of</strong> <strong>the</strong> participantÕs eye (E) as a 3-mm artificial pupil.<br />
To prevent unwanted reflections from <strong>the</strong> surfaces <strong>of</strong> <strong>the</strong><br />
<strong>targets</strong> (T, Section 2.1.3) that might have been visible to<br />
<strong>the</strong> participant, black cardboard shielding (not shown)<br />
was positioned around <strong>the</strong> optical components, <strong>and</strong><br />
experimental trials were conducted in a laboratory with<br />
a black interior <strong>and</strong> only minimal essential lighting.<br />
2.1.3. Stimuli<br />
In <strong>the</strong> preliminary trials, <strong>the</strong> target was a high-contrast<br />
photographic transparency <strong>of</strong> a Maltese cross on<br />
a black background. The target subtended 6.3° at <strong>the</strong><br />
eye, <strong>the</strong> central points <strong>of</strong> each limb subtended approximately<br />
1 minarc at <strong>the</strong> eye, <strong>and</strong> each limb <strong>of</strong> <strong>the</strong> cross<br />
<strong>for</strong>med an angle <strong>of</strong> 10° at <strong>the</strong> centre <strong>of</strong> <strong>the</strong> cross. Retinal<br />
illuminance was approximately 173 trol<strong>and</strong>s in white<br />
light (2674 K) <strong>and</strong> 141 trol<strong>and</strong>s in pseudomonochromatic<br />
green light (548 nm with 12 nm b<strong>and</strong>width at<br />
half-height). The Maltese cross was chosen as a st<strong>and</strong>ard<br />
target because it contains broad spatial frequency content<br />
(Ma<strong>the</strong>ws & Kruger, 1994), has detail at various<br />
orientations, covers a large area <strong>of</strong> <strong>the</strong> central field<br />
(Ciuffreda, 1991), <strong>and</strong> provides a good cue to central<br />
fixation.<br />
In <strong>the</strong> main trials <strong>the</strong>re were seven <strong>targets</strong> including<br />
<strong>the</strong> Maltese cross <strong>and</strong> six precision pinhole <strong>targets</strong> in<br />
aluminium plate (Melles Griot, Irvine, Cali<strong>for</strong>nia) with<br />
nominal angular dimensions at <strong>the</strong> eye <strong>of</strong> 1.02, 1.70,
P.B. Kruger et al. / Vision Research 44 (2004) 2757–2767 2761<br />
3.42, 6.82, 13.6 <strong>and</strong> 27.3 min arc. Actual angular dimension<br />
varied with spectacle magnification (in <strong>the</strong> range<br />
+0.71 to +1.02, mean +0.93) due to trial lenses in place<br />
that corrected individual refractive errors (Section<br />
2.1.4). The precision pinholes were checked regularly<br />
<strong>for</strong> unwanted dust or lint particles across <strong>the</strong> aperture.<br />
2.1.4. Procedures<br />
A preliminary session was used to ga<strong>the</strong>r a case history,<br />
test colour vision, <strong>and</strong> measure visual acuity, subjective<br />
refraction <strong>and</strong> accommodative amplitude. The<br />
participant was positioned in front <strong>of</strong> <strong>the</strong> instrument<br />
on a chin <strong>and</strong> <strong>for</strong>ehead rest while eye position was monitored<br />
continuously by one <strong>of</strong> <strong>the</strong> investigators with an<br />
infra-red camera <strong>and</strong> video display. Trial lenses were<br />
placed in front <strong>of</strong> <strong>the</strong> left eye to correct <strong>the</strong> refractive<br />
error <strong>of</strong> <strong>the</strong> eye <strong>and</strong> <strong>the</strong> right eye was patched. Two <strong>of</strong><br />
<strong>the</strong> seven participants wore habitual contact lens corrections<br />
during <strong>the</strong> trials with a contact lens over-refraction<br />
in <strong>the</strong> trial lens holder <strong>of</strong> <strong>the</strong> Badal optical system. A<br />
staircase psychometric procedure was <strong>the</strong>n used along<br />
<strong>the</strong> horizontal meridian to align <strong>the</strong> visual achromatic<br />
axis (Thibos, Bradley, Still, Zhang, & Howarth, 1990)<br />
<strong>of</strong> <strong>the</strong> tested eye on <strong>the</strong> optical axis <strong>of</strong> <strong>the</strong> Badal stimulus<br />
system (Lee et al., 1999) using <strong>the</strong> Maxwellian arm <strong>of</strong><br />
<strong>the</strong> optical system (Fig. 2). To calibrate <strong>the</strong> infrared<br />
optometer (Kruger, 1979), <strong>the</strong> participant viewed a Maltese<br />
cross target in white light in non-Maxwellian view<br />
at several accommodative stimulus levels while simultaneous<br />
measurements <strong>of</strong> optometer output <strong>and</strong> subjective<br />
focus (using bichromatic stigmatoscopy) were made<br />
(Lee et al., 1999).<br />
In a preliminary session, <strong>the</strong> participant viewed a<br />
Maltese cross in non-Maxwellian view. The Maltese<br />
cross moved sinusoidally between 1 <strong>and</strong> 3 D at a temporal<br />
frequency <strong>of</strong> 0.195 Hz, <strong>and</strong> it was viewed in white<br />
light with normal LCA intact or in monochromatic light<br />
(548 nm with 12 nm b<strong>and</strong>width) to eliminate LCA. We<br />
have recently demonstrated that under <strong>the</strong>se stimulus<br />
conditions, <strong>the</strong> response is uncorrelated with voluntary<br />
<strong>accommodation</strong> ability (Stark & Kruger, 2002). Each<br />
trial lasted 40.96 s, <strong>and</strong> <strong>the</strong>re were three trials <strong>of</strong> each<br />
condition presented in r<strong>and</strong>om order.<br />
For <strong>the</strong> main experimental trials, <strong>the</strong> <strong>targets</strong> were six<br />
monochromatic spot <strong>targets</strong> <strong>and</strong> a Maltese cross (Section<br />
2.1.3) presented in non-Maxwellian view. The <strong>targets</strong><br />
moved sinusoidally between 1 <strong>and</strong> 3 D at 0.195<br />
Hz during trials lasting 40.96 s, <strong>and</strong> <strong>the</strong>re were six trials<br />
<strong>of</strong> each condition presented in r<strong>and</strong>om order. (Two participants<br />
were only available <strong>for</strong> four trials <strong>of</strong> each condition,<br />
<strong>and</strong> ano<strong>the</strong>r participant was only available <strong>for</strong><br />
two trials <strong>of</strong> each condition.) The <strong>targets</strong> were viewed<br />
through a 3-mm artificial pupil imaged in <strong>the</strong> natural<br />
pupil plane. Participants were instructed to concentrate<br />
<strong>the</strong>ir attention at <strong>the</strong> centre <strong>of</strong> <strong>the</strong> target <strong>and</strong> to keep <strong>the</strong><br />
target clear (Stark & Atchison, 1994). Participants were<br />
also told that in some cases <strong>the</strong> target would be small<br />
<strong>and</strong> difficult to see. They were instructed to continue<br />
to search actively <strong>for</strong> <strong>the</strong> target if it could not be seen.<br />
Participants were kept unaware <strong>of</strong> <strong>the</strong> experimental conditions.<br />
After <strong>the</strong> final trial, <strong>the</strong> participant remained in<br />
<strong>the</strong> dark <strong>for</strong> 3 min to allow accommodative adaptation<br />
effects to subside (Rosenfield, Ciuffreda, Hung, & Gilmartin,<br />
1994) <strong>and</strong> a 30-s recording was made to determine<br />
<strong>the</strong> participantÕs dark focus.<br />
2.1.5. Analysis<br />
Eye-blinks were edited from <strong>the</strong> data prior to analysis<br />
using st<strong>and</strong>ard techniques previously described (Lee<br />
et al., 1999). Records with greater than 14.65% interpolated<br />
values due to eye-blinks <strong>and</strong> o<strong>the</strong>r causes were not<br />
used in <strong>the</strong> analysis. (This threshold value was obtained<br />
by pooling <strong>accommodation</strong> data from 37 individuals in<br />
1553 trials that were part <strong>of</strong> three separate <strong>accommodation</strong><br />
<strong>studies</strong> conducted in our laboratory over <strong>the</strong> summer<br />
period <strong>of</strong> 1999. A histogram <strong>of</strong> percentagespurious<br />
values was <strong>for</strong>med, <strong>and</strong> <strong>the</strong> threshold value<br />
was taken as <strong>the</strong> 95th percentile <strong>of</strong> <strong>the</strong> frequency<br />
distribution.)<br />
St<strong>and</strong>ard signal processing procedures were used to<br />
obtain estimates <strong>of</strong> gain <strong>and</strong> phase by fast Fourier trans<strong>for</strong>m<br />
(Lee et al., 1999). Gain is <strong>the</strong> amplitude <strong>of</strong> <strong>the</strong> response<br />
divided by <strong>the</strong> stimulus amplitude, <strong>and</strong> phase lag<br />
is <strong>the</strong> distance in degrees from <strong>the</strong> peak <strong>of</strong> <strong>the</strong> stimulus<br />
to <strong>the</strong> peak <strong>of</strong> <strong>the</strong> response. The geometrical test (Stark,<br />
2000) was used to make pair-wise comparisons between<br />
<strong>the</strong> responses to <strong>the</strong> Maltese cross <strong>and</strong> each spot target.<br />
This test is a non-parametric alternative to multivariate<br />
analysis <strong>of</strong> variance, based on r<strong>and</strong>omization <strong>the</strong>ory<br />
(Edgington, 1995). A r<strong>and</strong>om enumeration procedure<br />
was used to calculate <strong>the</strong> test statistic (n = 50,000,<br />
Manly, 1991). Dependent variables were (1) <strong>accommodation</strong><br />
gain <strong>and</strong> phase expressed in bivariate Cartesian<br />
coordinates, (2) scalar gain, <strong>and</strong> (3) <strong>accommodation</strong><br />
phase converted to Cartesian coordinates by projection<br />
<strong>of</strong> each <strong>accommodation</strong> response vector to <strong>the</strong> unit circle<br />
(Batschelet, 1981).<br />
2.2. <strong>Stiles</strong>–Craw<strong>for</strong>d function inhomogeneities experiment<br />
In <strong>the</strong> first experiment, <strong>targets</strong> were specified by <strong>the</strong>ir<br />
angular dimensions in object space. However, <strong>the</strong> defocused<br />
retinal images <strong>of</strong> <strong>the</strong>se <strong>targets</strong> will cover a larger<br />
retinal area due to factors such as spherical defocus, diffraction<br />
<strong>and</strong> ocular aberrations. In addition, natural<br />
miniature eye movements (that is, tremor, drift <strong>and</strong><br />
microsaccades) will move <strong>the</strong> retinal image about on<br />
<strong>the</strong> fovea (Carpenter, 1988), fur<strong>the</strong>r increasing <strong>the</strong><br />
potential <strong>for</strong> SC function inhomogeneity over <strong>the</strong> extent<br />
<strong>of</strong> <strong>the</strong> defocused retinal image.<br />
Taking a geometrical–optical approach, <strong>the</strong> defocused<br />
point spread-function may be approximated by
2762 P.B. Kruger et al. / Vision Research 44 (2004) 2757–2767<br />
a circular disc (Smith, 1982). To estimate <strong>the</strong> blur circle<br />
diameter as a function <strong>of</strong> defocus <strong>and</strong> pupil size, we fit<br />
<strong>the</strong> psychophysical data <strong>of</strong> Chan, Smith, <strong>and</strong> Jacobs<br />
(1985) with <strong>the</strong> <strong>for</strong>m x = a + bD + cDE, where x is<br />
<strong>the</strong> blur circle diameter (mrad), D is <strong>the</strong> pupil diameter<br />
(m), E is <strong>the</strong> unsigned magnitude <strong>of</strong> defocus (D), <strong>and</strong><br />
where a = 0.7 mrad, b = 800 mrad m 1 , <strong>and</strong> c = 860<br />
mrad (r 2 = 0.999). Chan et al.Õs (1985) data include <strong>the</strong><br />
effects <strong>of</strong> monochromatic aberrations <strong>and</strong> diffraction,<br />
but were collected in white light <strong>and</strong> so, if anything,<br />
may over-estimate <strong>the</strong> monochromatic blur circle diameters<br />
<strong>of</strong> <strong>the</strong> present study.<br />
Data from <strong>the</strong> previous experiment were analysed to<br />
obtain estimates <strong>of</strong> typical levels <strong>of</strong> accommodative<br />
error (defocus) <strong>for</strong> monochromatic spot <strong>targets</strong>. Histograms<br />
<strong>of</strong> instantaneous accommodative error were calculated<br />
<strong>for</strong> each trial. For each participant <strong>and</strong> spot<br />
diameter separately, histograms from individual trials<br />
were pooled <strong>and</strong> <strong>the</strong> 2.5th <strong>and</strong> 97.5th percentiles <strong>of</strong><br />
accommodative error were calculated. Then <strong>for</strong> <strong>the</strong><br />
group, <strong>the</strong> average 2.5th <strong>and</strong> 97.5th percentiles were calculated<br />
<strong>and</strong> <strong>the</strong>se were taken as measures <strong>of</strong> <strong>the</strong> typical<br />
extent <strong>of</strong> accommodative error.<br />
The variation in <strong>the</strong> point <strong>of</strong> fixation due to miniature<br />
eye movements has been described by a bivariate normal<br />
distribution. Typical values <strong>for</strong> <strong>the</strong> pooled st<strong>and</strong>ard<br />
deviation (r) <strong>of</strong> such a distribution <strong>for</strong> stabilized head<br />
position vary in <strong>the</strong> range 1.5–4 min arc (Carpenter,<br />
1988). If normality can be assumed, <strong>the</strong>n 95% <strong>of</strong> <strong>the</strong><br />
time <strong>the</strong> fixation point will lie within a diameter <strong>of</strong><br />
2 · 1.96r, or about 5.9–15.7 min arc. This simple<br />
descriptive statistical approach seemed adequate <strong>for</strong><br />
<strong>the</strong> present study.<br />
The angular extent <strong>of</strong> <strong>the</strong> retina over which SC function<br />
inhomogeneities must <strong>the</strong>n be considered is given<br />
by <strong>the</strong> sum <strong>of</strong> <strong>the</strong> object diameter, <strong>the</strong> blur circle diameter,<br />
<strong>and</strong> <strong>the</strong> diameter <strong>of</strong> miniature eye movements.<br />
Expected changes in <strong>the</strong> SC function over such retinal<br />
extents were <strong>the</strong>n calculated based on published data<br />
from several <strong>studies</strong>. We included <strong>the</strong> pattern <strong>of</strong> reduced<br />
<strong>foveal</strong> directionality described by Enoch <strong>and</strong> Hope<br />
(1973), <strong>the</strong> annular inhomogeneity reported by Williams<br />
(1980), <strong>and</strong> <strong>the</strong> levels <strong>of</strong> local cone photoreceptor disarray<br />
described by Roorda <strong>and</strong> Williams (2002).<br />
y<br />
0.1<br />
0.0<br />
-0.1<br />
-0.2<br />
-0.3<br />
-0.4<br />
-0.5<br />
1.0 1.7<br />
3.4 6.8<br />
13.6<br />
MC<br />
27.3<br />
-0.1 0.0 0.1 0.2 0.3 0.4 0.5<br />
x<br />
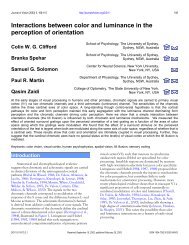
Fig. 3. Gain <strong>and</strong> phase <strong>of</strong> <strong>accommodation</strong> response plotted in<br />
Cartesian coordinates (x,y). Gain is <strong>the</strong> distance <strong>of</strong> a point from <strong>the</strong><br />
origin. Phase is <strong>the</strong> angle subtended by a point at <strong>the</strong> origin, using<br />
st<strong>and</strong>ard trigonometric conventions. Points are labelled by <strong>the</strong> target<br />
spot size (min arc), or by MC <strong>for</strong> <strong>the</strong> Maltese cross. A Ôperfect<br />
responseÕ would have <strong>the</strong> coordinates (1,0). All group mean data<br />
points exhibit a phase lag in <strong>the</strong> response. Ellipses indicate <strong>the</strong><br />
bivariate variability in <strong>the</strong> <strong>accommodation</strong> data <strong>and</strong> denote one<br />
population st<strong>and</strong>ard deviation along <strong>the</strong> eigenvectors <strong>of</strong> <strong>the</strong> sample<br />
distributions, assuming bivariate normal distributions (Sokal & Rohlf,<br />
1981).<br />
3. Results<br />
3.1. Accommodation experiment<br />
Accommodation responses to monochromatic spot<br />
<strong>targets</strong> as small as 13.6 min arc were not significantly different<br />
from those <strong>for</strong> <strong>the</strong> Maltese cross target (Figs. 3–5,<br />
Table 1). The responses to spot <strong>targets</strong> <strong>of</strong> 6.8 min arc<br />
diameter <strong>and</strong> smaller were significantly poorer than to<br />
<strong>the</strong> cross target (Table 1). Never<strong>the</strong>less, <strong>the</strong> response<br />
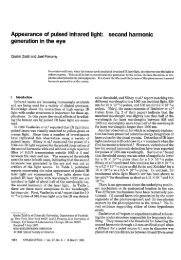
Fig. 4. Mean scalar accommodative gain as a function <strong>of</strong> target spot<br />
size (min arc) <strong>and</strong> <strong>for</strong> <strong>the</strong> Maltese cross (MC). Error bars represent<br />
inter-participant variability <strong>and</strong> denote <strong>the</strong> range <strong>of</strong> values obtained<br />
(n = 7).<br />
to <strong>the</strong> 6.8-min arc spot target still appears quite robust<br />
(Fig. 3) <strong>and</strong> is significantly better than <strong>the</strong> response to<br />
<strong>the</strong> smallest spot size <strong>of</strong> 1.0 min arc (geometrical test,<br />
p = 0.016). Thus, it appears that <strong>targets</strong> as small as 6.8<br />
min arc might prove useful as accommodative stimuli.
P.B. Kruger et al. / Vision Research 44 (2004) 2757–2767 2763<br />
180°<br />
150°<br />
-150°<br />
120°<br />
-120°<br />
1.0<br />
1.7<br />
90°<br />
13.6<br />
-90°<br />
3.4<br />
6.8<br />
27.3<br />
MC<br />
60°<br />
-60°<br />
30°<br />
-30°<br />
Fig. 5. Vector-averaged phase angle <strong>of</strong> <strong>the</strong> <strong>accommodation</strong> response.<br />
Points are labelled by <strong>the</strong> target spot size (minutes arc), or by MC <strong>for</strong><br />
<strong>the</strong> Maltese cross. Arc-shaped error bars represent inter-participant<br />
variability <strong>and</strong> denote <strong>the</strong> range <strong>of</strong> polar values obtained (n = 7).<br />
Distances <strong>of</strong> points along <strong>the</strong> radius are arbitrary <strong>and</strong> have no<br />
numerical significance.<br />
Table 1<br />
Probability values <strong>for</strong> pair-wise comparisons <strong>of</strong> spot target responses<br />
with Maltese cross target responses <strong>for</strong> given dependent variables<br />
Spot target<br />
(min arc)<br />
Gain <strong>and</strong> phase<br />
(bivariate)<br />
Scalar<br />
gain<br />
0°<br />
Phase<br />
1.02 0.015 0.016 0.047 <br />
1.70 0.015 0.031 0.344<br />
3.42 0.031 0.032 0.891<br />
6.82 0.031 0.078 0.077<br />
13.6 0.906 0.797 0.830<br />
27.3 0.828 0.816 0.496<br />
Probability values are <strong>for</strong> a non-directional alternate hypo<strong>the</strong>sis <strong>and</strong><br />
were calculated using <strong>the</strong> geometrical test (Stark, 2000). Values significant<br />
at <strong>the</strong> 5% level are shown with an asterisk.<br />
Scalar gains <strong>for</strong> spot <strong>targets</strong> <strong>of</strong> 13.6 <strong>and</strong> 27.3 min arc<br />
were similar to those <strong>for</strong> <strong>the</strong> Maltese cross target, but <strong>for</strong><br />
smaller <strong>targets</strong> <strong>the</strong>re was a general decline in accommodative<br />
gain with decreasing spot size (Fig. 4). The average<br />
phase lag <strong>of</strong> <strong>the</strong> <strong>accommodation</strong> response varied<br />
little down to 1.7 min arc (Fig. 5), <strong>and</strong> only <strong>the</strong> phase<br />
lag <strong>for</strong> <strong>the</strong> 1.0-minarc target was significantly different<br />
from that <strong>for</strong> <strong>the</strong> Maltese cross target (Table 1). Interindividual<br />
variability in phase lag became marked <strong>for</strong><br />
<strong>targets</strong> <strong>of</strong> 1.7 min arc <strong>and</strong> smaller (Fig. 5). The large<br />
range in phase lags <strong>for</strong> <strong>the</strong> 1.0 min arc target (Fig. 5),<br />
combined with low gain values (Fig. 4), suggests that<br />
<strong>the</strong> response at this stage had fallen below <strong>the</strong> background<br />
noise <strong>of</strong> low-frequency accommodative micr<strong>of</strong>luctuations<br />
(Charman & Heron, 1988).<br />
3.2. <strong>Stiles</strong>–Craw<strong>for</strong>d function inhomogeneities experiment<br />
For <strong>the</strong> 13.6-minarc spot target, 95% <strong>of</strong> accommodative<br />
errors were (on average) in <strong>the</strong> range 1.18 through<br />
+1.75 D. It was estimated, <strong>for</strong> a 3-mm pupil, that <strong>the</strong><br />
defocused retinal image <strong>of</strong> this target would make excursions<br />
over an area <strong>of</strong> up to 40.8–50.6 min <strong>of</strong> arc in diameter,<br />
depending on <strong>the</strong> extent <strong>of</strong> miniature eye<br />
movements (Section 2.2). For <strong>the</strong> 6.8-min arc spot target,<br />
95% <strong>of</strong> accommodative errors were (on average)<br />
in <strong>the</strong> range 1.31 through +1.82 D. It was estimated,<br />
again <strong>for</strong> a 3-mm pupil, that <strong>the</strong> defocused retinal image<br />
<strong>of</strong> this target would make excursions over an area <strong>of</strong> up<br />
to 34.6–44.4 min <strong>of</strong> arc in diameter.<br />
Taking <strong>the</strong> estimated retinal extents just cited, we<br />
<strong>the</strong>n calculated <strong>the</strong> expected changes in <strong>the</strong> SC function<br />
<strong>for</strong> all known <strong>and</strong> quantitatively documented SC<br />
function inhomogeneities (Table 2). The pattern <strong>of</strong><br />
reduced <strong>foveal</strong> directionality (Enoch & Hope, 1973)<br />
has only small effects on directionality: <strong>the</strong> errors are<br />
only about 11%–13% <strong>of</strong> <strong>the</strong> normal <strong>foveal</strong> q value (Applegate<br />
& Lakshminarayanan, 1993). Similarly, local disarray<br />
in photoreceptor alignment (Roorda & Williams,<br />
Table 2<br />
Change in SC function parameters across given retinal extents due to known patterns <strong>of</strong> SC function inhomogeneity<br />
Inhomogeneity<br />
Physical target diameter (minute arc)<br />
6.8 13.6<br />
Dq (mm 2 ) Dx max (mm) Dq (mm 2 ) Dx max (mm)<br />
Reduced <strong>foveal</strong> directionality a 0.0057 – 0.0065 –<br />
Local receptor disarray b 0.17 0.17<br />
Annular location pattern c – 0.63 – 0.71<br />
A 3-mm pupil is assumed. Values are based on a maximum diameter <strong>of</strong> <strong>the</strong> blur-spread function coverage <strong>of</strong> 44.4 minarc <strong>for</strong> <strong>the</strong> 6.8-minarc spot<br />
target, <strong>and</strong> 50.6 minarc <strong>for</strong> <strong>the</strong> 13.6-minute arc target (see Section 3.2). The SC function is expressed as g = g max 10 a , where a = q(x x max ) 2 , g max is<br />
normalised to 1.0, q is <strong>the</strong> directionality constant (mm 2 ), x is <strong>the</strong> position in <strong>the</strong> pupil (mm), <strong>and</strong> x max is <strong>the</strong> location <strong>of</strong> <strong>the</strong> peak <strong>of</strong> <strong>the</strong> SC function.<br />
a Based on a rate <strong>of</strong> change <strong>of</strong> directionality <strong>of</strong> 0.0154 mm 2 per degree eccentricity (that is, radius) within 2° <strong>of</strong> <strong>the</strong> fovea (n =3,Enoch & Hope,<br />
1973).<br />
b Based on an extrapolation <strong>of</strong> an asymptotic curve (n =2;Fig. 4 <strong>of</strong> Roorda & Williams, 2002).<br />
c Based on a rate <strong>of</strong> change in peak location <strong>of</strong> 0.0141 mm per minarc <strong>of</strong> diameter within a 54 minarc diameter centred on <strong>the</strong> fovea (n =3,<br />
Williams, 1980). One <strong>of</strong> WilliamsÕ four participants did not show this effect.
2764 P.B. Kruger et al. / Vision Research 44 (2004) 2757–2767<br />
2002) is quite small. However, <strong>the</strong> SC function inhomogeneity<br />
described by Williams (1980) appears to be<br />
particularly problematic in that large changes in <strong>the</strong><br />
peak location <strong>of</strong> <strong>the</strong> SC function are observed over typically<br />
encountered retinal extents <strong>of</strong> <strong>the</strong> blur-spread<br />
functions.<br />
4. Discussion<br />
For <strong>the</strong> present target retinal illuminance <strong>of</strong> 141 trol<strong>and</strong>s<br />
<strong>and</strong> a pupil size <strong>of</strong> 3 mm, a spot target <strong>of</strong> at least<br />
13.6 min arc diameter appears to provide an adequate<br />
stimulus to <strong>accommodation</strong> (Table 1, Figs. 3–5). However,<br />
SC function inhomogeneities over <strong>the</strong> extent <strong>of</strong><br />
<strong>the</strong> defocused retinal image <strong>of</strong> this spot target are too<br />
large to allow neutralisation <strong>of</strong> <strong>the</strong> SC function with<br />
a static apodizing filter. In particular, it is <strong>the</strong> pattern<br />
<strong>of</strong> inhomogeneity described by Williams (1980) that is<br />
most problematic. This inhomogeneity, when present,<br />
leads to large (0.8 mm) <strong>and</strong> rapid changes (0.8<br />
mm deg 1 ) in <strong>the</strong> SC peak location within <strong>the</strong> central<br />
2° field. As static apodizing filters are inadequate to<br />
study <strong>the</strong> potential stimulus to <strong>accommodation</strong> provided<br />
by <strong>the</strong> SC function, <strong>the</strong>n alternatives must be<br />
sought.<br />
4.1. Methods to investigate <strong>the</strong> potential SC stimulus<br />
An alternative to neutralising <strong>the</strong> SC function is to<br />
use an apodizing filter to move <strong>the</strong> peak <strong>of</strong> <strong>the</strong> function<br />
to <strong>the</strong> opposite side <strong>of</strong> <strong>the</strong> pupil (Kruger et al., 2001).<br />
Provided this shift is large, such a ÔreversingÕ filter should<br />
be disruptive to <strong>the</strong> accommodative system if <strong>the</strong> SC<br />
function provides a stimulus to <strong>accommodation</strong> as<br />
hypo<strong>the</strong>sised.<br />
A technically challenging approach would be to construct<br />
a dynamic apodizing filter. For example, it might<br />
be possible to use a small display in <strong>the</strong> beam path which<br />
is <strong>the</strong>n imaged in <strong>the</strong> eye pupil as an apodizing filter. The<br />
transmittance function <strong>of</strong> this display would be altered<br />
in real time to compensate <strong>for</strong> <strong>the</strong> location within <strong>the</strong><br />
visual field <strong>of</strong> <strong>the</strong> currently displayed pixel <strong>of</strong> <strong>the</strong> target<br />
display, <strong>and</strong> to compensate in real time <strong>for</strong> changes in<br />
eye fixation. The controlling algorithm would need a<br />
reasonable model <strong>of</strong> <strong>the</strong> way in which <strong>the</strong> SC function<br />
changes systematically over <strong>the</strong> central field <strong>for</strong> each<br />
participant tested.<br />
Ano<strong>the</strong>r method that is appropriate when <strong>the</strong> fixation<br />
target does not contain significant high spatial frequency<br />
detail (Ward & Charman, 1987) is to use optical modelling<br />
s<strong>of</strong>tware <strong>and</strong> a schematic eye model to simulate <strong>the</strong><br />
retinal image in <strong>the</strong> presence <strong>of</strong> defocus <strong>and</strong> <strong>the</strong> SC function.<br />
The simulated retinal image is <strong>the</strong>n presented on a<br />
bright display, <strong>and</strong> viewed through a small pupil (0.5<br />
mm) to open <strong>the</strong> accommodative system control loop<br />
(Ward & Charman, 1987). This method has been used<br />
be<strong>for</strong>e <strong>and</strong> is not challenging (<strong>for</strong> example, Lee et al.,<br />
1999). Because <strong>the</strong> artificial pupil is so small, <strong>the</strong> natural<br />
SC function <strong>of</strong> <strong>the</strong> eye <strong>and</strong> any inhomogeneities in that<br />
function will have only negligible effects on <strong>the</strong> appearance<br />
<strong>of</strong> <strong>the</strong> simulated retinal image. In this respect, typical<br />
miniature eye movements would not invalidate <strong>the</strong><br />
experimental paradigm. However, it is also necessary<br />
to assume that miniature eye movements are not involved<br />
directly in <strong>the</strong> cue extraction process. Fincham<br />
(1951) provided some evidence that voluntary suppression<br />
<strong>of</strong> <strong>the</strong> miniature eye movements prevented ÔreflexiveÕ<br />
<strong>accommodation</strong> responses. Whe<strong>the</strong>r this suggests a<br />
role <strong>for</strong> <strong>the</strong>se eye movements in cue extraction, or<br />
whe<strong>the</strong>r <strong>the</strong> movements are necessary to prevent perceptual<br />
fading (Kotulak & Schor, 1986) is not known. Until<br />
this issue is resolved, <strong>the</strong> conclusions drawn from a<br />
small-pupil paradigm must be qualified. If no <strong>accommodation</strong><br />
responses were found to <strong>the</strong> simulations <strong>the</strong>n this<br />
could mean that (1) <strong>the</strong> SC function does not provide a<br />
stimulus to <strong>accommodation</strong>, or (2) miniature eye movements<br />
may be necessary <strong>for</strong> extraction <strong>of</strong> a SC function<br />
cue. If responses were found to <strong>the</strong> simulations <strong>the</strong>n this<br />
would indicate that miniature eye movements are not<br />
necessary <strong>for</strong> extraction <strong>of</strong> <strong>the</strong> SC function cue,<br />
although fur<strong>the</strong>r experimentation would be required to<br />
determine if <strong>the</strong>y could aid <strong>the</strong> response.<br />
It may be noted in passing that <strong>the</strong> use <strong>of</strong> electromechanical<br />
means to open <strong>the</strong> accommodative system<br />
loop (Kruger et al., 1995) would be inappropriate <strong>for</strong><br />
presentation <strong>of</strong> simulated retinal images in <strong>the</strong> present<br />
case. This is because with a natural pupil, <strong>the</strong> SC function<br />
<strong>of</strong> <strong>the</strong> eye (<strong>and</strong> <strong>the</strong> inhomogeneities in <strong>the</strong> function)<br />
would interfere with <strong>the</strong> intensity distribution in <strong>the</strong> simulation<br />
display.<br />
4.2. O<strong>the</strong>r sources <strong>of</strong> variability in <strong>the</strong> SC function<br />
An important consideration <strong>for</strong> <strong>studies</strong> <strong>of</strong> <strong>the</strong> SC<br />
function <strong>and</strong> <strong>accommodation</strong> is whe<strong>the</strong>r <strong>the</strong> SC effect<br />
is altered by changes in <strong>accommodation</strong> that occur during<br />
an <strong>accommodation</strong> experiment. Large amounts <strong>of</strong><br />
<strong>accommodation</strong> (<strong>for</strong> example, 9 D) can produce significant<br />
nasal shifts (<strong>for</strong> example, 1 mm) in <strong>the</strong> location <strong>of</strong><br />
<strong>the</strong> SC function peak (Blank & Enoch, 1973; Blank, Provine,<br />
& Enoch, 1975; Enoch, 1975; Provine & Enoch,<br />
1975), but <strong>the</strong> nasal decentration that results from<br />
<strong>accommodation</strong> is small <strong>for</strong> accommodative responses<br />
with moderate amplitudes like those in <strong>the</strong> present<br />
experiment. In an experiment similar to <strong>the</strong> present<br />
study, Kruger et al. (2001) estimated <strong>the</strong> nasal shift to<br />
be 0.07 mm as a result <strong>of</strong> a sinusoidal accommodative<br />
response with an amplitude <strong>of</strong> 0.8 D. Thus <strong>for</strong> <strong>accommodation</strong><br />
experiments that require moderate changes<br />
in <strong>accommodation</strong>, <strong>the</strong> effects <strong>of</strong> <strong>accommodation</strong> on<br />
<strong>the</strong> SC function itself are not critical.
P.B. Kruger et al. / Vision Research 44 (2004) 2757–2767 2765<br />
In <strong>the</strong> present study we have considered a local averaged<br />
<strong>Stiles</strong>–Craw<strong>for</strong>d effect over patches <strong>of</strong> <strong>the</strong> retina.<br />
However, individual photoreceptors over a small retinal<br />
area do not all point to <strong>the</strong> same position in <strong>the</strong> entrance<br />
pupil (Coble & Rushton, 1971; Enoch, 1967; Heath &<br />
Walraven, 1970; MacLeod, 1974; Makous, 1968;<br />
OÕBrien & Miller, 1953; Ohzu & Enoch, 1972; Roorda<br />
& Williams, 2002). This places a limit on <strong>the</strong> hypo<strong>the</strong>ses<br />
that may be tested with apodizing pupils or simulations<br />
<strong>of</strong> point spread functions, because it would be<br />
virtually impossible to construct a system to correct<br />
<strong>for</strong> <strong>the</strong> waveguide properties <strong>of</strong> individual cones in<br />
real-time. Never<strong>the</strong>less, <strong>the</strong> degree <strong>of</strong> receptor disarray<br />
is quite small. For example, Roorda <strong>and</strong> Williams<br />
(2002) found that <strong>the</strong> average distance in <strong>the</strong> entrance<br />
pupil between <strong>the</strong> pointing directions <strong>of</strong> cones separated<br />
by 20 arcmin on <strong>the</strong> retina was just 0.17 mm. The<br />
hypo<strong>the</strong>sis to be tested with apodizing filters or point<br />
spread function simulations <strong>the</strong>n is that <strong>the</strong> SC function<br />
averaged over small retinal areas (in <strong>the</strong> order <strong>of</strong> 6–13<br />
min arc) may be used to provide a stimulus to <strong>accommodation</strong>.<br />
4.3. Interactions with monochromatic aberrations<br />
One possible limitation to <strong>the</strong> use <strong>of</strong> <strong>the</strong> <strong>Stiles</strong>–Craw<strong>for</strong>d<br />
effect as a signal to <strong>accommodation</strong> is that typical<br />
ocular aberrations (Porter, Guirao, Cox, & Williams,<br />
2001), such as coma, can also produce skewness in <strong>the</strong><br />
retinal image, masking to some extent <strong>the</strong> potential signal<br />
provided by <strong>the</strong> SC function (Fig. 1). It would thus<br />
be <strong>of</strong> interest to determine from a <strong>the</strong>oretical viewpoint<br />
how skewing <strong>of</strong> <strong>the</strong> defocused point spread function depends<br />
on <strong>the</strong> interactions between typical ocular aberrations<br />
<strong>and</strong> <strong>the</strong> SC function. Our recent simulation study<br />
indicates that <strong>the</strong> aberrations <strong>of</strong> <strong>the</strong> eye do interact with<br />
<strong>the</strong> SC function in producing skewing <strong>of</strong> <strong>the</strong> blur-spread<br />
function (Stark, Kruger, & Atchison, 2002). Fur<strong>the</strong>rmore,<br />
because <strong>the</strong> aberrations <strong>the</strong>mselves may provide<br />
signed cues to <strong>accommodation</strong> (Wilson et al., 2002),<br />
any experimental investigations <strong>of</strong> <strong>the</strong> SC function cue<br />
would need to separate <strong>the</strong> effects <strong>of</strong> <strong>the</strong> SC function<br />
<strong>and</strong> <strong>the</strong> monochromatic aberrations.<br />
Acknowledgment<br />
This research was supported by National Institutes <strong>of</strong><br />
Health grant EYO5901-14 to P.B. Kruger.<br />
References<br />
Allen, M. J. (1955). The stimulus to <strong>accommodation</strong>. American Journal<br />
<strong>of</strong> Optometry <strong>and</strong> Archives <strong>of</strong> American Academy <strong>of</strong> Optometry, 32,<br />
422–431.<br />
Applegate, R. A., & Lakshminarayanan, V. (1993). Parametric<br />
representation <strong>of</strong> <strong>Stiles</strong>–Craw<strong>for</strong>d functions: Normal variation <strong>of</strong><br />
peak location <strong>and</strong> directionality. Journal <strong>of</strong> <strong>the</strong> Optical Society <strong>of</strong><br />
America A, Optics <strong>and</strong> Image Science, 10, 1611–1623.<br />
Batschelet, E. (1981). Circular statistics in biology (pp. 3–30). London:<br />
Academic Press.<br />
Blank, K., & Enoch, J. M. (1973). Monocular spatial distortions<br />
induced by marked <strong>accommodation</strong>. Science, 182(110), 393–395.<br />
Blank, K., Provine, R. R., & Enoch, J. M. (1975). Shift in <strong>the</strong> peak <strong>of</strong><br />
<strong>the</strong> photopic <strong>Stiles</strong>–Craw<strong>for</strong>d function with marked <strong>accommodation</strong>.<br />
Vision Research, 15, 499–507.<br />
Campbell, F. W. (1954). The minimum quantity <strong>of</strong> light required to<br />
elicit <strong>the</strong> <strong>accommodation</strong> reflex in man. Journal <strong>of</strong> Physiology<br />
(London), 123, 357–366.<br />
Campbell, M. C. W., Priest, D., & Hunter, J. J. (2001). The importance<br />
<strong>of</strong> monochromatic aberrations to detecting defocus in retinal<br />
images [abstract]. Investigative Ophthalmology <strong>and</strong> Visual Science,<br />
42(4), S98.<br />
Campbell, F. W., & Wes<strong>the</strong>imer, G. (1959). Factors influencing<br />
<strong>accommodation</strong> responses <strong>of</strong> <strong>the</strong> human eye. Journal <strong>of</strong> <strong>the</strong> Optical<br />
Society <strong>of</strong> America, 49, 568–571.<br />
Carpenter, R. H. S. (1988). Movements <strong>of</strong> <strong>the</strong> eyes (pp. 124–138) (2nd<br />
ed.). London: Pion.<br />
Chan, C., Smith, G., & Jacobs, R. J. (1985). Simulating refractive<br />
errors: source <strong>and</strong> observer methods. American Journal <strong>of</strong> Optometry<br />
<strong>and</strong> Physiological Optics, 62, 207–216.<br />
Charman, W. N., & Heron, G. (1988). Fluctuations in <strong>accommodation</strong>:<br />
A review. Ophthalmic <strong>and</strong> Physiological Optics, 8, 153–164.<br />
Chen, L., Kruger, P. B., & Williams, D. R. (2002). Accommodation<br />
without higher order monochromatic aberrations [abstract]. In<br />
2002 Annual meeting abstract search <strong>and</strong> program planner (Program<br />
number 956) [CD ROM]. Association <strong>for</strong> Research in Vision <strong>and</strong><br />
Ophthalmology.<br />
Choi, S. S., & Garner, L. F. (2000). The relationship between <strong>the</strong><br />
<strong>Stiles</strong>–Craw<strong>for</strong>d effect <strong>and</strong> myopia [abstract]. Investigative Ophthalmology<br />
<strong>and</strong> Visual Science, 41(4), S431.<br />
Ciuffreda, K. J. (1991). Accommodation <strong>and</strong> its anomalies. In J.<br />
Cronly-Dillon (Ed.). In W. N. Charman (Ed.). Vision <strong>and</strong> visual<br />
dysfunction (vol. 1, pp. 231–279). Houndmills, Hampshire, United<br />
Kingdom: The Macmillan Press.<br />
Coble, J. R., & Rushton, W. A. H. (1971). <strong>Stiles</strong>–Craw<strong>for</strong>d effect <strong>and</strong><br />
<strong>the</strong> bleaching <strong>of</strong> cone pigments. Journal <strong>of</strong> Physiology (London),<br />
217, 231–242.<br />
Coren, S. (1970). An instrument to produce surface colors <strong>of</strong><br />
continuously variable brightness. Behavior Research Methods <strong>and</strong><br />
Instrumentation, 2, 263.<br />
Duane, A. (1922). Studies in monocular <strong>and</strong> binocular <strong>accommodation</strong><br />
with <strong>the</strong>ir clinical applications. American Journal <strong>of</strong> Ophthalmology,<br />
5, 865–877.<br />
Dunnewold, C. J. W. (1964). On <strong>the</strong> Campbell <strong>and</strong> <strong>Stiles</strong>–Craw<strong>for</strong>d<br />
effects <strong>and</strong> <strong>the</strong>ir clinical importance. M.D. Thesis, Rijksuniversiteit<br />
te Utrecht. Assen, Ne<strong>the</strong>rl<strong>and</strong>s: van Gorcum.<br />
Edgington, E. S. (1995). R<strong>and</strong>omization tests (pp. 177–200) (3rd ed.).<br />
New York: Marcel Dekker.<br />
Enoch, J. M. (1957). Amblyopia <strong>and</strong> <strong>the</strong> <strong>Stiles</strong>–Craw<strong>for</strong>d effect.<br />
American Journal <strong>of</strong> Optometry <strong>and</strong> Archives <strong>of</strong> American Academy<br />
<strong>of</strong> Optometry, 34, 298–309.<br />
Enoch, J. M. (1967). The current status <strong>of</strong> receptor amblyopia.<br />
Documenta Ophthalmologica, 23, 130–148.<br />
Enoch, J. M. (1975). Marked <strong>accommodation</strong>, retinal stretch, monocular<br />
space perception <strong>and</strong> retinal receptor orientation. American<br />
Journal <strong>of</strong> Optometry <strong>and</strong> Physiological Optics, 52, 376–392.<br />
Enoch, J. M., & Hope, G. M. (1972a). An analysis <strong>of</strong> retinal receptor<br />
orientation. III. Results <strong>of</strong> initial psychophysical tests. Investigative<br />
Ophthalmology, 11, 765–782.<br />
Enoch, J. M., & Hope, G. M. (1972b). An analysis <strong>of</strong> retinal receptor<br />
orientation. IV. Center <strong>of</strong> <strong>the</strong> entrance pupil <strong>and</strong> <strong>the</strong> center <strong>of</strong>
2766 P.B. Kruger et al. / Vision Research 44 (2004) 2757–2767<br />
convergence <strong>of</strong> orientation <strong>and</strong> directional sensitivity. Investigative<br />
Ophthalmology, 11, 1017–1021.<br />
Enoch, J. M., & Hope, G. M. (1973). Directional sensitivity <strong>of</strong> <strong>the</strong><br />
<strong>foveal</strong> <strong>and</strong> para<strong>foveal</strong> retina. Investigative Ophthalmology, 12,<br />
497–503.<br />
Enoch, J. M., & Lakshminarayanan, V. (1991). Retinal fibre optics. In<br />
J. Cronly-Dillon (Ed.). In W. N. Charman (Ed.). Vision <strong>and</strong> visual<br />
dysfunction (vol. 1, pp. 280–309) Houndmills, Hampshire, United<br />
Kingdom: The Macmillan Press.<br />
Fern<strong>and</strong>ez, E. J., & Artal, P. (2002). Adaptive-optics correction <strong>of</strong><br />
asymmetric aberrations degrades <strong>accommodation</strong> responses<br />
[abstract]. In 2002 Annual meeting abstract search <strong>and</strong> program<br />
planner (Program number 954). [CD ROM]. Association <strong>for</strong><br />
Research in Vision <strong>and</strong> Ophthalmology.<br />
Fincham, E. F. (1951). The <strong>accommodation</strong> reflex <strong>and</strong> its stimulus.<br />
British Journal <strong>of</strong> Ophthalmology, 35, 381–393.<br />
Fincham, E. F. (1953). Defects <strong>of</strong> <strong>the</strong> colour-sense mechanism as<br />
indicated by <strong>the</strong> <strong>accommodation</strong> reflex. Journal <strong>of</strong> Physiology<br />
(London), 121, 570–580.<br />
Gorr<strong>and</strong>, J.-M., & Delori, F. (1995). A reflectometric technique <strong>for</strong><br />
assessing photoreceptor alignment. Vision Research, 35, 999–1010.<br />
Heath, G. G., & Walraven, P. L. (1970). Receptor orientations in <strong>the</strong><br />
central retina [abstract]. Journal <strong>of</strong> <strong>the</strong> Optical Society <strong>of</strong> America,<br />
60, 733–734.<br />
Kotulak, J. C., & Schor, C. M. (1986). The accommodative response to<br />
subthreshold blur <strong>and</strong> to perceptual fading during <strong>the</strong> Troxler<br />
phenomenon. Perception, 15, 7–15.<br />
Kruger, P. B. (1979). Infrared recording retinoscope <strong>for</strong> monitoring<br />
<strong>accommodation</strong>. American Journal <strong>of</strong> Optometry <strong>and</strong> Physiological<br />
Optics, 56, 116–123.<br />
Kruger, P. B., López-Gil, N., & Stark, L. R. (2001). Ocular<br />
<strong>accommodation</strong> <strong>and</strong> <strong>the</strong> <strong>Stiles</strong>–Craw<strong>for</strong>d effect: Theory <strong>and</strong> a case<br />
study. Ophthalmic <strong>and</strong> Physiological Optics, 21, 339–351.<br />
Kruger, P. B., Ma<strong>the</strong>ws, S., Aggarwala, K. R., & Sanchez, N. (1993).<br />
Chromatic aberration <strong>and</strong> ocular focus: Fincham revisited. Vision<br />
Research, 33, 1397–1411.<br />
Kruger, P. B., Ma<strong>the</strong>ws, S., Aggarwala, K. R., Yager, D., & Kruger,<br />
E. S. (1995). Accommodation responds to changing contrast <strong>of</strong><br />
long, middle <strong>and</strong> short spectral waveb<strong>and</strong> components <strong>of</strong> <strong>the</strong><br />
retinal image. Vision Research, 35, 2415–2429.<br />
Kruger, P. B., Ma<strong>the</strong>ws, S., Katz, M., Aggarwala, K. R., &<br />
Nowbotsing, S. (1997). Accommodation without feedback suggests<br />
directional signals specify ocular focus. Vision Research, 37,<br />
2511–2526.<br />
Kruger, P. B., Stark, L. R., & Hu, A. C. (2000). Accommodation to<br />
blurred vertical edges viewed through pinholes on <strong>the</strong> left or right<br />
side <strong>of</strong> <strong>the</strong> pupil [abstract]. Investigative Ophthalmology <strong>and</strong> Visual<br />
Science, 41(4), S817.<br />
Laties, A. M., & Enoch, J. M. (1971). An analysis <strong>of</strong> retinal receptor<br />
orientation. I. Angular relationship <strong>of</strong> neighboring photoreceptors.<br />
Investigative Ophthalmology, 10, 69–77.<br />
Lee, J. H., Stark, L. R., Cohen, S., & Kruger, P. B. (1999).<br />
Accommodation to static chromatic simulations <strong>of</strong> blurred retinal<br />
images. Ophthalmic <strong>and</strong> Physiological Optics, 19, 223–235.<br />
MacLeod, D. I. A. (1974). Directionally selective light adaptation: A<br />
visual consequence <strong>of</strong> receptor disarray Vision Research, 14,<br />
369–378.<br />
Makous, W. L. (1968). A transient <strong>Stiles</strong>–Craw<strong>for</strong>d effect. Vision<br />
Research, 8, 1271–1284.<br />
Manly, B. F. J. (1991). R<strong>and</strong>omization <strong>and</strong> Monte Carlo methods in<br />
biology (pp. 32–36). London: Chapman & Hall.<br />
Ma<strong>the</strong>ws, S., & Kruger, P. B. (1994). Spatiotemporal transfer function<br />
<strong>of</strong> human <strong>accommodation</strong>. Vision Research, 34, 1965–1980.<br />
Miller, R. J. (1980). Ocular vergence-induced <strong>accommodation</strong> <strong>and</strong> its<br />
relation to dark focus. Perception <strong>and</strong> Psychophysics, 28, 125–132.<br />
OÕBrien, B., & Miller, N. (1953). A study <strong>of</strong> <strong>the</strong> mechanism <strong>of</strong> visual<br />
acuity in <strong>the</strong> central retina. (WADC Technical Report No. 53-198).<br />
Wright-Patterson Air Force Base, Ohio: Aero Medical Laboratory,<br />
Wright Air Development Center. Air Research <strong>and</strong> Development<br />
Comm<strong>and</strong>, United States Air Force.<br />
Ohzu, H., & Enoch, J. M. (1972). Optical modulation by <strong>the</strong> isolated<br />
human fovea. Vision Research, 12, 245–251.<br />
Owens, D. A., & Leibowitz, H. W. (1975). The fixation point as a<br />
stimulus <strong>for</strong> <strong>accommodation</strong>. Vision Research, 15, 1161–1163.<br />
Phillips, S., & Stark, L. (1977). Blur: A sufficient accommodative<br />
stimulus. Documenta Ophthalmologica, 43, 65–89.<br />
Porter, J., Guirao, A., Cox, I. G., & Williams, D. R. (2001).<br />
Monochromatic aberrations <strong>of</strong> <strong>the</strong> human eye in a large population.<br />
Journal <strong>of</strong> <strong>the</strong> Optical Society <strong>of</strong> America A, Optics, Image<br />
Science, <strong>and</strong> Vision, 18, 1793–1803.<br />
Provine, R. R., & Enoch, J. M. (1975). On voluntary ocular<br />
<strong>accommodation</strong>. Perception <strong>and</strong> Psychophysics, 17, 209–212.<br />
Roorda, A., & Williams, D. R. (2002). Optical fiber properties <strong>of</strong><br />
individual human cones. Journal <strong>of</strong> Vision, 2, 404–412.<br />
Rosenfield, M., Ciuffreda, K. J., Hung, G. K., & Gilmartin, B. (1994).<br />
Tonic <strong>accommodation</strong>: A review. II. Accommodative adaptation<br />
<strong>and</strong> clinical aspects. Ophthalmic <strong>and</strong> Physiological Optics, 14,<br />
265–277.<br />
Rynders, M. C., Thibos, L. N., Bradley, A., & López-Gil, N. (1997).<br />
Apodization neutralization: A new technique <strong>for</strong> investigating <strong>the</strong><br />
impact <strong>of</strong> <strong>the</strong> <strong>Stiles</strong>–Craw<strong>for</strong>d effect on visual function. In V.<br />
Lakshminarayanan (Ed.), Basic <strong>and</strong> clinical applications <strong>of</strong> vision<br />
science. The Pr<strong>of</strong>essor Jay M. Enoch Festschrift volume (pp. 57–61).<br />
Dordrecht: Kluwer Academic Publishers.<br />
Scott, D. H., Atchison, D. A., & Pejski, P. A. (2001). Description <strong>of</strong> a<br />
method <strong>for</strong> neutralising <strong>the</strong> <strong>Stiles</strong>–Craw<strong>for</strong>d effect. Ophthalmic <strong>and</strong><br />
Physiological Optics, 21, 161–172.<br />
Smith, G. (1982). Angular diameter <strong>of</strong> defocus blur discs. American<br />
Journal <strong>of</strong> Optometry <strong>and</strong> Physiological Optics, 59, 885–889.<br />
Sokal, R. R., & Rohlf, F. J. (1981). Biometry (pp. 594–601) (2nd ed.).<br />
San Francisco: W.H. Freeman.<br />
Stark, L., & Takahashi, Y. (1965). Absence <strong>of</strong> an odd-error signal<br />
mechanism in human <strong>accommodation</strong>. IEEE Transactions on Bio-<br />
Medical Engineering, BME, 12, 138–146.<br />
Stark, L. R. (2000). The geometrical test: A new non-parametric<br />
procedure <strong>for</strong> <strong>the</strong> analysis <strong>of</strong> dioptric power data [abstract].<br />
Investigative Ophthalmology <strong>and</strong> Visual Science, 41(4), S301.<br />
Stark, L. R., & Atchison, D. A. (1994). Subject instructions <strong>and</strong><br />
methods <strong>of</strong> target presentation in <strong>accommodation</strong> research. Investigative<br />
Ophthalmology <strong>and</strong> Visual Science, 35, 528–537.<br />
Stark, L. R., & Kruger, P. B. (2002). Empirical investigation <strong>of</strong> reflex,<br />
proximal <strong>and</strong> voluntary components <strong>of</strong> <strong>the</strong> accommodative<br />
response [abstract]. Optometry <strong>and</strong> Vision Science, 79(12s), 172.<br />
Stark, L. R., Kruger, P. B., & Atchison, D. A. (2002). Model <strong>of</strong> <strong>the</strong><br />
signed cue to defocus provided by a decentered <strong>Stiles</strong>–Craw<strong>for</strong>d<br />
function [abstract]. Optometry <strong>and</strong> Vision Science, 79(12s), 178.<br />
<strong>Stiles</strong>, W. S., & Craw<strong>for</strong>d, B. H. (1933). The luminous efficiency <strong>of</strong> rays<br />
entering <strong>the</strong> eye pupil at different points. Proceedings <strong>of</strong> <strong>the</strong> Royal<br />
Society <strong>of</strong> London Series B, 112, 428–450, Containing Papers <strong>of</strong> a<br />
Biological Character.<br />
Thibos, L. N., Bradley, A., Still, D. L., Zhang, X., & Howarth, P. A.<br />
(1990). Theory <strong>and</strong> measurement <strong>of</strong> ocular chromatic aberration.<br />
Vision Research, 30, 33–49.<br />
Walsh, G., & Charman, W. N. (1988). Visual sensitivity to temporal<br />
change in focus <strong>and</strong> its relevance to <strong>the</strong> <strong>accommodation</strong> response.<br />
Vision Research, 28, 1207–1221.<br />
Ward, P. A., & Charman, W. N. (1987). On <strong>the</strong> use <strong>of</strong> small artificial<br />
pupils to open-loop <strong>the</strong> <strong>accommodation</strong> system [letter]. Ophthalmic<br />
<strong>and</strong> Physiological Optics, 7, 191–193.<br />
Wes<strong>the</strong>imer, G. (1966). The Maxwellian view. Vision Research, 6,<br />
669–682.<br />
Wes<strong>the</strong>imer, G. (1967). Dependence <strong>of</strong> <strong>the</strong> magnitude <strong>of</strong> <strong>the</strong> <strong>Stiles</strong>–<br />
Craw<strong>for</strong>d effect on retinal location. Journal <strong>of</strong> Physiology (London),<br />
192, 309–315.
P.B. Kruger et al. / Vision Research 44 (2004) 2757–2767 2767<br />
Wes<strong>the</strong>imer, G. (1968). Entoptic visualization <strong>of</strong> <strong>Stiles</strong>–Craw<strong>for</strong>d<br />
effect. An indicator <strong>of</strong> eyeball shape. Archives <strong>of</strong> Ophthalmology,<br />
79, 584–588.<br />
Williams, D. R. (1980). Visual consequences <strong>of</strong> <strong>the</strong> <strong>foveal</strong> pit.<br />
Investigative Ophthalmology & Visual Science, 19, 653–667.<br />
Wilson, B. J., Decker, K. E., & Roorda, A. (2002). Monochromatic<br />
aberrations provide an odd-error cue to focus direction. Journal <strong>of</strong><br />
<strong>the</strong> Optical Society <strong>of</strong> America A, Optics, Image Science, <strong>and</strong> Vision,<br />
19, 833–839.