Urish layout I - Rhode Island Sea Grant - University of Rhode Island
Urish layout I - Rhode Island Sea Grant - University of Rhode Island
Urish layout I - Rhode Island Sea Grant - University of Rhode Island

Create successful ePaper yourself
Turn your PDF publications into a flip-book with our unique Google optimized e-Paper software.
This whitepaper series is the result <strong>of</strong> a collaborative research effort among <strong>Rhode</strong> <strong>Island</strong> <strong>Sea</strong> <strong>Grant</strong>, the City <strong>of</strong><br />
Warwick, and the R.I. Department <strong>of</strong> Environmental Management to determine specific means to restore<br />
water quality in Greenwich Bay.<br />
The proper citation for this report is:<br />
<strong>Urish</strong>, D.W. and A.L. Gomez. 2004. Groundwater Discharge to Greenwich Bay. Paper No. 3 in:<br />
M. Schwartz (ed.) Restoring Water Quality in Greenwich Bay: A Whitepaper Series. <strong>Rhode</strong> <strong>Island</strong> <strong>Sea</strong> <strong>Grant</strong>,<br />
Narragansett, R.I. 8pp.<br />
Additional papers in Restoring Water Quality in Greenwich Bay: A Whitepaper Series*<br />
Responding to the Crisis: Formation <strong>of</strong> the Greenwich Bay Partnership (In prep.)<br />
Greenwich Bay and Its Watershed: Spatial Data for Planning and Environmental Management (2000)<br />
Stormwater Discharges to Greenwich Bay (In prep.)<br />
Circulation and Flushing Dynamics <strong>of</strong> Greenwich Bay and Its Coves (In prep.)<br />
An Assessment <strong>of</strong> Eutrophication in Greenwich Bay (2000)<br />
Education and Community Outreach for Greenwich Bay (In prep.)<br />
*Availability <strong>of</strong> whitepapers and ordering information can be found at: http://seagrant.gso.uri.edu/G_Bay/<br />
Additional copies <strong>of</strong> this publication are available from the <strong>Rhode</strong> <strong>Island</strong> <strong>Sea</strong> <strong>Grant</strong> Communications Office,<br />
<strong>University</strong> <strong>of</strong> <strong>Rhode</strong> <strong>Island</strong> Bay Campus, Narragansett, RI 02882-1197. Order P1689. $3.<br />
Loan copies <strong>of</strong> this publication are available from the National <strong>Sea</strong> <strong>Grant</strong> Depository, Pell Library Building,<br />
<strong>University</strong> <strong>of</strong> <strong>Rhode</strong> <strong>Island</strong> Bay Campus, Narragansett, RI 02882-1197. Order RIU-T-04-001.<br />
This publication is sponsored in part by <strong>Rhode</strong> <strong>Island</strong> <strong>Sea</strong> <strong>Grant</strong>, under NOAA <strong>Grant</strong> No. NA86RG0076. The<br />
views expressed herein are those <strong>of</strong> the authors and do not necessarily reflect the views <strong>of</strong> NOAA or any <strong>of</strong> its<br />
sub-agencies. The U.S. Government is authorized to produce and distribute reprints for governmental purposes<br />
notwithstanding any copyright notation that may appear hereon.<br />
Cover photo courtesy <strong>of</strong> the Providence Journal Company. Reprinted with permission.<br />
<strong>Rhode</strong> <strong>Island</strong>
Groundwater Discharge to Greenwich Bay<br />
DANIEL W. URISH AND ANTHONY L. GOMEZ<br />
DEPARTMENT OF CIVIL AND ENVIRONMENTAL ENGINEERING<br />
UNIVERSITY OF RHODE ISLAND<br />
KINGSTON, RI 02881<br />
INTRODUCTION<br />
Groundwater enters Greenwich Bay from two<br />
primary sources: 1) approximately 75 percent as dry<br />
weather flow from streams and 2) approximately 25<br />
percent as direct seepage along the coastlines <strong>of</strong> the<br />
bay and its contiguous coves. To a much lesser<br />
extent, groundwater may enter as unintentional point<br />
discharge from subsurface pipes intended to carry<br />
only stormwater drainage. Groundwater represents<br />
60 to 70 percent <strong>of</strong> the quantity <strong>of</strong> freshwater entering<br />
the bay from a terrestrial origin. The remainder<br />
enters as stream and stormwater discharge directly<br />
from rainfall events on the watershed and direct<br />
deposition on the bay itself.<br />
The quality <strong>of</strong> the groundwater is highly important<br />
to the bay since it carries with it a wide range <strong>of</strong><br />
anthropogenic contaminants from cultural sources<br />
(Giblin and Gaines, 1990; Nixon, 1995), which are<br />
disposed <strong>of</strong> directly in the ground or leached into the<br />
ground from surface sources. The discharge <strong>of</strong><br />
contaminants in the poorly flushed regions <strong>of</strong><br />
Greenwich Bay is <strong>of</strong> special concern. From a<br />
groundwater source, the contaminant <strong>of</strong> primary<br />
concern is nitrogen, due to its potential to cause<br />
eutrophication. Additionally, biological contamination<br />
may occur from failed septic systems if there is<br />
little opportunity for subsurface filtration and die <strong>of</strong>f<br />
<strong>of</strong> harmful pathogens.<br />
Nitrogen in groundwater is <strong>of</strong> particular concern<br />
since, in high concentrations, it may be a serious<br />
health problem in drinking water, but at much lower<br />
levels it can have serious adverse implications for<br />
receiving waters. Nitrogen is usually the limiting<br />
nutrient in seawater (Ryther and Dunstan, 1971); and<br />
in poorly flushed coves and along the shoreline,<br />
nitrogen can cause eutrophication, a condition in<br />
which excessive growth <strong>of</strong> aquatic plant life and<br />
algae occurs with subsequent decay and depletion <strong>of</strong><br />
oxygen (Richardson and Jorgensen, 1996). This can<br />
not only cause bad odors, but will kill all oxygendependent<br />
life in the water. Nitrogen is a major<br />
component <strong>of</strong> sewage effluent (Canter and Knox,<br />
1985). Existing nitrogen levels in groundwater in the<br />
Greenwich Bay area are frequently in excess <strong>of</strong> 6<br />
milligrams per liter (mg/l). It takes less than 1 mg/l in<br />
poorly flushed coastal waters to cause eutrophication.<br />
PURPOSE<br />
The purpose <strong>of</strong> this groundwater study was to<br />
provide information for the evaluation <strong>of</strong> the quantity,<br />
quality, and location <strong>of</strong> groundwater discharge<br />
into Greenwich Bay and its contiguous coves. The<br />
information presented here focuses on three areas:<br />
1) The delineation <strong>of</strong> source and discharge<br />
locations for groundwater entering the bay. This task<br />
included the delineation <strong>of</strong> sub-basins within the<br />
watershed and the employment <strong>of</strong> thermal infrared<br />
aerial photography<br />
2) Water budgets for groundwater discharge to<br />
the bay<br />
3) Nitrogen budgets for groundwater discharge<br />
to the bay<br />
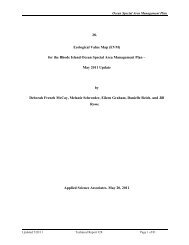
DELINEATION OF SUB-BASINS<br />
In order to define the probable sources <strong>of</strong><br />
groundwater recharge and its discharge locations to<br />
Greenwich Bay, the watershed was subdivided into<br />
23 sub-basins as shown in Figure 1. These subbasins<br />
were defined on the basis <strong>of</strong> surface topography<br />
and watershed divide delineation. While it is<br />
recognized that surface water topographic delineation<br />
is not the same as groundwater sub-basin<br />
delineation, it is a reasonable approximation and best<br />
available given the lack <strong>of</strong> detailed groundwater<br />
elevations (Cambareri and Eichner, 1998). These<br />
sub-basin areas are tabulated as to size and contaminant<br />
source significance in Table 1. It is noted that<br />
the sub-basins <strong>of</strong> Hardig Brook and Maskerchugg<br />
are by far the largest sub-basins, as well as the<br />
largest unsewered areas.<br />
1
Figure 1. Greenwich Bay watershed with sub-basin delineation<br />
THERMAL INFRARED IMAGERY<br />
Thermal infrared aerial imagery has been<br />
employed to identify specific areas <strong>of</strong> concentrated<br />
groundwater discharge along the shoreline. This<br />
method uses the difference in thermal spectral<br />
response to measure temperature contrast <strong>of</strong> water<br />
along the coastal margin (Banks et al., 1996). Since<br />
groundwater, which discharges at a temperature <strong>of</strong><br />
about 10 to 18 C (50 to 60 F), is colder than the bay<br />
water in the summer, which is about 22 to 25 C (70<br />
to 74 F), discharging fresh groundwater can be<br />
identified from the thermal infrared response.<br />
Additionally, when fresh groundwater enters a<br />
saltwater body it will tend to float on top because <strong>of</strong><br />
its lighter density. This property enhances the ability<br />
<strong>of</strong> the thermal infrared method to detect the colder<br />
fresh groundwater. The discharge <strong>of</strong> coastal groundwater<br />
takes place most prolifically over a period <strong>of</strong><br />
about two hours during low tide. Since coastal<br />
groundwater discharge takes place in a highly nonuniform<br />
manner, this delineation <strong>of</strong> fresh groundwater<br />
discharge is important so that the most affected<br />
shoreline can be identified and the most efficient<br />
groundwater quality sampling locations can be<br />
determined.<br />
Thermal infrared surveys <strong>of</strong> Greenwich Bay and<br />
its coastal areas were accomplished in September<br />
1995 and again in August 1997. In order to optimize<br />
conditions for high-quality results, the flights were<br />
made in the early evening during low tide when<br />
temperature contrast was high, but direct solar<br />
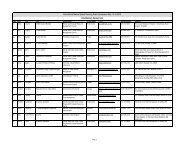
effects were negligible. Graphs showing conditions<br />
<strong>of</strong> tide and water temperature for the August 24,<br />
1997, survey are provided as Figure 2. The photo<br />
runs were made during the time period <strong>of</strong> 1900 to<br />
2100 hours, shortly after sunset, to minimize the<br />
2
Table 1. Estimated average annual groundwater discharge into Greenwich Bay from sub-basin<br />
Sub-basin Sub-basin Linear Groundwater Groundwater Stream<br />
Name Area Feet <strong>of</strong> Discharge Discharge Discharge<br />
(ft 2 ) Shoreline into Bay into Bay into Bay<br />
(lf) (ft 3 /day/lf) (ft 3 /day) (ft 3 /day)<br />
Apponaug (APG) 5,434,358 (SL) 2,606 7.14 18,607<br />
Arnold (ARD) 2,204,427 (SL) 6,054 1.25 7,568<br />
Baker (BKR) 9,512,274 (ST) 32,576<br />
Bayside (BYS) 19,234,952 (SL) 25,636 2.57 65,885<br />
Chepiwanoxet (CHX) 30,377,773 (SL) 23,557 4.42 104,122<br />
Cove Beach (CVB) 971,904 (SL) 5,290 0.63 3,333<br />
East Greenwich (EGN) 11,588,590 (SL) 7,370 5.38 39,651<br />
Goddard (GDD) 7,571,457 (SL) 19,161 1.35 25,867<br />
Hardig (HRD) 170,058,425 (ST) 582,392<br />
Lockwood (LKD) 5,506,024 (ST) 18,856<br />
Long (LNG) 4,927,101 (SL) 2,606 6.47 16,861<br />
Longmeadow (LMW) 9,483,510 (ST) 32,478<br />
Maskerchugg (MKG) 166,460,915 (ST) 570,072<br />
Nausauket (NKT) 3,157,196 (SL) 4,422 2.45 10,834<br />
North Brushneck (NBN) 2,653,048 (SL) 6,054 1.50 9,081<br />
North Buttonwoods (NBW) 7,543,626 (ST) 25,834<br />
Oakland (OKL) 13,507,254 (SL) 16,897 2.74 46,298<br />
Pottowomut (PTW) 12,758,790 (SL) 25,030 1.75 43,803<br />
South Brushneck (SBN) 426,248 (SL) 3,895 0.37 1,441<br />
South Buttonwoods (SBW) 10,022,151 (SL) 12,055 2.85 34,357<br />
Tuscatucket (TSK) 55,876,639 (ST) 191,358<br />
Warwick Neck North (WNN) 11,682,521 (SL) 19,516 2.05 40,008<br />
Warwick Neck South (WNS) 15,549,097 (SL) 16,239 3.28 53,264<br />
TOTALS 576,508,280 520,977 1,453,566<br />
Notes:<br />
1) In the column titled “Sub-basin Area,” SL indicates groundwater shoreline discharge, and ST indicates dry weather groundwater<br />
discharge into a stream that subsequently discharges into the bay.<br />
2) Groundwater discharges are estimated average daily values based on 15 inches <strong>of</strong> groundwater recharge per year.<br />
3) Where the sub-basin is contiguous to the shoreline, the linear feet <strong>of</strong> shoreline through which the groundwater discharges are<br />
indicated as well as the quantity per linear foot.<br />
4) Where the sub-basin groundwater discharges into a stream, the estimated single value <strong>of</strong> that discharge is indicated.<br />
5) As a first estimate, it is assumed that all residents get imported water supply at the rate <strong>of</strong> 170 liters per person per day and<br />
that, for unsewered houses, this water becomes groundwater recharge.<br />
6) As a first estimate, it is assumed that, because <strong>of</strong> large quantities <strong>of</strong> groundwater well pumping, there is no groundwater<br />
discharge into lower Greenwich Cove from the Hunt River Basin.<br />
effect <strong>of</strong> solar reflection. The fresh groundwater-bay<br />
water temperature contrast at that time was approximately<br />
14 F. The thermal infrared images show areas<br />
<strong>of</strong> major groundwater contribution in Warwick Cove,<br />
Brushneck Cove, Apponaug Cove, and Greenwich<br />
Cove.<br />
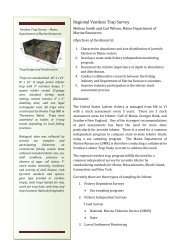
As an example, the results <strong>of</strong> the thermal infrared<br />
imagery for Brushneck Cove are presented as<br />
Figure 3. In this figure, the colder fresh groundwater<br />
is defined by the dark plumes emanating from the<br />
shoreline. The plumes are most evident along the<br />
west shore and the central part <strong>of</strong> the cove on the<br />
east shore.<br />
WATER BUDGET<br />
The detailed results <strong>of</strong> an annual water budget<br />
analysis <strong>of</strong> each <strong>of</strong> the Greenwich Bay sub-basins is<br />
shown in Table 1. It is to be noted that some subbasins<br />
discharge into streams, while others discharge<br />
directly into the bay or a cove along the shoreline.<br />
3
NITROGEN BUDGET<br />
A nitrogen budget for Greenwich Bay was developed<br />
for each sub-basin using the contribution input detailed in<br />
Table 2. The values include contributions from road and<br />
ro<strong>of</strong> run<strong>of</strong>f and lawn and atmospheric sources based on the<br />
“Cape Cod Model.” Nitrogen was evaluated as the nutrient <strong>of</strong><br />
primary interest because <strong>of</strong> its potential for contribution to<br />
eutrophication in shallow and poorly flushed coastal regions<br />
<strong>of</strong> the bay. The calculations are conservative, assuming that<br />
no loss or alternation <strong>of</strong> nitrogen takes place after the entry<br />
into the groundwater system. The on-site sewage disposal<br />
contributions are estimated based on unsewered areas defined<br />
by Warwick, R.I., area sewer maps and the number <strong>of</strong><br />
unsewered homes obtained from the U.S. Census Report <strong>of</strong><br />
1992. This information was integrated with the sub-basin<br />
delineation using the ARCINFO Geographic Information<br />
System (GIS).<br />
Figure 2. Tide level and water temperature<br />
conditions during the thermal infrared survey<br />
<strong>of</strong> August 24, 1997<br />
Where discharge is along the shoreline, it<br />
is quantified as discharge in cubic feet per<br />
day per linear foot <strong>of</strong> shoreline. Where<br />
the discharge is in the stream, which<br />
subsequently flows to the bay, the quantity<br />
is described as cubic feet per day into<br />
the bay.<br />
Based on area climatological data, the<br />
values assume an average annual groundwater<br />
discharge <strong>of</strong> 38 centimeters (15<br />
inches) over the watershed. In any case<br />
the quantity represents average daily dry<br />
weather discharge, and does not include<br />
additional contribution from storm<br />
surface run <strong>of</strong>f. Also, the values do not<br />
reflect seasonable variation, which does<br />
occur; for example, summer dry weather<br />
groundwater flow, when the water table is<br />
low, will be less than spring groundwater<br />
flow where the water table is higher<br />
(Milham and Howes, 1994).<br />
Figure 3. Thermal infrared image <strong>of</strong> Brushneck Cove taken<br />
August 24, 1997<br />
4
Table 2. Total estimated nitrogen loading for the Greenwich Bay watershed by sub-basin<br />
Unsewered Total<br />
Residences: Residences:<br />
Wastewater Lawn Atmospheric Road run<strong>of</strong>f Ro<strong>of</strong> run<strong>of</strong>f Total<br />
nitrogen nitrogen nitrogen nitrogen nitrogen nitrogen<br />
Sub-basin loading loading loading loading loading loading<br />
Name (g/day) (g/day) (g/day) (g/day) (g/day) (g/day)<br />
Apponaug 1,201 466 26 71 26 1,790<br />
Arnold 520 198 11 29 11 769<br />
Baker 8,407 1,040 46 125 58 9,676<br />
Bayside 15,430 2,509 93 252 141 18,425<br />
Chepiwanoxet 8,828 2,006 147 398 113 11,492<br />
Cove Beach 689 68 5 13 4 779<br />
East Greenwich 2,257 2,370 56 152 133 4,968<br />
Goddard 1,461 189 37 99 11 1,797<br />
Hardig 31,082 12,988 825 2,227 729 47,851<br />
Lockwood 5,294 697 27 72 39 6,129<br />
Long 4,192 499 24 65 28 4,808<br />
Longmeadow 5,715 639 46 124 36 6,560<br />
Maskerchugg 26,982 7,386 807 2,180 415 37,770<br />
Nausauket 2,586 294 15 41 17 2,953<br />
North Brushneck 1,805 184 13 35 10 2,047<br />
North Buttonwoods 5,370 557 37 99 31 6,094<br />
Oakland 15,484 2,337 66 177 131 18,195<br />
Pottowomut 2,547 336 62 167 19 3,131<br />
South Brushneck 2,968 306 2 6 17 3,299<br />
South Buttonwoods 5,822 742 49 131 42 6,786<br />
Tuscatucket 46,183 6,780 271 732 381 54,347<br />
Warwick Neck North 7,214 735 57 153 41 8,200<br />
Warwick Neck South 1,729 273 75 204 15 2,296<br />
Sub-basin Totals 203,766 43,599 2,796 7,548 2,448 260,157<br />
Note: Nitrogen loadings are based on the Cape Cod Commission Technical Bulletin 91-001 (Dec. 1991).<br />
The total estimated nitrogen loading from<br />
groundwater to Greenwich Bay is about 260 kilograms<br />
per day (kg/day) with about 65 to 75 percent<br />
<strong>of</strong> this originating from on-site sewage disposal<br />
systems. The three sub-basins contributing the<br />
largest loads <strong>of</strong> nitrogen are:<br />
1) Tuscatucket (54.3 kg/day) discharging into<br />
Brushneck Cove;<br />
2) Hardig (47.9 kg/day) discharging into<br />
Apponaug Cove; and<br />
3) Maskerchugg (37.8 kg/day) discharging into<br />
Greenwich Cove.<br />
CONCLUSIONS<br />
The contributions <strong>of</strong> groundwater and nitrogen<br />
loading are summarized in Table 2 by receiving<br />
water and the contributing sub-basins. The receiving<br />
water areas receiving the largest influx <strong>of</strong> nitrogen<br />
are Brushneck Cove and Apponaug Cove, with<br />
Greenwich Cove a close third in ranking. These are<br />
also the largest groundwater and dry weather stream<br />
flow contributors. The estimated nitrogen and<br />
groundwater discharge quantities were also prepared<br />
for use as data inputs to the Greenwich Bay receiving<br />
5
Table 3. Estimated nitrogen (N) loading into box model sections <strong>of</strong> Greenwich Bay and contiguous coves due<br />
to sewering project<br />
Present First-year Second-year Third-year<br />
total N total N total N total N<br />
Box Model Contributing loading loading loading loading<br />
Designation Sub-basins (g/day) (g/day) (g/day) (g/day)<br />
1 Bayside BYS * 32,816 18,791 13,181 4,766<br />
Longmeadow LMW<br />
Warwick Neck North WNN<br />
2 Oakland OKL * 84,029 48,090 33,714 12,150<br />
Tuscatucket TSK<br />
North Buttonwoods NBW<br />
North Brushneck NBN<br />
South Brushneck SBN<br />
Cove Beach CVB<br />
3 Long LNG 61,309 40,177 31,725 19,046<br />
Lockwood LKD<br />
Apponaug APG<br />
Arnold ARD *<br />
Hardig HDG<br />
4 Nausauket NKT * 8,679 5,303 3,952 1,926<br />
Arnold ARD *<br />
Chipiwanoxet CHX *<br />
5 Chipiwanoxet CHX * 48,209 31,448 24,743 14,686<br />
East Greenwich EGN<br />
Maskerchugg MKG<br />
Goddard GDD<br />
6 Potowomut PTW * 15,805 8,990 6,263 2,174<br />
Nausauket NKT *<br />
Baker BKR<br />
South Buttonwoods SBW *<br />
7 South Buttonwoods SBW * 15,855 9,236 6,589 2,617<br />
Potowomut PTW *<br />
Oakland OKL *<br />
Bayside BYS *<br />
Warwick Neck South WNS<br />
Total 266,702 162,035 120,167 57,365<br />
*Indicates a percentage <strong>of</strong> area in more than one box.<br />
6
water model. This input is summarized for segments<br />
<strong>of</strong> Greenwich Bay identified as “box model” areas,<br />
delineated in Figure 1.<br />
The estimated loadings to Greenwich Bay were<br />
also evaluated using future area sewering scenarios<br />
for full sewer buildout. Based on information from<br />
the Warwick City Planning Department, it is envisioned<br />
that at the end <strong>of</strong> the first year after sewering<br />
begins, 50 percent <strong>of</strong> the households will be hooked<br />
up; at the end <strong>of</strong> the second year, 70 percent; and at<br />
the end <strong>of</strong> the third year, 100 percent. Using this<br />
concept, estimated future loadings to the bay were<br />
calculated and are summarized in Table 3 on the<br />
previous page. The results are also shown graphically<br />
in Figure 4 below. As indicated, full sewering<br />
would result in a major reduction <strong>of</strong> approximately<br />
72 percent <strong>of</strong> the nitrogen input to the bay from<br />
groundwater sources.<br />
It is evident from inspection <strong>of</strong> Figure 3 that the<br />
discharge <strong>of</strong> fresh groundwater is highly irregular<br />
along the shoreline, but occurs in very discrete<br />
plumes, and even then, occurs only during low tide<br />
periods. Direct shoreline sampling for salinity and<br />
nitrogen levels during low tide in the zones <strong>of</strong><br />
significant shoreline discharge provided direct<br />
confirmation <strong>of</strong> these plumes and <strong>of</strong> high levels <strong>of</strong><br />
nitrogen entering the bay. An example <strong>of</strong> the results<br />
is shown in Figure 5 (page 8) for a fresh groundwater<br />
plume discharging along the shoreline <strong>of</strong> Oakland<br />
Beach in the Brushneck Cove area, located as shown<br />
in Figure 3 (labeled “Beach Survey Site A”). Figure 5<br />
shows a pr<strong>of</strong>ile <strong>of</strong> salinity and nitrogen concentrations<br />
in groundwater flowing through the beach at<br />
low tide. Concentrations <strong>of</strong> nitrogen average about<br />
6 mg/l, but go up as high as 12 mg/l, more than<br />
enough to cause serious problems from eutrophication<br />
in poorly flushed<br />
regions <strong>of</strong> the bay. It is<br />
also apparent that there is<br />
a direct correlation<br />
between the freshness <strong>of</strong><br />
the discharge and the<br />
nitrogen content, indicating<br />
that the primary<br />
source <strong>of</strong> the nitrogen is<br />
the fresh groundwater.<br />
Figure 4. Estimated future nitrogen loads to Greenwich Bay from<br />
groundwater based on planned sewering<br />
ACKNOWLEDGMENTS<br />
The primary support for<br />
this work has been<br />
provided by the city <strong>of</strong><br />
Warwick and by the<br />
<strong>Rhode</strong> <strong>Island</strong> <strong>Sea</strong> <strong>Grant</strong><br />
Program, with additional<br />
graduate student support<br />
by the U.S. Department <strong>of</strong><br />
Defense. The cooperation<br />
<strong>of</strong> the various departments<br />
<strong>of</strong> the city <strong>of</strong> Warwick and<br />
<strong>of</strong> the many private<br />
individuals who provided<br />
information is also greatly<br />
appreciated.<br />
7
20<br />
18<br />
20<br />
18<br />
Figure 5. Salinity-nitrogen<br />
pr<strong>of</strong>ile for discharging groundwater<br />
along the Oakland Beach<br />
shoreline<br />
16<br />
16<br />
14<br />
Oakland Beach/Brushneck Cove<br />
Samples Taken: May 21, 1998<br />
14<br />
NO3-N<br />
Salinity<br />
NO3-N Concentration (mg/L)<br />
12<br />
10<br />
8<br />
12<br />
10<br />
8<br />
Salinity (ppt)<br />
6<br />
6<br />
4<br />
2<br />
N<br />
O<br />
S<br />
A<br />
M<br />
P<br />
L<br />
E<br />
4<br />
2<br />
0<br />
0 10 30 40 45 50 55 60 65 70 75 80 85 90 95 100 105 110 115 120 125 130 135 140 145 150 155 160 165 170<br />
Distance (ft)<br />
0<br />
REFERENCES CITED<br />
Banks, W.S.L., R.L. Paylor, and W.B. Hughes. 1996.<br />
Using thermal infrared imagery to delineate<br />
groundwater discharge. Ground Water<br />
34(3):434–443.<br />
Cambareri, T.C. and E.M. Eichner. 1998. Watershed<br />
delineation and groundwater discharge to a<br />
coastal embayment. Ground Water<br />
36(4):626–634.<br />
Canter, L.W. and R.C. Knox. 1985. Septic Tank<br />
System Effects on Groundwater Quality.<br />
Lewis Publishers, Inc., pp. 75–79.<br />
Giblin, A.E. and A.G. Gaines. 1990. Nitrogen inputs<br />
to a marine embayment: The importance <strong>of</strong><br />
groundwater. Biogeochemistry 10:217–328.<br />
Milham, N.P. and B.L. Howes. 1994. Freshwater<br />
flow into a coastal environment: Ground<br />
water and surface water inputs. Limnol.<br />
Oceanogr. 39(8):1928–1944.<br />
Nixon, S.W. 1995. Coastal marine eutrophication: A<br />
definition, social causes and future concerns.<br />
Ophelia 41:199–220.<br />
Richardson, K. and B.B. Jorgensen. 1996. Eutrophication:<br />
Definition, history and effects.<br />
Eutrophication in Coastal Marine Ecosystems,<br />
Coastal and Marine Studies. 52:1–19.<br />
Ryther, J.H. and W.M. Dunstan. 1971. Nitrogen,<br />
phosphorus and eutrophication in the coastal<br />
marine environment. Science 171:1008–<br />
1013.<br />
Valiela, I., G. Collins, L. Kremer, K. Lajtha, M.<br />
Geist, B. Seely, J. Brawley, and C.H. Sham.<br />
1997. Nitrogen loading from coastal watersheds<br />
to receiving estuaries: New method<br />
and application. Ecological Applications<br />
7(2):358–380.<br />
8