Expression of Interest Brief - Public Transport Victoria
Expression of Interest Brief - Public Transport Victoria
Expression of Interest Brief - Public Transport Victoria

You also want an ePaper? Increase the reach of your titles
YUMPU automatically turns print PDFs into web optimized ePapers that Google loves.
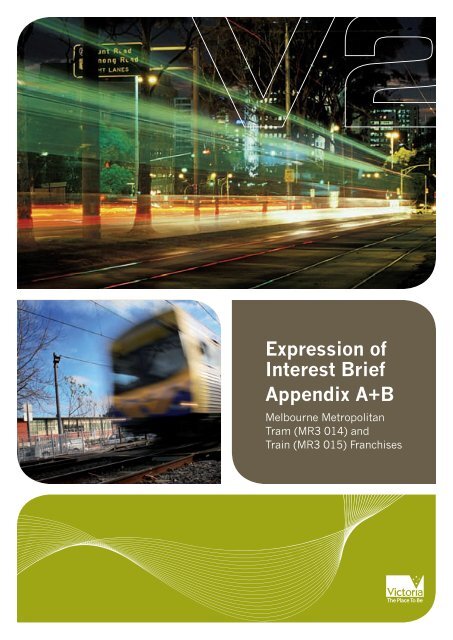
<strong>Expression</strong> <strong>of</strong><br />
<strong>Interest</strong> <strong>Brief</strong><br />
Appendix A+B<br />
Melbourne Metropolitan<br />
Tram (MR3 014) and<br />
Train (MR3 015) Franchises
Important Notice<br />
The Department <strong>of</strong> <strong>Transport</strong> (‘DOT’) has prepared this Appendix A and B to provide<br />
further background information to Recipients. Recipients should read the Appendices<br />
in conjunction with the EOI <strong>Brief</strong> and should review the terms and conditions set out in<br />
the EOI <strong>Brief</strong>.<br />
Whilst DOT has taken care in the preparation <strong>of</strong> the Appendices and the information<br />
contained in them, neither the State nor the State’s Associates gives any warranty or<br />
makes any representations, expressed or implied, as to the completeness or<br />
accuracy <strong>of</strong> the information contained in the Appendices. The Recipient should make<br />
its own independent enquiries regarding the information contained in the Appendices.
Contents<br />
Important Notice 2<br />
Glossary 4<br />
Appendix A – Melbourne and its <strong>Public</strong> <strong>Transport</strong> Network 6<br />
1 Introduction to <strong>Victoria</strong> and Melbourne 7<br />
1.1 Overview <strong>of</strong> the State <strong>of</strong> <strong>Victoria</strong> 7<br />
1.2 Growth <strong>of</strong> Melbourne 15<br />
1.3 Levels <strong>of</strong> Government 20<br />
1.4 Regulatory Environment 21<br />
2 <strong>Public</strong> <strong>Transport</strong> in <strong>Victoria</strong> 28<br />
2.1 History <strong>of</strong> Franchising in Melbourne 28<br />
2.2 <strong>Victoria</strong>’s Rail Safety Arrangements 31<br />
2.3 <strong>Public</strong> <strong>Transport</strong> Strategic Planning 34<br />
2.4 Metropolitan Trams Overview 39<br />
2.5 Metropolitan Trains Overview 42<br />
2.6 Melbourne <strong>Public</strong> <strong>Transport</strong> Fares and Ticketing 45<br />
2.7 Patronage 51<br />
2.8 Revenue 56<br />
2.9 Performance 59<br />
2.10 Strategies to Improve Performance 62<br />
2.11 Rolling Stock Procurement 65<br />
2.12 <strong>Public</strong> <strong>Transport</strong> Infrastructure 68<br />
Attachment 1: Key Facts and Figures 74<br />
Appendix B – Statutory and Contractual Framework 79<br />
3 Statutory Framework 80<br />
3.1 <strong>Transport</strong> Act 80<br />
3.2 Rail Corporations Act 82<br />
3.3 Rail Safety Act 84<br />
3.4 <strong>Transport</strong> Legislation Review 84<br />
4 Contractual Framework 85<br />
4.1 Franchise Arrangements 85<br />
4.2 Transaction Documents 87<br />
4.3 Direct Agreements 89<br />
4.4 Interoperator Agreements 90<br />
4.5 Third Party Agreements 90<br />
4.6 Metlink & TTA Agreements 90<br />
4.7 <strong>Public</strong> <strong>Transport</strong> Ombudsman (‘PTO’) 92<br />
Endnotes 93
Glossary<br />
The following terms have been used within this document and singular includes the plural and conversely,<br />
if a word or phrase is defined its other grammatical forms have a corresponding meaning.<br />
Term<br />
Meaning<br />
Confidentiality Deed<br />
Current Franchisees<br />
The confidentiality deed, executed by the Recipient prior to receiving this EOI <strong>Brief</strong><br />
Metrolink <strong>Victoria</strong> Pty Ltd (known as Yarra Trams) for the tram Franchise and<br />
Connex Melbourne Pty Ltd (known as Connex) for the train Franchise<br />
DOI Department <strong>of</strong> Infrastructure – renamed Department <strong>of</strong> <strong>Transport</strong> from 30 th April 2008<br />
DOT<br />
EOI <strong>Brief</strong><br />
EOI Process<br />
EOI Response<br />
Franchise Agreement<br />
Franchisee<br />
Franchises<br />
Government Information<br />
Infrastructure Lease<br />
ITT Documentation<br />
Department <strong>of</strong> <strong>Transport</strong> – formerly known as Department<br />
<strong>of</strong> Infrastructure up to 30 th April 2008<br />
This brief inviting EOI Responses, including Appendices, Schedules and Attachments<br />
The process from the advertisement seeking expressions <strong>of</strong> interest<br />
to the announcement <strong>of</strong> the Shortlist <strong>of</strong> Respondents<br />
The expression <strong>of</strong> interest in the relevant Franchise submitted by a<br />
Respondent in accordance with the requirements <strong>of</strong> this EOI <strong>Brief</strong><br />
The document described in Section 4.2 <strong>of</strong> Appendix B<br />
The party responsible for operating a Franchise<br />
Contracts with the State for operation <strong>of</strong> the tram and train networks which involves<br />
passenger service delivery, infrastructure maintenance, and rolling stock maintenance<br />
Information contained in this EOI <strong>Brief</strong> or any information which may<br />
be provided in association with it, including estimates, predictions<br />
or the assumptions upon which they may be based<br />
The document described in Section 4.2 <strong>of</strong> Appendix B<br />
The documentation for each <strong>of</strong> the new Franchises issued<br />
to Shortlisted Respondents which will include:<br />
general information and instructions;<br />
operational and technical specifications;<br />
a commercial framework summary;<br />
an information memorandum;<br />
the evaluation criteria and response schedules;<br />
due diligence information; and<br />
the draft Transaction Documents<br />
4<br />
Commercial in Confidence <strong>Expression</strong> <strong>of</strong> <strong>Interest</strong> <strong>Brief</strong>
Term<br />
Meaning<br />
ITT Process<br />
ITT Response<br />
The process from release <strong>of</strong> the ITT Documentation to Shortlisted Respondents,<br />
up to execution <strong>of</strong> the Transaction Documents for the relevant Franchise<br />
The document submitted in response to the ITT Documentation, being<br />
a fully priced binding <strong>of</strong>fer to undertake the relevant Franchise<br />
Personal Information As defined under the Privacy Act 1988<br />
Project<br />
Recipient<br />
Related Party<br />
Respondent<br />
Respondent’s Associates<br />
Shortlist<br />
Shortlisted Respondents<br />
State<br />
State’s Associates<br />
Transaction Documents<br />
Transaction Process<br />
Melbourne’s metropolitan rail franchising (‘MR3’) project, being the<br />
competitive re-tendering <strong>of</strong> Melbourne’s train and tram franchises<br />
Any person who receives a copy <strong>of</strong> this EOI <strong>Brief</strong> having executed<br />
and returned to the State the Confidentiality Deed<br />
Has the meaning given to the expression ‘related entity’ by section 9 and<br />
the meaning given to the expression ‘related body corporate’ by section<br />
50 <strong>of</strong> the Corporations Act 2001 and includes any Associate (as defined<br />
by sections 10 to 17 <strong>of</strong> the Corporations Act 2001) <strong>of</strong> a person<br />
Any party or parties that respond to this EOI <strong>Brief</strong> in<br />
accordance with the requirements <strong>of</strong> this document<br />
A Respondent, its consortium members (if applicable), its Related Parties<br />
and its respective <strong>of</strong>ficers, employees, agents and advisers<br />
The list <strong>of</strong> those Respondents who will be invited to submit<br />
an ITT Response for a particular Franchise<br />
Those Respondents that are invited by the State to submit<br />
an ITT Response for a particular Franchise<br />
The State <strong>of</strong> <strong>Victoria</strong><br />
A department, agency or regulatory authority <strong>of</strong> the State or an <strong>of</strong>ficer,<br />
employee, agent, contractor, adviser or consultant <strong>of</strong> any <strong>of</strong> them<br />
The contractual documents for the new Franchises to be entered into by the Franchisees<br />
The process from the commencement <strong>of</strong> this EOI Process to the execution <strong>of</strong> the<br />
Transaction Documents and transition to the commencement <strong>of</strong> the new Franchises<br />
5
Appendix A –<br />
Melbourne and its<br />
<strong>Public</strong> <strong>Transport</strong> Network
Introduction to <strong>Victoria</strong> and Melbourne<br />
1.1 Overview <strong>of</strong> the<br />
State <strong>of</strong> <strong>Victoria</strong><br />
1.1.1 Geography and Climate<br />
Covering an area <strong>of</strong> approximately<br />
227,600 square kilometres, roughly<br />
the same size as the British Isles,<br />
<strong>Victoria</strong> makes up three percent<br />
<strong>of</strong> Australia’s land mass.<br />
With a population <strong>of</strong> 5.2 million people 1 ,<br />
<strong>Victoria</strong> is Australia’s second most<br />
populous state, representing almost<br />
25 percent <strong>of</strong> the national population.<br />
This makes <strong>Victoria</strong> the most densely<br />
populated state in Australia.<br />
<strong>Victoria</strong>’s capital, Melbourne, is<br />
located in the south <strong>of</strong> the state<br />
on Port Philip Bay. Covering a<br />
metropolitan area <strong>of</strong> approximately<br />
8,800 square kilometres, Melbourne<br />
is home to 73 percent <strong>of</strong> <strong>Victoria</strong>ns<br />
with a population <strong>of</strong> 3.6million 2 .<br />
The largest city outside <strong>of</strong> Melbourne<br />
is Geelong, located only 75 kilometres<br />
away. Geelong has a municipality<br />
population <strong>of</strong> approximately 208,000 3<br />
people. Other leading urban centres<br />
in <strong>Victoria</strong> include Ballarat, Bendigo,<br />
Shepparton, Mildura, Warrnambool<br />
and the Latrobe Valley.<br />
Despite its small size, the <strong>Victoria</strong>n<br />
climate varies across the state. The<br />
north has much drier and warmer<br />
weather than the south. Melbourne’s<br />
temperate climate can be characterised<br />
as warm to hot in summer (December<br />
to February), mild in autumn (March<br />
to May), cold and damp in winter<br />
(June to August), and cool in spring<br />
(September to November).<br />
The annual average rainfall for<br />
Melbourne is around 654mm 4 .<br />
<strong>Victoria</strong> is currently experiencing<br />
a drought, with no periods <strong>of</strong><br />
sustained above-average rainfall in<br />
most <strong>of</strong> the region 5 since 2001.<br />
7
Table 1: Melbourne’s Average Daily Temperatures and Monthly Rainfall*<br />
JAN FEB MAR APR MAY JUN JUL AUG SEP OCT NOV DEC Annual<br />
Average daily maximum temperature (°Celsius)<br />
25.8 26.5 24.0 20.5 17.3 14.4 13.9 15.3 17.3 19.7 21.8 24.2 20.1<br />
Average daily minimum temperature (°Celsius)<br />
15.4 15.8 14.3 11.7 9.8 7.6 6.8 7.6 9.0 10.5 12.2 13.9 11.2<br />
Average monthly rainfall (mm)<br />
52.4 49.0 40.0 52.1 58.8 48.6 45.1 54.6 59.2 69.5 64.2 61.1 654.4<br />
* Averages are for the period (1971–2000). Source: Australian Bureau <strong>of</strong> Meteorology – ABS 2007 Australia Yearbook.<br />
1.1.2 General economic Data<br />
Australia is one <strong>of</strong> the most politically<br />
and economically stable nations in the<br />
Asia-Pacific. Now in its sixteenth year<br />
<strong>of</strong> consecutive growth, the Australian<br />
economy has enjoyed an average growth<br />
rate <strong>of</strong> 3.25 percent since 1990, with<br />
CPI inflation averaging 2.5 percent since<br />
1993 6 . Australia’s Gross Domestic<br />
Product (GDP) was US$756.4billion<br />
in 2006, with an increase <strong>of</strong><br />
4.4 percent forecast in 2007 to<br />
US$789.7billion 7 . With a GDP per capita<br />
<strong>of</strong> US$36,274 in 2006 8 , the quality<br />
<strong>of</strong> life in Australia has been judged<br />
the best in the Asia Pacific region.<br />
<strong>Victoria</strong> has one <strong>of</strong> the strongest and<br />
most resilient economies in the world.<br />
While <strong>Victoria</strong> occupies only three<br />
percent <strong>of</strong> Australia’s total landmass, it<br />
accounts for 25 percent <strong>of</strong> the nation’s<br />
economy 9 . The State has enjoyed an<br />
average growth rate <strong>of</strong> 3.6 percent over<br />
the 10 years to 2005/06, with a further<br />
3.75 percent forecast for 2007/08 10 .<br />
<strong>Victoria</strong>’s productive capacity continues<br />
to expand, with business investment<br />
growth averaging 10 percent per<br />
year for the past six years and record<br />
building approvals, indicating ongoing<br />
growth in building activity 11 .<br />
<strong>Victoria</strong>’s triple-A credit rating was<br />
reaffirmed by international credit rating<br />
agencies Moody’s Investor Services<br />
in January 2007 and by Standard<br />
& Poor’s in September 2007. Both<br />
agencies cited <strong>Victoria</strong>’s strong fiscal<br />
position, lower debt and prudent<br />
financial management as key factors<br />
behind the triple-A credit rating.<br />
8<br />
Commercial in Confidence <strong>Expression</strong> <strong>of</strong> <strong>Interest</strong> <strong>Brief</strong>
Table 2: Key Economic Indicators at a Glance 12<br />
Measure Unit Date Australia <strong>Victoria</strong> <strong>Victoria</strong>’s Share<br />
GDP/GSP* AUD Bil 2005/06 922.0 228.0 24.8%<br />
GDP/GSP growth % 2005/06 2.8 2.7<br />
GDP/GSP per capita AUD 2005/06 45,021 45,135<br />
Population Mil Dec 06 20.9 5.2 24.8%<br />
Employment Mil Jul 07 10.5 2.6 24.8%<br />
Labour Force Mil Jul 07 11.0 2.7 24.9%<br />
Unemployment rate % Jul 07 4.3 4.4<br />
Participation Rate % Jul 07 65.0 64.8<br />
Inflation rate (CPI) % 2006/07 2.1 2.0<br />
Exports (goods) AUD Bil 2006/07 168.2 20.3 12.1%<br />
Business R&D AUD Bil 2005/06 10.1 3.0 29.3%<br />
* GSP - Gross State Product.<br />
<strong>Victoria</strong>’s economy is built on a<br />
tradition <strong>of</strong> exporting. In 2006/07,<br />
<strong>Victoria</strong>n exports totalled<br />
approximately AUD$20.3 billion<br />
and included agricultural produce,<br />
manufacturing, resources and the<br />
rapidly growing services sector 13 .<br />
<strong>Victoria</strong> represents almost onethird<br />
<strong>of</strong> the national manufacturing<br />
output and is leading the way in<br />
developing new industries. The state<br />
is responsible for almost 60 percent<br />
<strong>of</strong> Australia’s automotive turnover,<br />
including significant exports 14 .<br />
Melbourne has one <strong>of</strong> the highest<br />
standards <strong>of</strong> living in the world and<br />
is continually ranked as one <strong>of</strong> the<br />
‘World’s Most Liveable Cities’ by the<br />
‘Economist Intelligence Unit’ (EIU) 15 .<br />
It is home to many <strong>of</strong> Australia’s<br />
leading companies such as BHP-<br />
Billiton, National Australia Bank, ANZ<br />
Bank, Toll Holdings, Foster’s Brewing,<br />
and Orica. <strong>Victoria</strong> is also a base for<br />
international companies such as Hewlett<br />
Packard, IBM, Toyota and Bosch.<br />
1.1.3 <strong>Transport</strong> Infrastructure<br />
<strong>Victoria</strong> has an extensive transport<br />
network, which incorporates<br />
road, rail, air and sea transport to<br />
move people and freight locally,<br />
domestically and internationally.<br />
With more than 200,000 kilometres<br />
<strong>of</strong> road, <strong>Victoria</strong>’s roads carry more<br />
than 30 billion tonne-kilometres <strong>of</strong><br />
freight and 50 billion vehicle kilometres<br />
<strong>of</strong> travel each year. Almost all goods<br />
within the metropolitan area and more<br />
than 80 percent <strong>of</strong> goods in regional<br />
<strong>Victoria</strong> are carried by road 16 .<br />
Regional <strong>Victoria</strong> is linked to Melbourne<br />
by an extensive passenger and freight<br />
rail network. The publicly owned V/<br />
Line has responsibility for the operation<br />
and maintenance <strong>of</strong> 4,100 kilometres<br />
<strong>of</strong> broad and standard gauge rail track<br />
used by the passenger rail services<br />
it operates, as well as for freight<br />
services operated primarily by the<br />
privately owned Pacific National 17 .<br />
9
Only 16 percent <strong>of</strong> regional freight<br />
(export grain and containers) is currently<br />
transported on rail; with the State<br />
targeting significant growth <strong>of</strong> freight to<br />
ports on rail by 2010 18 . This policy will<br />
accommodate future growth and reduce<br />
congestion on Melbourne’s roads.<br />
Intra and inter city bus services<br />
also operate within regional <strong>Victoria</strong><br />
to support and supplement the<br />
regional passenger rail network.<br />
Within Melbourne travel by car currently<br />
accounts for 91 percent <strong>of</strong> all motorised<br />
travel (i.e. excluding people travelling in<br />
freight vehicles, walking and cycling) 19 .<br />
High car usage has led to a considerable<br />
congestion problem estimated to cost<br />
the state something in the range <strong>of</strong><br />
AUD$1.3-$2.6 billion per annum 20 . To<br />
accommodate Melbournians’ car usage,<br />
there are more than 70,000 car parking<br />
spaces available within Melbourne<br />
City 21 , with 48,000 <strong>of</strong> these spaces<br />
estimated to be permanent or long stay<br />
car spaces leased to private companies<br />
and individuals 22 . A levy was introduced<br />
on these permanent car spaces by<br />
the State in 2005, to encourage<br />
commuters who frequently drive to the<br />
city and park all day to consider other<br />
options, such as public transport 23 .<br />
Melbourne’s road network is supported<br />
by an extensive public transport network<br />
incorporating 15 train routes, 28 tram<br />
routes and over 300 metropolitan<br />
bus routes. Approximately 84 percent<br />
<strong>of</strong> Melbourne’s population is within<br />
400 metres <strong>of</strong> a bus route compared<br />
with 15 percent within 400 metres <strong>of</strong><br />
a tram route and 23 percent within<br />
800 metres <strong>of</strong> a train station 24 .<br />
The State is actively encouraging a<br />
shift to public transport, targeting an<br />
increase in public transport usage from<br />
9 percent to 20 percent <strong>of</strong> all motorised<br />
trips by 2020. To support this, the State<br />
is investing in a number <strong>of</strong> projects<br />
to encourage public transport use.<br />
Melbourne Airport, situated less than 40<br />
minutes drive from central Melbourne, is<br />
Australia’s largest 24 hour curfew free<br />
passenger and freight airport, handling<br />
over 350,000 tonnes <strong>of</strong> air freight each<br />
year 26 . On average, 465 international<br />
flights and 2,786 domestic flights<br />
arrive at Melbourne Airport each week,<br />
bringing over 4.5 million international<br />
and nearly 18 million domestic<br />
passengers to Melbourne every year.<br />
Like the airport, the Port <strong>of</strong> Melbourne<br />
never closes. Situated just two<br />
kilometres from the Central Business<br />
District (‘CBD’) it is Australia’s largest<br />
and busiest port, handling almost 40<br />
percent <strong>of</strong> Australia’s container trade.<br />
It handles AUD$70 billion in trade<br />
and contributes AUD$5.4 billion to<br />
the <strong>Victoria</strong>n economy each year 27 .<br />
The Port <strong>of</strong> Melbourne has recently<br />
commenced dredging for the Port<br />
Phillip Bay channel deepening project,<br />
a project which the Australian Council<br />
for Infrastructure Development has<br />
rated as the nation’s most valuable<br />
infrastructure project, forecasting<br />
that it could add AUD$14.8 billion<br />
to Australia’s GDP by 2030 28 . This<br />
project commenced in early 2008 29 .<br />
10<br />
Commercial in Confidence <strong>Expression</strong> <strong>of</strong> <strong>Interest</strong> <strong>Brief</strong>
1.1.4 Technology<br />
<strong>Victoria</strong> is an innovative hub for worldclass<br />
science and technology. The<br />
State is committed to sustained growth<br />
having invested AUD$1.8 billion into<br />
science, technology and innovation<br />
since 1999. <strong>Victoria</strong> is at the centre <strong>of</strong><br />
Australia’s Information Communications<br />
Technology (ICT) industry. Globally<br />
competitive in a number <strong>of</strong> areas<br />
including: telecommunications;<br />
electronic games; web applications<br />
s<strong>of</strong>tware; niche s<strong>of</strong>tware and services.<br />
<strong>Victoria</strong> is home to one <strong>of</strong> the largest<br />
research and development clusters<br />
in the Southern Hemisphere 32 .<br />
More generally, Australians have<br />
some <strong>of</strong> the highest rates <strong>of</strong> internet<br />
access with over 74 percent <strong>of</strong> the<br />
population accessing the internet 30<br />
and 65 percent <strong>of</strong> households with<br />
internet access. Australia is rated<br />
third behind Sweden and the US for<br />
home internet access. Mobile phone<br />
uptake has also been rapid, with over<br />
80 percent <strong>of</strong> persons aged 16 years<br />
and over with a mobile phone 31 .<br />
1.1.5 Financial Services<br />
Australia’s banking sector enjoys an<br />
international reputation for excellence<br />
in financial market regulation and<br />
supervision, with the 2006/07 Global<br />
Competitiveness Report ranking the<br />
soundness <strong>of</strong> Australia’s banking<br />
sector eighth in the world, out <strong>of</strong><br />
125 countries 33 . Many <strong>of</strong> Australia’s<br />
financial services industry providers<br />
have headquarters in Melbourne, as well<br />
as many international merchant banks<br />
and financial services companies 34 .<br />
1.1.6 Education<br />
Australians are among the most highly<br />
educated in the world. Over a third <strong>of</strong><br />
the workforce has tertiary qualifications<br />
and around three million people are<br />
fluent in a second language. The close<br />
working relationship between the<br />
education sector and industry ensures<br />
training demands are met; and has<br />
resulted in Australia’s education system<br />
being ranked in the top four countries<br />
worldwide in terms <strong>of</strong> meeting the<br />
needs <strong>of</strong> a competitive economy (World<br />
Competitiveness Yearbook 2005) 35 .<br />
<strong>Victoria</strong> has the highest rate <strong>of</strong> university<br />
attendance and graduations in the Asia<br />
Pacific Region 37 . Within <strong>Victoria</strong> there<br />
are nine universities and a number <strong>of</strong><br />
accredited private higher education<br />
providers, with campuses located in<br />
Melbourne and regional <strong>Victoria</strong>. More<br />
than 51,000 international students<br />
were enrolled at <strong>Victoria</strong>n universities<br />
in 2005, equating to one in every five<br />
students 38 . There are approximately<br />
280,000 students enrolled in primary<br />
schools in Melbourne and 235,000<br />
enrolled in secondary schools 39 .<br />
1.1.7 Employment<br />
Employment growth has been strong<br />
in <strong>Victoria</strong>, with the participation<br />
rate <strong>of</strong> 65 percent in 2007 close to<br />
record highs 40 and an unemployment<br />
rate <strong>of</strong> 4.5 percent, the lowest level<br />
since 1990, with only 124,400<br />
unemployed 41 in <strong>Victoria</strong>.<br />
11
Figure 1: <strong>Victoria</strong>’s Unemployment and Participation<br />
42 43<br />
Rates 1990 – 2007, respectively<br />
12.5<br />
Percentage (%)<br />
10.0<br />
7.5<br />
5.0<br />
2.5<br />
0.0<br />
1990 1995<br />
Year<br />
2000 2005<br />
66<br />
65<br />
Percentage (%)<br />
64<br />
63<br />
62<br />
61<br />
1990 1995<br />
Year<br />
2000 2005<br />
Figure 2: Employment Growth in <strong>Victoria</strong>, Illustrating the Proportion<br />
42 43<br />
<strong>of</strong> those Employed Full-Time and Part-Time, 1990 – 2007<br />
3000<br />
2500<br />
Thousands (000)<br />
2000<br />
1500<br />
1000<br />
Part-time<br />
Full-time<br />
500<br />
0<br />
1990<br />
1995 2000<br />
2005<br />
Year<br />
12<br />
Commercial in Confidence <strong>Expression</strong> <strong>of</strong> <strong>Interest</strong> <strong>Brief</strong>
The main driver <strong>of</strong> the increased<br />
participation rate is the growing number<br />
<strong>of</strong> women joining the workforce. Parttime<br />
employment is a particular feature<br />
<strong>of</strong> Australian women’s involvement<br />
in the workforce. The proportion <strong>of</strong><br />
people working part-time to full-time<br />
has increased over the last 17 years<br />
from 21 percent in 1990 to almost<br />
30 percent in 2007. This reflects<br />
the increased flexibility available to<br />
both men and women who choose<br />
to work part-time for many reasons<br />
including, seeking work-life balance,<br />
spending more time caring for family,<br />
studying or easing into retirement.<br />
Within Melbourne CBD total employment<br />
has increased by 18 percent in the six<br />
years to 2006, with the greatest growth<br />
occurring between 2004 and 2006 44 .<br />
It is anticipated that employment<br />
in the CBD will continue to grow by<br />
approximately one percent per year for<br />
the next five to ten years with strong<br />
growth expected in the knowledge-based<br />
industries and business services 45 .<br />
The Most Liveable City<br />
Globally recognised as one <strong>of</strong> the<br />
top cities in the world, Melbourne<br />
was rated the second best city in<br />
the world to live by the Economics<br />
Intelligence Unit (Economist Magazine)<br />
in 2007. Rated second to Vancouver<br />
out <strong>of</strong> 132 cities, Melbourne was<br />
considered to have low crime rates,<br />
little threat from instability or terrorism<br />
and highly developed transport and<br />
communications infrastructure 49 .<br />
Melbourne <strong>of</strong>fers an attractive<br />
lifestyle, with a sophisticated arts<br />
scene, great shopping, a passion for<br />
eating and drinking, extensive parks<br />
and gardens 46 , spacious suburbs,<br />
good education, integrated public<br />
transport and a modern road system 47 .<br />
Melbourne is a fun, safe and healthy<br />
environment in which to live and work.<br />
A multilingual and multicultural<br />
city, Melbourne’s open and tolerant<br />
culture supports a high quality <strong>of</strong> life<br />
for those who choose to live, work,<br />
study or visit here 50 . Melbourne’s<br />
residents come from over 233 different<br />
nations, with over 35 percent <strong>of</strong> the<br />
population born overseas 51 and over<br />
30 percent speaking a language<br />
other than English at home 52 . Within<br />
Melbourne there are more than<br />
100 religious faiths practiced 53 .<br />
Melbourne is <strong>Victoria</strong>’s primary tourist<br />
destination, attracting more than<br />
6.6 million visitors each year, which<br />
generates more than AUD$3.8 billion<br />
for Melbourne’s economy 48 . Melbourne<br />
also has one <strong>of</strong> the finest collections<br />
<strong>of</strong> parks and gardens <strong>of</strong> any city<br />
in the world with many <strong>of</strong> the best<br />
gardens within easy walking distance<br />
<strong>of</strong> the Central Business District 54 .<br />
Melbourne acts as the gateway to<br />
many <strong>of</strong> <strong>Victoria</strong>’s tourist attractions.<br />
13
1.1.8 Melbourne’s Major Events<br />
Melbourne hosts a range <strong>of</strong> attractions<br />
and major events throughout the<br />
year. <strong>Public</strong> transport plays a key<br />
role in transporting people to and<br />
from many <strong>of</strong> these events. The<br />
major events that regularly occur<br />
each year are listed below.<br />
Major Sporting Events<br />
• Australian Open Tennis – Melbourne<br />
hosts the grand slam for the Asia/<br />
Pacific region each January. Held<br />
on the fringe <strong>of</strong> Melbourne City,<br />
the Australian Open attracted<br />
more than 600,000 attendees<br />
over 14 days in 2008 57 ;<br />
• Australian Formula One Grand Prix<br />
– held each March at Albert Park<br />
Lake, in excess <strong>of</strong> 300,000 people<br />
attend the three day event 58 ;<br />
• Australian Rules Football (AFL)<br />
– the season is played over 22<br />
weeks, plus finals, from April to<br />
September, with approximately<br />
100 games <strong>of</strong> AFL played in<br />
Melbourne at one <strong>of</strong> two central<br />
locations, attracting approximately<br />
4.2 million people in 2007 59 ;<br />
• Melbourne Cup Carnival –<br />
Melbourne’s horse racing carnival,<br />
the feature <strong>of</strong> the Spring Racing<br />
Carnival, occurs every October/<br />
November over four days at<br />
Flemington racecourse. Attracting<br />
almost 400,000 people in 2007, the<br />
event is heavily dependent on public<br />
transport for transporting people<br />
to and from the racecourse 60 ; and<br />
• International Series Cricket –<br />
Melbourne hosts the Boxing Day test<br />
match every year at the Melbourne<br />
Cricket Ground. Located on the city<br />
fringe, the 2007 test series attracted<br />
166,000 people over four days 61 .<br />
Other Major Events<br />
• Melbourne International Comedy<br />
Festival – held over three weeks<br />
every March/April within the<br />
Melbourne CBD, the festival attracted<br />
approximately 483,000 people<br />
to over 4,100 events in 2007 62 ;<br />
• Melbourne International Film Festival<br />
– held every year for 19 days over<br />
July/August within the Melbourne<br />
CBD and surrounding suburbs, the<br />
festival attracts between 170,000<br />
- 180,000 people annually 63 ; and<br />
• Royal Melbourne Show – held at<br />
the recently renovated Melbourne<br />
Showground’s, over 11 days every<br />
September, the ‘Show’ attracted<br />
more than 500,000 people in 2007 64 .<br />
Other significant events that<br />
occur annually in Melbourne,<br />
for which attendance figures<br />
are not published, include:<br />
• Melbourne International Arts<br />
Festival – occurring for 17 days<br />
every October, predominantly in the<br />
CBD, the festival presents events in<br />
the fields <strong>of</strong> dance, theatre, music,<br />
visual arts, and multimedia 65 ;<br />
• Moomba – held over four days<br />
during the Labour Day long weekend<br />
in March, this Melbourne Festival<br />
is hosted in the CBD on the Yarra<br />
River and parklands 66 ;and<br />
14<br />
Commercial in Confidence <strong>Expression</strong> <strong>of</strong> <strong>Interest</strong> <strong>Brief</strong>
• Melbourne Food and Wine Festival<br />
– held over 14 days in February/<br />
March, this Festival is hosted at<br />
a number <strong>of</strong> venues both in the<br />
CBD and around Melbourne 67 .<br />
1.2 Growth <strong>of</strong> Melbourne<br />
1.2.1 Population Growth<br />
The population <strong>of</strong> <strong>Victoria</strong> has more than<br />
doubled over the last 50 years, from<br />
2.52 million in 1955 to 5.20 million in<br />
2007 68 , while Melbourne’s population<br />
increased by 228 percent from 1.57 69<br />
million to 3.68 million in that same<br />
period. Over the ten years to 2007,<br />
population growth in Melbourne has<br />
consistently exceeded one percent per<br />
annum 70 and in the five years to June<br />
2006, Melbourne recorded the largest<br />
capital city population growth <strong>of</strong> all<br />
the State Capital Cities in Australia,<br />
increasing by 273,000 people 71 .<br />
Current trends indicate that metropolitan<br />
Melbourne will grow substantially<br />
over the next thirty years, with the<br />
State planning for the capacity to<br />
comfortably absorb up to one million<br />
additional people, or 620,000 extra<br />
households by 2020 72 . In fact, if<br />
the current growth rates continue,<br />
Melbourne’s population is projected<br />
to overtake that <strong>of</strong> Sydney, Australia’s<br />
most populous city, by 2028 73 .<br />
Over the last few years, the greatest<br />
population increases within Melbourne<br />
have been in the outer suburban<br />
fringes, such as the north-west<br />
suburbs <strong>of</strong> Caroline Springs, Taylors<br />
Hill and Burnside, and the south-west<br />
suburbs <strong>of</strong> Point Cook, Werribee<br />
South and Sanctuary Lakes 76 .<br />
Increases in Australia’s population are<br />
a result <strong>of</strong> net overseas migration and<br />
natural increase (the excess <strong>of</strong> births<br />
over deaths). However since 1996, the<br />
rate <strong>of</strong> natural increase has been in<br />
decline due to decreasing birth rates<br />
and an increasing life expectancy. As<br />
a result, Australia’s overall population,<br />
like that <strong>of</strong> most developed countries, is<br />
ageing. In June 2007 the median age in<br />
<strong>Victoria</strong> was 36.9 years, slightly above<br />
the national average <strong>of</strong> 36.8 years 77 .<br />
Since 1998-99 net overseas migration<br />
has comprised 45 percent or more<br />
<strong>of</strong> national population growth 79 ,<br />
increasing to 56 percent in 2006/07 80 .<br />
Many <strong>of</strong> these migrants arrived under<br />
the skilled migration program 81 with<br />
most arriving from the United Kingdom,<br />
New Zealand, China and India 82 .<br />
15
Figure 3: Melbourne’s Population Growth 1955 – 2005<br />
74 75<br />
and Growth Projections to 2030<br />
5.0<br />
4.5<br />
Population (millions)<br />
4.0<br />
3.5<br />
3.0<br />
Acual Growth<br />
Projected Growth<br />
2.5<br />
2.0<br />
1.5<br />
1955 1965 1975 1985 1995 2000 2015 2026<br />
Year<br />
Figure 4: Proportion <strong>of</strong> Population by Age Group in <strong>Victoria</strong>, 1971 - 2007 78<br />
100%<br />
90%<br />
65 years and over<br />
Proportion <strong>of</strong> Population<br />
80%<br />
70%<br />
60%<br />
50%<br />
40%<br />
30%<br />
45-64 years<br />
15-44 years<br />
20%<br />
10%<br />
0-14 years<br />
0%<br />
1971 1976 1981 1986 1991 1996 2001 2006<br />
Year<br />
16<br />
Commercial in Confidence <strong>Expression</strong> <strong>of</strong> <strong>Interest</strong> <strong>Brief</strong>
Figure 5: Permanent migrant arrivals, top ten countries <strong>of</strong> birth, arrivals in 2004-05 83<br />
Proportion <strong>of</strong> migrant arrivals<br />
100%<br />
90%<br />
80%<br />
70%<br />
60%<br />
14.8<br />
50%<br />
40% 36.0<br />
30%<br />
20%<br />
14.1<br />
9.0<br />
7.6<br />
4.6<br />
3.7<br />
3.4<br />
2.5<br />
2.4<br />
1.9 100<br />
10%<br />
0%<br />
Other<br />
United Kingdom<br />
New Zealand<br />
China<br />
India<br />
Sudan<br />
South Africa<br />
Philippines<br />
Singapore<br />
Malaysia<br />
Sri Lanka<br />
Total<br />
Country<br />
1.2.2 Urban Development<br />
The Melbourne metropolitan region<br />
covers a broad area <strong>of</strong> 8,806 square<br />
kilometres 84 , resulting in a relatively<br />
low population density <strong>of</strong> 468 people<br />
per square kilometre 85 . While many <strong>of</strong><br />
the inner city suburbs are becoming<br />
more densely populated with the<br />
development <strong>of</strong> multi-level apartment<br />
buildings, the outer suburbs are growing<br />
at the greatest pace. This continued<br />
development in the outer suburbs is<br />
expanding the metropolitan region.<br />
A consequence <strong>of</strong> this rapid growth<br />
in the outer suburbs and the<br />
expanding urban area is that the<br />
public transport systems are currently<br />
deficient in these areas, resulting in<br />
greater dependence on motorised<br />
travel for some Melbournians.<br />
To combat the urban sprawl, the<br />
State has implemented an urban<br />
growth boundary. This boundary<br />
places limitations on the further<br />
expansion <strong>of</strong> the existing urban area,<br />
with all future urban expansion to<br />
be directed along distinct corridors<br />
that compliment access to existing<br />
public transport infrastructure.<br />
Melbourne City was traditionally<br />
considered the central hub for working,<br />
events and shopping, with many <strong>of</strong> the<br />
public transport routes radiating from<br />
the city. With only 11,600 86 residents,<br />
the city is home to only 0.3 percent<br />
<strong>of</strong> Melbournians; however it has a<br />
daytime business, working and visiting<br />
population <strong>of</strong> more than 650,000<br />
people and a night-time population <strong>of</strong><br />
some 128,000 people. Approximately<br />
47 percent <strong>of</strong> daily visitors come for<br />
work purposes and 29 percent come<br />
for shopping, recreation and dining 87 .<br />
17
A significant amount <strong>of</strong> travel in<br />
Melbourne is across suburbs which has<br />
led to the traditional CBD oriented radial<br />
public transport system being enhanced<br />
by the introduction <strong>of</strong> the SmartBus<br />
Program. This program provides orbital<br />
bus services connecting train stations,<br />
shopping centres and other community<br />
facilities 91 , and has initiated a number<br />
<strong>of</strong> local bus improvements to provide<br />
greater flexibility in public transport.<br />
1.2.3 Travel Patterns<br />
In March 2007 there were 2.22 92<br />
million passenger vehicles registered in<br />
Melbourne, representing a concentration<br />
<strong>of</strong> approximately 592 passenger vehicles<br />
per 1,000 people. This concentration<br />
has been increasing over recent years<br />
from 579 per 1,000 people in 2004.<br />
High car ownership in Melbourne has<br />
traditionally contributed to a relatively<br />
low uptake <strong>of</strong> public transport. Other<br />
contributing factors to the low uptake<br />
include the high length <strong>of</strong> roads per<br />
capita, low population densities, the<br />
high quality <strong>of</strong> the roads and the<br />
higher travel times <strong>of</strong> public transport<br />
compared to the road network 94 .<br />
An outcome <strong>of</strong> Melbourne’s high<br />
dependence on private vehicles is<br />
road congestion. A 2006 <strong>Victoria</strong>n<br />
Competition & Efficiency Commission<br />
report found that the economic cost<br />
<strong>of</strong> transport congestion was between<br />
AUD$1.3 billion and $2.6 billion<br />
and warned that these costs could<br />
double over the next 15 years 101 .<br />
While the car remains the preferred<br />
form <strong>of</strong> transport for Melbournians,<br />
public transport use is increasing<br />
with patronage growth currently at<br />
record highs. In 2006/07 financial<br />
year, 418.5 million trips were made<br />
on Melbourne’s metropolitan public<br />
transport, an increase from 387.8<br />
million in 2005/06 104 . The State and<br />
other stakeholders are currently<br />
implementing a number <strong>of</strong> strategies<br />
to facilitate the continued growth in<br />
public transport usage and combat<br />
the affects <strong>of</strong> road congestion.<br />
While seventy percent <strong>of</strong> commuters<br />
travelling to the CBD in the morning<br />
peak utilise public transport, public<br />
transport only makes up approximately<br />
nine percent 95 <strong>of</strong> all motorised trips in<br />
Melbourne. This proportion is quite low<br />
when compared to other cities around<br />
the world, as illustrated in Figure 7.<br />
18<br />
Commercial in Confidence <strong>Expression</strong> <strong>of</strong> <strong>Interest</strong> <strong>Brief</strong>
Figure 6: Passenger Vehicles per Thousand Residents <strong>of</strong> Melbourne 2004-2007 93<br />
595<br />
Registered passenger vehicles<br />
per thousand residents<br />
590<br />
585<br />
580<br />
575<br />
570<br />
2004 2005<br />
Year<br />
2006 2007<br />
Figure 7: Relative Utilisation <strong>of</strong> <strong>Public</strong> <strong>Transport</strong><br />
96 97 98 99<br />
100%<br />
Percentage <strong>of</strong> all motorised trips<br />
taken by public transport<br />
90%<br />
80%<br />
70%<br />
60%<br />
50%<br />
40%<br />
30%<br />
20%<br />
10%<br />
0%<br />
Hong Kong<br />
Singapore<br />
Madrid<br />
Tokyo<br />
London<br />
Stockholm<br />
Birmingham<br />
Paris<br />
Berlin<br />
Manchester<br />
Sydney<br />
Melbourne<br />
City<br />
19
1.3 Levels <strong>of</strong> Government<br />
Australia has three levels <strong>of</strong> elected<br />
government: federal, state and local.<br />
Federal and state parliaments along<br />
with local councils are responsible<br />
for creating laws. Executive bodies,<br />
usually from the political party with the<br />
parliamentary majority, are accountable<br />
for implementing legislation at each<br />
level. At the federal and state level<br />
an independent judiciary exists to<br />
enforce the laws. The State judiciaries,<br />
headed by the Supreme Court, take<br />
primary responsibility for developing<br />
and applying criminal law 105 , while the<br />
High Court <strong>of</strong> Australia acts as the final<br />
court <strong>of</strong> appeal and makes rulings on<br />
the meaning <strong>of</strong> the Constitution 106 .<br />
Australia has a transparent legal<br />
system and a business focused<br />
regulatory environment. For example,<br />
in terms <strong>of</strong> intellectual property, the<br />
patent and copyright enforcement<br />
regime is ranked second in the<br />
region and fourth in the world (World<br />
Competitiveness Yearbook 2005).<br />
1.3.1 Federal Government<br />
The Commonwealth <strong>of</strong> Australia was<br />
established on the 1st <strong>of</strong> January<br />
1901, with the six self-governing British<br />
colonies becoming states. Australia’s<br />
formal Head <strong>of</strong> State is the Queen <strong>of</strong><br />
the United Kingdom. Her representative<br />
in Australia, the Governor-General, is<br />
responsible for ‘advising, encouraging<br />
and warning’ the government <strong>of</strong> the day.<br />
Australia is governed through a<br />
bicameral parliamentary system<br />
consisting <strong>of</strong> the House <strong>of</strong><br />
Representatives and the Senate.<br />
The majority party in the House <strong>of</strong><br />
Representatives will form the executive<br />
arm <strong>of</strong> Government and is responsible<br />
for selecting the Prime Minister 107 . At the<br />
2007 National Election, the Australian<br />
Labor Party defeated the Coalition<br />
<strong>of</strong> the Liberal and National Parties,<br />
after eleven years in Opposition. As a<br />
result, Mr Kevin Rudd replaced Mr John<br />
Howard as Prime Minister <strong>of</strong> Australia.<br />
Under the constitution, the Federal<br />
Government is limited to creating<br />
laws in relation to a range <strong>of</strong> specific<br />
subjects. These include taxation,<br />
immigration, foreign affairs, trade and<br />
defence. Despite this constitutional<br />
restriction, the Federal Government can<br />
(in close cooperation with the states)<br />
influence other areas by drawing on<br />
its large financial capacity 108 . In terms<br />
<strong>of</strong> transport, the Federal Government<br />
has little involvement in intra-state<br />
operations and projects. Investment<br />
is typically aimed at interstate<br />
infrastructure however, significant<br />
investments have been made in<br />
some metropolitan road projects.<br />
1.3.2 <strong>Victoria</strong>n State Government<br />
Despite the formation <strong>of</strong> the<br />
Commonwealth <strong>of</strong> Australia, the State <strong>of</strong><br />
<strong>Victoria</strong> maintains its own constitution.<br />
Proclaimed in 1855, it stipulates that the<br />
Parliament <strong>of</strong> <strong>Victoria</strong> must comprise<br />
<strong>of</strong> the Crown, a Legislative Assembly<br />
and a Legislative Council. The Crown is<br />
represented in <strong>Victoria</strong> by the Governor,<br />
whilst the Legislative Assembly and<br />
Legislative Council form the Lower<br />
and Upper Houses <strong>of</strong> Parliament.<br />
20<br />
Commercial in Confidence <strong>Expression</strong> <strong>of</strong> <strong>Interest</strong> <strong>Brief</strong>
The majority party in the Legislative<br />
Assembly will form the executive arm<br />
<strong>of</strong> Government and is responsible for<br />
electing the Premier 109 . The Labor Party<br />
retained Government in the 2006 state<br />
election and in 2007 Mr John Brumby<br />
succeeded Mr Steve Bracks as Premier.<br />
The <strong>Victoria</strong>n Parliament has the power<br />
to make laws for <strong>Victoria</strong> on any matter<br />
not covered by the Commonwealth<br />
Constitution. State laws are invalid if<br />
inconsistent with Commonwealth law 110 .<br />
The State Government, through the<br />
Minister for <strong>Public</strong> <strong>Transport</strong> 111 , has the<br />
greatest influence over public transport<br />
in Melbourne. The Minister is responsible<br />
for providing strategic leadership on<br />
issues including public transport policy<br />
and expenditure for public transport<br />
improvement and expansion projects.<br />
Coordination and monitoring <strong>of</strong> public<br />
transport services is performed by<br />
the <strong>Public</strong> <strong>Transport</strong> Division, within<br />
the Department <strong>of</strong> <strong>Transport</strong>, under<br />
the Director <strong>of</strong> <strong>Public</strong> <strong>Transport</strong>.<br />
1.3.3 Local Government<br />
<strong>Victoria</strong> is divided into 79 Local<br />
Government Areas. Of these areas,<br />
48 are in regional <strong>Victoria</strong> and the<br />
remaining 31 are in the Melbourne<br />
metropolitan region. Each Local<br />
Government area is administered by<br />
a Local Council, which consists <strong>of</strong><br />
democratically elected councilors<br />
and an operational arm headed up by<br />
a Chief Executive Officer (CEO) 112 .<br />
<strong>Victoria</strong>n Acts <strong>of</strong> Parliament specify the<br />
roles, functions and powers <strong>of</strong> Local<br />
Councils. Councils provide economic,<br />
human, recreational, property and<br />
cultural services to local communities.<br />
They also have the power to make<br />
local laws, known as by-laws, providing<br />
they are consistent with State and<br />
Federal Acts and Regulations. Councils<br />
enforce these laws (and some<br />
State laws) covering matters such<br />
as land use planning, environment<br />
protection, public health, traffic,<br />
parking and animal management 113 .<br />
1.4 Regulatory<br />
Environment<br />
Further to the legislative and regulatory<br />
framework described in Section 3.2.3<br />
and Appendix B to this EOI <strong>Brief</strong>, the<br />
Franchisees must consider the following.<br />
1.4.1 Disability<br />
Discrimination Act<br />
The Federal Disability Discrimination<br />
Act 1992 (DDA) provides protection<br />
for everyone in Australia against<br />
discrimination based on disability.<br />
The DDA makes it against the law to<br />
discriminate against someone if they<br />
have a disability in the following areas:<br />
employment; education; access to<br />
places used by the public; provision<br />
<strong>of</strong> goods, services and facilities;<br />
accommodation; buying land; activities<br />
<strong>of</strong> clubs and associations; sport; and<br />
the administration <strong>of</strong> Commonwealth<br />
Government laws and programs 114 .<br />
21
Table 3: Accessibility Targets for <strong>Public</strong> <strong>Transport</strong><br />
Target date<br />
% Progress towards full compliance<br />
31 December 2007 25<br />
31 December 2012 55<br />
31 December 2017 90<br />
31 December 2022 100*<br />
* Does not include those trams and trains which require full compliance by 2032.<br />
Specified within the requirements for<br />
access to places used by the public<br />
is public transport, including trains,<br />
buses, ferries, boats, ships and<br />
planes. The Disability Standards for<br />
Accessible <strong>Public</strong> <strong>Transport</strong> 2002 were<br />
formulated by Australia’s Attorney-<br />
General to enable public transport<br />
operators and providers to remove<br />
discrimination from public transport<br />
services. These standards commenced<br />
operation on 23 October 2002 115 .<br />
<strong>Victoria</strong>n public transport is used by both<br />
able bodied and those with disabilities<br />
or impaired mobility, including elderly,<br />
frail and pram users. It is estimated that<br />
20 percent <strong>of</strong> <strong>Victoria</strong>ns have impaired<br />
mobility, and with an ageing population,<br />
this is anticipated to increase 116 .<br />
Australia’s DDA stipulates the<br />
accessibility standards <strong>of</strong> public<br />
transport assets, including premises,<br />
conveyances, infrastructure,<br />
information services, signage and<br />
lighting. These standards stipulate a<br />
rollout schedule <strong>of</strong> compliance over<br />
time with milestones at 2012 and<br />
2017, with 100 percent achievement<br />
required by 2022. An exception has<br />
been made for rolling stock, which is<br />
targeted at 100 percent by 2032.<br />
At present, the Melbourne tram and<br />
train operations have achieved the<br />
2007 target <strong>of</strong> 25 percent compliance<br />
for most <strong>of</strong> the requirements. The<br />
25 percent compliance was not<br />
however, achieved for tram and train<br />
platforms or tram rolling stock.<br />
The State’s Accessible <strong>Public</strong> <strong>Transport</strong><br />
Action Plan 2006-12 provides a list<br />
<strong>of</strong> the actions required to maintain<br />
progress on relevant issues for<br />
accessibility and meet the 2012<br />
milestones. Future priorities include<br />
additional tram platform stops, access<br />
paths and ramps at rail stations.<br />
For further information on Disability<br />
Standards for Accessible <strong>Public</strong><br />
<strong>Transport</strong> 2002 and the State’s<br />
Accessible <strong>Public</strong> <strong>Transport</strong><br />
Action Plan 2006-12, refer to<br />
the Department <strong>of</strong> <strong>Transport</strong>’s<br />
website at www.doi.vic.gov.au.<br />
22<br />
Commercial in Confidence <strong>Expression</strong> <strong>of</strong> <strong>Interest</strong> <strong>Brief</strong>
1.4.2 Workplace Relations<br />
in Australia<br />
All Australian employers are required<br />
to comply with Australia’s workplace<br />
relations system. This includes<br />
requirements under working conditions,<br />
discrimination, workers compensation<br />
and occupational health and safety.<br />
Working Conditions<br />
Within Australia, employees<br />
are employed with a variety <strong>of</strong><br />
contract types including Union<br />
Collective Agreements, Australian<br />
Workplace Agreements, Employee<br />
Collective Agreements or an<br />
Individual Employment Contract.<br />
Regardless <strong>of</strong> the type <strong>of</strong> contract,<br />
employers have, minimum obligations<br />
set by the Government, these include<br />
minimum wages; maximum working<br />
hours; four weeks paid annual leave;<br />
ten days paid sick leave and one<br />
year unpaid maternity leave.<br />
The majority <strong>of</strong> Melbourne’s tram<br />
and train franchise employees are on<br />
Union Collective Agreements. This is<br />
a collective agreement between the<br />
employees and employer negotiated by<br />
the employees’ union on their behalf. The<br />
relevant unions in the public transport<br />
industry are Australian Rail, Tram and<br />
Bus Industry Union (RTBU), Australian<br />
Services Union (ASU), the Association<br />
<strong>of</strong> Pr<strong>of</strong>essional Engineers, Scientists<br />
and Managers, Australia (APESMA),<br />
<strong>Transport</strong> Workers Union (TWU), and<br />
Electrical Trades Union (ETU).<br />
Also commonly used is the Individual<br />
Contract, which is an individual written<br />
agreement between the employer<br />
and an employee that sets out terms<br />
and conditions <strong>of</strong> employment.<br />
Australian Workplace Agreements<br />
(AWA) were introduced by the<br />
previous Coalition Government in<br />
2006. An AWA is an individual written<br />
agreement between an employer<br />
and an employee that sets out terms<br />
and conditions <strong>of</strong> employment.<br />
The new Federal Labor Government<br />
plans to phase AWA’s out over the<br />
coming years and implement a new<br />
industrial relations system by January<br />
2010. Until then, individual transitional<br />
employment agreements can be made<br />
available for new employees or those<br />
already on AWA’s. These agreements<br />
must ensure employees are not<br />
disadvantaged against the relevant<br />
award or enterprise agreement 117 .<br />
For further information on working<br />
conditions refer to the Australian<br />
Government’s Workplace Authority’s<br />
website at www.oea.gov.au. For further<br />
information on the unions refer to<br />
their respective websites: Rail, Tram<br />
and Bus Industry Union: http://www.<br />
rtbuvic.com.au/; Australian Services<br />
Union: www.asu.asn.au, APESMA:<br />
www.apesma.asn.au, Electrical Trades<br />
Union: www.etu.com.au, <strong>Transport</strong><br />
Workers Union: www.twu.com.au.<br />
Discrimination<br />
Both Australia and <strong>Victoria</strong> have<br />
legislation regulating against<br />
discrimination in the workplace<br />
or employment related activities.<br />
Discrimination is prohibited in many<br />
areas including, but not limited<br />
to, sex, race, disability, religious<br />
belief, criminal record, and age.<br />
For further details refer to the Human<br />
Rights Commission website at www.<br />
humanrightscommission.vic.gov.au.<br />
23
Workers Compensation<br />
Employers are obliged to provide<br />
workplace injury insurance for their<br />
employees. The <strong>Victoria</strong>n WorkCover<br />
Authority provides this insurance to<br />
<strong>Victoria</strong>n employers. The insurance<br />
covers the costs associated with a<br />
worker becoming injured or ill because<br />
<strong>of</strong> their work. Potential costs include<br />
replacement <strong>of</strong> lost income, medical<br />
and rehabilitation treatment costs,<br />
legal costs or in the event <strong>of</strong> a serious<br />
injury, lump sum compensation.<br />
The insurance cost is based on the<br />
assessed level <strong>of</strong> risk within the<br />
industry sector and previous claims<br />
from that industry. For further details<br />
refer to the WorkCover website<br />
at: www.workcover.vic.gov.au.<br />
Occupational Health and Safety<br />
Australian employers must provide a<br />
safe and healthy workplace for their<br />
workers and contractors. This includes<br />
the provision <strong>of</strong> a safe plant (machinery<br />
and equipment), safe systems <strong>of</strong><br />
work, safe policies around the use<br />
<strong>of</strong> chemicals, maintenance <strong>of</strong> a safe<br />
workplace, the provision <strong>of</strong> training,<br />
instruction, information and supervision<br />
to work in a safe and healthy manner<br />
and the provision <strong>of</strong> adequate facilities,<br />
including bathrooms and drinking water.<br />
For further information on occupational<br />
health and safety requirements,<br />
refer to the WorkCover website<br />
at www.workcover.vic.gov.au.<br />
1.4.3 Regulation <strong>of</strong> Foreign<br />
Investment<br />
The Australian Government encourages<br />
foreign investment, provided that it is<br />
consistent with the national interest.<br />
Foreign investment is regulated<br />
through the Foreign Acquisitions and<br />
Takeover Act 1975 regime. The regime<br />
is administered by the Australian<br />
Treasurer and the Foreign Investment<br />
Review Board (FIRB), an advisory body<br />
within the Federal Government.<br />
Foreign investment proposals are<br />
submitted to the FIRB, either on<br />
a compulsory or voluntary basis.<br />
Proposals are compulsory under a<br />
number <strong>of</strong> conditions including, but not<br />
limited to: acquisitions <strong>of</strong> an Australian<br />
company that has total (gross) assets<br />
exceeding AUD$50m; proposal to<br />
establish a new business involving<br />
a total investment <strong>of</strong> AUD$10m or<br />
more and direct investment by foreign<br />
governments and their agencies.<br />
Voluntary applications to the FIRB<br />
are generally recommended.<br />
The Federal Treasurer has wide<br />
powers to prohibit foreign investment<br />
proposals that are considered<br />
contrary to the national interest.<br />
For further information regarding the<br />
regulations <strong>of</strong> foreign investment in<br />
Australia, refer to the FIRB website at<br />
www.firb.gov.au and the Invest Australia<br />
website at www.investaustralia.gov.au.<br />
24<br />
Commercial in Confidence <strong>Expression</strong> <strong>of</strong> <strong>Interest</strong> <strong>Brief</strong>
1.4.4 Australian Taxation<br />
Companies in Australia are obliged to<br />
pay tax and collect funds on behalf<br />
<strong>of</strong> all three levels <strong>of</strong> Government.<br />
Federal taxes are paid through<br />
the Australian Taxation Office,<br />
these taxes relate to all income<br />
and expenses. This includes, but<br />
is not limited to, the following:<br />
• income tax on pr<strong>of</strong>its,<br />
currently at 30 percent;<br />
• Goods and Services Tax (GST),<br />
currently 10 percent on some<br />
goods and services purchased;<br />
• excises; and<br />
• Fringe Benefit Tax (FBT).<br />
<strong>Victoria</strong>n State taxes are paid<br />
through the <strong>Victoria</strong>n State Revenue<br />
Office. These taxes relate to payroll<br />
tax, stamp duty on motor vehicles,<br />
property, land tax and a congestion<br />
levy for CBD car-parking.<br />
Local Government’s impose taxes<br />
in the form <strong>of</strong> rates based on<br />
the value <strong>of</strong> owned property.<br />
Australia participates in double tax<br />
agreements with some counties to<br />
eliminate the double taxation <strong>of</strong> income.<br />
Countries with agreements include:<br />
Argentina, Austria, Belgium, Canada,<br />
China (not including Hong Kong or<br />
Macau), Czech Republic, Denmark,<br />
Fiji, Finland, France, Germany,<br />
Hungary, India, Indonesia, Ireland,<br />
Italy, Japan, Kiribati, Korea, Malaysia,<br />
Malta, Mexico, the Netherlands, New<br />
Zealand, Norway, Papua New Guinea,<br />
Philippines, Poland, Romania, Russia,<br />
Singapore, Slovakia, South Africa,<br />
Switzerland, Taiwan, Thailand, United<br />
Kingdom, United States and Vietnam.<br />
Companies operating in Australia<br />
collect taxes on behalf <strong>of</strong> the<br />
Government in the following areas:<br />
• employee income tax, known as<br />
Pay As You Go (PAYG) withholding<br />
tax. Individual PAYG taxes<br />
vary by an employee’s income<br />
band. The tax rates for the<br />
2007/08 financial year are:<br />
−− 0 percent tax for income<br />
earned up to $6,000;<br />
−− 15 percent for income earned<br />
between $6,001 - $30,000;<br />
−− 30 percent for all income earned<br />
between $30,001 - $75,000;<br />
−− 40 percent for all income earned<br />
between $75,001 - $150,000;<br />
−− 45 percent for all income<br />
earned over $150,001; and<br />
−− An additional 1.5 - 2.5 percent<br />
Medicare levy may also be payable;<br />
25
• Superannuation Guarantee, currently<br />
nine percent <strong>of</strong> an employee’s wage,<br />
with the maximum limit capped once<br />
the employees ordinary earnings is<br />
AUD$36,470 per quarter, must be<br />
preserved in their superannuation<br />
fund until they reach the retirement<br />
age. This age varies between 55 –<br />
65, depending on the year <strong>of</strong> birth;<br />
• Goods and Services Tax on<br />
most goods and services<br />
provided to customers; and<br />
• reporting on Fringe Benefits Tax and<br />
the Superannuation Guarantee.<br />
For further information on Australian<br />
Taxation refer to the following websites:<br />
Australian Tax Office: www.ato.gov.<br />
au; and <strong>Victoria</strong>n State Revenue<br />
Office: www.sro.vic.gov.au.<br />
1.4.5 Visa and Immigration<br />
Information<br />
The <strong>Victoria</strong>n Government recognises<br />
the value that international business<br />
people bring to the State, particularly<br />
in terms <strong>of</strong> diversity <strong>of</strong> skills, potential<br />
to expand local businesses and export<br />
activity, and maximising employment<br />
opportunities for <strong>Victoria</strong>ns.<br />
All international business people<br />
intending to work in Australia must<br />
obtain a visa to enter Australia. Visas<br />
are issued by the Australian Government<br />
Department <strong>of</strong> Immigration and<br />
Multicultural and Indigenous Affairs.<br />
Visas can be obtained for a temporary<br />
or short period <strong>of</strong> up to four years or<br />
for permanent residency in Australia.<br />
Business (Short Stay) Visas<br />
Business people wishing to enter<br />
Australia for a short period <strong>of</strong> time<br />
or wishing to visit on a regular<br />
basis for short periods <strong>of</strong> time, for<br />
example a conference, business<br />
meeting or negotiations, can obtain<br />
a short stay visa. These visas are<br />
valid for up to a three month period,<br />
or multiple three month periods.<br />
Business people can apply for an<br />
Electronic Travel Authority (ETA)<br />
Business Entrant – Short Validity<br />
(subclass 977) through their travel<br />
agent or over the internet. ETA’s<br />
are currently available for passport<br />
holders from over 30 countries. If<br />
the passport holder is not eligible for<br />
an ETA, they can apply for the more<br />
traditional style visa, the Business<br />
(Short Stay) Visa (subclass 456) 118 .<br />
Business Development – Provisional<br />
The Business Development – Provisional<br />
Visa is available for periods between<br />
three months and four years.<br />
This visa caters for people with a<br />
successful business career, who have<br />
a genuine and realistic commitment<br />
to a company in Australia.<br />
The Business Development – Provisional<br />
Visa falls into a number <strong>of</strong> sub classes,<br />
based on the applicant’s role including:<br />
• business owner;<br />
• senior executive; and<br />
• investor.<br />
26<br />
Commercial in Confidence <strong>Expression</strong> <strong>of</strong> <strong>Interest</strong> <strong>Brief</strong>
Visa eligibility depends on which<br />
sub-class <strong>of</strong> visa is being applied for<br />
and includes, but is not limited to:<br />
• the intention to establish or<br />
manage a business in Australia;<br />
• providing details <strong>of</strong> specified<br />
business experience;<br />
• having vocational English<br />
language skills;<br />
• having sufficient assets to settle in<br />
Australia and under a certain age; and<br />
• under 45 years, or under 55<br />
years if State sponsored.<br />
If applicants do not meet the Australian<br />
Government criteria, they can apply<br />
to the State for sponsorship to<br />
obtain a visa. Sponsorship by the<br />
<strong>Victoria</strong>n Government, through the<br />
Skilled Migration Program, requires<br />
an agreement about the projected<br />
outcomes a business or investment<br />
plan will deliver to <strong>Victoria</strong>.<br />
Visa holders are eligible to:<br />
• work in Australia;<br />
• travel in and out <strong>of</strong> Australia<br />
any number <strong>of</strong> times as long<br />
as the visa is valid; and<br />
• have direct family accompany<br />
them, who will also have<br />
rights to study and work.<br />
Business Development - Permanent<br />
Provisional visa holders can apply for<br />
business development permanent<br />
visas once they have achieved the<br />
Federal Government’s required criteria.<br />
A direct permanent residence visa is<br />
also available for high-calibre business<br />
people - this requires State sponsorship.<br />
Employer Nominated Scheme<br />
This scheme enables <strong>Victoria</strong>n<br />
employers to recruit highly skilled<br />
workers, or in the case <strong>of</strong> a Regional<br />
Headquarter, the transfer <strong>of</strong> key<br />
employees into Australia.<br />
There are a number <strong>of</strong> other<br />
possible visas for pr<strong>of</strong>essionals<br />
and other skilled migrants.<br />
For further information on Australian<br />
Immigration requirements, refer to the<br />
Australian Department <strong>of</strong> Immigration<br />
and Citizenship at www.immi.gov.au.<br />
1.4.6 Other Regulatory<br />
Requirements<br />
The list <strong>of</strong> regulatory requirements<br />
provided here is not an exhaustive<br />
list <strong>of</strong> requirements <strong>of</strong> Australian and<br />
<strong>Victoria</strong>n companies and employers.<br />
For further information, please refer to:<br />
• all <strong>Victoria</strong>n Legislation:<br />
www.legislation.vic.gov.au; and<br />
• all Federal legislation:<br />
www.legislation.gov.au.<br />
27
<strong>Public</strong> <strong>Transport</strong> in <strong>Victoria</strong><br />
The public transport system consists <strong>of</strong><br />
an integrated network <strong>of</strong> metropolitan<br />
tram, train and bus services as well<br />
as country train and coach services.<br />
In addition to the metropolitan tram and<br />
train systems, (described in sections 2.4<br />
and 2.5) there is an extensive network<br />
<strong>of</strong> bus services operated on behalf<br />
<strong>of</strong> the State by private companies.<br />
The network consists <strong>of</strong> 309 routes<br />
and approximately 1500 buses. The<br />
bus network is designed to act as a<br />
feeder service connecting to the tram<br />
and train system and to provide links<br />
to suburban centres. In 2006/07,<br />
the metropolitan bus system carried<br />
approximately 84 million passengers.<br />
<strong>Victoria</strong> is a compact State with<br />
extensive inter-regional and interstate<br />
transport links that support passenger<br />
and commercial activity. V/Line<br />
Passenger provides rail services<br />
throughout regional <strong>Victoria</strong>. The system<br />
comprises 1,152 route kilometres <strong>of</strong> rail<br />
service over five corridors and in the<br />
2006 financial year, V/Line Passenger<br />
carried around 7.7 million passengers.<br />
V/Line Passenger services running<br />
between regional centres and<br />
Melbourne utilise metropolitan track<br />
as does Pacific National, (as a rail<br />
freight operator). This use is governed<br />
through rail access agreements.<br />
2.1 History <strong>of</strong><br />
Franchising in<br />
Melbourne<br />
2.1.1 <strong>Public</strong> <strong>Transport</strong><br />
Operations to 1999 119<br />
Melbourne’s first railway line opened<br />
between Flinders Street and Sandridge<br />
(now Port Melbourne) in September<br />
1854, and over the next decade the<br />
railway spread across the city area.<br />
Cable trams appeared in Richmond<br />
in 1885, and the first electric tram<br />
began operation between Box Hill<br />
and Doncaster in 1889. By the early<br />
1900’s Melbourne had a comprehensive<br />
tram and train network, and this<br />
began to shape the city’s expansion,<br />
with growth occurring along the<br />
rail lines. Electrification <strong>of</strong> the train<br />
system was completed in 1929, and<br />
the last cable tram ran in 1940.<br />
28<br />
Commercial in Confidence <strong>Expression</strong> <strong>of</strong> <strong>Interest</strong> <strong>Brief</strong>
In 1989, the Metropolitan and State<br />
Transit Authorities were merged to form<br />
the <strong>Public</strong> <strong>Transport</strong> Corporation (PTC),<br />
whereby the PTC operated both the<br />
metropolitan and regional operations<br />
from a central structure under public<br />
ownership. During the mid-1990’s public<br />
transport was characterised by radical<br />
cost cutting. The PTC’s bus business<br />
was sold, stations were de-staffed and<br />
conductors removed from trams, as the<br />
PTC’s workforce decreased from 18,000<br />
to 8,400 between 1992 and 1997.<br />
By late 1997 the State had formed<br />
the view that further improvement in<br />
efficiency and service delivery could<br />
only be achieved through radical<br />
restructuring, and it was decided to<br />
proceed with privatisation <strong>of</strong> the public<br />
transport system. As the passenger<br />
rail businesses were heavily dependent<br />
on public funding, and would require<br />
not only continued financial support<br />
by detailed oversight from the State,<br />
it was not feasible to adopt the kind<br />
<strong>of</strong> ‘asset sale’ approach pursued<br />
in other privatisations; therefore a<br />
franchising approach was selected.<br />
In 1998, the operational area <strong>of</strong> PTC was<br />
disbanded and split into five separate<br />
corporatised business in preparation<br />
for privatisation. These were:<br />
• Met Train 1 – named Bayside Trains;<br />
• Met Train 2 – named Hillside Trains;<br />
• Met Tram 1 – named<br />
Swanston Trams;<br />
• Met Tram 2 – named<br />
Yarra Trams; and<br />
• V/Line Passenger.<br />
2.1.2 Franchise Arrangements<br />
1999 – 2002 120<br />
A competitive tender was undertaken<br />
in 1998/99 and drew a high level<br />
<strong>of</strong> interest from bidders around the<br />
world. The winning franchisees were:<br />
• National Express Group Australia<br />
- Bayside Trains, Swanston<br />
Trams and V/Line Passenger;<br />
• Melbourne <strong>Transport</strong> Enterprises<br />
(Connex) - Hillside Trains; and<br />
• Metrolink (a partnership between<br />
Transdev SA and Transfield<br />
Services Ltd) - Yarra Trams 121 .<br />
The franchising arrangements<br />
resulted in considerable achievements<br />
between 1999 and 2002, including:<br />
• punctuality and reliability <strong>of</strong><br />
services improved overall by<br />
an average <strong>of</strong> 35 percent;<br />
• the number <strong>of</strong> tram and train<br />
services running increased by<br />
almost 10 percent (mainly through<br />
growth in <strong>of</strong>f-peak services);<br />
• a stable industrial relations<br />
environment was maintained, with no<br />
services lost to industrial disputes;<br />
• almost AUD$1.1billion worth<br />
<strong>of</strong> new rolling stock was<br />
delivered in service on time;<br />
• AUD$143 million <strong>of</strong> rolling stock<br />
refurbishments progressed on time;<br />
• new tram platform stops were<br />
constructed and four additional<br />
stations were brought up<br />
to premium standard;<br />
29
• completion <strong>of</strong> the extension <strong>of</strong> the<br />
Mont Albert tramline to Box Hill and<br />
the St Albans train to Watergardens;<br />
• customer satisfaction increased<br />
from 61 percent before franchising<br />
to 68 percent in 2003 (average<br />
over all operators); and<br />
• patronage increased at around three<br />
percent per annum (estimated to be<br />
about twice the rate achieved under<br />
public operation in the 1990’s).<br />
Despite these achievements, by 2002<br />
the franchising arrangements were<br />
facing challenging times. National<br />
Express decided it would no longer<br />
operate its franchises, leaving the<br />
operation <strong>of</strong> its metropolitan train<br />
and tram and V/Line Passenger<br />
services in the hands <strong>of</strong> receivers,<br />
and Yarra Trams and Connex were<br />
facing severe financial difficulties.<br />
A number <strong>of</strong> factors that contributed<br />
to the financial position <strong>of</strong> the<br />
public transport franchisees<br />
have been identified:<br />
• unrealistic assumptions by the<br />
bidders in relation to patronage<br />
growth and cost reduction (by far the<br />
most significant influencing factor);<br />
• flaws in, and disputes over, the<br />
contractual arrangements; and<br />
• the performance <strong>of</strong> the<br />
recently introduced automatic<br />
ticketing system;<br />
Interim Operating Agreements were<br />
agreed with Connex and Yarra Trams in<br />
December 2002 to continue operation<br />
<strong>of</strong> their respective networks, while<br />
the State developed a permanent<br />
solution to the structural and<br />
financial problems in the industry.<br />
At this point, the State made the<br />
decision that the businesses would<br />
be restructured to create a single<br />
metropolitan train company and a single<br />
metropolitan tram company in order<br />
to improve fleet management, secure<br />
economies <strong>of</strong> scale and reduce the<br />
number and complexity <strong>of</strong> interfaces in<br />
the industry. It was also decided that<br />
V/Line Passenger was to be retained<br />
under public operation from this point<br />
while the State’s comprehensive regional<br />
rail projects were implemented. V/<br />
Line remains under the management<br />
<strong>of</strong> a public entity today.<br />
2.1.3 Franchise Arrangements<br />
2003-2009 122<br />
With the Interim Operating Agreements<br />
agreed with the existing franchisees,<br />
the State had the opportunity to<br />
consider its options for the medium<br />
to long term management <strong>of</strong><br />
metropolitan public transport.<br />
The three options considered were:<br />
• reverting to public ownership<br />
and management;<br />
• an open tender for the businesses; or<br />
• negotiating with the existing<br />
franchisees, Yarra Trams and Connex.<br />
30<br />
Commercial in Confidence <strong>Expression</strong> <strong>of</strong> <strong>Interest</strong> <strong>Brief</strong>
Considering the risks and benefits<br />
<strong>of</strong> each <strong>of</strong> these options, the State<br />
determined that negotiating the future<br />
operation <strong>of</strong> the combined metropolitan<br />
tram and train networks with Connex<br />
and Yarra Trams respectively, provided<br />
the best outcome for the State<br />
at that time. To ensure that value<br />
for money was achieved from the<br />
renegotiations, the State developed a<br />
set <strong>of</strong> benchmarks against which the<br />
operators’ proposals were evaluated.<br />
The renegotiation process with Yarra<br />
Trams and Connex was undertaken<br />
during 2003, with the new four year<br />
contracts signed in February 2004.<br />
From April 2004, Connex took over<br />
operation <strong>of</strong> Melbourne’s entire train<br />
network and Yarra Trams took control<br />
<strong>of</strong> the entire tram network and have<br />
been managing them since that time.<br />
These agreements were extended from<br />
November 2008 to November 2009.<br />
2.2 <strong>Victoria</strong>’s Rail Safety<br />
Arrangements<br />
2.2.1 Implementation <strong>of</strong><br />
the Rail Safety Act<br />
In response to safety incidents in<br />
other jurisdictions, the Department<br />
<strong>of</strong> <strong>Transport</strong> undertook a series <strong>of</strong><br />
initiatives concerning rolling stock,<br />
rail infrastructure and human factors<br />
impacting on safety outcomes with<br />
the overall objective <strong>of</strong> improving<br />
rail safety in <strong>Victoria</strong>. As a result<br />
<strong>of</strong> these initiatives, a legislative<br />
framework was proposed to<br />
proactively address rail safety.<br />
The Rail Safety Act is the cornerstone<br />
in developing a new regime for safe<br />
rail operations in <strong>Victoria</strong>. The Act<br />
introduces a robust safety accreditation<br />
scheme for rail industry participants<br />
including infrastructure managers and<br />
operators <strong>of</strong> rolling stock who have<br />
primary responsibility for identifying and<br />
managing risks that have the potential<br />
to cause major safety incidents.<br />
The Act establishes a compulsory rail<br />
safety accreditation scheme for rail<br />
operators and is administered by the<br />
Director, <strong>Public</strong> <strong>Transport</strong> Safety (‘Safety<br />
Director’). To attain accreditation, a<br />
rail operator must demonstrate to the<br />
satisfaction <strong>of</strong> the Safety Director that<br />
it has the competence and capacity<br />
to manage the safety risks associated<br />
with the rail operations which it<br />
undertakes. The Franchisees must<br />
be accredited under this scheme.<br />
The Act also sets out a number <strong>of</strong><br />
duties relating to safe rail operations<br />
which rail infrastructure managers,<br />
rolling stock operators, rail contractors<br />
and rail safety workers must comply<br />
with. As ‘rail infrastructure managers’<br />
and ‘rolling stock operators’, the<br />
Franchisees need to meet the<br />
obligations specified in this Act.<br />
The important aspects<br />
<strong>of</strong> the Act include:<br />
• the overarching rail safety principles;<br />
• performance-based duties for<br />
key parties with risk management<br />
responsibilities as part <strong>of</strong> the chain<br />
<strong>of</strong> responsibility for rail safety;<br />
31
• enabling the Safety Director to<br />
take action, in consultation with<br />
the relevant utility safety regulator,<br />
in relation to utilities or rail<br />
operators, where there is a threat<br />
to the safety <strong>of</strong> the operations<br />
<strong>of</strong> the rail operator or utility;<br />
• the framework <strong>of</strong> accreditation<br />
including provision for<br />
applications, <strong>of</strong>fences,<br />
assessment criteria, conditions<br />
and variations <strong>of</strong> accreditation<br />
and disciplinary action; and<br />
• provisions to facilitate the internal<br />
and external review <strong>of</strong> decisions<br />
<strong>of</strong> the Safety Director.<br />
2.2.2 <strong>Public</strong> <strong>Transport</strong><br />
Safety <strong>Victoria</strong><br />
The Safety Director is an independent<br />
statutory <strong>of</strong>fice established under the<br />
<strong>Transport</strong> Act 1983. <strong>Public</strong> <strong>Transport</strong><br />
Safety <strong>Victoria</strong> (‘PTSV’) exists to support<br />
the Safety Director in the performance<br />
<strong>of</strong> the Safety Director’s functions.<br />
The Safety Director is responsible for<br />
administering a range <strong>of</strong> legislation<br />
directed toward the promotion <strong>of</strong> safety<br />
in train, tram and bus operations in<br />
<strong>Victoria</strong> and reports directly to the<br />
Minister for <strong>Public</strong> <strong>Transport</strong>. Subject<br />
to some limited exceptions, the Safety<br />
Director is not subject to the direction<br />
and/or control <strong>of</strong> the Minister.<br />
Under the <strong>Transport</strong> Act, the Safety<br />
Director has the power to investigate<br />
and report on public transport safety<br />
matters. A public transport safety<br />
matter is an incident involving rolling<br />
stock, rail infrastructure, a bus or any<br />
infrastructure used in bus operations<br />
that has certain adverse consequences<br />
or potential adverse consequences.<br />
Investigations into incidents include:<br />
• derailments <strong>of</strong> rolling stock;<br />
• collisions (buses or rolling stock);<br />
• a failure <strong>of</strong> any part <strong>of</strong> a<br />
train, tram or bus;<br />
• a fire or explosion; and<br />
• a failure or breach <strong>of</strong> a<br />
practice or procedure.<br />
PTSV is the public transport safety<br />
regulator for <strong>Victoria</strong> responsible for<br />
regulating the safety <strong>of</strong> all train, tram<br />
and bus operations in <strong>Victoria</strong>.<br />
PTSV is among other things,<br />
responsible for:<br />
• the safety accreditation <strong>of</strong> rail and<br />
bus operators throughout <strong>Victoria</strong>;<br />
• monitoring the development,<br />
implementation and continuous<br />
improvement <strong>of</strong> operators’<br />
safety management systems;<br />
• monitoring compliance through<br />
a rigorous system <strong>of</strong> compliance<br />
inspections and audits;<br />
• providing specialist advice<br />
to the Minister for <strong>Public</strong><br />
<strong>Transport</strong> on operational and<br />
technical safety issues;<br />
• providing practical guidance to<br />
public transport operators on<br />
operational and technical matters;<br />
• monitoring incident and<br />
accident data; and<br />
32<br />
Commercial in Confidence <strong>Expression</strong> <strong>of</strong> <strong>Interest</strong> <strong>Brief</strong>
• representing <strong>Victoria</strong> in the<br />
development <strong>of</strong> national rail and<br />
bus safety legislation that will<br />
enable a consistent approach<br />
to safety regulation.<br />
2.2.3 The Office <strong>of</strong> the<br />
Chief Investigator<br />
The Office <strong>of</strong> the Chief Investigator is an<br />
independent statutory <strong>of</strong>fice established<br />
under the <strong>Transport</strong> Act 1983.<br />
The principle function <strong>of</strong> the Chief<br />
Investigator is to conduct investigations<br />
into public transport safety matters<br />
and report the results <strong>of</strong> those<br />
investigations. The <strong>Transport</strong> Act<br />
specifically provides for the conduct<br />
<strong>of</strong> investigations involving rolling stock<br />
and rail infrastructure by the Chief<br />
Investigator. The primary focus <strong>of</strong> the<br />
investigations is to determine what<br />
factors caused the incident, rather than<br />
apportion blame for the incident, and to<br />
identify issues that may require review,<br />
monitoring or further consideration.<br />
In November 2006, a memorandum<br />
<strong>of</strong> understanding was executed<br />
between the Chief Investigator and<br />
the Safety Director outlining their<br />
respective roles, responsibilities and<br />
the relationship between the two<br />
<strong>of</strong>fices in relation to the investigation<br />
<strong>of</strong> rail or bus occurrences in <strong>Victoria</strong>.<br />
2.2.4 Compliance and<br />
Enforcement under<br />
the Rail Safety Act<br />
The Act substantially increases the<br />
rigour in the accreditation regime. Rail<br />
operators must identify and document<br />
hazards and risks and the matter in<br />
which those hazards and risk will be<br />
controlled in order to prove that the rail<br />
operator has the capacity to meet the<br />
required level <strong>of</strong> safety performance.<br />
Rail operators are required to set<br />
out the way in which they propose<br />
to manage safety in a Safety<br />
Management System which will be<br />
reviewed by the Safety Director.<br />
Where the Safety Director detects a<br />
non-compliance by the operator with<br />
its Safety Management System, the<br />
Safety Director will be empowered to<br />
issue a mandatory improvement or<br />
prohibition notice followed by a penalty<br />
if the notice is not complied with.<br />
The Act also contains a graduated<br />
hierarchy <strong>of</strong> sanctions and penalties.<br />
These sanctions and penalties are<br />
consistent with best practice safety<br />
regulation and are intended to<br />
emphasise prevention, continuous<br />
improvement and provide incentives<br />
in relation to risk management.<br />
The reform achieved under the Rail<br />
Safety Act represents <strong>Victoria</strong>’s<br />
ongoing commitment to the<br />
continuous improvement <strong>of</strong> the<br />
already high rail safety standards<br />
which apply throughout the State.<br />
33
2.2.5 A Culture <strong>of</strong> Continuous<br />
Improvement<br />
In recognition <strong>of</strong> the importance <strong>of</strong> a<br />
progressive safety culture, the Rail<br />
Safety Regulations 2006 included a<br />
requirement for accredited rail operators<br />
to include in their Safety Management<br />
System methods to promote and<br />
maintain a positive safety culture.<br />
Recent amendments to the Act have<br />
introduced obligations relating to ‘safety<br />
interface agreements’, which operators<br />
will need to comply with once the<br />
relevant provisions come into operation<br />
on 1 July 2010. These agreements<br />
require operators to interface with<br />
other parties operating on or near the<br />
network in order to ensure that activities<br />
conducted by these parties (either<br />
jointly or independently) are done in<br />
such a way that safety is not comprised.<br />
These parties include roads and utilities<br />
authorities and private contractors.<br />
In addition to requiring rail operators<br />
to address the importance <strong>of</strong> a culture<br />
<strong>of</strong> continuous improvement, the State<br />
has also introduced a number <strong>of</strong><br />
initiatives to increase awareness with<br />
respect to safety matters. One <strong>of</strong> these<br />
initiatives is the Don’t risk it! campaign,<br />
a multi-pronged safety campaign to<br />
encourage motorists, heavy vehicle<br />
drivers and pedestrians to think about<br />
what they are doing when approaching<br />
and using railway crossings.<br />
2.3 <strong>Public</strong> <strong>Transport</strong><br />
Strategic Planning<br />
The State has a strong commitment<br />
to public transport and has developed<br />
a number <strong>of</strong> important policies and<br />
plans to give effect to its commitment<br />
for public transport in <strong>Victoria</strong>.<br />
2.3.1 Government Vision<br />
The <strong>Victoria</strong>n Government’s vision for<br />
building <strong>Victoria</strong> into a stronger more<br />
innovative state in the future is detailed<br />
in Growing <strong>Victoria</strong> Together.<br />
The document identifies ten important<br />
objectives which will be the focus for<br />
setting priorities going forward. <strong>Public</strong><br />
transport relates to four <strong>of</strong> the ten<br />
objectives and are shown following.<br />
The four objectives relating<br />
to public transport are:<br />
• growing and linking all <strong>of</strong> <strong>Victoria</strong><br />
- details the importance <strong>of</strong> public<br />
transport to accommodate the<br />
current and forecast growth and<br />
supports the State’s commitment<br />
to increasing travel by public<br />
transport to 20 percent <strong>of</strong> all<br />
motorised trips by 2020;<br />
• building friendly, confident and safe<br />
communities - details the importance<br />
<strong>of</strong> social inclusion, with access to<br />
public transport a key aspect to<br />
improving social inclusion, and issues<br />
relating to safety on public transport;<br />
34<br />
Commercial in Confidence <strong>Expression</strong> <strong>of</strong> <strong>Interest</strong> <strong>Brief</strong>
Figure 8: <strong>Victoria</strong>n Plans and Policies that Impact <strong>Public</strong> <strong>Transport</strong><br />
<strong>Victoria</strong>n Government Vision<br />
Growing <strong>Victoria</strong> Together (2001)<br />
<strong>Transport</strong> Policies and Plans<br />
• Meeting our <strong>Transport</strong> Challenges<br />
• Melbourne 2030 (2002)<br />
• Linking Melbourne – Metropolitan<br />
<strong>Transport</strong> Plan (2004)<br />
Other Relevant Policies and Plans<br />
• A Fairer <strong>Victoria</strong> (2007)<br />
• <strong>Victoria</strong>’s Environmental<br />
Sustainability Framework (2006)<br />
• Options for Managing<br />
<strong>Transport</strong> (2006)<br />
• Accessible <strong>Public</strong> <strong>Transport</strong><br />
Action Plan 2006 – 2012 (2006)<br />
• efficient use <strong>of</strong> natural resources<br />
– details <strong>Victoria</strong>’s responsibility<br />
to decrease greenhouse gas<br />
emissions and adopt a more<br />
sustainable lifestyle. Increasing public<br />
transport use can assist with this<br />
by reducing the number <strong>of</strong> vehicles<br />
on the road and therefore reducing<br />
greenhouse gas emissions; and<br />
• sound financial management<br />
– details the commitment <strong>of</strong><br />
the State to maintain sound<br />
financial management and ensure<br />
continued considered investment<br />
in infrastructure and services.<br />
2.3.2 <strong>Transport</strong> Plans<br />
and Policies<br />
The State has released four key<br />
strategies on public transport over<br />
the last five years, each supporting<br />
the common goal <strong>of</strong> improving<br />
public transport in <strong>Victoria</strong>. These<br />
plans are outlined below however<br />
the high level themes shared<br />
throughout these plans are to:<br />
• grow patronage on public<br />
transport services by increasing<br />
or improving the:<br />
−− number <strong>of</strong> services provided;<br />
−− quality <strong>of</strong> services provided;<br />
−− network capacity to support<br />
an increase in patronage;<br />
−− utilisation <strong>of</strong> the network; and<br />
−− integration <strong>of</strong> the public<br />
transport network, across the<br />
train, tram and bus services;<br />
35
• enhance social inclusion by<br />
improving accessibility for:<br />
−− people with disabilities; and<br />
−− the transport disadvantaged;<br />
• provide a safe and secure network<br />
by improving / providing:<br />
−− safety on vehicles and<br />
infrastructure; and<br />
−− a safe and secure network;<br />
• consider the environment through:<br />
−− the promotion <strong>of</strong> public transport,<br />
therefore moving people out <strong>of</strong><br />
their cars into more environmentally<br />
friendly public transport vehicles; and<br />
−− considering ways to decrease<br />
the environmental impacts <strong>of</strong><br />
the public transport network.<br />
Meeting our <strong>Transport</strong> Challenges<br />
Meeting our <strong>Transport</strong> Challenges<br />
(MOTC) was released in 2006 and<br />
is the biggest single investment in<br />
the transport system undertaken by<br />
the State and is projected to inject<br />
AUD$10.5 billion into the transport<br />
network over the next ten year<br />
period. Of this, AUD$7.5 billion is<br />
to be spent on public transport.<br />
This funding will be spread across the<br />
train, tram, bus and road networks, with<br />
the funding largely for infrastructure<br />
projects. The funding allocated to<br />
the metropolitan tram and train<br />
operations is summarised below:<br />
Metropolitan Trams:<br />
• the State will commence a<br />
procurement program to increase<br />
the current tram fleet and improve<br />
the operational reliability and safety<br />
performance <strong>of</strong> the tram fleet;<br />
• continue to improve traffic priority<br />
to increase the average tram speed.<br />
Actions include providing priority<br />
treatment for trams at intersections<br />
and approaches, increasing<br />
segregation between trams and other<br />
road users, undertaking track works<br />
to allow trams to pass each other and<br />
urban design improvements; and<br />
• improve accessibility on trams by<br />
continuing to upgrade to platform<br />
tram stops and purchasing more<br />
accessible rolling stock.<br />
Metropolitan Trains:<br />
• the State will provide funding to<br />
purchase additional train rolling<br />
stock to expand the fleet and replace<br />
the Comeng and Hitachi trains;<br />
• the older metropolitan train network<br />
management systems will be<br />
replaced with a new high quality train<br />
control and management system<br />
and improved train communications<br />
systems to ensure more efficient and<br />
safer management <strong>of</strong> the services;<br />
36<br />
Commercial in Confidence <strong>Expression</strong> <strong>of</strong> <strong>Interest</strong> <strong>Brief</strong>
• Melbourne’s rail capacity will<br />
be boosted by an investment <strong>of</strong><br />
more than AUD$2 billion over the<br />
coming years. Improvements to<br />
the rail network infrastructure to<br />
increase capacity includes signalling<br />
upgrades, stabling projects,<br />
maintenance depot upgrades,<br />
additional track on some lines, track<br />
modifications, the development <strong>of</strong><br />
new stations in growing suburbs<br />
and upgrading existing platforms;<br />
• additional ‘Park & Ride’ facilities<br />
will be developed at train stations,<br />
to enable public transport<br />
users to combine a private car<br />
trip with a train ride; and<br />
• the State will continue to<br />
invest in safety and security<br />
improvement projects, with a<br />
key focus on improving safety<br />
at level crossings, improving<br />
safety on trains, and upgrading<br />
the City Loop safety systems.<br />
All Modes:<br />
• increase the promotion <strong>of</strong><br />
public transport as a mode<br />
<strong>of</strong> transport, though the<br />
‘TravelSmart’ program; and<br />
• improve metropolitan modal<br />
interchanges to make public transport<br />
a more attractive travel choice.<br />
Other improvements being made to<br />
the wider transport network include:<br />
cross city bus routes (SmartBus)<br />
and further road improvements.<br />
Implementation <strong>of</strong> MOTC is underway<br />
with the refurbishment <strong>of</strong> North<br />
Melbourne station commencing in May<br />
2007, the duplication <strong>of</strong> the Clifton Hill<br />
track, the first phase <strong>of</strong> improvements<br />
to the St Kilda Road tram corridor,<br />
continued Think Tram improvements and<br />
the roll out <strong>of</strong> four SmartBus routes.<br />
Linking Melbourne Metropolitan<br />
<strong>Transport</strong> Plan<br />
In November 2004, the State released<br />
Linking Melbourne: Metropolitan<br />
<strong>Transport</strong> Plan, a strategic plan for<br />
the management and development<br />
<strong>of</strong> Melbourne’s transport system.<br />
The Plan identified and examined<br />
four key transport challenges: safety,<br />
managing congestion, metropolitan<br />
growth, and support for economic<br />
development. For each <strong>of</strong> these<br />
challenges, a number <strong>of</strong> strategies<br />
have been identified which integrate<br />
actions for roads, public transport and<br />
non-motorised modes. The proposed<br />
initiatives are a mixture <strong>of</strong> infrastructure,<br />
planning and service upgrades. The<br />
strategies relating to the metropolitan<br />
tram and train networks include:<br />
• improve access from the<br />
outer suburbs via the<br />
passenger rail network;<br />
• improve the reliability and flow <strong>of</strong><br />
road based public transport;<br />
• improve service coordination,<br />
information and customer interface;<br />
• ensure the safety and security<br />
<strong>of</strong> transport infrastructure;<br />
• provide safer and better access<br />
to public transport; and<br />
• promote sustainable travel through<br />
better demand management.<br />
37
Melbourne 2030<br />
Melbourne 2030 details the plan<br />
for the growth and development <strong>of</strong><br />
the Melbourne metropolitan area.<br />
Melbourne’s growth is anticipated to<br />
increase with estimates there will be<br />
an additional 620,000 households<br />
or one million people by 2030.<br />
This plan details Melbourne’s urban<br />
planning requirements to comfortably<br />
absorb this growth and ensure<br />
Melbourne remains a place people<br />
enjoy to live in while protecting and<br />
enhancing our existing suburbs.<br />
<strong>Transport</strong> is a key part <strong>of</strong> planning<br />
for such growth, as such; Melbourne<br />
2030 included a section on ‘Better<br />
<strong>Transport</strong> Links’. The transport initiatives<br />
identified are aligned to those detailed<br />
in MOTC and Linking Melbourne.<br />
Accessible <strong>Public</strong> <strong>Transport</strong> Action<br />
Plan 2006-2012<br />
The Accessible <strong>Public</strong> <strong>Transport</strong><br />
Action Plan 2006-12 provides the<br />
long term strategy for delivering<br />
accessible bus, train, tram and taxi<br />
services throughout <strong>Victoria</strong>.<br />
The State’s primary priorities for the<br />
metropolitan tram and train networks<br />
for the six year period are to provide:<br />
• access paths, ramps, Tactile<br />
Ground Surface Indicators (TGSIs),<br />
waiting areas and stairs on the<br />
metropolitan rail network; and<br />
• more platform stops in medians<br />
and high use locations, TGSIs at<br />
tram stops and at the boarding<br />
<strong>of</strong> Melbourne trams.<br />
2.3.3 Other Government<br />
Strategies and Policies<br />
A Fairer <strong>Victoria</strong><br />
A Fairer <strong>Victoria</strong> is about giving more<br />
<strong>Victoria</strong>ns ‘a fair go’ to ensure they can<br />
build a better future for themselves,<br />
their families and their communities. The<br />
core objectives <strong>of</strong> this policy are to:<br />
• ensure access for all <strong>Victoria</strong>ns<br />
to universal services;<br />
• reduce barriers to opportunity;<br />
• support disadvantaged groups;<br />
• provide support for<br />
disadvantaged places; and<br />
• make it easier for all <strong>Victoria</strong>ns<br />
to work with Government.<br />
<strong>Transport</strong> is a key part <strong>of</strong> this policy,<br />
with the focus on improving access<br />
to the transport network for people<br />
with disabilities and difficulties, and<br />
improving services to people who may<br />
be in transport disadvantaged areas.<br />
<strong>Victoria</strong>’s Environmental<br />
Sustainability Framework<br />
The Environmental Sustainability<br />
Framework provides direction for<br />
government, business and the<br />
community on including environmental<br />
considerations in the way we work<br />
and live. The Frameworks’ three<br />
key strategic directions are:<br />
• maintaining and restoring<br />
<strong>Victoria</strong>’s natural resources;<br />
• using <strong>Victoria</strong>’s resources<br />
more efficiently; and<br />
• reducing <strong>Victoria</strong>ns everyday<br />
environmental impacts.<br />
38<br />
Commercial in Confidence <strong>Expression</strong> <strong>of</strong> <strong>Interest</strong> <strong>Brief</strong>
Increasing public transport use<br />
was highlighted as a key way<br />
<strong>Victoria</strong>ns could reduce their<br />
everyday environmental impacts.<br />
2.4 Metropolitan<br />
Trams Overview<br />
In route track length, Melbourne’s<br />
tram network is believed to be the<br />
largest operating tram network in the<br />
world. The tram network radiates from<br />
central Melbourne on 29 routes and<br />
consists <strong>of</strong> 249 kilometres <strong>of</strong> double<br />
track. Approximately 18 percent<br />
<strong>of</strong> the tram network is on isolated<br />
track designated for the use <strong>of</strong> trams<br />
only, with the remaining 82 percent<br />
<strong>of</strong> the tram network sharing road<br />
space with other road traffic 123 .<br />
There are a total <strong>of</strong> 1,569 individual<br />
tram stops, a further 210 <strong>of</strong> which<br />
have recently been upgraded to<br />
tram platform stops (that is, those<br />
stops that are level access stops).<br />
Introduced in 2001, platform stops<br />
aim to improve accessibility as well<br />
as loading and unloading times.<br />
The Accessible Tram Stop Program will<br />
construct about 350 new platform stops<br />
across Melbourne as part <strong>of</strong> a AUD$250<br />
million, 10 year investment in improving<br />
public transport accessibility. This was<br />
announced in the MOTC statement and<br />
is supported by the Accessible <strong>Public</strong><br />
<strong>Transport</strong> Action Plan 2006-2012. The<br />
upgrades have initially targeted stops<br />
at locations with minimal impact on<br />
traffic, for example, where trams have<br />
designated track 124 . Currently platform<br />
stops are located on routes 1, 6, 8,<br />
48, 59, 70, 75, 86, 96, and 109 125 .<br />
The most popular stop within Melbourne<br />
city is located at Federation Square/<br />
Flinders Street, with approximately<br />
30,000 people using the stop each<br />
day 126 . Melbourne’s prime tram<br />
corridor, St Kilda Road, is possibly the<br />
busiest tram thoroughfare in the world,<br />
with a tram passing every minute in<br />
each direction during peak hour.<br />
The average distance between<br />
tram stops throughout the<br />
network is 260 metres.<br />
With the platform raised about 30<br />
centimetres from the road, platform<br />
stops <strong>of</strong>fer convenient access for<br />
mobility impaired passengers and<br />
comply with the Disability Standards for<br />
Accessible <strong>Public</strong> <strong>Transport</strong> (DSAPT)<br />
requirements. In addition, platform<br />
stops feature wider waiting areas and<br />
shelter from the weather and some<br />
have real-time tram arrival information<br />
and ticket vending machines.<br />
39
Figure 9: Melbourne Metropolitan Tram Network<br />
40<br />
Commercial in Confidence <strong>Expression</strong> <strong>of</strong> <strong>Interest</strong> <strong>Brief</strong>
2.4.1 Rolling Stock<br />
There are currently 493 trams <strong>of</strong><br />
varying models and age. These<br />
vehicles are listed in Table 4.<br />
Arrangements are in place for the<br />
leasing <strong>of</strong> five additional 5 section<br />
Citadis trams. Transdev has sourced<br />
these trams through the transport<br />
authority in the French municipality<br />
<strong>of</strong> Mulhouse (‘Sitram’). Transdev is<br />
leasing the trams from Sitram and<br />
then providing them to Yarra Trams<br />
under a rental agreement. These<br />
trams will be progressively rolled out<br />
for operations during 2008 and will<br />
be available to the successor tram<br />
Franchisee until the end <strong>of</strong> 2011.<br />
W-class trams continue to<br />
operate on select routes on the<br />
Melbourne network, including:<br />
• the City Circle, a free tourist<br />
service in the Melbourne CBD;<br />
• route 30, a CBD service (City to<br />
Docklands via Latrobe Street); and<br />
• routes 78 and 79 which operate<br />
along Church and Chapel Streets.<br />
All W-class trams have been fitted with<br />
modern braking systems to significantly<br />
improve their safety. The trams have<br />
also been fitted with pantographs and<br />
speedometers and operate subject<br />
to certain restrictions to ensure they<br />
remain a safe and reliable part <strong>of</strong><br />
Melbourne’s transport network 127 .<br />
The three Restaurant Trams are W<br />
Class trams operated by the privately<br />
run Colonial Tramcar Restaurant<br />
Company under lease from the<br />
Current Franchisee. Tram drivers and<br />
routine servicing on these trams is<br />
currently provided by the tram operator<br />
under the conditions <strong>of</strong> the lease.<br />
There are currently eight tram depots<br />
situated in Melbourne. These are<br />
located at Brunswick, Camberwell,<br />
East Preston, Essendon, Glen Huntly,<br />
Kew, Malvern and Southbank.<br />
The average speed <strong>of</strong> Melbourne’s trams<br />
is 16 kilometres per hour. During the<br />
morning peak, the lowest tram speeds<br />
experienced in the city centre and<br />
through strip shopping centres are about<br />
10–15 km/h, while tram speeds in light<br />
rail corridors are about 25–30 km/h 128 .<br />
41
Table 4: Tram Rolling Stock as at March 2008<br />
Make Number Length Seating Capacity Years Delivered<br />
Pre 1999 Rolling Stock<br />
W-Class heritage trams 51 14.17m 48 -52 148 1925<br />
Z-Class trams 145 16.64m 42-48 114-125 1975<br />
A-Class trams 70 15.01m 42 117 1984/1986<br />
B-Class trams 132 23.50m 76 182 1984/1988<br />
Post 1999 Rolling Stock<br />
C-Class low floor Alstom Citadis trams 36 22.98m 40 145 2001<br />
D1 Class (three section) low floor<br />
Siemens Combino trams<br />
D2 Class (five section) low floor<br />
Siemens Combino trams<br />
Additional Trams<br />
38 20.04m 36 140 2002<br />
21 29.85m 52 190 2002<br />
Restaurant Trams (W Class) 3 14.17m 36 1925<br />
2.4.2 Timetable Hours<br />
Melbourne’s trams are in service<br />
between 18 to 22 hours a day,<br />
depending on the day <strong>of</strong> the week. From<br />
Monday to Saturday the first tram on<br />
each route generally starts between<br />
5:00am – 5:30am, with the last tram<br />
<strong>of</strong> the day leaving the city between<br />
12:00am and 12:30am. These operating<br />
hours have recently been extended<br />
on Friday and Saturday evenings with<br />
the last tram leaving the city between<br />
1:00 am and 1:25 am 129 . On Sundays<br />
the first trams start around 6:30am<br />
with the last trams leaving the city<br />
between 12:00am and 12:30am.<br />
Each week there are 31,320 scheduled<br />
tram services in metropolitan<br />
Melbourne; with 4,950 daily from<br />
Monday to Thursday, 5,010 on<br />
Friday’s, 3,770 on Saturday’s<br />
and 2,740 on Sunday’s.<br />
2.5 Metropolitan<br />
Trains Overview<br />
Melbourne’s electrified suburban<br />
train network is extensive by world<br />
standards. The network radiates from<br />
central Melbourne on 15 routes and<br />
consists <strong>of</strong> a total <strong>of</strong> 382 network route<br />
kilometres, making it the second largest<br />
metropolitan network in Australia 130 .<br />
The City Loop, or Melbourne’s<br />
Underground Rail Loop, is central<br />
to the metropolitan train network,<br />
enabling a steady flow <strong>of</strong> trains<br />
through the Central Business District<br />
(CBD), and providing passengers<br />
with the convenience <strong>of</strong> accessing<br />
one <strong>of</strong> five central train stations.<br />
Completed in 1985, the city loop has<br />
four single track tunnels, totalling<br />
17 kilometres in combined length.<br />
42<br />
Commercial in Confidence <strong>Expression</strong> <strong>of</strong> <strong>Interest</strong> <strong>Brief</strong>
Figure 10: Melbourne Metropolitan Train Network<br />
43
Each tunnel is independent with no<br />
cross connections between loops,<br />
with each being dedicated to a group<br />
<strong>of</strong> suburban lines 131 . Twenty years<br />
after completion, the City Loop<br />
tunnel is now beginning to approach<br />
capacity, and the State is currently<br />
planning to address the issue 132 .<br />
There are a total <strong>of</strong> 213 train stations<br />
serviced within the metropolitan<br />
area, each typically with two, three<br />
or four platforms. A small number<br />
<strong>of</strong> stations have more than four<br />
platforms, including Southern Cross<br />
Station with six metropolitan platforms<br />
and additional platforms for regional<br />
services, and Flinders Street Station<br />
with 12 platforms predominantly<br />
used for metropolitan services. There<br />
are a total <strong>of</strong> 471 individual train<br />
platforms in the metropolitan area.<br />
72 metropolitan train stations are<br />
classified as ‘Premium Stations’, with<br />
plans to upgrade a further three stations<br />
to premium status, as per the transport<br />
and liveability statement in Meeting Our<br />
<strong>Transport</strong> Challenges. Premium stations<br />
are staffed from the first train <strong>of</strong> the day<br />
to the last train seven days a week. Each<br />
premium station has a customer service<br />
centre, where passengers can ask staff<br />
questions and obtain timetables and<br />
change for the vending machines and<br />
payphones as well as purchase tickets.<br />
Most premium stations also provide<br />
improved customer facilities, such as<br />
enclosed waiting areas and toilets. Both<br />
premium and standard stations have<br />
closed-circuit television cameras on<br />
platforms and at car park entrances 133 .<br />
The average distance between<br />
metropolitan train stations is<br />
2.5 kilometres. Flinders Street<br />
Station is the busiest station in<br />
<strong>Victoria</strong>, with more than 110,000<br />
passengers passing through the<br />
station on an average weekday 134 .<br />
While line speed is 80 kilometres per<br />
hour, with the exception <strong>of</strong> the outer<br />
areas between Newport to Werribee<br />
and Dandenong to Pakenham which<br />
is 115 kilometres per hour 135 , the<br />
average train speed within metropolitan<br />
Melbourne is currently 35 kilometres<br />
per hour 136 . The current speed has<br />
declined in the last few years due to<br />
increased operational constraints.<br />
2.5.1 Rolling Stock<br />
There are currently 331 three car<br />
units <strong>of</strong> varying models and age<br />
listed in Table 5 below. During peak<br />
periods the three car units are<br />
always coupled and run as six-car<br />
sets. With current patronage growth,<br />
<strong>of</strong>f-peak services are increasingly<br />
being run with six-car sets as well.<br />
The State has contracted with Alstom<br />
for the supply <strong>of</strong> 18 additional 6 car sets<br />
<strong>of</strong> X’trapolis trains with an option for up<br />
to 20 further trains. Delivery is expected<br />
in the early part <strong>of</strong> the new franchise.<br />
All Melbourne trains are fully compliant<br />
with the Disability Standards for<br />
Accessible <strong>Public</strong> <strong>Transport</strong> (DSAPT)<br />
requirements, with the exception <strong>of</strong><br />
the old Hitachi trains, which have<br />
a number <strong>of</strong> minor deficiencies (no<br />
Passenger Information Display, no<br />
communication button, or allocated<br />
space in carriages). Provided all<br />
Hitachi trains are replaced by 2032,<br />
the State is well within the required<br />
DDA timelines for suburban trains 137 .<br />
44<br />
Commercial in Confidence <strong>Expression</strong> <strong>of</strong> <strong>Interest</strong> <strong>Brief</strong>
Table 5: Train Rolling Stock as at June 2007<br />
Make Number <strong>of</strong> 3 car units Years delivered<br />
Pre 1999 Rolling Stock<br />
Comeng 187 Between 1982 – 1989<br />
Hitachi 14 Remaining from the 118 three car<br />
units delivered between 1973 – 1981<br />
Post 1999 Rolling Stock<br />
Siemens Nexas 72 Between 2003 – 2006<br />
Alstom X’trapolis 58 Between 2002 and 2004<br />
2.5.2 Timetable Hours<br />
Melbourne’s trains are in service<br />
between 19 to 22 hours a day,<br />
depending on the day <strong>of</strong> the week. From<br />
Monday to Saturday the first train on<br />
each route generally starts between<br />
4:15am – 5:05am, with the last train<br />
<strong>of</strong> the day leaving the city between<br />
12:00am and 12:15am. These operating<br />
hours have recently been extended<br />
on Friday and Saturday evenings with<br />
the last train leaving the city between<br />
1:00 am and 1:15 am 139 . On Sundays<br />
the first trains start around 6:50am<br />
with the last trains leaving the city<br />
between 11:45pm and 12:15am.<br />
Each week there are currently 12,282<br />
scheduled train services in metropolitan<br />
Melbourne; with 1,916 daily from<br />
Monday to Thursday, 1,944 on Fridays,<br />
1,502 on Saturdays and 1,172 on<br />
Sundays. On public holidays there<br />
are 1,476 scheduled services 140 .<br />
2.6 Melbourne <strong>Public</strong><br />
<strong>Transport</strong> Fares<br />
and Ticketing<br />
Melbourne has a multi-modal public<br />
transport ticketing system, which<br />
operates on train, tram and bus services<br />
in the metropolitan area. The existing<br />
ticketing system, known as Metcard, is<br />
an automated ticketing system which<br />
uses electronically encoded tickets.<br />
Made <strong>of</strong> stiff card with a magnetic<br />
stripe, Metcards were rolled out<br />
between 1996 and 1998 and replaced<br />
the previous paper tickets. The ticket<br />
type is pre-printed on the ticket when it<br />
is encoded. Once purchased, Metcards<br />
are validated by putting the card<br />
through a validator, located on all trams,<br />
metropolitan buses and at train stations.<br />
During validation, the expiry details are<br />
printed on the back <strong>of</strong> the Metcard 141 .<br />
The public transport network is<br />
divided into two zones, referred to<br />
as zone 1 and zone 2. Most fares<br />
are based on the zones in which<br />
the travel occurs, with passengers<br />
required to have a valid ticket for each<br />
zone they travel in. When travelling<br />
in a zone boundary overlap however,<br />
passengers are only required to have<br />
a valid ticket for one <strong>of</strong> the zones.<br />
45
2.6.1 Metcard Fares<br />
A range <strong>of</strong> tickets are available<br />
including a city-saver, two hour, daily,<br />
weekly, monthly and yearly for all<br />
combinations <strong>of</strong> zones, at both full-fare<br />
and concession rates. These fares<br />
are set by the State and are subject<br />
to annual Consumer Price Index (CPI)<br />
increases. The 2008 Metcard fares<br />
are listed in Table 6 and Table 7.<br />
Concession travel is available to<br />
all passengers aged under 15<br />
and those that carry an approved<br />
<strong>Victoria</strong>n Concession Card. Eligible<br />
concession cards include:<br />
• <strong>Victoria</strong>n <strong>Public</strong> <strong>Transport</strong><br />
Primary and Secondary<br />
Student Concession Card;<br />
• <strong>Victoria</strong>n <strong>Public</strong> <strong>Transport</strong> Tertiary<br />
Student Concession Card;<br />
• Australian Pensioner<br />
Concession Card;<br />
• <strong>Victoria</strong>n Seniors Card;<br />
• Health Care Card; and<br />
• War Veterans/War Widows<br />
Concession Card 142 .<br />
In 2006/07 concession tickets<br />
accounted for 28 percent <strong>of</strong><br />
metropolitan farebox revenue and 52<br />
percent <strong>of</strong> total tickets sales 143 . Full<br />
fare tickets account for the balance.<br />
In 2006/07, Zone 1 Metcards accounted<br />
for 49 percent <strong>of</strong> total revenue, while<br />
zone 1+2 Metcards accounted for<br />
34 percent <strong>of</strong> total revenue. The<br />
balance was attributed to 14 percent<br />
Zone 2, 1.5 percent to city saver<br />
and 1.5 percent to Sunday Saver.<br />
The daily Metcard is currently the most<br />
purchased ticket, with approximately<br />
30 percent <strong>of</strong> public transport<br />
users purchasing dailies, however<br />
its share is decreasing, with more<br />
customers increasingly purchasing<br />
the discounted multi-trip Metcards,<br />
such as 10x2 hour and 5xdaily 145 .<br />
The State recently introduced the<br />
Early Bird Metcard ticket which <strong>of</strong>fers<br />
commuters free inbound, outbound<br />
or between station travel on the<br />
train network if they complete their<br />
journey prior to 7am on weekdays.<br />
The objective <strong>of</strong> the Early Bird Ticket<br />
is to encourage more public transport<br />
users to use non-peak services to<br />
improve capacity during peak periods.<br />
The Early Bird Metcard will be<br />
available for at least two years and<br />
will be reviewed as the Government’s<br />
order <strong>of</strong> 18 new six-car trains begin<br />
service from late 2009 146 .<br />
46<br />
Commercial in Confidence <strong>Expression</strong> <strong>of</strong> <strong>Interest</strong> <strong>Brief</strong>
Table 6: Metcard Fares Effective until 31 December 2008<br />
Zone 1 Zone 2 Zone 1 + 2<br />
Full Fare Concession Full Fare Concession Full Fare Concession<br />
2 hour $3.50 $2.20 $2.70 $1.60 $5.50 $3.10<br />
Daily $6.50 $3.50 $4.60 $2.60 $10.10 $5.30<br />
10 x 2 hour $28.00 $14.00 $19.20 $9.60 $47.40 $23.70<br />
5 x Daily $28.00 $14.00 $19.20 $9.60 $47.40 $23.70<br />
Weekly $28.00 $14.00 $19.20 $9.60 $47.40 $23.70<br />
Monthly $104.40 $52.50 $70.00 $35.00 $161.00 $80.50<br />
Yearly $1,117.00 - $748.00 - $1,722.00 -<br />
Table 7: Other Metcard Fares effective until 31 December 2008<br />
Zone 1 Zone 2 Zone 1 + 2<br />
Full Fare Concession Full Fare Concession Full Fare Concession<br />
Off Peak Daily - - - - $9.50 $4.75<br />
Seniors Daily<br />
(zones 1+2)<br />
- - - - - $3.30<br />
Sunday Saver - - - - $2.90 -<br />
10 x Early Bird* $0<br />
5 x Weekend Daily - - - - $14.50 -<br />
Group Traveller - - - - - $27.20<br />
City Saver $2.60 $1.50 Available within City Saver zone only<br />
City Saver x 10 $20.80 $10.40 Available within City Saver zone only<br />
Note: People travelling on the train network will travel for free when they use the Early Bird fare -<br />
to avail themselves <strong>of</strong> this fare, passengers must complete their journey by 7am.<br />
47
Figure 11: Proportion <strong>of</strong> Metropolitan Full Fare and<br />
Concession Revenue and Ticket Sales<br />
Farebox Revenue<br />
Metcard Sales<br />
Concession<br />
28%<br />
Full Fare<br />
28%<br />
Full Fare<br />
48%<br />
Concession<br />
52%<br />
A vast retail network has been<br />
developed to enable Metcards to be<br />
purchased prior to travel. The existing<br />
retail network has approximately 900<br />
retailers, for example convenience<br />
stores, newsagents and other retail<br />
outlets strategically distributed<br />
throughout metropolitan Melbourne.<br />
In addition to the retail network,<br />
tickets can be pre-purchased from:<br />
• customer service centres at<br />
staffed train stations;<br />
• Metcard ticket machines at train<br />
stations and tram super stops;<br />
• the MetShop, located in<br />
the Town Hall in Melbourne<br />
Central Business District;<br />
If passengers do not pre-purchase<br />
their ticket prior to boarding, a<br />
limited range <strong>of</strong> tickets are available<br />
for purchase from coin only ticket<br />
vending machines on board trams,<br />
or from the driver on buses.<br />
All revenue collected from the sale <strong>of</strong><br />
Metcards is currently pooled into the<br />
‘Metropolitan Farebox’, and allocated<br />
between the train, tram and bus.<br />
V/Line Passenger and regional bus<br />
services currently operate separate<br />
ticketing systems, with tickets either<br />
machine printed or hand written by<br />
staff. Revenue from these tickets<br />
is retained by V/Line Passenger or<br />
the regional bus company and is<br />
outside the ‘Metropolitan Farebox’.<br />
• the internet, via the Metlink website;<br />
• the Metcard telephone helpline; and<br />
• commuter clubs, which enable<br />
registered organisations to<br />
purchase yearly tickets for their<br />
staff at a discounted rate.<br />
48<br />
Commercial in Confidence <strong>Expression</strong> <strong>of</strong> <strong>Interest</strong> <strong>Brief</strong>
Figure 12: Proportion <strong>of</strong> Revenue by zone 2006/07 144<br />
100%<br />
14<br />
1.5 1.5 100<br />
Proportion <strong>of</strong> revenue by zone<br />
90%<br />
80%<br />
70%<br />
60%<br />
50%<br />
40%<br />
30%<br />
20%<br />
49<br />
34<br />
10%<br />
0%<br />
Zone 1 Zone 1/2 Zone 2 Sunday<br />
Saver<br />
City<br />
Saver<br />
Total<br />
Ticket Type<br />
Figure 13: Metcard Sales Revenue by Channel 2006/07 147<br />
100%<br />
90%<br />
10<br />
8<br />
3<br />
3 100<br />
Proportion <strong>of</strong> Metcard Revenue<br />
80%<br />
70%<br />
60%<br />
50%<br />
40%<br />
30%<br />
20%<br />
57<br />
19<br />
10%<br />
0%<br />
Train Station<br />
Retail Agent<br />
Bus<br />
Tram<br />
Commuter<br />
Bulk Agent<br />
Total<br />
Metcard Sales Channel<br />
49
2.6.2 Existing Ticketing System<br />
OneLink Transit Systems Pty Ltd<br />
(OneLink), a consortium consisting<br />
<strong>of</strong> ERG Australia (Perth), Fujitsu<br />
Australia, Mayne Nickless (Armaguard)<br />
and the National Australia Bank were<br />
awarded the contract to design, install<br />
and operate the Metcard ticketing<br />
system in 1993. Onelink currently<br />
hold the contract for the current<br />
ticketing system and are responsible<br />
for ensuring the ticketing system:<br />
• operates at the agreed<br />
level <strong>of</strong> availability;<br />
• provides a wide distribution<br />
<strong>of</strong> tickets; and<br />
• accounts for all revenue collected<br />
from the train stations and<br />
ticket vending machines.<br />
The OneLink Contract was due to expire<br />
in March 2007 but has been extended<br />
for a period <strong>of</strong> up to five years to enable<br />
sufficient time for the roll-out <strong>of</strong> the<br />
new ticketing system. Management<br />
<strong>of</strong> the OneLink Contract transferred<br />
to the <strong>Transport</strong> Ticketing Authority in<br />
2007, prior to this, Metlink managed<br />
the contract on behalf <strong>of</strong> the State.<br />
The performance <strong>of</strong> the existing<br />
ticketing system is monitored and<br />
reported on as part <strong>of</strong> the OneLink<br />
contract. The Customer Defined<br />
Availability targets represent the<br />
minimum levels <strong>of</strong> acceptable availability<br />
and performance <strong>of</strong> the ticketing<br />
system and allow for specified levels<br />
<strong>of</strong> non-availability due to maintenance,<br />
servicing and breakdowns.<br />
The status <strong>of</strong> ticketing equipment<br />
at railway stations is automatically<br />
monitored via communication lines<br />
to OneLink, therefore all failures are<br />
known immediately and repairs or<br />
services can be undertaken rapidly.<br />
Mobile equipment on-board trams and<br />
buses do not have the performance<br />
communication link to OneLink,<br />
therefore failures are not known as<br />
readily, and as the vehicle must be made<br />
available to OneLink for repairs, the<br />
repairs are not performed as rapidly 148 .<br />
The performance <strong>of</strong> the ticketing<br />
system, as well as the train, tram and<br />
bus operators is reported in ‘Track<br />
Record’, a monthly bulletin and quarterly<br />
publication produced by DOT to report<br />
on the performance <strong>of</strong> <strong>Victoria</strong>’s train,<br />
tram and bus services. The bulletin<br />
is available on the DOT website each<br />
month, with a quarterly publication<br />
released at the end <strong>of</strong> each quarter.<br />
50<br />
Commercial in Confidence <strong>Expression</strong> <strong>of</strong> <strong>Interest</strong> <strong>Brief</strong>
Table 8: Customer Defined Availability Targets for Ticketing<br />
Equipment - Railway Stations (%) 07/2004 – 06/2007 149<br />
Device Target H2 04 H1 05 H2 05 H1 06 H2 06 H1 07<br />
Vending Machines 98.26 99.0 98.7 98.7 98.7 98.7 98.5<br />
Validators 99.47 99.7 99.5 99.5 99.6 99.5 99.4<br />
Table 9: Customer Defined Availability Targets for Mobile<br />
Ticketing Equipment (%) 07/2004 – 06/2007 150<br />
Mode Device H2 04 H1 05 H2 05 H1 06 H2 06 H1 07<br />
Tram Vending Machines 94.7 93.3 93.2 92.6 91.8 90.6<br />
Validators 96.7 96.3 96.5 98.2 98.0 97.8<br />
Bus Vending Machines 99.7 99.7 99.7 99.7 99.7 99.6<br />
Validators 99.9 99.9 99.8 99.8 99.8 99.5<br />
2.6.3 New Ticketing System<br />
The new ticketing solution, referred<br />
to as ‘myki’ (pronounced my key), will<br />
be a fully integrated system which<br />
incorporates all ticket types, zones,<br />
fares and concessions across <strong>Victoria</strong>.<br />
It will replace both Metcard and current<br />
V/Line Passenger ticketing as well<br />
as the current regional bus ticketing<br />
in a number <strong>of</strong> regional towns.<br />
The <strong>Transport</strong> Ticketing Authority<br />
(TTA) is the State body responsible<br />
for the design and delivery <strong>of</strong> myki.<br />
In July 2005, TTA awarded Kamco,<br />
the Keane Australia Micropayment<br />
Consortium Pty Ltd, the contract to<br />
design, deliver and manage the new<br />
public transport ticketing solution.<br />
In developing myki, TTA is working<br />
closely with the incumbent tram and<br />
train operators as well as V/Line, the<br />
Bus Association and Metlink to ensure<br />
a smooth introduction <strong>of</strong> the system.<br />
The current expected delivery date for<br />
myki has been projected to be in 2010.<br />
2.7 Patronage<br />
2.7.1 Patronage Trends<br />
In the 2006/07 financial year, 418.5<br />
million trips were made on Melbourne’s<br />
metropolitan public transport; 333.5<br />
million <strong>of</strong> these were on the tram and<br />
train. The metropolitan train business<br />
has experienced the greatest rate <strong>of</strong><br />
patronage growth increasing by 23<br />
percent over the two years to 2006/07,<br />
equivalent to 11 percent per annum 153 .<br />
This is quite dramatic growth, with long<br />
term patronage growth averaging 1.8<br />
percent per annum 154 . From 1998/99 to<br />
2006/07 metropolitan train patronage<br />
increased by more than 50 percent 155 .<br />
In the two years to 2006/07 patronage<br />
on the metropolitan trams increased<br />
by almost seven percent. Over the<br />
12 months to December 2007, tram<br />
patronage increased by 5.5 percent.<br />
Tram patronage is increasing at<br />
a higher rate than the compound<br />
annual growth rate <strong>of</strong> three percent<br />
over the past ten years 156 .<br />
51
Patronage on metropolitan buses has<br />
remained fairly stable over the last<br />
seven years, however the new Smartbus<br />
routes have contributed to bus<br />
patronage increasing by six percent over<br />
the 12 months to December 2007 157 .<br />
Patronage increases across the<br />
metropolitan public transport<br />
network have occurred on both<br />
peak and non-peak services.<br />
A number <strong>of</strong> factors are believed<br />
to influence this increased growth<br />
in patronage including:<br />
higher petrol prices: petrol prices have<br />
steadily increased in Melbourne from<br />
an average <strong>of</strong> 94.2 cents per litre in<br />
January 2005 159 to an average <strong>of</strong> 140.5<br />
cents per litre in January 2008 160 ;<br />
• increased population growth: over<br />
the ten years to 2007, the population<br />
in Melbourne has steadily increased<br />
by at least one percent per annum;<br />
• increased employment growth<br />
in Melbourne CBD: over the six<br />
years to 2006, total employment in<br />
Melbourne CBD has increased by 18<br />
percent, <strong>of</strong> which 10 percent was<br />
during the two years to 2006 161 ;<br />
• increased interest rates:<br />
household budgets have been<br />
tightened as a result <strong>of</strong> increased<br />
mortgage repayments, with the<br />
Reserve Bank <strong>of</strong> Australia increasing<br />
<strong>of</strong>ficial interest rates incrementally<br />
from 4.25 percent in May 2002 to<br />
7.25 percent in March 2008 162 ;<br />
• increased cost <strong>of</strong> long-term<br />
parking in the CBD: in 2006<br />
the State introduced a Long<br />
Stay Car Park Levy <strong>of</strong> AUD$400<br />
per annum, which increased to<br />
AUD$800 per annum in 2007,<br />
to encourage commuters who<br />
frequently drive to the city and park<br />
all day to consider other options,<br />
such as public transport 163 ;<br />
• increasing environmental<br />
awareness in the community:<br />
increased publicity and commentary<br />
on the issues <strong>of</strong> global warming<br />
and climate change has increased<br />
awareness <strong>of</strong> our environmental<br />
footprint and the impact <strong>of</strong> individuals<br />
on the environment. This awareness<br />
is encouraging people to select<br />
more sustainable travel behaviours,<br />
such as walking, cycling and public<br />
transport. The State is assisting<br />
with this through its TravelSmart<br />
program which aims to make people<br />
more aware <strong>of</strong> their public transport<br />
options, the benefits <strong>of</strong> these options<br />
and how best to use them 164 ;<br />
• the abolition <strong>of</strong> metropolitan<br />
zone 3 ticketing in March 2007:<br />
introduced as part <strong>of</strong> the State’s<br />
‘Fare Go Package’, the phasing<br />
out <strong>of</strong> zone 3 ticketing reduced<br />
metropolitan public transport ticket<br />
prices by up to 50 percent 165 ;<br />
52<br />
Commercial in Confidence <strong>Expression</strong> <strong>of</strong> <strong>Interest</strong> <strong>Brief</strong>
Table 10: Metropolitan Melbourne <strong>Public</strong> <strong>Transport</strong> Patronage 1999/00 – 2006/07 158<br />
millions 1999/00 2000/01 2001/02 2002/03 2003/04 2004/05* 2005/06^ 2006/07<br />
Tram 127.3 129.4 131.9 134.7 135.9 145.3 149.6 154.9<br />
Train 124.2 130.3 131.8 133.8 134.9 145.1 159.1 178.6<br />
Bus** 79.1 85.0<br />
Total 387.8 418.5<br />
* Patronage estimates from 2004/05 are based on the new measurement methodology, which involves factoring<br />
up ticket validations from the Automatic Ticketing System database.<br />
**The methodology for calculating patronage on Metropolitan Buses changed in 2005/06. Results prior to this<br />
are inconsistent with trends and have been excluded.<br />
^ Patronage figures exclude the impact <strong>of</strong> the Commonwealth Games.<br />
• free travel on metropolitan<br />
public transport and some regional<br />
services for Senior Citizens on<br />
Sundays from August 2006;<br />
• additional peak and shoulder<br />
peak train services: additional<br />
services were included in the 2007<br />
timetable to increase capacity and<br />
alleviate the overcrowding occurring<br />
during the peak services; and<br />
• increased operating hours: in<br />
2007, tram and train services were<br />
extended by one hour on Friday<br />
and Saturday evenings, providing<br />
more services to public transport<br />
users and <strong>of</strong>fering a viable option<br />
to taxis or the Nightrider bus.<br />
It is anticipated that these factors will<br />
continue to influence public transport<br />
patronage, with patronage forecast<br />
to increase again in 2007/08.<br />
Should petrol prices decrease, train<br />
patronage forecasts suggests growth<br />
will continue at 3.5 percent per<br />
annum in the short to mid term.<br />
Over the last few years patronage<br />
growth has exceeded forecasts,<br />
therefore to ensure the forecast<br />
provides a better indication <strong>of</strong> expected<br />
patronage; it is periodically revised.<br />
The forecasts provided in Table 11 are<br />
indicative only and will be periodically<br />
revised to incorporate current trends.<br />
53
Total Annual Patronage (thousan<br />
300<br />
250<br />
200<br />
150<br />
100<br />
50<br />
Train & Tram Patronage<br />
100<br />
80<br />
60<br />
40<br />
20<br />
verage Pump Price (cents)<br />
0<br />
0<br />
2000 2001 2002 2003 2004 2005 2006 2007<br />
Figure 14: Tram and Train Patronage Growth Plotted with Changes to Fuel Price and <strong>Interest</strong> Rates Financial 1999/00 Year – 2006/07<br />
166 167<br />
400<br />
Fuel Price and Rail Patronage Trend<br />
140<br />
400<br />
<strong>Interest</strong> Rates and Rail Patronage Trend<br />
7%<br />
Total Annual Patronage (thousands)<br />
350<br />
300<br />
250<br />
200<br />
150<br />
100<br />
50<br />
Fuel Prices<br />
Train & Tram Patronage<br />
120<br />
100<br />
80<br />
60<br />
40<br />
20<br />
Average Pump Price (cents)<br />
Total Annual Patronage (thousands)<br />
350<br />
300<br />
250<br />
200<br />
150<br />
100<br />
50<br />
Train & Tram Patronage<br />
<strong>Interest</strong> Rates<br />
6%<br />
5%<br />
4%<br />
3%<br />
2%<br />
1%<br />
<strong>Interest</strong> Rates<br />
0<br />
2000 2001 2002 2003 2004<br />
2005 2006 2007<br />
0<br />
0<br />
2000 2001 2002 2003 2004<br />
2005 2006 2007<br />
0%<br />
Financial Year<br />
Financial Year<br />
<strong>Interest</strong> Rates and Rail Patronage Trend<br />
400<br />
7%<br />
Table 11: Metropolitan <strong>Public</strong> <strong>Transport</strong> Patronage Forecasts 2007/08 to 2009/2010 168<br />
350<br />
<strong>Interest</strong> Rates<br />
6%<br />
Total Annual Patronage (thousands)<br />
300<br />
2006/07 2007/08 2008/09* 2009/10* 2010/2011*<br />
Tram250<br />
154.9 161.1 167.5 174.6 181.9<br />
4%<br />
Train<br />
200 Train & 178.6 Tram Patronage 198.2 218 235.2 253.8<br />
Bus 85.0 89.2 93.7 3%<br />
96.9 100.3<br />
150<br />
Total metro 418.5 448.2 478.9 506.4 535.7<br />
2%<br />
100<br />
* Long run growth rates are applied to the previous year’s forecast to calculate the forecast figures. The long<br />
run growth 50 rates represent the average annual growth expected 1% over a five year period and will change annually.<br />
Growth rates in individual years may be higher or lower than the average. Long run growth rates changed in March 2008.<br />
0<br />
0%<br />
2000 2001 2002 2003 2004 2005 2006 2007<br />
5%<br />
<strong>Interest</strong> Rates<br />
Financial Year<br />
54<br />
Commercial in Confidence <strong>Expression</strong> <strong>of</strong> <strong>Interest</strong> <strong>Brief</strong>
2.7.2 Impact <strong>of</strong> Patronage<br />
Increase<br />
The rapid patronage growth on<br />
the metropolitan train network has<br />
resulted in increased overcrowding,<br />
particularly in the morning peak<br />
period (the period between 7:01<br />
and 9:30 Monday to Friday) when<br />
the network is at its busiest.<br />
The extent <strong>of</strong> the overcrowding on the<br />
metropolitan train network was shown in<br />
the half yearly Load Survey - performed<br />
to monitor overcrowding. Under the<br />
existing franchise agreement, a load<br />
breach is considered to occur if during<br />
a given hour, the average number <strong>of</strong><br />
passengers per train exceeds 798.<br />
Crowding levels are measured at the<br />
stations on the fringes <strong>of</strong> the CBD,<br />
where trains are at their most crowded<br />
heading into or out <strong>of</strong> the city 171 . The<br />
October 2007 survey identified 28<br />
breaches, with a further nine loads<br />
within five percent <strong>of</strong> the Average<br />
Maximum Capacity 169 . This compares<br />
to just five breaches in 2004 170 .<br />
A new timetable was introduced in<br />
September 2007 which may account<br />
for part <strong>of</strong> the drop observed from<br />
the survey conducted in May 2007.<br />
Metropolitan trams have not experienced<br />
the same level <strong>of</strong> patronage growth as<br />
the metropolitan trains over the last<br />
few years and therefore have not had<br />
the same levels <strong>of</strong> overcrowding. The<br />
impact <strong>of</strong> the increased patronage<br />
has however, started to increase<br />
overcrowding with the last annual<br />
services survey (undertaken in October<br />
2007) showing an increase in the<br />
number <strong>of</strong> services with average loads<br />
above the maximum desired capacity 172 .<br />
In 2007 there were five routes running<br />
above the average maximum capacity<br />
at some part <strong>of</strong> the day, with another<br />
four routes within 10 percent <strong>of</strong><br />
the average maximum capacity.<br />
Additional bus and train services are<br />
being incorporated into the timetable<br />
to reduce the number <strong>of</strong> load standard<br />
breaches - as illustrated by the increase<br />
in total scheduled kilometres.<br />
Figure 15: Metropolitan Trains Rolling Hour Loads Above<br />
Desired Maximum 2001-2007, Peak Services Only<br />
40<br />
Rolling hour loads above desired maximum<br />
35<br />
30<br />
25<br />
20<br />
15<br />
10<br />
5<br />
PM Peak<br />
AM Peak<br />
5 6<br />
7 7<br />
12<br />
23<br />
36<br />
28<br />
0<br />
2001<br />
2002<br />
2003 2004<br />
2005 2006 May-07 Oct-07<br />
Year<br />
55
Table 12: Metropolitan Melbourne <strong>Public</strong> <strong>Transport</strong> Total Scheduled Kilometres 1999/00 – 2007/08 (millions) 173<br />
1999/00 2000/01 2001/02 2002/03 2003/04 2004/05 2005/06 2006/07 2007/08 Target<br />
Tram 22.2 21.3* 21.6 22.0 22.5 21.9 23.1 23.1 23.1<br />
Train 15.7 16.3 16.6 16.8 17.0 16.7 17.2 17.2 17.8<br />
Bus 68.4 69.2 70.4 73.5 74.9 75.2 76.9 83.6 92.2<br />
* Note: the reduction in kilometres was due to an amalgamation <strong>of</strong> routes.<br />
2.8 Revenue<br />
2.8.1 Metropolitan<br />
Farebox Revenue<br />
All revenue collected from the sale<br />
<strong>of</strong> Metcards is currently pooled into<br />
the ‘Metropolitan Farebox’, and once<br />
expenses have been deducted, the<br />
net farebox is allocated between<br />
the metropolitan train, tram and<br />
bus organisations on a fixed<br />
revenue split. The split under the<br />
current arrangements, as detailed<br />
in the current Revenue Sharing<br />
Agreement, is 40/40/20. The 20<br />
percent allocated for bus, is paid<br />
to the State, as it has separate<br />
contracts with each bus operator.<br />
Items that are currently deducted<br />
from the gross metropolitan Farebox<br />
include amounts collected from<br />
the sale <strong>of</strong> special event tickets,<br />
including Spring Racing Carnival<br />
tickets or Melbourne Show Tickets<br />
and; service payments to V/Line<br />
Passenger for the sale <strong>of</strong> Metcards<br />
from V/Line Passenger stations.<br />
The net metropolitan Farebox<br />
and the division between each <strong>of</strong><br />
the operators from 2004/05 to<br />
2006/07 are provided in Table 13.<br />
Total Farebox revenue increased<br />
by 24 percent over the period<br />
from 2004/05 to 2006/07 despite<br />
the removal <strong>of</strong> the zone 3 fares.<br />
This increase is attributable to a<br />
number <strong>of</strong> factors including:<br />
• the annual CPI price<br />
increases on the tickets;<br />
• increased patronage; and<br />
• decreased fare evasion.<br />
56<br />
Commercial in Confidence <strong>Expression</strong> <strong>of</strong> <strong>Interest</strong> <strong>Brief</strong>
Fare Evasion<br />
Fare evasion on Melbourne’s public<br />
transport costs millions every year. With<br />
the roll-out <strong>of</strong> the current metropolitan<br />
ticketing system in 1996-98, it was<br />
envisaged the public transport network,<br />
particularly the metropolitan train<br />
network, would become more secure<br />
and reduce fare evasion. Validator<br />
gates were introduced at a number <strong>of</strong><br />
suburban train stations, positioned at<br />
the entry and exit points <strong>of</strong> stations.<br />
When closed, the gates require a valid<br />
Metcard to open. Access to all CBD<br />
stations as well as some <strong>of</strong> the larger<br />
suburban stations have been closed.<br />
While metropolitan trams use the same<br />
ticketing system, it is fundamentally<br />
an open tram system that does not<br />
require a valid ticket to enable entry<br />
or exit <strong>of</strong> the vehicle. In the absence<br />
<strong>of</strong> staff on board, the purchase or<br />
validation <strong>of</strong> tickets onboard requires<br />
honesty, education and persuasion.<br />
To monitor and estimate the rate <strong>of</strong><br />
fare evasion in the metropolitan public<br />
transport network, Metlink, on behalf<br />
<strong>of</strong> the State, undertakes a survey <strong>of</strong><br />
approximately 35,000 passengers over<br />
two six month periods. The first half<br />
(H1) captures the period from January<br />
to June, while the second half (H2)<br />
the period from July to December.<br />
While fare evasion in Melbourne<br />
costs millions every year, strategies<br />
implemented by the State (in conjunction<br />
with Metlink and the train, tram and<br />
bus operators) to reduce fare evasion<br />
are working, with the estimated cost<br />
<strong>of</strong> fare evasion reducing from about<br />
AUD$55 million in 2005/06 to AUD$48<br />
million in 2006/07 175 . The Metlink<br />
surveys showed that total fare evasion<br />
on public transport fell from 13.6<br />
percent in the second half <strong>of</strong> 2005, to<br />
10.9 percent in the first half <strong>of</strong> 2007.<br />
The rate <strong>of</strong> fare evasion on trains is<br />
improving, consistently decreasing over<br />
the period the fare evasion surveys<br />
have been conducted from 13.5<br />
percent in the first half <strong>of</strong> 2005, to 9.6<br />
percent in the second half <strong>of</strong> 2006.<br />
Fare evasion on trains did peak again<br />
however, to 13.4 percent in the first<br />
half <strong>of</strong> 2007 176 . This may have been<br />
due to the increased congestion on<br />
trains leading to difficulties associated<br />
with checking tickets, or due to<br />
customer dissatisfaction with service<br />
delivery during this period stemming<br />
from increased cancellations resulting<br />
from rolling stock brake failures.<br />
57
Table 13: Metropolitan Farebox Revenue 2004/05 – 2006/07 174<br />
Financial Year Metropolitan Farebox Metropolitan<br />
Trams Share<br />
$ (millions) % Growth<br />
Metropolitan<br />
Trains Share<br />
2004/05 $372M $149M $149M $74M<br />
2005/06 $406M 9% $162M $162M $82M<br />
2006/07 $462M 14% $185M $185M $92M<br />
All amounts exclude GST.<br />
State’s Share<br />
177 178<br />
Table 14: Estimated Metropolitan Fare Evasion Levels 2005 – 2007<br />
H1 05 H2 05 H1 06 H2 06 H1 07<br />
Tram 19.4% 15.3% 13.2% 11.1% 9.2%<br />
Train 13.5% 10.8% 10.6% 9.6% 13.4%<br />
Bus - 16.1% 9.9% 8.2% 8.1%<br />
Metropolitan Network* - 13.6% 11.5% 9.9% 10.9%<br />
*The fare evasion levels for the metropolitan network are the weighted average from the train, tram and bus results.<br />
The reductions in fare evasion<br />
are believed to be the result <strong>of</strong> a<br />
combination <strong>of</strong> factors including:<br />
• the Metlink advertising campaigns<br />
encouraging validation and the<br />
pre-purchase <strong>of</strong> Metcards;<br />
• additional staff available at<br />
premium stations and platform<br />
stops to <strong>of</strong>fer assistance;<br />
• design changes at key stations,<br />
making it easier to purchase<br />
tickets and making it harder<br />
to avoid validating;<br />
• a change in passenger behaviour,<br />
moving to an increase in prepurchased<br />
tickets and increasing<br />
popularity <strong>of</strong> the multi-use ‘value’<br />
tickets, which have been influenced<br />
by advertising campaigns focusing<br />
on purchasing behaviours; and<br />
Authorised Officers (AO’s) are employed<br />
by both the tram and train operators<br />
to conduct ticket inspections. AO’s<br />
have the authority to ask to see a<br />
passenger’s ticket, while they are<br />
travelling on the train or tram and after<br />
they have just left the vehicle or the<br />
paid area <strong>of</strong> a station. AO’s work across<br />
the entire network, from the first to<br />
the last service seven days a week.<br />
AO’s are authorised under the <strong>Transport</strong><br />
Act to detect infringements and report<br />
them to the State, however being<br />
employees <strong>of</strong> a private organisation,<br />
they are not able to directly issue fines.<br />
Where an infringement is detected,<br />
the AO records the passenger’s details<br />
with the details <strong>of</strong> the infringement<br />
in a Report <strong>of</strong> Non Compliance;<br />
which is submitted to the State who<br />
determines whether a fine is to be<br />
issued. Should a fine be issued, the<br />
State contacts the passenger via mail.<br />
• the role <strong>of</strong> the Authorised Officers in<br />
actively discouraging fare evasion.<br />
58<br />
Commercial in Confidence <strong>Expression</strong> <strong>of</strong> <strong>Interest</strong> <strong>Brief</strong>
2.9 Performance<br />
2.9.1 Punctuality and Reliability<br />
The performance <strong>of</strong> the metropolitan<br />
trains in terms <strong>of</strong> punctuality and<br />
reliability has been impacted by<br />
a number <strong>of</strong> key factors over<br />
the last few years, such as:<br />
• in 2004/05 both reliability and<br />
punctuality were impacted by a driver<br />
shortage and problems experienced<br />
with new rolling stock which caused<br />
delays and cancellations, resulting<br />
in an average <strong>of</strong> 1.3 percent <strong>of</strong><br />
scheduled services cancelled;<br />
• in 2006/07 a decline in reliability<br />
predominantly due to the temporary<br />
withdrawal <strong>of</strong> 31 Siemens trains<br />
from service due to a fault with the<br />
braking system and the temporary<br />
speed restrictions imposed on the<br />
impacted trains once they returned<br />
to service. Once these trains were<br />
operational again, reliability improved<br />
to 99.3 percent in the June quarter;<br />
• the larger than anticipated growth in<br />
patronage over the last three years,<br />
is believed to have increased dwell<br />
times. With more time required to<br />
load and unload passengers, the<br />
punctuality <strong>of</strong> the services has<br />
deteriorated over the period; and<br />
• construction work at Flinders<br />
Street Station and the complete<br />
remodelling <strong>of</strong> Southern Cross<br />
Station during the period<br />
2004-2007 also had considerable<br />
impact on the ability to deliver<br />
services on time. Other projects<br />
undertaken on the infrastructure<br />
also impacted punctuality.<br />
The metropolitan trams have performed<br />
consistently well since management <strong>of</strong><br />
the entire network was amalgamated<br />
in 2004. In 2006/07, only 0.2 percent<br />
<strong>of</strong> scheduled services were cancelled,<br />
with 99.8 percent running as scheduled.<br />
When measured as an average across<br />
the whole tram journey, punctuality was<br />
at 82.7 percent only slightly dropping<br />
from the 82.9 percent in 2005/06.<br />
Despite the impacts <strong>of</strong> increased<br />
road congestion and patronage, the<br />
metropolitan trams have consistently<br />
performed at least 30 percent better<br />
than when managed by the <strong>Public</strong><br />
<strong>Transport</strong> Corporation in 1998 179 .<br />
59
Table 15: Proportion <strong>of</strong> Scheduled Services Delivered 1999/00 – 2006/07 180<br />
1999/00* 2000/01* 2001/02* 2002/03 2003/04 2004/05 2005/06 2006/07<br />
Tram Actual 99.3 99.3 98.9 99.6 99.6 99.4 99.7 99.8<br />
Train Actual 99.6 99.4 99.2 99.6 98.8 98.7 99.1 98.9<br />
* Results shown are the averaged performance <strong>of</strong> the two operators.<br />
Table 16: Proportion <strong>of</strong> Tram and Train Services Arriving within the Required Timeframe 1999/00 – 2006/07 181<br />
99/00* 00/01* 01/02* 02/03 03/04 04/05 05/06 06/07<br />
Tram 1 Actual 90.8 92.0 94.8 91.2 93.5<br />
Tram 2 Actual 75.0 75.0 74.7 68.1 67.6<br />
Tram 3 82.0- 82.0- 82.0-<br />
Train^ Actual 96.5 96.6 96.2 96.9 95.9 93.9 93.0 92.2<br />
^ Train services arriving at destination no more than 59 seconds before and less than five minutes 59 seconds after timetable.<br />
^^ During the first franchise period, tram timeliness was assessed at two points: Services departing a monitoring point (Tram1) no more than 59 seconds<br />
before and less than 5 minutes 59 seconds after timetable at the 2nd monitoring point, (Tram2) and the 2nd last monitoring point. The results for<br />
these periods are presented in that order. From the 2004 Franchise (Tram 3), the measurement <strong>of</strong> timeliness was changed to the average <strong>of</strong> tram<br />
services departing the 2nd, 3rd and 4th monitoring points no more than 59 seconds before, and less than 5 minutes 59 seconds after timetable.<br />
* Results shown are the averaged performance <strong>of</strong> the two operators.<br />
2.9.2 Customer Satisfaction<br />
To measure how satisfied public<br />
transport customers are with the service<br />
provided by the transport operators,<br />
the Director <strong>of</strong> <strong>Public</strong> <strong>Transport</strong><br />
commissions a customer satisfaction<br />
survey every month. Interviewees are<br />
randomly selected in areas where the<br />
train, tram, bus and coach services<br />
operate and are asked to indicate<br />
their usual public transport usage and<br />
their level <strong>of</strong> satisfaction with specific<br />
aspects <strong>of</strong> public transport. Interviewees<br />
are asked questions relating to:<br />
• service delivery;<br />
• railway stations or tram or bus stops;<br />
• passenger comfort;<br />
• ticketing;<br />
• information services<br />
(including timetables);<br />
• personal safety;<br />
• value for money; and<br />
• staff service.<br />
60<br />
Commercial in Confidence <strong>Expression</strong> <strong>of</strong> <strong>Interest</strong> <strong>Brief</strong>
Figure 16: Metropolitan Trains Customer Satisfaction and Number <strong>of</strong> Load Breaches<br />
Metropolitan Train Punctuality<br />
98<br />
97<br />
96<br />
95<br />
94<br />
93<br />
92<br />
91<br />
90<br />
89<br />
Train Punctuality<br />
Customer<br />
Satisfaction<br />
72<br />
70<br />
68<br />
66<br />
64<br />
62<br />
60<br />
58<br />
Metropolitan Train Customer Satisfaction (%)<br />
2000 2001 2002 2003 2004<br />
2005 2006 2007<br />
Financial Year<br />
Overall customer satisfaction on the<br />
metropolitan trains has been steadily<br />
decreasing since 2002/03. The decline<br />
from 71.3 percent in 2002/03 to 62.5<br />
percent in 2006/07 is attributable<br />
to lower than expected operational<br />
performance (reliability and punctuality)<br />
and overcrowding on some peak<br />
services. Steps have been taken to<br />
reduce overcrowding on peak services,<br />
with additional peak and shoulder peak<br />
train services, as well as extending<br />
Friday and Saturday night services<br />
to ease some <strong>of</strong> the overcrowding.<br />
Overall customer satisfaction on the<br />
metropolitan trams has remained<br />
steady, reflecting the consistent<br />
operational performance. To improve<br />
customer satisfaction, a number <strong>of</strong><br />
customer focussed activities were rolled<br />
out in 2006/07 by the tram operator.<br />
Table 17: Metropolitan Trams and Trains Customer Satisfaction Index 1999/00 – 2006/07 182<br />
99/00* 00/01* 01/02* 02/03 03/04 04/05 05/06** 06/07<br />
Tram Actual 69.4 69.6 71.2 71.6 70.6 71.2 70.3 70.5<br />
Train Actual 70.4 69.4 71.2 71.3 68.8 65.4 64.4 62.5<br />
* Results shown are the averaged performance <strong>of</strong> the two train operators or two tram operators<br />
** The 2005/06 targets were stretch targets, which were not achieved.<br />
61
2.9.3 ‘Track Record’<br />
Overall performance <strong>of</strong> the <strong>Victoria</strong>n<br />
<strong>Public</strong> <strong>Transport</strong> Network, as well<br />
as that <strong>of</strong> each <strong>of</strong> the operators,<br />
including the metropolitan trains and<br />
trams, is provided in the Department<br />
<strong>of</strong> <strong>Transport</strong> produced report ‘Track<br />
Record’. Released quarterly since<br />
August 1999, ‘Track Record’ provides<br />
a review <strong>of</strong> the performance <strong>of</strong><br />
<strong>Victoria</strong>’s <strong>Public</strong> <strong>Transport</strong> Services<br />
and covers punctuality and reliability,<br />
payments, customer satisfaction and<br />
performance <strong>of</strong> the Automatic Ticketing<br />
System. Current and previous editions<br />
<strong>of</strong> Track Record are available on<br />
DOT’s website, www.doi.vic.gov.au.<br />
2.10 Strategies to Improve<br />
Performance<br />
2.10.1 Metropolitan Trams<br />
The performance <strong>of</strong> the metropolitan<br />
trams has also been impacted by a<br />
number <strong>of</strong> factors, including route<br />
amalgamations, extensions to<br />
existing services, patronage growth<br />
and the increase in road congestion<br />
throughout Melbourne. Patronage<br />
growth have placed pressure on<br />
tram punctuality and resulted in<br />
overcrowding on some peak services.<br />
Increased traffic congestion means<br />
that the average speeds <strong>of</strong> trams<br />
is approximately 16 kilometres per<br />
hour through the network, with 82<br />
percent <strong>of</strong> the tram route sharing<br />
the road with other traffic.<br />
To reduce the impact <strong>of</strong> these factors<br />
on tram performance and customer<br />
satisfaction, the State, in collaboration<br />
with the current franchisee and other<br />
stakeholders, is considering a number <strong>of</strong><br />
ways to improve network performance.<br />
A joint initiative, called the Think<br />
Tram Program was implemented<br />
in 2004 in an attempt to increase<br />
average tram speeds and improve<br />
reliability, accessibility and safety<br />
along the busiest parts <strong>of</strong> the tram<br />
network 183 . Some activities undertaken<br />
as part <strong>of</strong> Think Tram are:<br />
• a multi media campaign to educate<br />
motorists about requirements<br />
when driving with trams;<br />
• altering intersection signaling to<br />
prioritise trams, with more than<br />
200 sets <strong>of</strong> traffic signals already<br />
adjusted to provide priority to trams;<br />
• introducing right turn bans and<br />
traffic light sequence changes;<br />
• installing physical barriers<br />
to prevent private vehicles<br />
encroaching on tracks;<br />
• improving stops to reduce<br />
passenger loading times 184 ;<br />
• reviewing motorists’ responsibilities<br />
when driving with trams and<br />
developing new ways to ensure<br />
motorists act safely around<br />
trams and have clear indications<br />
<strong>of</strong> when they can and cannot<br />
drive on tram tracks; and<br />
62<br />
Commercial in Confidence <strong>Expression</strong> <strong>of</strong> <strong>Interest</strong> <strong>Brief</strong>
• improving communication<br />
links between VicRoads traffic<br />
management centre and the<br />
Metropolitan Trams control centre 185 .<br />
Other initiatives that have been<br />
developed and recently implemented<br />
to improve customer satisfaction in the<br />
Melbourne tram operations include:<br />
• introducing Friday and Saturday<br />
late night tram services on all city<br />
and Chapel street routes and two<br />
additional Sunday morning trams<br />
between the city and St Kilda; and<br />
• a marketing campaign promoting<br />
a friendlier environment on trams<br />
and at trams stops and encouraging<br />
the reporting <strong>of</strong> anti-social<br />
behaviour, vandalism and graffiti.<br />
Additional uniformed and plain<br />
clothes police travelled on trams<br />
during the marketing campaign.<br />
The current focus to improve<br />
performance is on implementing<br />
initiatives that will:<br />
• improve fleet reliability;<br />
• reduce the number <strong>of</strong> services<br />
on routes considered to<br />
be over-serviced; and<br />
• improve fleet utilisation.<br />
In addition, to ease overcrowding<br />
on tram services, five new highcapacity,<br />
low floor trams have been<br />
leased from the town <strong>of</strong> Mulhouse in<br />
France by Yarra Trams, through its<br />
French shareholder Transdev, which<br />
operates Mulhouse’s tram network.<br />
All five are expected to be in service<br />
by September 2008, with the lease<br />
expiring in December 2011. Once the<br />
trams (which are manufactured by<br />
Alstom) arrive in Melbourne, minor<br />
modifications will be made to make them<br />
suitable for Melbourne’s conditions, for<br />
example, boosting the air-conditioning.<br />
2.10.2 Metropolitan Trains<br />
The State and the current franchisee are<br />
working closely to optimise performance<br />
within the existing network in response<br />
to increasing demand. A number <strong>of</strong><br />
responses have been identified to ease<br />
the immediate problems, while a longer<br />
term strategy is being developed.<br />
Responses to ease the<br />
immediate problems<br />
Given the long lead time to implement<br />
any substantial changes, (such as<br />
introducing additional rolling stock<br />
or infrastructure), the State, in<br />
collaboration with the current franchisee<br />
and stakeholders, have identified a<br />
number <strong>of</strong> short term responses to<br />
ease the strain on the current network,<br />
with a focus on the peak periods.<br />
These responses include the:<br />
• introduction from April 2008 <strong>of</strong> 105<br />
new weekly services including 45<br />
evening peak and 10 morning peak<br />
services, with at least another 95<br />
weekly services from November<br />
2008. The new services have<br />
been added to the Sandringham,<br />
Werribee, Dandenong, Pakenham,<br />
Glen Waverley and Frankston lines;<br />
63
• introduction <strong>of</strong> the Early Bird ticket.<br />
As detailed in Section 2.6 Fares and<br />
Ticketing, the Early Bird Ticket is<br />
an incentive program that provides<br />
free travel to train passengers who<br />
arrive at their destination prior to<br />
7am, to shift some <strong>of</strong> the peak<br />
travel to the pre-peak period;<br />
• refurbishment and operation<br />
<strong>of</strong> 14 Hitachi three-car units to<br />
ease some <strong>of</strong> the overcrowding<br />
on peak services; and<br />
• ‘Flex in the City’ promotion,<br />
encouraging people to adopt flexible<br />
working hours in the CBD to ease the<br />
proportion <strong>of</strong> workers coming into<br />
the CBD during the peak periods.<br />
A number <strong>of</strong> operational changes have<br />
been identified and are being rolled out<br />
over the course <strong>of</strong> 2008 to optimise<br />
the existing network and improve both<br />
reliability and capacity. The changes<br />
to improve reliability include:<br />
• adjusting the <strong>of</strong>ficial journey times<br />
through the CBD and at interchange<br />
stations, to ensure dwell times<br />
reflect the actual times required;<br />
• operating lines independently by<br />
removing conflicts and sharing<br />
platforms within the CBD to<br />
reduce the current wait times.<br />
This will impact the Caulfield<br />
and Northern Groups;<br />
• operating more lines directly<br />
to Flinders Street to reduce<br />
congestion in the loop, enabling<br />
more services to be introduced;<br />
• reversing the Clifton Hill Group<br />
morning city loop direction to remove<br />
the operational conflict currently<br />
experienced at Jolimont and assist<br />
with access around the loop for<br />
Northern Group passengers; and<br />
• potentially changing some<br />
V/Line Passenger services to<br />
skip North Melbourne Station,<br />
requiring passengers to interchange<br />
at Southern Cross Station.<br />
To improve capacity, the following<br />
strategies for increasing the<br />
number <strong>of</strong> trains available for peak<br />
periods will be implemented:<br />
• introduction <strong>of</strong> 18 X’trapolis<br />
6-car trains to commence<br />
service in late 2009;<br />
• introducing short distance trains<br />
to maximise use <strong>of</strong> rolling stock<br />
during peak times; and<br />
• changing the approach to<br />
maintenance to press more<br />
trains from the existing fleet into<br />
service - thereby maximising the<br />
number <strong>of</strong> trains available for<br />
the peak train services 187 .<br />
In response to the train driver shortage,<br />
the State, the current Franchise and<br />
the Rail Tram and Bus Union (RTBU)<br />
substantially increased its trainee driver<br />
intake. By June 2007, <strong>Victoria</strong> was the<br />
leading driver recruiter and trainer in<br />
Australia; with 78 drivers completing<br />
training in the 2007 financial year.<br />
Through MOTC, the State has also<br />
committed funds to provide an extra<br />
180 drivers up to November 2008 189<br />
to ensure continued service delivery.<br />
64<br />
Commercial in Confidence <strong>Expression</strong> <strong>of</strong> <strong>Interest</strong> <strong>Brief</strong>
2.11 Rolling Stock<br />
Procurement<br />
2.11.1 Metropolitan Trams<br />
As proposed in MOTC, the State plans<br />
to increase the current tram fleet, by<br />
purchasing new low floor trams. It is<br />
envisaged that upgrading the tram fleet<br />
will improve the operations, reliability<br />
and safety <strong>of</strong> the fleet. In conjunction<br />
with the continued construction <strong>of</strong> tram<br />
platform stops, barriers to travel for<br />
people with disabilities will be reduced.<br />
The current design life <strong>of</strong> Melbourne’s<br />
trams is 30 to 35 years <strong>of</strong> age.<br />
With the exception <strong>of</strong> the 95 trams<br />
delivered within the last five years,<br />
and the historical W Class trams,<br />
the remaining fleet <strong>of</strong> 347 trams<br />
progressively reaches the end <strong>of</strong> their<br />
design life between 2010 and 2030.<br />
In considering tram procurement, the<br />
State is also examining options to<br />
re-furbish the existing tram fleet.<br />
Implications for existing infrastructure<br />
The current fleet measures 9,506<br />
metres in length, while current stabling<br />
tracks measure 8,110 metres. As<br />
a result <strong>of</strong> this shortfall, trams are<br />
currently stabled in maintenance<br />
bays, on access tracks and on points,<br />
impacting the ready deployment <strong>of</strong><br />
trams and limiting the possibility <strong>of</strong><br />
night maintenance. This shortfall in<br />
stabling has arisen due to the:<br />
• retention <strong>of</strong> 31 Z1 and Z2 class<br />
trams intended for retirement,<br />
resulting in an additional 500<br />
metres <strong>of</strong> fleet length;<br />
• loss <strong>of</strong> stabling due to the creation<br />
<strong>of</strong> low floor maintenance bays<br />
from 2002 onwards; and<br />
• disposal <strong>of</strong> tram depots a number<br />
<strong>of</strong> years ago, following a period <strong>of</strong><br />
long term decline in tram patronage.<br />
In the event that longer, low floor<br />
trams replace retiring trams in the<br />
future procurement strategy, the<br />
fleet length will continue to increase,<br />
and is estimated to reach 12,500<br />
metres by 2030. This will place<br />
demands on depots for additional<br />
stabling and sufficient maintenance<br />
facilities for the low floor trams.<br />
Melbourne’s current depots <strong>of</strong>fer<br />
little opportunity for expansion, with<br />
the exception <strong>of</strong> the Glen Huntly<br />
and Brunswick depots. Additionally,<br />
many <strong>of</strong> the existing maintenance<br />
facilities will need to be reconfigured<br />
to cater for the different maintenance<br />
requirements and additional length<br />
<strong>of</strong> the low floor trams. Consequently,<br />
the total length <strong>of</strong> the maintenance<br />
bays or the length <strong>of</strong> available stabling<br />
will decrease at those depots. The<br />
State is preparing a depot strategy to<br />
investigate solutions to these issues.<br />
• replacement <strong>of</strong> 105 shorter<br />
trams with 95 longer trams from<br />
2002, resulting in an additional<br />
500 metres <strong>of</strong> fleet length;<br />
65
The procurement <strong>of</strong> new rolling stock<br />
will shift the makeup <strong>of</strong> the tram fleet,<br />
resulting in a larger proportion <strong>of</strong><br />
low floor trams. This is anticipated<br />
to impact other infrastructure<br />
requirements including power supply.<br />
Power supply is anticipated to<br />
potentially differ under the changing<br />
composition in the following ways:<br />
• additional supply will be required to<br />
enable a larger number <strong>of</strong> trams to<br />
run concurrently on the network;<br />
• additional power supply will be<br />
required on those parts <strong>of</strong> the<br />
network where old trams have<br />
been replaced with modern, large,<br />
air-conditioned trams; and<br />
• the newer trams should <strong>of</strong>fer<br />
some power regeneration savings<br />
to be captured through the<br />
introduction <strong>of</strong> energy storage<br />
devices (flywheels/capacitators)<br />
within the new substations.<br />
Other relatively minor infrastructure<br />
works may also be needed to<br />
accommodate the longer trams.<br />
Most <strong>of</strong> these works should be<br />
addressed in the planned or future<br />
planned expansion <strong>of</strong> the accessible<br />
tram platform stops, including:<br />
• ensuring tram stops, terminals<br />
and crossovers are consistent<br />
with the new tram length; and<br />
• modifying kerb-side stops for<br />
use by wheelchair users.<br />
2.11.2 Metropolitan Trains<br />
Initial analysis by the State determined<br />
that the long-term future <strong>of</strong> the<br />
railway requires trains <strong>of</strong> greater<br />
patronage capacity than that <strong>of</strong> the<br />
existing fleet. However, it is unlikely<br />
that these newly designed trains will<br />
enter service before mid 2012 or<br />
later, due to the long lead times in<br />
the procurement <strong>of</strong> rolling stock.<br />
Given the immediate demands on<br />
the network, and the limited scope<br />
for increasing peak service levels<br />
through improved train availability, an<br />
interim order for 18 X’Trapolis trains<br />
was placed with Alstom in 2007, for<br />
delivery in 2009, with introduction into<br />
services <strong>of</strong> the first train in late 2009.<br />
While much <strong>of</strong> Melbourne’s existing<br />
train network is already operating near<br />
capacity, it is envisaged the additional<br />
X’Trapolis trains will progressively ease<br />
overcrowding during the peaks by:<br />
• taking advantage <strong>of</strong> spare train<br />
paths where they currently exist;<br />
• simplifying train stopping<br />
patterns to increase the number<br />
<strong>of</strong> train paths available; and<br />
• progressively implementing targeted<br />
MOTC-funded and other capital<br />
works to increase track capacity.<br />
To enable the additional X’Trapolis trains<br />
to operate on the existing network, a<br />
number <strong>of</strong> infrastructure enhancements<br />
were identified. These included:<br />
66<br />
Commercial in Confidence <strong>Expression</strong> <strong>of</strong> <strong>Interest</strong> <strong>Brief</strong>
• additional stabling sidings - to<br />
optimise the utilisation <strong>of</strong> the<br />
existing rolling stock fleet requires<br />
the construction <strong>of</strong> additional and<br />
appropriately located stabling sidings,<br />
(ideally a 20 percent margin above<br />
the number required) to enable more<br />
effective management <strong>of</strong> the existing<br />
fleet, particularly in terms <strong>of</strong> capacity<br />
to re-marshal defective trains.<br />
Additionally, the current shortfall in<br />
stabling capacity means each new<br />
X’Trapolis train will also require a<br />
new stabling siding to be provided;<br />
an overall allowance <strong>of</strong> 20 percent<br />
will also be required to facilitate<br />
the marshalling <strong>of</strong> defective units;<br />
• an upgrade <strong>of</strong> traction power supply<br />
- a 14 percent increase in the number<br />
<strong>of</strong> morning peak services by 2012<br />
will require upgrading <strong>of</strong> the traction<br />
power supply system at a number <strong>of</strong><br />
locations. The State has identified<br />
sub-stations and other power<br />
supply assets that are operating<br />
at or above their design limit with<br />
current services and an estimate <strong>of</strong><br />
the required traction power supply<br />
upgrades has been made. Traction<br />
power supply upgrades will be made<br />
as part <strong>of</strong> normal maintenance and<br />
renewal activities, while others<br />
will be included as part <strong>of</strong> MOTC<br />
capacity enhancement projects;<br />
• an upgrade <strong>of</strong> maintenance facilities -<br />
the existing rolling stock maintenance<br />
facilities will require an upgrade to<br />
cater for the increase in the rolling<br />
stock fleet size and the consequential<br />
number <strong>of</strong> maintenance tasks.<br />
Additional maintenance staff will<br />
be employed during 2008 to meet<br />
maintenance requirements; and<br />
• an upgrade <strong>of</strong> commissioning<br />
facilities; the commissioning <strong>of</strong> the<br />
most recently delivered train fleets<br />
in 2002-2006 was undertaken in<br />
existing maintenance facilities. This<br />
placed considerable pressure on<br />
the supply <strong>of</strong> trains for day-to-day<br />
passenger services, particularly<br />
during peak periods. With increasing<br />
patronage, the pressures on train<br />
availability have become even<br />
greater and it is possible that<br />
the availability <strong>of</strong> trains for peak<br />
services will be compromised<br />
if the new X’Trapolis trains are<br />
commissioned in the existing<br />
facilities, as they currently stand.<br />
Enhancements to the existing<br />
facilities are therefore planned to<br />
ensure the facilities meet the future<br />
requirements, without affecting the<br />
maintenance <strong>of</strong> the existing fleet<br />
or train availability. The proposed<br />
enhancements include the provision <strong>of</strong>:<br />
• additional staff amenities to ensure<br />
sufficient capacity for the extra<br />
commissioning personnel and to<br />
avoid overloading existing facilities<br />
for maintenance staff; and<br />
• secure storage for parts,<br />
equipment and the tools required<br />
for commissioning activities.<br />
These enhancements are to be<br />
made prior to delivery <strong>of</strong> the 18<br />
X’Trapolis trains, with requirements<br />
to be reviewed as part <strong>of</strong> the future<br />
procurement <strong>of</strong> rolling stock.<br />
67
Patronage forecasts indicate that<br />
the metropolitan train system will be<br />
under significant and sustained growth<br />
pressure beyond 2012. The magnitude<br />
<strong>of</strong> growth forecast over this period will<br />
place pressure on all aspects <strong>of</strong> the train<br />
network. Recognising this together with<br />
the expectations and objectives raised<br />
by MOTC, the State, with cooperation<br />
from stakeholders, is reviewing<br />
requirements for train rolling stock and<br />
associated infrastructure for the future.<br />
This requires evaluating the options<br />
for step-change technological<br />
development <strong>of</strong> the system in areas<br />
including, but not limited to:<br />
• signalling;<br />
• power supply;<br />
• train configuration and capacity; and<br />
• communications.<br />
2.12 <strong>Public</strong> <strong>Transport</strong><br />
Infrastructure<br />
In the 150 years public transport<br />
has been operating within <strong>Victoria</strong>,<br />
a significant portfolio <strong>of</strong> fixed<br />
infrastructure has been developed<br />
and incorporated into the Melbourne<br />
tram and train networks, much <strong>of</strong><br />
which is still in operation today.<br />
As a result, the infrastructure that<br />
comprises these networks exhibits<br />
a wide spectrum <strong>of</strong> characteristics,<br />
regarding scale, complexity and age - a<br />
situation which creates a number <strong>of</strong><br />
challenges to the long term maintenance<br />
and operation <strong>of</strong> the networks.<br />
Some <strong>of</strong> these key challenges include:<br />
• the train network is currently<br />
subject to significant capacity<br />
constraints within the inner city<br />
areas and other critical locations,<br />
particularly within the City Loop;<br />
• in comparison, the outer areas <strong>of</strong><br />
the train network have operational<br />
flexibility constraints, limiting the<br />
ability to run express services and<br />
to interweave normal passenger<br />
services and freight services;<br />
• trams are predominately operating<br />
within shared road areas, which<br />
has resulted in significantly slower<br />
running times in recent years<br />
due to substantial increases<br />
in traffic congestion; and<br />
• much <strong>of</strong> the existing tram and train<br />
infrastructure has been designed<br />
and developed to standards which<br />
are lower than that currently<br />
required. This is currently not<br />
so much an issue for day to day<br />
operations and maintenance, but<br />
is anticipated to have a growing<br />
impact on the long term system<br />
sustainability (in regard to<br />
maintenance and renewal activities).<br />
A number <strong>of</strong> significant network<br />
improvement and expansion projects<br />
are proposed over the next 10 to 20<br />
years to address some <strong>of</strong> the identified<br />
capacity constraints, improve aspects<br />
<strong>of</strong> the systems operation, and provide<br />
public transport services to new<br />
communities. It is also anticipated that<br />
the implementation <strong>of</strong> these projects will<br />
place some short term pressures and<br />
constraints on the ongoing operation <strong>of</strong><br />
the systems, including the infrastructure<br />
maintenance and renewal activities.<br />
68<br />
Commercial in Confidence <strong>Expression</strong> <strong>of</strong> <strong>Interest</strong> <strong>Brief</strong>
2.12.1 Existing Melbourne<br />
Tram Infrastructure<br />
A breakdown <strong>of</strong> the Melbourne<br />
metropolitan tram network main<br />
asset types, along with the estimated<br />
extent, is provided in Table 18 below.<br />
Table 18: Overview <strong>of</strong> Existing Melbourne Metropolitan Tram Network Infrastructure<br />
Assets Estimated Total Unit Source<br />
Track<br />
Main running lines 507 Kilometre 1<br />
Turnouts 735 Number 2<br />
Crossings (at intersections) 33 Number 2<br />
Structures<br />
Bridges 6 Number 1<br />
Subways 7 Number 1<br />
Shelters 730 Number 1<br />
Stops 1,779 Number 1<br />
Safety zones 486 Number 1<br />
Platforms 124 Number 4<br />
Maintenance depots 8 Number 1<br />
Overhead structures (poles) 16,558 Number 4<br />
Power<br />
Overhead wiring (contact wire) 523 Kilometre 1<br />
Overhead wiring (insulators) 400 Number 4<br />
Overhead switchgear 204 Number 4<br />
Substations 46 Number 1<br />
Feeder cable (underground and aerial) 190 Kilometre 2<br />
Electrolysis system 25 Kilometre 2<br />
Traction control system 1 Number 2<br />
Signalling<br />
Automatic point machines 110 Number 2<br />
Communications<br />
See table below<br />
Communications cables (aerial) 80 Kilometre 2<br />
AVM System 1 Number 2<br />
Radio base stations 7 Number 2<br />
Signal post transmitters 239 Number 1<br />
1. PASS Assets GIS (DOT public transport<br />
infrastructure information system),<br />
data as at 03/03/2008.<br />
2. The 2004 Infrastructure Lease between<br />
the Director <strong>of</strong> <strong>Public</strong> <strong>Transport</strong>, MetroLink<br />
<strong>Victoria</strong> Pty Ltd, Transfield MetroLink Pty Ltd,<br />
Transdev <strong>Victoria</strong> Pty Ltd and <strong>Victoria</strong>n Rail<br />
Track, dated 19/02/2004.<br />
4. CAMS, (Yarra Trams Asset Management<br />
System) data as at 23/01/2008.<br />
Communications<br />
Various communications systems<br />
are used, including:<br />
Passenger support systems (Intercom,<br />
PA, PIDS, PRIDE, on train PA);<br />
Operational support systems (Train<br />
radio, SPT, SPOT, CCTV, train number<br />
transmitters, security systems); and<br />
Metrol communications systems<br />
(Tunnel Telephone, ACOM, CMS).<br />
69
2.12.2 Existing Melbourne<br />
Train Infrastructure<br />
Infrastructure within a train network can<br />
broadly be segregated into the following<br />
asset groupings: track, structures,<br />
power, signalling and communications.<br />
Each asset grouping can then be broken<br />
down further into individual asset<br />
types. A breakdown <strong>of</strong> the Melbourne<br />
metropolitan train network main<br />
asset types, along with the estimated<br />
extent, is provided in Table 19 below.<br />
Table 19: Overview <strong>of</strong> Existing Melbourne Metropolitan Train Network Infrastructure<br />
Communications<br />
Various communications systems<br />
are used, including:<br />
Passenger support systems (Intercom,<br />
PA, PIDS, PRIDE, on train PA);<br />
Operational support systems (Train<br />
radio, SPT, SPOT, CCTV, train number<br />
transmitters, security systems); and<br />
Metrol communications systems<br />
(Tunnel Telephone, ACOM, CMS).<br />
Assets Estimated Total Unit Source<br />
Track<br />
Main running lines – electrified 761 Kilometre 1<br />
Main running lines – non-electrified 41 Kilometre 2<br />
Main running lines – city loop 17 Kilometre 2<br />
Other lines – sidings and<br />
rolling stock maintenance<br />
Train crossings (including turnouts,<br />
single and double compound<br />
crossings and diamonds)<br />
31 Kilometre 1<br />
1513 Number 1<br />
Level crossings – road crossings 226 Number 1<br />
Level crossings – pedestrian crossings 519 Number 1<br />
Level crossings – occupation<br />
/ maintenance<br />
114 Number 1<br />
Level crossings – rail / tram crossings 4 Number 1<br />
Structures<br />
Bridges – rail 305 Number 1<br />
Bridges – road 143 Number 1<br />
Bridges – pedestrian 77 Number 1<br />
Cuttings and embankments 104.5 Kilometre 1<br />
Subways 83 Number 1<br />
Tunnels 6 Number 1<br />
Stations – above ground / premium 69 Number 1<br />
Stations – above ground / standard 139 Number 1<br />
Stations – underground 3 Number 1<br />
Heritage buildings 29 Number 2<br />
Car parking spaces –<br />
sealed and unsealed<br />
29,627 Number 1<br />
70<br />
Commercial in Confidence <strong>Expression</strong> <strong>of</strong> <strong>Interest</strong> <strong>Brief</strong>
Assets Estimated Total Unit Source<br />
Maintenance depots 6 Number 1<br />
Train wash plant 2 Number 1<br />
Power<br />
Overhead wiring 926 Kilometre 1<br />
Substations 67 Number 1<br />
Power control system 1 Number 2<br />
Tie stations 23 Number 1<br />
22kV transmission line 122 Kilometre 2<br />
Electrolysis feeders 90 Kilometre 2<br />
DC feeders 50 Kilometre 2<br />
Signalling<br />
Manual block 3 Number 2<br />
Track circuits 4,061 Number 3<br />
Interlockings (computer, relay,<br />
electro-mechanical and mechanical)<br />
120 Number 2<br />
Signals (home, auto and dwarf) 2,543 Number 3<br />
Points 1,419 Number 3<br />
Train stops 2,009 Number 1<br />
Level crossing protection 454 Number 3<br />
Train control system (Metrol) 1 Number 2<br />
Signals communication system 1 Number 2<br />
Sources:<br />
1. PASS Assets GIS (DOT public transport infrastructure information system), data as at<br />
03/03/2008.<br />
2. The 2004 Infrastructure Lease between the Director <strong>of</strong> <strong>Public</strong> <strong>Transport</strong>, Melbourne <strong>Transport</strong><br />
Enterprise Pty Ltd and <strong>Victoria</strong>n Rail Track, dated 19/02/2004.<br />
3. MIMs (Mainco Asset Management System), data as at 21/02/2006<br />
71
It should be noted that not all train<br />
infrastructure assets within Melbourne<br />
are included within the metropolitan train<br />
network. Some assets are part <strong>of</strong> the<br />
<strong>Victoria</strong>n regional train network, whilst<br />
others are privately owned assets used<br />
solely for freight related activities.<br />
2.12.3 Development <strong>of</strong><br />
Infrastructure<br />
Improvement Projects<br />
The identification, planning and<br />
development <strong>of</strong> major improvement<br />
projects for the tram and train networks<br />
are currently undertaken by the<br />
<strong>Public</strong> <strong>Transport</strong> Division (PTD) with<br />
the assistance <strong>of</strong> the Infrastructure<br />
Projects Division (IPD) <strong>of</strong> DOT in a<br />
client/developer partnership, on<br />
behalf <strong>of</strong> the State. The existing<br />
tram and train operators are involved<br />
in these projects in a significant<br />
stakeholder role, rather than having<br />
direct delivery responsibilities.<br />
Recently there has been a move towards<br />
earlier operator involvement with these<br />
infrastructure improvement projects,<br />
with the tram and train operators directly<br />
involved in project delivery where<br />
appropriate. It is believed this approach<br />
reduces tensions between the delivery<br />
<strong>of</strong> the infrastructure improvement<br />
project and the day-to-day operations<br />
<strong>of</strong> the tram and train networks.<br />
2.12.4 Metropolitan Tram<br />
Improvement Projects 190<br />
To improve the metropolitan tram<br />
network, the State has allocated<br />
funding to a number <strong>of</strong> current<br />
projects. This includes:<br />
• allocating a further AUD$26m<br />
to extend the Think Tram<br />
program until 2010-2011;<br />
• allocating funding <strong>of</strong> AUD$250m to<br />
improve accessible public transport,<br />
including the construction <strong>of</strong> an<br />
additional 250 platform stops; and<br />
• extending route 86 to the Waterfront<br />
City area <strong>of</strong> the Docklands precinct<br />
in mid 2008, to create a direct<br />
transport link between Southern<br />
Cross Station and Docklands Drive.<br />
Further details <strong>of</strong> these projects (and<br />
other recently completed works)<br />
are available on the Department <strong>of</strong><br />
<strong>Transport</strong>’s website, www.doi.vic.gov.au.<br />
2.12.5 Metropolitan Trains<br />
Infrastructure<br />
Improvement Projects 191<br />
The State has developed an extensive<br />
program for upgrading and extending<br />
the heavy rail network infrastructure<br />
across Melbourne, which includes<br />
upgrades to rail lines, stations and<br />
signalling systems. The following<br />
is a list <strong>of</strong> current projects:<br />
• upgrading three existing stations to<br />
Premium Stations, along with further<br />
upgrading works at Flinders Street;<br />
• upgrading signalling<br />
within the City Loop;<br />
• infrastructure improvements on<br />
the Werribee line to allow short<br />
services from Laverton;<br />
72<br />
Commercial in Confidence <strong>Expression</strong> <strong>of</strong> <strong>Interest</strong> <strong>Brief</strong>
• upgrading the stabling facilities at<br />
Cranbourne, Pakenham, Westall<br />
and on the Werribee rail corridor<br />
and providing additional stabling<br />
facilities at Craigieburn;<br />
• building a third track between<br />
Caulfield and Dandenong;<br />
• duplicating the track between Clifton<br />
Hill and Westgarth which involves<br />
the construction <strong>of</strong> a second rail<br />
bridge across the Merri Creek (this<br />
is under construction and due for<br />
completion mid October 2009);<br />
• building or expanding Park and Ride<br />
facilities at Pakenham, Berwick,<br />
Roxburgh Park, Hoppers Crossing,<br />
Aircraft, Laverton, Chelsea,<br />
Lilydale, Seaford, Cheltenham and<br />
Watergardens Stations. This will<br />
provide 1,707 additional car park<br />
spaces over the next four years and<br />
represents 34 percent <strong>of</strong> the 5,000<br />
spaces committed in MOTC; and<br />
• upgrading multi-modal interchanges.<br />
The East West Link Needs Assessment<br />
(EWLNA) was recently completed by<br />
Sir Rod Eddington. The Assessment<br />
provides recommendations on a<br />
range <strong>of</strong> transport related issues. The<br />
Government will provide its response<br />
to the review by the end <strong>of</strong> 2008.<br />
For further information on each <strong>of</strong><br />
these projects and other recently<br />
completed works, the Department<br />
<strong>of</strong> <strong>Transport</strong>’s website, www.doi.<br />
vic.gov.au should be consulted.<br />
73
Attachment 1:<br />
Key Facts and Figures<br />
Commercial in Confidence <strong>Expression</strong> <strong>of</strong> <strong>Interest</strong> <strong>Brief</strong>
The following table reflect approximate figures as at 2006/07 Financial Year –<br />
(1 July – 30 June) for the Melbourne Metropolitan Tram and Train Operations.<br />
Cost base <strong>of</strong> services provided AUD$538 Million AUD$281 Million<br />
Performance<br />
Train Tram Source and date <strong>of</strong> Information<br />
On time performance 92.2% 82.7% 2006/07 DOT Annual Report<br />
Cancellation <strong>of</strong> services 1.1% 0.2% 2006/07 DOT Annual Report<br />
Passengers carried per annum 178.6 Million 154.9 Million 2006/07 DOT Annual Report<br />
Travelled kilometres per annum 17.2 Million 23.1 Million 2006/07 DOT Annual Report<br />
Track and Infrastructure<br />
Routes 15 Train routes 28 Tram routes Train: Train network map,<br />
www.metlinkmelbourne.com.au<br />
(viewed 07/02/08)<br />
Tram: Tram network map,<br />
www.metlinkmelbourne.com.au<br />
(viewed 13/02/08)<br />
Route kilometres (excluding City Loop) 382 route kilometres 249 kilometres <strong>of</strong><br />
double track<br />
Train: PASS Assets GIS ^<br />
Tram: PASS Assets GIS ^<br />
Route Kilometres - City Loop 4 route kilometres N/A Train: PASS Assets GIS ^<br />
Total route kilometres 386 route kilometres 249 kilometres <strong>of</strong><br />
double track<br />
Line speed<br />
Line speed – inner areas 80 kms per hour n/a<br />
Average speed 35 kms per hour 16 kms per hour<br />
75
The following table reflects approximate figures as at 2006/07 Financial Year – (1 July – 30 June) for<br />
the train platforms and tram stops on the Melbourne metropolitan tram and train operations.<br />
Train Tram Source and date <strong>of</strong> Information<br />
Number <strong>of</strong> Standard Stations<br />
/ Platforms / Stops<br />
Number <strong>of</strong> Premium Stations<br />
/ Platforms / Stops<br />
Total Stations / Platforms / Stops<br />
Number <strong>of</strong> DDA Compliant<br />
Stations / Stops<br />
Average distance between<br />
stations/ stops (whole network)<br />
• 139 stations,<br />
each with 1, 2, 3<br />
or 4 platforms<br />
• 279 individual<br />
train platforms<br />
• 72 stations, each<br />
typically with 2, 3<br />
or 4 platforms<br />
• 192 individual<br />
train platforms<br />
• Southern Cross<br />
Station has 6<br />
metropolitan (plus<br />
additional regional)<br />
platforms<br />
• Flinders Street<br />
Station has 12<br />
platforms (with<br />
limited regional<br />
train usage)<br />
• 213 stations<br />
• 471 individual<br />
train platforms<br />
• There are 28 DDA<br />
categories for<br />
stations. Compliance<br />
with these categories<br />
varies from 28%<br />
to 100%.<br />
• Average compliance<br />
is 77%<br />
• 1,569 individual<br />
tram stops<br />
• 210 individual<br />
platform tram stops<br />
• 1,779 individual tram stops<br />
• 210<br />
Train: PASS Assets GIS ^<br />
Tram: PASS Assets GIS^ and PTD ^^<br />
Train: PASS Assets GIS ^<br />
Tram: PASS Assets GIS^ and PTD ^^<br />
Train: Connex DDA Action Plan<br />
Report July 06/June 07<br />
Tram: PTD ^^<br />
• 2.5 kilometres • 260 Metres Train: PASS Assets GIS ^<br />
Tram: PASS Assets GIS ^<br />
^ PASS Assets GIS (DOT public transport infrastructure information system).<br />
^^ PTD Franchise Relationships Accessibility Unit information (current at 07/02/08).<br />
76<br />
Commercial in Confidence <strong>Expression</strong> <strong>of</strong> <strong>Interest</strong> <strong>Brief</strong>
The following table shows the number and types <strong>of</strong> trains and trams and scheduled services on the<br />
Melbourne metropolitan tram and train operations as at 2006/07 Financial Year – (1 July – 30 June).<br />
Train<br />
(3 car sets)<br />
Current fleet Pre 1999<br />
rolling stock<br />
• 187 Comeng<br />
• 14 Hitachi<br />
Post 1999<br />
rolling stock<br />
• 58 Alstom X’trapolis<br />
• 72 Siemens Nexas<br />
Tram<br />
(individual)<br />
Pre 1999<br />
rolling stock<br />
• 51 W Class<br />
• 145 Z Class<br />
• 70 A Class<br />
• 132 B Class<br />
• 3 Restaurant<br />
Trams (W Class)<br />
Post 1999<br />
rolling stock<br />
• 36 C Class<br />
(Three Section<br />
Alstom Citadis)<br />
• 38 D1 Class (Three<br />
Section Siemens<br />
Combino)<br />
• 21 D2 Class (Five<br />
Section Siemens<br />
Combino)<br />
Subtotal 331 Subtotal 496 Subtotal<br />
Ordered, but not yet in service Post 1999<br />
rolling stock<br />
• 36 Alstom X’trapolis<br />
(arriving from late<br />
2009 onwards)<br />
Total 367 three car units 501 trams<br />
Daily Scheduled Services<br />
Monday – Thursday<br />
Friday<br />
Saturday<br />
Sunday<br />
1,916<br />
1,944<br />
1,502<br />
1,175<br />
Post 1999<br />
rolling stock<br />
• 5 Five Section<br />
Alstom Citadis<br />
(leased from<br />
France for between<br />
2008 and 2011)<br />
4,900<br />
5,080<br />
3,880<br />
2,750<br />
Source and date <strong>of</strong> information<br />
Train: Connex Rolling Stock<br />
Management Plan 2007/08<br />
(Final) (Connex, 15/06/07)<br />
Tram: Yarra Trams Rolling Stock<br />
Management Plan 2006/07<br />
(Yarra Trams, 30/06/06)<br />
Train: 18 More Trains Ordered for<br />
Metropolitan Rail System Media Release<br />
(<strong>Victoria</strong> Government, 21/12/07)<br />
Tram: Five More Trams to be Added<br />
to Metropolitan System Media Release<br />
(<strong>Victoria</strong>n Government, 07/02/08)<br />
77
The following tables show the numbers <strong>of</strong> staff and farebox revenue for the Melbourne metropolitan<br />
tram and train operations as at 2006/07 Financial Year – (1 July – 30 June).<br />
Train<br />
Tram<br />
Operator Staff, July 2007<br />
Staff<br />
(excluding contractors)<br />
335 customer<br />
service staff<br />
660 train drivers<br />
690 station staff<br />
375 administration staff<br />
225 rolling stock staff<br />
525 infrastructure staff<br />
Total staff 2,810 staff 1,885 staff<br />
260 Frontline<br />
support staff<br />
1,130 tram drivers<br />
70 depot staff<br />
90 administration staff<br />
150 rolling stock staff<br />
125 infrastructure staff<br />
60 operational staff<br />
Metropolitan Farebox Revenue<br />
Financial<br />
Year<br />
Total Revenue<br />
$ (millions)<br />
% Growth Tram (40% share) Train (40% share) State(20% share)<br />
2004/05 $372M $149M $149M $74M<br />
2005/06 $406M 9% $162M $162M $82M<br />
2006/07 $462M 14% $185M $185M $92M<br />
78<br />
Commercial in Confidence <strong>Expression</strong> <strong>of</strong> <strong>Interest</strong> <strong>Brief</strong>
Appendix B –<br />
Statutory and Contractual Framework<br />
79
Statutory Framework<br />
<strong>Victoria</strong>’s rail transport legislation<br />
is comprised primarily <strong>of</strong><br />
the following Acts:<br />
• the <strong>Transport</strong> Act 1983 (Vic);<br />
• the Rail Corporations Act<br />
1996 (Vic); and<br />
• the Rail Safety Act 2006 (Vic).<br />
This legislation underpins the<br />
contractual frameworks within which<br />
the Franchises will operate.<br />
3.1 <strong>Transport</strong> Act<br />
3.1.1 Overview<br />
The <strong>Transport</strong> Act defines the roles<br />
and responsibilities <strong>of</strong> the executive<br />
government agencies responsible for<br />
the transport sector: the Minister,<br />
the Secretary and the Department<br />
<strong>of</strong> Infrastructure. The Department<br />
<strong>of</strong> Infrastructure was renamed the<br />
Department <strong>of</strong> <strong>Transport</strong> (‘DOT’) by<br />
Order-In-Council on 30th April 2008<br />
The <strong>Transport</strong> Act also establishes a<br />
number <strong>of</strong> transport sector specific<br />
agencies. The most important <strong>of</strong><br />
these for the Franchises are the:<br />
• Director <strong>of</strong> <strong>Public</strong><br />
<strong>Transport</strong> (‘Director’);<br />
• Director, <strong>Public</strong> <strong>Transport</strong> Safety<br />
(the ‘Safety Director’); and<br />
• Chief Investigator, <strong>Transport</strong><br />
and Marine Safety Investigations<br />
(the ‘Chief Investigator’).<br />
80<br />
Commercial in Confidence <strong>Expression</strong> <strong>of</strong> <strong>Interest</strong> <strong>Brief</strong>
3.1.2 Director <strong>of</strong> <strong>Public</strong><br />
<strong>Transport</strong><br />
The Director is a statutory position<br />
established under the <strong>Transport</strong> Act.<br />
Amongst other duties, the Director<br />
is responsible for the general<br />
administration <strong>of</strong> the arrangements<br />
entered into with the operators <strong>of</strong><br />
the Franchises. The Director has<br />
broad powers and, in particular, is<br />
authorised on behalf <strong>of</strong> the State to:<br />
• enter into agreements, leases or<br />
licences relating to, or connected<br />
with, the provision or operation by<br />
a person or a body <strong>of</strong> a service<br />
for the carrying <strong>of</strong> passengers<br />
by railway or tramway;<br />
• operate a service for the carrying <strong>of</strong><br />
passengers by railway or tramway;<br />
• operate services ancillary or<br />
incidental to the operation <strong>of</strong><br />
a service for the carrying <strong>of</strong><br />
passengers by railway or tramway;<br />
• acquire, own, build, maintain and<br />
operate rail and tram infrastructure;<br />
• enter into agreements relating to<br />
the allocation <strong>of</strong> revenue derived<br />
from the provision <strong>of</strong> any service<br />
for the carrying <strong>of</strong> passengers<br />
by railway or tramway; and<br />
• enter into any other agreement, lease<br />
or licence or to do any other thing<br />
that is necessary for the performance<br />
<strong>of</strong> the Director’s functions.<br />
The <strong>Public</strong> <strong>Transport</strong> Division <strong>of</strong> DOT<br />
exists to support the Director in the<br />
performance <strong>of</strong> his/her functions.<br />
3.1.3 Director, <strong>Public</strong><br />
<strong>Transport</strong> Safety<br />
The <strong>Transport</strong> Act also establishes<br />
the statutory <strong>of</strong>fice <strong>of</strong> the Safety<br />
Director. The principal objective <strong>of</strong><br />
the Safety Director is to facilitate<br />
the safe operation <strong>of</strong> rail and bus<br />
transport services in <strong>Victoria</strong>. The<br />
Safety Director’s functions include:<br />
• advising and making<br />
recommendations to the Minister<br />
for <strong>Public</strong> <strong>Transport</strong> in respect to<br />
matters relating to the safe operation<br />
<strong>of</strong> public transport in <strong>Victoria</strong>;<br />
• investigating and reporting on<br />
public safety transport matters;<br />
• preparing codes <strong>of</strong> practice and<br />
guidelines to provide guidance in<br />
relation to transport safety laws;<br />
• promoting education and training in<br />
relation to public transport safety;<br />
• collecting information and<br />
data relating to public<br />
transport safety matters;<br />
• promoting awareness in the rail<br />
transport industry and among the<br />
public about rail safety initiatives; and<br />
• advising people who have a duty<br />
or obligation under a transport<br />
safety law about complying<br />
with that duty or obligation.<br />
<strong>Public</strong> <strong>Transport</strong> Safety <strong>Victoria</strong><br />
(‘PTSV’), exists to support the Safety<br />
Director in the performance <strong>of</strong> his/<br />
her functions. PTSV administers<br />
the rail safety accreditation <strong>of</strong><br />
transport operators (refer Section<br />
3.3 <strong>of</strong> this Appendix for information<br />
regarding the Rail Safety Act).<br />
81
3.1.4 Chief Investigator,<br />
<strong>Transport</strong> and Marine<br />
Safety Investigations<br />
The Chief Investigator is a statutory<br />
position established under the <strong>Transport</strong><br />
Act with the objective <strong>of</strong> improving<br />
public transport and marine safety<br />
by independently investigating public<br />
transport and marine safety matters.<br />
The principal function <strong>of</strong> the Chief<br />
Investigator is to conduct investigations<br />
into ‘public transport safety matters’<br />
and to report the results <strong>of</strong> any<br />
investigations conducted by him/her<br />
to the Minister for <strong>Public</strong> <strong>Transport</strong>.<br />
‘<strong>Public</strong> transport safety matters’ include<br />
incidents involving rolling stock or rail<br />
infrastructure that resulted in, or had<br />
the potential to result in, the death <strong>of</strong>,<br />
or injury to, any person or damage to<br />
any property or equipment. The Chief<br />
Investigator also has the power to<br />
establish a system for the voluntary<br />
reporting by transport workers <strong>of</strong><br />
‘public transport safety matters’ and to<br />
administer any such reporting system.<br />
3.2 Rail Corporations Act<br />
3.2.1 Overview<br />
The Rail Corporations Act also<br />
establishes a number <strong>of</strong> transport<br />
sector agencies and confers<br />
statutory powers on the operators<br />
<strong>of</strong> the Franchises. The statutory<br />
bodies created under this Act include<br />
<strong>Victoria</strong>n Rail Track (which carries on<br />
business under the name ‘VicTrack’),<br />
V/Line Passenger Corporation and<br />
Southern Cross Station Authority.<br />
This Act sets out their respective<br />
objectives, functions and powers.<br />
3.2.2 VicTrack<br />
VicTrack is a Government Business<br />
Enterprise public authority established<br />
under the Rail Corporations Act to own<br />
rolling stock, land and infrastructure<br />
used for the Melbourne metropolitan<br />
tram and train services and to ensure<br />
the maintenance <strong>of</strong> that rolling stock,<br />
land and infrastructure. VicTrack reports<br />
to the Minister for <strong>Public</strong> <strong>Transport</strong>.<br />
The functions <strong>of</strong> VicTrack include:<br />
• to establish, manage and maintain<br />
railways, rail infrastructure,<br />
tramways and tram infrastructure<br />
(including track, overhead wiring,<br />
communications networks,<br />
buildings and structures, signals<br />
and power sub-stations);<br />
• to direct, control and charge for<br />
access to, and the movement<br />
<strong>of</strong> rolling stock on, railways<br />
and tramways; and<br />
• when directed by the Minister, to<br />
operate rolling stock to provide<br />
passenger services and to operate<br />
services ancillary or incidental to its<br />
rail passenger or tram services.<br />
Under the Rail Corporations Act,<br />
VicTrack has broad powers to acquire<br />
and operate rail and tram infrastructure<br />
and rolling stock for the purposes<br />
<strong>of</strong> carrying out its functions, and<br />
to make land and other property<br />
vested in or managed by it available<br />
for use by other persons (including<br />
leasing any rail infrastructure or<br />
tram infrastructure owned by it).<br />
82<br />
Commercial in Confidence <strong>Expression</strong> <strong>of</strong> <strong>Interest</strong> <strong>Brief</strong>
VicTrack (via a subsidiary) owns the<br />
majority <strong>of</strong> the tram and train rolling<br />
stock that operates on the Melbourne<br />
metropolitan tram and train networks.<br />
These assets are leased to the<br />
Franchisees who are then responsible<br />
for asset maintenance during the term <strong>of</strong><br />
the Franchises. VicTrack also owns the<br />
land and infrastructure relating to the<br />
metropolitan tram and train networks.<br />
This land and infrastructure is leased (via<br />
the Director <strong>of</strong> <strong>Public</strong> <strong>Transport</strong>) to the<br />
Franchisees, such that the Franchisees<br />
operate as vertically integrated<br />
(above and below rail) businesses.<br />
3.2.3 V/Line Passenger<br />
Corporation<br />
V/Line Passenger Corporation (‘VLP’)<br />
is a public authority established<br />
under the Rail Corporations Act to<br />
operate rural rail passenger services<br />
and services ancillary or incidental<br />
to its rail passenger services,<br />
including rural coach services.<br />
VLP shares railway track with the<br />
operator <strong>of</strong> the metropolitan train<br />
Franchise within metropolitan<br />
Melbourne. VLP also has the right to<br />
access certain metropolitan railway<br />
stations, as well as facilities and<br />
services at those stations, pursuant to<br />
agreements with the metropolitan train<br />
operator. VLP also hires rolling stock to<br />
the metropolitan train operator pursuant<br />
to a rolling stock hire agreement.<br />
3.2.4 Southern Cross<br />
Station Authority<br />
The Southern Cross Station Authority<br />
(‘SCSA’) is a public authority<br />
established under the Rail Corporations<br />
Act to redevelop and manage the<br />
Southern Cross Station precinct.<br />
The SCSA leases Southern Cross<br />
Station to Civic Nexus, a private<br />
sector consortium that manages and<br />
operates Southern Cross Station. In<br />
turn, Civic Nexus provides access<br />
to the station to the operator <strong>of</strong><br />
the metropolitan train Franchise<br />
pursuant to an access agreement.<br />
3.2.5 Private sector operators<br />
The Rail Corporations Act confers<br />
various powers upon the operators<br />
<strong>of</strong> the Franchises to undertake<br />
works associated with the use and<br />
operation <strong>of</strong> transport infrastructure.<br />
These include the right to:<br />
• open and break up, and divert traffic<br />
from, any road on or adjacent to rail<br />
infrastructure or tram infrastructure;<br />
• stop traffic; and<br />
• require the owner or occupier <strong>of</strong><br />
land on which a tree is situated,<br />
(which poses a risk to the safety<br />
<strong>of</strong> anyone on, or using a railway<br />
track), to fell and remove the tree.<br />
83
3.3 Rail Safety Act<br />
The Rail Safety Act creates a regime<br />
to provide for safe rail operations in<br />
<strong>Victoria</strong>. The Rail Safety Act principally<br />
deals with rail safety accreditation<br />
and safety duties in relation to rail<br />
operations, both <strong>of</strong> which impact directly<br />
on the operators <strong>of</strong> the Franchises.<br />
This Act establishes a compulsory rail<br />
safety accreditation scheme for rail<br />
operators, administered by the Safety<br />
Director. To attain accreditation, a<br />
rail operator must demonstrate to the<br />
satisfaction <strong>of</strong> the Safety Director that<br />
it has the competence and capacity<br />
to manage the safety risks associated<br />
with the rail operations which it<br />
undertakes. The Franchisees must be<br />
accredited under this scheme. The<br />
current Franchisees are deemed to<br />
have transitional accreditation under<br />
this scheme until 1 July 2008, after<br />
which time they will need to comply<br />
with the accreditation regime.<br />
The Rail Safety Act also sets out a<br />
number <strong>of</strong> duties relating to safe rail<br />
operations which rail infrastructure<br />
managers, rolling stock operators, rail<br />
contractors and rail safety workers need<br />
to comply with. As ‘rail infrastructure<br />
managers’ and ‘rolling stock operators’,<br />
the Franchisees need to meet the<br />
obligations specified in this Act.<br />
3.4 <strong>Transport</strong><br />
Legislation Review<br />
The <strong>Transport</strong> Act, Rail Corporations<br />
Act, <strong>Public</strong> <strong>Transport</strong> Competition<br />
Act and the Road Management Act<br />
are currently being reviewed as part<br />
<strong>of</strong> the ‘<strong>Transport</strong> Legislation Review’<br />
which was announced by the Minister<br />
for <strong>Public</strong> <strong>Transport</strong> on 9 October<br />
2007. This is the first comprehensive<br />
review <strong>of</strong> <strong>Victoria</strong>’s transport<br />
legislation in more than 20 years.<br />
The <strong>Transport</strong> Legislation Review<br />
comprises one <strong>of</strong> the key actions in<br />
Meeting our <strong>Transport</strong> Challenges.<br />
The review aims to modernise<br />
<strong>Victoria</strong>’s transport legislation to<br />
ensure it meets <strong>Victoria</strong>’s current<br />
and future transport needs.<br />
A discussion paper entitled “Towards<br />
an integrated and sustainable transport<br />
future: a new legislative framework<br />
for <strong>Victoria</strong>” has been released by the<br />
Government. The paper identifies a set<br />
<strong>of</strong> draft objectives for legislation and<br />
public comment has been sought on<br />
those objectives. Following analysis <strong>of</strong><br />
submissions, the Government expects<br />
to release a policy position paper on<br />
a new set <strong>of</strong> objectives for transport<br />
legislation by mid 2008, with resulting<br />
legislation being introduced into<br />
Parliament in the second half <strong>of</strong> 2008.<br />
Recent amendments to the Rail Safety<br />
Act have also introduced obligations<br />
relating to ‘safety interface agreements’,<br />
which Franchisees will need to comply<br />
with once the relevant provisions<br />
come into operation on 1 July 2010.<br />
84<br />
Commercial in Confidence <strong>Expression</strong> <strong>of</strong> <strong>Interest</strong> <strong>Brief</strong>
Contractual Framework<br />
4.1 Franchise<br />
Arrangements<br />
The statutory framework set out above<br />
underpins the contractual framework<br />
within which the Franchises will operate.<br />
This contractual framework involves<br />
a suite <strong>of</strong> agreements between the<br />
State, the Franchisees, Metlink, the<br />
<strong>Transport</strong> Ticketing Authority (‘TTA’),<br />
and key sub-contractors and suppliers<br />
(together the ‘Franchise Arrangements’).<br />
The Franchise Arrangements are<br />
divided into the following categories:<br />
• Transaction Documents – governing<br />
the relationship between the State<br />
and the Franchisees, including the<br />
Transfer Agreements, Franchise<br />
Agreements, Infrastructure Leases,<br />
Projects Agreement, State Rolling<br />
Stock Leases and any necessary<br />
supporting agreements;<br />
• Direct Agreements – governing<br />
the relationship between the<br />
State and the Franchisees’<br />
key suppliers or contractors,<br />
most notably the suppliers and<br />
maintainers <strong>of</strong> rolling stock;<br />
• Interoperator Agreements –<br />
governing the inter-relationship<br />
between the Franchisees and<br />
other industry participants eg, to<br />
support network-wide services;<br />
• Third Party Agreements – governing<br />
the relationship between the<br />
Franchisees and their suppliers;<br />
• Metlink Agreements – governing<br />
the ownership, governance and<br />
funding <strong>of</strong> Metlink and its operational<br />
relationship with the State and<br />
other key stakeholders; and<br />
• TTA Agreements – governing the<br />
relationships between the Franchisees<br />
and the State with respect to<br />
revenue sharing and transitioning<br />
to the new ticketing system.<br />
In addition to the arrangements<br />
outlined above, Franchisees will also<br />
be required to participate in the<br />
<strong>Public</strong> <strong>Transport</strong> Ombudsman scheme<br />
(refer to Section 4.7 <strong>of</strong> this Appendix<br />
for information regarding the <strong>Public</strong><br />
<strong>Transport</strong> Ombudsman scheme).<br />
85
Figure 17: The current contractual framework<br />
Provider <strong>of</strong><br />
Performance Bonds<br />
Performance Bonds<br />
Deeds <strong>of</strong> Subordination<br />
Director <strong>of</strong> <strong>Public</strong><br />
<strong>Transport</strong><br />
Direct Agreements<br />
Metlink Services Agreement<br />
Franchise Agreements<br />
Infrastructure Leases<br />
Ticketing Management Agreement<br />
Transition Agreement<br />
Revenue Sharing Agreement<br />
Key Suppliers<br />
Metlink<br />
TTA<br />
Operator Services Agreements<br />
Train/Tram Operator Services Agreements<br />
Interoperator Agreements<br />
Franchisees<br />
Franchisees<br />
Transition Agreement<br />
Revenue Sharing Agreement<br />
Other Operators<br />
Interoperator<br />
Agreements<br />
Third Party Contracts<br />
Key Contracts<br />
Non Key Suppliers<br />
86<br />
Commercial in Confidence <strong>Expression</strong> <strong>of</strong> <strong>Interest</strong> <strong>Brief</strong>
Although the matrix <strong>of</strong> documents<br />
comprising the new Franchise<br />
Arrangements are still being developed,<br />
the current contractual framework<br />
as depicted in Figure 17 below<br />
provides a good indication <strong>of</strong> the<br />
likely future industry framework.<br />
4.2 Transaction<br />
Documents<br />
The key Transaction Documents relating<br />
to the Franchises will be as follows:<br />
• Transfer Agreements - for the sale<br />
<strong>of</strong> assets <strong>of</strong> the tram and train<br />
businesses from Yarra Trams and<br />
Connex to their respective successor<br />
operators (in the event <strong>of</strong> a change<br />
<strong>of</strong> tram or train operator);<br />
• Franchise Agreements - between the<br />
Director and the Franchisees under<br />
which the provision <strong>of</strong> passenger<br />
rail services will be regulated<br />
and a base operating payment<br />
and various incentives paid;<br />
• Infrastructure Leases - for the lease<br />
<strong>of</strong> rail infrastructure (including<br />
stations and track) by the Director to<br />
the Franchisees (the Director leases<br />
that infrastructure from VicTrack and<br />
Southern Cross Station Authority<br />
under a separate Head Lease);<br />
• State Rolling Stock Lease - for<br />
the lease <strong>of</strong> part <strong>of</strong> the rolling<br />
stock fleet by the Director to the<br />
Franchisees (the Director leases<br />
the rolling stock from Rolling<br />
Stock Holdings (<strong>Victoria</strong>) Pty Ltd<br />
(‘RSHV’), a subsidiary <strong>of</strong> VicTrack<br />
under a separate Head Lease);<br />
• supporting agreements, which<br />
support the Director’s rights<br />
under the Franchise Arrangements<br />
set out above, including<br />
charges, performance bonds<br />
and deeds <strong>of</strong> subordination.<br />
4.2.1 Transfer Agreements<br />
In the event that the outcome <strong>of</strong> the<br />
tendering process leads to a change<br />
<strong>of</strong> tram or train operator, Transfer<br />
Agreements will be required to govern<br />
the transfer <strong>of</strong> assets, employees and<br />
contracts <strong>of</strong> the new Franchisees from<br />
the current Franchisees. Transition and<br />
handover matters will also be dealt<br />
with in the Transfer Agreements.<br />
4.2.2 Franchise Agreements<br />
The Franchise Agreements, between<br />
the Director and the Franchisees, are<br />
pivotal to the Franchise Arrangements.<br />
The Franchise Agreements will<br />
impose a range <strong>of</strong> obligations on<br />
the Franchisees in relation to:<br />
• the provision <strong>of</strong> passenger rail<br />
services and service standards;<br />
• fare regulation;<br />
• network development and<br />
service planning obligations;<br />
• reporting and approval arrangements;<br />
• payment regimes;<br />
• enforcement powers; and<br />
• compliance with other relevant<br />
contracts and the end <strong>of</strong><br />
the relevant Franchise.<br />
• Projects Agreement – for the<br />
provisions and obligations relating<br />
to project delivery regime; and<br />
87
The Franchise Agreements will also<br />
provide a framework <strong>of</strong> incentives<br />
and penalties designed to improve<br />
the punctuality and reliability <strong>of</strong><br />
tram and train services and to<br />
improve the passenger experience in<br />
relation to using public transport.<br />
The Franchise Agreements will allow<br />
the Director to issue Practice Notes<br />
to the Franchisees to facilitate the<br />
administration <strong>of</strong> the Franchise<br />
Arrangements by providing more<br />
detailed explanations <strong>of</strong> the principles<br />
and mechanisms contained therein.<br />
4.2.3 Infrastructure Leases<br />
The Infrastructure Leases are<br />
key contracts in the Franchise<br />
Arrangements. Under the Infrastructure<br />
Leases, the infrastructure and land<br />
relating to the metropolitan tram and<br />
train networks will be leased to the<br />
Franchisees to enable them to operate<br />
their respective Franchises. The<br />
Infrastructure Leases will also set out<br />
the Franchisees obligations to operate,<br />
maintain and assist with development<br />
<strong>of</strong> the relevant infrastructure.<br />
The Infrastructure Lease will be a tripartite<br />
agreement between VicTrack,<br />
the Director and the Franchisee.<br />
VicTrack is the owner <strong>of</strong> the land and<br />
infrastructure leased to Franchisees.<br />
The Director leases this land and<br />
infrastructure from VicTrack under a<br />
separate head lease and subsequently<br />
sub-leases it to Franchisees’ under<br />
the Infrastructure Leases.<br />
One <strong>of</strong> the principal aims <strong>of</strong> the<br />
Infrastructure Leases is to ensure<br />
that the tram and train networks are<br />
adequately maintained, having regard<br />
to the long life <strong>of</strong> the relevant assets<br />
relative to the shorter term <strong>of</strong> the<br />
Franchises. A key aim for the State when<br />
drafting the Infrastructure Leases is<br />
to ensure that the Franchisees do not<br />
allow the condition <strong>of</strong> the network to<br />
deteriorate during the Franchise period.<br />
4.2.4 State Rolling<br />
Stock Leases<br />
Under the State Rolling Stock Leases,<br />
(between the Director and the<br />
Franchisees) part <strong>of</strong> the rolling stock<br />
fleet used on the metropolitan tram<br />
and train networks is leased to the<br />
Franchisees to enable them to operate<br />
the Franchises. RSHV is the owner <strong>of</strong><br />
this rolling stock. The Director leases<br />
this rolling stock from RSHV under a<br />
separate head lease and subsequently<br />
sub-leases it to the Franchisees.<br />
4.2.5 Projects Agreements<br />
The Projects Agreements will prescribe<br />
the arrangements for the delivery <strong>of</strong><br />
projects and the roles and obligations<br />
<strong>of</strong> the State and Franchisees.<br />
VicTrack, as the owner <strong>of</strong> the land, will<br />
retain a number <strong>of</strong> rights in respect <strong>of</strong><br />
the land and is a party to the lease for<br />
the purpose <strong>of</strong> enforcing those rights.<br />
88<br />
Commercial in Confidence <strong>Expression</strong> <strong>of</strong> <strong>Interest</strong> <strong>Brief</strong>
4.2.6 Supporting agreements<br />
There are four principal agreements<br />
which support the Director’s rights<br />
under the Transaction Documents:<br />
• Security Documents – Franchisees<br />
will be required to grant a first-ranking<br />
charge to the Director over all <strong>of</strong> their<br />
assets to secure the performance <strong>of</strong><br />
their obligations under the Franchise<br />
Arrangements. In addition, the parent<br />
companies <strong>of</strong> the Franchisees will<br />
be required to grant a mortgage<br />
over the shares in the Franchisees<br />
to secure those obligations;<br />
• Performance Bonds – Franchisees will<br />
be required to arrange a performance<br />
bond to be issued in favour <strong>of</strong> the<br />
Director. The Director may draw<br />
upon the Performance Bond to<br />
meet the payment obligations <strong>of</strong><br />
the Franchisees, their Franchise<br />
Entities or Metlink under the<br />
Franchise Arrangements and certain<br />
documents relating to Metlink;<br />
• Deeds <strong>of</strong> Subordination – under<br />
these deeds, the financial institution<br />
providing the Performance Bonds<br />
on behalf <strong>of</strong> a Franchisees will be<br />
required to agree to rank after<br />
the Director and the Franchisees’<br />
unsecured creditors in the event <strong>of</strong><br />
the insolvency <strong>of</strong> a Franchisee; and<br />
• Parent Company Guarantees<br />
– Franchisees may be required<br />
to provide a parent company<br />
guarantee to secure performance<br />
<strong>of</strong> their obligations to the Director<br />
under the Franchise Arrangements<br />
to a capped amount.<br />
4.3 Direct Agreements<br />
If the Franchisees elect to outsource<br />
the supply <strong>of</strong> goods and services which<br />
are crucial to the operation <strong>of</strong> tram<br />
and train services, the Franchisees<br />
will be required to procure that Direct<br />
Agreements be executed between<br />
the State and the Franchisees’ key<br />
subcontractors and suppliers.<br />
The primary aim <strong>of</strong> Direct Agreements<br />
is to protect the State’s interests<br />
when the Franchises terminate (either<br />
through natural expiry or through<br />
default) by securing continuity <strong>of</strong><br />
supply <strong>of</strong> services and/or access to<br />
warranties and intellectual property<br />
rights. Direct Agreements may<br />
also secure the effective transfer<br />
<strong>of</strong> assets, personnel and any subcontracts<br />
to a successor operator.<br />
Historically, Direct Agreements have<br />
been entered into with suppliers<br />
<strong>of</strong> infrastructure and rolling stock<br />
maintenance services, electricity for<br />
traction power, rolling stock leases<br />
and retail leases which the State<br />
would want to see continued, at least<br />
in the short term, if the Franchise<br />
Arrangements came to an end.<br />
The Franchisees will be required<br />
to procure Direct Agreements for<br />
any new key contract entered into<br />
during the Franchise period.<br />
89
4.4 Interoperator<br />
Agreements<br />
Interoperator Agreements are<br />
agreements between Franchisees<br />
and ‘Franchise Operators’ such as<br />
a tram operator, a train operator, a<br />
bus operator or Metlink. The purpose<br />
<strong>of</strong> Interoperator Agreements is to<br />
govern the use and supply <strong>of</strong> key joint<br />
services such as power supply, track<br />
access and train/tram control. The<br />
principal Interoperator Agreements<br />
will be defined in the Franchise<br />
Agreements and are likely to include:<br />
• Rail Squares Access Agreement<br />
– between the tram and train<br />
operators which will govern<br />
access to, and the maintenance<br />
<strong>of</strong>, ‘rail squares’ (where the tram<br />
and train networks intersect);<br />
• Track Access Agreements – the<br />
train operator will be required<br />
to grant track access to other<br />
train operators such as VLP,<br />
CountryLink, and Great Southern<br />
Railway under these agreements;<br />
• Station Agreements – the train<br />
operator will be required to grant<br />
VLP access to certain metropolitan<br />
railway stations, as well as facilities<br />
and services at those stations,<br />
pursuant to a station agreement with<br />
the train operator. Agreements will<br />
also be required to govern the train<br />
operator’s access to Southern Cross<br />
Station and the provision <strong>of</strong> services<br />
within Southern Cross Station;<br />
• Traction Power Agreement<br />
– Interoperator agreements<br />
for reconciliation <strong>of</strong> costs <strong>of</strong><br />
electricity consumption may<br />
be required between the tram<br />
and train operators; and<br />
• Rolling Stock Hire Agreement –<br />
between VLP and Connex under<br />
which rolling stock required by<br />
Connex to operate services on the<br />
Stony Point Line is hired from VLP.<br />
A number <strong>of</strong> agreements relating<br />
to the ownership, governance and<br />
funding <strong>of</strong> Metlink are also considered<br />
‘Interoperator Agreements’ under<br />
the current Franchise Agreements.<br />
4.5 Third Party<br />
Agreements<br />
The Franchisees may also enter into<br />
a number <strong>of</strong> other material contracts<br />
with their suppliers. Some <strong>of</strong> these<br />
agreements, although material,<br />
are not sufficiently important to be<br />
a ‘key contract’ and thus do not<br />
warrant a Direct Agreement between<br />
the Director and the supplier.<br />
4.6 Metlink & TTA<br />
Agreements<br />
Metlink and TTA are transport<br />
sector bodies which are currently<br />
not recognised in the statutory<br />
framework outlined above. However,<br />
they both play an integral role<br />
in the industry framework.<br />
90<br />
Commercial in Confidence <strong>Expression</strong> <strong>of</strong> <strong>Interest</strong> <strong>Brief</strong>
4.6.1 Metlink<br />
Metlink was established as a proprietary<br />
limited company under the Corporations<br />
Act 2001 (Cth) and is currently<br />
jointly owned by the Franchisees.<br />
Metlink is responsible for networkwide<br />
functions such as marketing,<br />
customer information, data collection<br />
and analysis and public transport<br />
advocacy. Although the ownership<br />
and governance structure <strong>of</strong> Metlink<br />
may change following re-franchising,<br />
the current contractual framework<br />
relating to Metlink provides a good<br />
indication <strong>of</strong> its’ likely future structure.<br />
The contractual framework relating<br />
to the functions <strong>of</strong> Metlink is primarily<br />
based on the following documents:<br />
• Metlink Services Agreements –<br />
between the Director and Metlink<br />
which sets out the services which<br />
Metlink is obligated to provide<br />
to the Director and the payment<br />
regime for those services;<br />
• Franchisee Services Agreements<br />
- between each <strong>of</strong> the Franchisees<br />
and Metlink which will require the<br />
parties to provide each other with an<br />
agreed set <strong>of</strong> services. The services<br />
to be provided by the Franchisees to<br />
Metlink will be set out in the Franchise<br />
Agreements and will support the<br />
services to be provided by Metlink<br />
to the Director under the Metlink<br />
Services Agreement. For example,<br />
the Franchisees will be obliged to<br />
provide Metlink with the data it<br />
requires (a Franchise Agreements<br />
obligation) to fulfil its obligations<br />
in relation to the timely provision<br />
<strong>of</strong> timetable information (a Metlink<br />
Services Agreement obligation);<br />
• Metlink Shareholders’ Agreement<br />
– between the Franchisees which<br />
will establish the board structure,<br />
governance regime, voting<br />
rights and liquidity requirements<br />
<strong>of</strong> Metlink and set out its key<br />
functions to be undertaken; and<br />
• Franchise Agreements - will require<br />
the Franchisees to purchase specified<br />
services from Metlink (as opposed<br />
to undertaking them individually) and<br />
also to provide certain services to<br />
Metlink to enable Metlink to perform<br />
its obligations to the Director under<br />
the Metlink Services Agreement.<br />
As noted above, a number <strong>of</strong><br />
agreements relating to the ownership,<br />
governance and funding <strong>of</strong> Metlink are<br />
considered ‘Interoperator Agreements’<br />
under the current Franchise Agreements.<br />
4.6.2 TTA<br />
TTA, which was established under the<br />
State Owned Enterprises Act 1992<br />
(Vic), is principally responsible for<br />
administering the existing OneLink<br />
ticketing system, procuring the<br />
introduction <strong>of</strong> a new ticketing system,<br />
revenue collection and revenue<br />
allocation in relation to the Melbourne<br />
metropolitan tram and train networks.<br />
TTA is a party to the New Ticketing<br />
Solution Project Agreement with Keane<br />
Australia Micropayment Consortium<br />
Pty Ltd relating to the acquisition<br />
<strong>of</strong> the new ticketing system. TTA<br />
is also currently responsible for<br />
receipt <strong>of</strong> revenue received through<br />
the existing ticketing system, and<br />
allocation <strong>of</strong> that revenue among the<br />
transport operators, in accordance<br />
with the following agreements:<br />
91
• Revenue Sharing Agreement –<br />
between the Director, Connex,<br />
Yarra Trams, VLP and TTA, which<br />
describes how revenue will be<br />
collected by TTA on behalf <strong>of</strong> the<br />
operators and the Director, and how<br />
it will be distributed between them;<br />
• <strong>Transport</strong> Ticketing System Transition<br />
Agreement – between the Director,<br />
TTA, Metlink, Connex, Yarra Trams<br />
and VLP, which (amongst other things)<br />
sets out the services which will be<br />
provided by TTA to the Director; and<br />
• Ticketing Management Agreement -<br />
between the Director and TTA, which<br />
principally establishes the rights<br />
and obligations <strong>of</strong> the Director, in<br />
relation to TTA’s existing ticketing<br />
arrangements with OneLink.<br />
4.7 <strong>Public</strong> <strong>Transport</strong><br />
Ombudsman (‘PTO’)<br />
The PTO scheme was established to<br />
receive, investigate and facilitate the<br />
resolution <strong>of</strong> complaints and disputes<br />
between public transport users<br />
and transport operators, where the<br />
operators have been unable to resolve<br />
the complaint in the first instance.<br />
The PTO is supported by <strong>Public</strong><br />
<strong>Transport</strong> Ombudsman Limited, a<br />
company limited by guarantee and<br />
governed by a board <strong>of</strong> Directors<br />
comprised <strong>of</strong> industry and consumer<br />
representatives who oversee the<br />
independent operation <strong>of</strong> the scheme.<br />
The Franchisees will be required to<br />
become members <strong>of</strong> the PTO scheme.<br />
Depending on the timing <strong>of</strong> the<br />
delivery <strong>of</strong> the new ticketing<br />
system, the contractual relationship<br />
with TTA may differ from the<br />
arrangements outlined above.<br />
92<br />
Commercial in Confidence <strong>Expression</strong> <strong>of</strong> <strong>Interest</strong> <strong>Brief</strong>
Endnotes<br />
1 Australian Bureau <strong>of</strong> Statistics, population as at June<br />
2007, www.abs.gov.au, site viewed 07/01/2007<br />
2 Australian Bureau <strong>of</strong> Statistics, 2006 Census Quickstats: Melbourne<br />
(Statistical Division)<br />
3 Travel <strong>Victoria</strong>, Geelong Facts and Services,<br />
http://www.travelvictoria.com.au/geelong/facts/, site viewed 07/12/2007<br />
4 Australian Government Bureau <strong>of</strong> Meteorology, Forecasting the weather,<br />
http://www.bom.gov.au/info/ftweather/page_30.<br />
shtml, site viewed 07/12/2007<br />
5 Australian Bureau <strong>of</strong> Statistics, 2007 Australia Year Book, Dec 2006<br />
6 M. Edey, The Australian Economy in 2007, Reserve Bank <strong>of</strong> Australia,<br />
7 March 2007<br />
7 DFAT Australia Fact Sheet, www.dfat.gov.au, site viewed 10/12/2007<br />
8 DFAT Australia Fact Sheet, www.dfat.gov.au, site viewed 10/12/2007<br />
9 Invest <strong>Victoria</strong>, Economic Overview, www.investvictoria.<br />
com/EconomicOverview site viewed 10/12/2007<br />
10 Department <strong>of</strong> Treasury and Finance, <strong>Victoria</strong>n Budget Overview 07/08,<br />
May 2007<br />
11 Department <strong>of</strong> Treasury and Finance, <strong>Victoria</strong>n Budget Overview 07/08,<br />
May 2007<br />
12 Invest <strong>Victoria</strong>, Economic Overview, www.investvictoria.<br />
com/EconomicOverview site viewed 10/12/2007<br />
13 Invest <strong>Victoria</strong>, Economic Overview, www.investvictoria.<br />
com/EconomicOverview site viewed 10/12/2007<br />
14 Live in <strong>Victoria</strong>, Economy, http://www.liveinvictoria.<br />
vic.gov.au site viewed 10/12/2007<br />
15 Invest <strong>Victoria</strong>, Quick Facts Melbourne, <strong>Victoria</strong>, Australia,<br />
www.investvictoria.com site viewed 10/12/2007<br />
16 Invest <strong>Victoria</strong>, Melbourne <strong>Transport</strong> – Road network,<br />
www.investvictoria.com.au, site viewed 10/12/2007<br />
17 Invest <strong>Victoria</strong>, <strong>Transport</strong> Network Melbourne, <strong>Victoria</strong>, Australia –<br />
Rail transport, www.investvictoria.com, site viewed 10/12/2007.<br />
93
Endnotes continued<br />
18 <strong>Victoria</strong>n Rail Freight Network Review, Switchpoint: The template for rail<br />
freight to revive and thrive, http://www.doi.vic.gov.au/DOI/DOIElect.<br />
nsf/$UNIDS+for+Web+Display/54E33823FAE1EF29CA2573B7001<br />
B1E96/$FILE/RFNR-FinalReport.pdf, site viewed 21/01/2008<br />
19 Department <strong>of</strong> Infrastructure, Melbourne 2030 Planning<br />
for sustainable growth, October 2002<br />
20 <strong>Victoria</strong>n Competition & Efficiency Commission, “Making the right choices:<br />
Options for managing transport Congestion”, September 2006<br />
http://www.vcec.vic.gov.au/domino/web_notes/vcec/vcecweb.nsf<br />
21 That’s Melbourne, www.thatsmelbourne.com.au, site viewed 10/12/2007<br />
22 Office <strong>of</strong> the <strong>Victoria</strong>n Premier and Office <strong>of</strong> the <strong>Victoria</strong>n Treasurer, ‘City<br />
car parking levy to ease congestion’, Media Release, 22 April 2005<br />
23 Office <strong>of</strong> the <strong>Victoria</strong>n Premier and Office <strong>of</strong> the <strong>Victoria</strong>n Treasurer, ‘City<br />
car parking levy to ease congestion’, Media Release, 22 April 2005<br />
24 <strong>Victoria</strong>n Competition and Efficiency Commission, Making the right<br />
choices: Options for managing transport congestion, September 2006<br />
25 Left intentionally blank<br />
26 Invest <strong>Victoria</strong>, Melbourne <strong>Transport</strong>, www.investvictoria.<br />
com site viewed 10/12/2007 and 21/01/2008<br />
27 Invest <strong>Victoria</strong>, Melbourne <strong>Transport</strong>, www.investvictoria.<br />
com site viewed 10/12/2007 and 21/01/2008<br />
28 Port <strong>of</strong> Melbourne, Channel Deepening Project, Project benefits,<br />
www.channelproject.com, site viewed 21/01/2008<br />
29 Invest <strong>Victoria</strong>, <strong>Transport</strong> Network, Melbourne,, <strong>Victoria</strong>, Australia – Port <strong>of</strong><br />
Melbourne and sea transport, www.investvictoria.com, site viewed 21/01/2008<br />
30 Internet World Statistics, http://www.internetworldstats.com/sp/au.htm ,<br />
site viewed 12/12/2007<br />
31 Department <strong>of</strong> Communications, Information Technology and the<br />
Arts, Information Economy Index 2006, www.dcita.gov.au<br />
32 Invest <strong>Victoria</strong>, Think Melbourne, Australia for ICT, www.investvictoria.com,<br />
site viewed 12/12/2007<br />
94<br />
Commercial in Confidence <strong>Expression</strong> <strong>of</strong> <strong>Interest</strong> <strong>Brief</strong>
33 Invest <strong>Victoria</strong>, Australia’s Banking System, www.investvictoria.com,<br />
site viewed 10/12/2007<br />
34 Live in <strong>Victoria</strong>, Economy, www.liveinvictoria.vic.gov.au site viewed 10/12/2007<br />
35 Blake Dawson Waldron and Invest Australia, Australia: An<br />
Introduction for Investors, 2006/07 edition, September 2006<br />
36 Left intentionally blank<br />
37 Invest <strong>Victoria</strong>, www.investvictoria.com/Creativity, site viewed 11/12/2007<br />
38 Study Melbourne, www.studymelbourne.com.au, site viewed 11/12/2007<br />
39 Australian Bureau <strong>of</strong> Statistics, 2006 Census, www.abs.gov.au<br />
40 Australian Bureau <strong>of</strong> Statistics, Table 05. Labour force status by Sex -<br />
<strong>Victoria</strong> - Trend, Seasonally adjusted and Original, Labour Force, Australia,<br />
Spreadsheets, Cat no. 6202.0.55.001, site viewed 07/01/2008<br />
41 Australian Bureau <strong>of</strong> Statistics, Table 05. Labour force status by Sex -<br />
<strong>Victoria</strong> - Trend, Seasonally adjusted and Original, Labour Force, Australia,<br />
Spreadsheets, Cat no. 6202.0.55.001, site viewed 07/01/2008<br />
42 Australian Bureau <strong>of</strong> Statistics, Table 05. Labour force status by Sex -<br />
<strong>Victoria</strong> - Trend, Seasonally adjusted and Original, Labour Force, Australia,<br />
Spreadsheets, Cat no. 6202.0.55.001, SAHA analysis, site viewed 07/01/2008<br />
43 Australian Bureau <strong>of</strong> Statistics, Table 05. Labour force status by Sex -<br />
<strong>Victoria</strong> - Trend, Seasonally adjusted and Original, Labour Force, Australia,<br />
Spreadsheets, Cat no. 6202.0.55.001, SAHA analysis, site viewed 07/01/2008<br />
44 Melbourne City Council, Census <strong>of</strong> Land Use and Employment (CLUE), 2006<br />
45 <strong>Victoria</strong>n Government, Meeting Our <strong>Transport</strong> Challenges, May 2006, <strong>Victoria</strong><br />
46 Metropolis, “About Melbourne, <strong>Victoria</strong> – one <strong>of</strong> the world’s most liveable cities”,<br />
http://www.metropolis2007.org/melbourne.php ,site viewed 31/12/2007<br />
47 Invest <strong>Victoria</strong>, Living in Melbourne, www.investvictoria.<br />
com/LivinginMelbourne, sited viewed 13/12/2007<br />
48 Department <strong>of</strong> Infrastructure, Melbourne 2030 Planning<br />
for sustainable growth, October 2002<br />
49 Economics Intelligence Unit, “Where the Grass is Greener”, Economist.<br />
com, www.economist.com, site viewed 13/12/2007<br />
50 Business Melbourne, “Why Melbourne”, www.businessmelbourne.com.au,<br />
site viewed 13/12/2007<br />
95
Endnotes continued<br />
51 Australian Bureau <strong>of</strong> Statistics, 2006 Census QuikStats: Melbourne (Statistical<br />
Division), http://www.censusdata.abs.gov.au/ABSNavigation/prenav/Pop<br />
ularAreascollection=census&period=2006 , site viewed 06/12/2007<br />
52 Australian Bureau <strong>of</strong> Statistics, 2006 Census QuikStats: Melbourne (Statistical<br />
Division), http://www.censusdata.abs.gov.au/ABSNavigation/prenav/Pop<br />
ularAreascollection=census&period=2006 , site viewed 06/12/2007<br />
53 Australian Bureau <strong>of</strong> Statistics, Population Diversity in Local Councils in<br />
<strong>Victoria</strong>: 2006 Census, www.abs.gov.au, site viewed 06/12/2007<br />
54 Melbourne, http://www.melbourne.com.au/<br />
gardens.htm, site viewed 13/12/2007<br />
55 Left intentionally blank<br />
56 Left intentionally blank<br />
57 Bob Larson’s Tennis News, Final 2008 Australian Open Wrap-Up,<br />
http://www.tennisnews.com., site viewed 13/02/2008<br />
58 InfoRally, http://www.inforally.sibiul.ro/formula1-news-9022-melbourne_<br />
expects_higher_gp_attendance.html site viewed 13/12/2007<br />
59 AFL Statistics, www.afl.com.au, site viewed 13/12/2007<br />
60 Melbourne Cup Carnival, “2007 Melbourne Cup Carnival a Spectacular<br />
Success”, http://www.melbournecup.com.au/<br />
melbourne%2Dcup%2Dcarnival/ , site viewed 17/12/2007<br />
61 Cricinfo, Australia v India,<br />
http://content-aus.cricinfo.com/ci/engine/match/291351.html ,<br />
site viewed 22/01/2008<br />
62 Melbourne Comedy Festival, Marketing Report 2007,<br />
www.comedyfestival.com.au, site viewed 17/12/2007<br />
63 Melbourne International Film Festival, About MIFF,<br />
www.melbournefilmfestival.com.au, site viewed 17/12/2007<br />
64 Royal Agricultural Society, http://www.rasv.com.au/<br />
royal_melbourne_show.asp, site viewed 17/04/2008<br />
96<br />
Commercial in Confidence <strong>Expression</strong> <strong>of</strong> <strong>Interest</strong> <strong>Brief</strong>
65 Melbourne International Arts Festival, About Us – Background,<br />
www.melbournefestival.com.au, site viewed 21/01/2008<br />
66 City <strong>of</strong> Melbourne, Moomba Waterfest,<br />
http://www.melbourne.vic.gov.au/info.cfmtop=23&pg=1541,<br />
site viewed 21/01/2008<br />
67 Melbourne Food and Wine Festival,<br />
http://www.melbournefoodandwine.com.au/www/html/7-home-page.asp<br />
site viewed 21/01/2008<br />
68 Australian Bureau <strong>of</strong> Statistics, Australia Year Book 2007, Dec 2006<br />
69 Australian Bureau <strong>of</strong> Statistics, Australian Historical Population Statistics –<br />
Table 18, Cat no 3105.0.65.001, www.abs.gov.au, site viewed 03/01/08<br />
70 Australian Bureau <strong>of</strong> Statistics, Australian Historical Population Statistics –<br />
Table 18, Cat no 3105.0.65.001, www.abs.gov.au, site viewed 03/01/08<br />
71 Australian Bureau <strong>of</strong> Statistics, Regional Population Growth, Australia, 1996<br />
to 2006, cat no. 3218.0<br />
72 Department <strong>of</strong> Infrastructure, Melbourne 2030, 2002<br />
73 KPMG, Population Growth Report 2007, November 2007, synopsis published<br />
on www.kpmg.com.au/default.aspxTabID=214&KPMGArticleItemID=2751<br />
74 Australian Bureau <strong>of</strong> Statistics, Australian Historical Population Statistics,<br />
Category number 3105.0.65.001, www.abs.gov.au, site viewed 20/12/2007<br />
75 Australian Bureau <strong>of</strong> Statistics, Series B Projections, 2006,<br />
www.abs.gov.au, SAHA analysis<br />
76 Australian Bureau <strong>of</strong> Statistics, Regional Population Growth Australia,<br />
Catalogue 321.8.0•2005–06, 27/02/2007<br />
77 Australian Bureau <strong>of</strong> Statistics, 3201.0 – Population by Age and Sex, Australian<br />
States and Territories, June 2007, www.abs.gov.au, site viewed 20/12/2007<br />
78 Australian Bureau <strong>of</strong> Statistics, 3201.0 – Population by Age and Sex, Australian<br />
States and Territories, June 2007, www.abs.gov.au, site viewed 20/12/2007<br />
79 Australian Bureau <strong>of</strong> Statistics, 2007 Year Book Australia, Dec 2006 p130<br />
80 Australian Bureau <strong>of</strong> Statistics, Australian Demographic Statistics,<br />
June Quarter 2007, Cat no 3101.0, released 4 Dec 2007<br />
81 Australian Bureau <strong>of</strong> Statistics, 2007 Year Book Australia, Dec 2006 p133<br />
82 Australian Bureau <strong>of</strong> Statistics, 2007 Year Book Australia, Dec 2006, p134<br />
97
Endnotes continued<br />
83 Australian Bureau <strong>of</strong> Statistics, 2007 Year Book Australia, Dec 2006, p134<br />
84 City <strong>of</strong> Melbourne, Suburbs and Precincts, www.melbourne.vic.gov.au,<br />
site viewed 13/12/2007<br />
85 Australian Bureau <strong>of</strong> Statistics, www.abs.gov.au, site viewed 16/1/2008<br />
86 City <strong>of</strong> Melbourne, 2001 – 2006 Analysis <strong>of</strong> Housing and Population<br />
87 City <strong>of</strong> Melbourne, City Plan 2010, The city <strong>of</strong> Melbourne in 2005, pg 8<br />
88 Left intentionally blank<br />
89 Left intentionally blank<br />
90 Left intentionally blank<br />
91 Department <strong>of</strong> Infrastructure, <strong>Public</strong> <strong>Transport</strong>, What is SmartBus,<br />
www.doi.vic.gov.au, site viewed 15/01/2008<br />
92 Australian Bureau <strong>of</strong> Statistics, Motor Vehicle Census 31 March 2007,<br />
www.abs.gov.au, site viewed 18/01/2008<br />
93 Analysis <strong>of</strong> ABS Motor Vehicle Census 2004-2007 & Population Projections Data<br />
94 Metropolitan <strong>Transport</strong> Forum Presentation ‘Most Liveable and Best Connected’<br />
95 <strong>Victoria</strong>n Government, Melbourne 2030 – Direction 8 Better <strong>Transport</strong><br />
Links, http://www.dse.vic.gov.au/melbourne2030online/content/<br />
policies_initiatives/08a_policy81.html, site viewed 15/01/2008<br />
96 <strong>Victoria</strong>n Government, Melbourne 2030, Australia 2002<br />
97 Luk, James, Olszewski and Piotr, Road and <strong>Transport</strong> Research,<br />
December 2003<br />
98 Regional <strong>Transport</strong> Statistics: 2006 Edition, UK Department <strong>of</strong> <strong>Transport</strong><br />
99 EMTA Barometer <strong>of</strong> <strong>Public</strong> <strong>Transport</strong> in the European<br />
Metropolitan Areas, December 2004<br />
100 Left intentionally blank<br />
101 <strong>Victoria</strong>n Competition & Efficiency Commission, ‘Making the right<br />
choices: Options for managing transport Congestion’<br />
102 Left intentionally blank<br />
103 Left intentionally blank<br />
98<br />
Commercial in Confidence <strong>Expression</strong> <strong>of</strong> <strong>Interest</strong> <strong>Brief</strong>
104 Department <strong>of</strong> Infrastructure, Metropolitan Melbourne <strong>Public</strong><br />
<strong>Transport</strong> Patronage, Official Patronage Series<br />
105 World Factbook <strong>of</strong> Criminal Justice Systems,<br />
http://www.ojp.usdoj.gov/bjs/pub/ascii/wfbcjaus.txt, site viewed 07/01/2008<br />
106 Australian <strong>Public</strong> Service Commission, The Australian Experience <strong>of</strong><br />
<strong>Public</strong> Sector Reform, http://www.apsc.gov.au/about/exppsreform3.htm,<br />
site viewed 07/01/2008<br />
107 Australian <strong>Public</strong> Service Commission, The Australian Experience<br />
<strong>of</strong> <strong>Public</strong> Sector Reform, www.apsc.gov.au/about/exppsreform3.htm,<br />
site viewed 07/01/2008<br />
108 Australian <strong>Public</strong> Service Commission, The Australian Experience<br />
<strong>of</strong> <strong>Public</strong> Sector Reform, www.apsc.gov.au/about/exppsreform3.htm,<br />
site viewed 07/01/2008<br />
109 <strong>Victoria</strong>’s Constitution, Constitution Act 1975,<br />
http://www.parliament.vic.gov.au/const.html, site viewed 07/01/2008<br />
110 Australian <strong>Public</strong> Service Commission, The Australian Experience<br />
<strong>of</strong> <strong>Public</strong> Sector Reform, http://www.apsc.gov.au/about/<br />
exppsreform3.htm, site viewed 07/1/2008<br />
111 The current Minister for <strong>Public</strong> <strong>Transport</strong> in <strong>Victoria</strong> is Ms Lynne Kosky<br />
112 Invest <strong>Victoria</strong>, Relocation Guide Melbourne, Australia, www.<br />
investvictoria.com, site viewed 08/01/2008<br />
113 Department <strong>of</strong> Planning and Community Development, Local Government<br />
<strong>Victoria</strong>, http://www.localgovernment.vic.gov.au/web22/dvclgg.nsf,<br />
site viewed 08/01/2008<br />
114 Human Rights and Equal Opportunity Commission, DDA Guide,<br />
http://www.hreoc.gov.au/disability_rights/dda_guide/ins/ins.html,<br />
site viewed 21/01/2008<br />
115 Australian Government, Attorney-General’s Department,<br />
http://www.ag.gov.au/www/agd/rort+standards)+-<br />
+ILHRD.DOC, site viewed 21/01/2008<br />
116 Department <strong>of</strong> Infrastructure, <strong>Public</strong> <strong>Transport</strong> – Accessible <strong>Public</strong> <strong>Transport</strong> in<br />
<strong>Victoria</strong> – Action Plan 2006-2012, www.doi.vic.gov.au, site viewed 21/01/2008<br />
117 Australian Labor Party, ‘Forward with fairness, policy implementation plan’,<br />
www.alp.org.au/media/0807/msdloploo280.php, site viewed 22/01/2008<br />
99
Endnotes continued<br />
118 Department <strong>of</strong> Immigration and Citizenship, Visas & Immigration,<br />
http://www.immi.gov.au/skilled/business/456/how-to-apply.htm,<br />
site viewed 21/01/2008<br />
119 <strong>Public</strong> <strong>Transport</strong> Division, DOI, ‘<strong>Public</strong> <strong>Transport</strong> Partnerships – An Overview<br />
<strong>of</strong> Passenger Rail Franchising in <strong>Victoria</strong>’, March 2005<br />
120 <strong>Public</strong> <strong>Transport</strong> Division, DOI, ‘<strong>Public</strong> <strong>Transport</strong> Partnerships – An Overview<br />
<strong>of</strong> Passenger Rail Franchising in <strong>Victoria</strong>’, March 2005<br />
121 Department <strong>of</strong> Infrastructure, <strong>Public</strong> Private Partnership Agreements,<br />
http://www.doi.vic.gov.au/DOI/Internet/transport.nsf/AllDocs/19D8E6C7F<br />
444848DCA256E3E00162879OpenDocument, site viewed 17/12/2007<br />
122 <strong>Public</strong> <strong>Transport</strong> Division, DOI ‘<strong>Public</strong> <strong>Transport</strong> Partnerships – An Overview<br />
<strong>of</strong> Passenger Rail Franchising in <strong>Victoria</strong>’, March 2005<br />
123 Yarra Trams, Facts & Figures Our Tram Network, www.yarratrams.com.au,<br />
site viewed 11/01/2008<br />
124 Department <strong>of</strong> Infrastructure, Tram Accessibility, www.doi.vic.gov.au,<br />
site viewed 22/01/2008<br />
125 Metlink, Accessible Trams, www.metlinkmelbourne.com.au,<br />
site viewed 22/01/2008<br />
126 Yarra Trams, Facts & Figures Our Tram Network, www.yarratrams.com.au,<br />
site viewed 11/01/2008<br />
127 Department <strong>of</strong> Infrastructure, <strong>Public</strong> <strong>Transport</strong> -Tram projects and<br />
programs, www.doi.vic.gov.au, site viewed 23/01/2008<br />
128 <strong>Victoria</strong>n Competition and Efficiency Commission, Making the right<br />
choices: Options for managing transport congestion, September 2006<br />
129 Department <strong>of</strong> Infrastructure, Tram projects and programs,<br />
http://www.doi.vic.gov.au/DOI/Internet/transport.nsf/AllDocs/C7E281CCF<br />
FC65BFC4A256AE6000FE6BFOpenDocument, site viewed 11/01/2008<br />
130 Department <strong>of</strong> Infrastructure, <strong>Public</strong> <strong>Transport</strong> Facts & Figures,<br />
http://www.doi.vic.gov.au/DOI/Internet/transport.nsf/AllDocs/D189BF23463<br />
1D049CA25721E001CAB3FOpenDocument#Trains, site viewed 14/01/2008<br />
131 Department <strong>of</strong> Infrastructure, History <strong>of</strong> Melbourne’s Metropolitan Rail System<br />
and the Adoption <strong>of</strong> the Underground Rail Loop Concept,<br />
http://www.doi.vic.gov.au/doi/doielect.nsf/2a6bd98dee287482ca256915001cf<br />
f0c/44507f9d12a4406cca25700c0012fe36/$FILE/MURL%20booklet.pdf,<br />
site viewed 14/01/2008<br />
100<br />
Commercial in Confidence <strong>Expression</strong> <strong>of</strong> <strong>Interest</strong> <strong>Brief</strong>
132 Department <strong>of</strong> Infrastructure, <strong>Public</strong> <strong>Transport</strong> – City Loop History,<br />
www.doi.vic.gov.au, site viewed 14/01/2008<br />
133 Department <strong>of</strong> Infrastructure, <strong>Public</strong> <strong>Transport</strong> – Premium Stations,<br />
www.doi.vic.gov.au, site viewed 14/01/2008<br />
134 Department <strong>of</strong> Infrastructure, <strong>Public</strong> <strong>Transport</strong> – Flinders Street Station,<br />
www.doi.vic.gov.au, site viewed 14/01/2008<br />
135 Department <strong>of</strong> Infrastructure, PASS Assets GIS (DOI public<br />
transport infrastructure information system)<br />
136 Connex Melbourne, Fast Facts,<br />
www.connexmelbourne.com.au/index.phpid=46,<br />
site viewed 14/01/2008<br />
137 Department <strong>of</strong> Infrastructure, Metropolitan Train Procurement, Update<br />
Report to Project Review Committee, 23 November 2006<br />
138 Left intentionally blank<br />
139 Department <strong>of</strong> Infrastructure, Train Timetables, Connex and Metlink<br />
websites, sites viewed 14/01/2008<br />
140 Connex Melbourne, Fast Facts, as at October 2007,<br />
www.connexmelbourne.com.au/index.phpid=46, site viewed 14/01/2008<br />
141 Metlink, Metcards, www.metlinkmelbourne.com.au, site viewed 11/01/2008<br />
142 Metlink, Fares, Tickets – Concessions, www.metlinkmelbourne.com.au,<br />
site viewed 16/01/2008<br />
143 Metlink Intelligence Reports, Revenue, Jul-Sep 06 – Apr-Jun07, SAHA analysis<br />
144 Metlink Intelligence Reports, Revenue, Jul-Sep 06 – Apr-Jun 07, SAHA analysis<br />
145 Metlink, Market Intelligence Review, July – September 2007, p17<br />
146 Office <strong>of</strong> the <strong>Victoria</strong>n Premier, ‘Early Bird to be rolled out across metro<br />
trains’, Media Release, 7 March 2008<br />
147 Metlink, Quarterly Reports, July-September 2006 – April-June 2007<br />
148 Department <strong>of</strong> Infrastructure, Track Record, Editions 23 (July 2005),<br />
27 (August 2006) and 32 (November 2007)<br />
149 Department <strong>of</strong> Infrastructure, Track Record, Editions 23 (July 2005),<br />
27 (August 2006) and 32 (November 2007)<br />
101
Endnotes continued<br />
150 Department <strong>of</strong> Infrastructure, Track Record, Editions 23 (July 2005),<br />
27 (August 2006) and 32 (November 2007)<br />
151 Left intentionally blank<br />
152 Left intentionally blank<br />
153 Department <strong>of</strong> Infrastructure, Metropolitan Melbourne <strong>Public</strong><br />
<strong>Transport</strong> Patronage, Official Patronage Series.<br />
154 Department <strong>of</strong> Infrastructure, Train Plan, 29 October 2007<br />
155 Department <strong>of</strong> Infrastructure, Metropolitan Melbourne <strong>Public</strong> <strong>Transport</strong><br />
Patronage, Official Patronage Series, issued 18 march 2008<br />
156 Department <strong>of</strong> Infrastructure, Metropolitan Melbourne <strong>Public</strong> <strong>Transport</strong><br />
Patronage, Official Patronage Series, issued 18 march 2008<br />
157 Department <strong>of</strong> Infrastructure, Metropolitan Melbourne <strong>Public</strong> <strong>Transport</strong><br />
Patronage, Official Patronage Series, issued 18 march 2008<br />
158 Department <strong>of</strong> Infrastructure, Metropolitan Melbourne <strong>Public</strong> <strong>Transport</strong><br />
Patronage, Official Patronage Series, issued 18 march 2008<br />
159 Caltex, Historical Pricing – <strong>Victoria</strong> city, www.caltex.com.<br />
au/pricing_his.asp, site viewed 15/01/2008<br />
160 Caltex, Historical Pricing – <strong>Victoria</strong> city, www.caltex.com.<br />
au/pricing_his.asp, site viewed 26/02/2008<br />
161 Melbourne City Council, Census <strong>of</strong> Land Use and Employment (CLUE), 2006<br />
162 Reserve Bank <strong>of</strong> Australia,<br />
http://www.rba.gov.au/Statistics/cashrate_target.html,<br />
site viewed 05/02/2008<br />
163 Office <strong>of</strong> the <strong>Victoria</strong>n Premier and Office <strong>of</strong> the <strong>Victoria</strong>n Treasurer,<br />
‘City car parking levy to ease congestion’, Media Release, 22 April 2005<br />
164 State <strong>of</strong> <strong>Victoria</strong>, Meeting Our <strong>Transport</strong> Challenges, Connecting<br />
<strong>Victoria</strong>n Communities, The Plan, May 2006, p55<br />
102<br />
Commercial in Confidence <strong>Expression</strong> <strong>of</strong> <strong>Interest</strong> <strong>Brief</strong>
165 Media Release from the Minister for <strong>Public</strong> <strong>Transport</strong>, ‘Removal <strong>of</strong> zone 3<br />
means savings for passengers’, http://www.legislation.vic.gov.au/domino/<br />
Web_Notes/newmedia.nsf/b0222c68d27626e2ca256c8c001a3d2d/92cdc0<br />
165023aa5bca257294007b9355!OpenDocument, site viewed 15/01/2008<br />
166 Australian Automobile Association, Petrol Prices,<br />
http://www.aaa.asn.au/issues/petrol.htm, site viewed 23/01/2008<br />
167 Reserve Bank <strong>of</strong> Australia, Monetary Policy Changes,<br />
http://www.rba.gov.au/Statistics/cashrate_target.html,<br />
site viewed 23/01/2008<br />
168 Department <strong>of</strong> Infrastructure, Metropolitan Melbourne <strong>Public</strong> <strong>Transport</strong><br />
Patronage, Official Patronage Series, issued 18 March 2008<br />
169 Department <strong>of</strong> Infrastructure, Connex load standards survey, October 2007<br />
170 Metropolitan Train Fleet Procurement – Stage 1: Business Case<br />
171 <strong>Victoria</strong>n Government, Report on the 2007-08 Budget Estimates –<br />
Part three, P 182,<br />
172 Department <strong>of</strong> Infrastructure, Yarra Trams load Standards Survey 2007,<br />
Draft 1, <strong>Public</strong> <strong>Transport</strong> Division Information Services, December 2007<br />
173 Department <strong>of</strong> Infrastructure, Annual Reports 1999/00 – 2006/07<br />
174 Yarra Trams and Connex Business Plan Reporting<br />
Templates 2004/05 – 2006/07<br />
175 Department <strong>of</strong> Infrastructure, Annual Report 2006/07<br />
176 Department <strong>of</strong> Infrastructure, Annual Reports 2005/06 - 2006/07<br />
177 Metlink, Market Quarterly Report, July – September 2007<br />
178 Department <strong>of</strong> Infrastructure, Annual Reports 2004/05 – 2006/07<br />
179 Department <strong>of</strong> Infrastructure, Annual Reports 1999/00 – 2006/078.1<br />
180 Department <strong>of</strong> Infrastructure, Annual Reports 1999/00 – 2006/07<br />
181 Department <strong>of</strong> Infrastructure, Annual Reports 1999/00 – 2006/07<br />
182 VicRoads, Think Tram, www.vicroads.vic.gov.au, site viewed 24/01/2008<br />
183 Yarra Trams’ Submission to the VCEC Inquiry into <strong>Transport</strong> Congestion<br />
184 VicRoads, Think Tram, www.vicroads.vic.gov.au, site viewed 24/01/2008<br />
103
Endnotes continued<br />
185 Department <strong>of</strong> Infrastructure, <strong>Public</strong> <strong>Transport</strong> – Train projects<br />
and programs, www.doi.vic.gov.au, site viewed 17/01/2008<br />
186 Left intentionally blank<br />
187 Department <strong>of</strong> Infrastructure, 2004 – 2005 Annual Report, Outcome 3<br />
188 Left intentionally blank<br />
189 Department <strong>of</strong> Infrastructure, <strong>Public</strong> <strong>Transport</strong> – Metropolitan rail<br />
network improvements, www.doi.vic.gov.au, site viewed 24/01/2008<br />
190 Department <strong>of</strong> Infrastructure, <strong>Public</strong> <strong>Transport</strong> – Tram projects<br />
and programs, www.doi.vic.gov.au, site viewed 24/01/2008<br />
191 Department <strong>of</strong> Infrastructure, <strong>Public</strong> <strong>Transport</strong> – Metropolitan rail<br />
network improvements, www.doi.vic.gov.au, site viewed 24/01/2008<br />
192 Left intentionally blank<br />
193 Left intentionally blank<br />
194 Left intentionally blank<br />
195 Left intentionally blank<br />
104<br />
Commercial in Confidence <strong>Expression</strong> <strong>of</strong> <strong>Interest</strong> <strong>Brief</strong>
105
For further information please contact the Department <strong>of</strong> <strong>Transport</strong> on 9655 6000 or visit www.transport.vic.gov.au<br />
Published and authorised by the Department <strong>of</strong> <strong>Transport</strong>, 121 Exhibition Street, Melbourne, <strong>Victoria</strong>.<br />
May 2008 © State <strong>of</strong> <strong>Victoria</strong>.<br />
Printed by On Demand, 152 Sturt Street, Southbank, <strong>Victoria</strong>.<br />
If you would like to receive this publication in an accessible format, please telephone <strong>Public</strong> Affairs Branch on 9655 6000.<br />
DOT3552/08