

2009 KEY For our customers. - Alle jaarverslagen
2009 KEY For our customers. - Alle jaarverslagen
2009 KEY For our customers. - Alle jaarverslagen

Create successful ePaper yourself
Turn your PDF publications into a flip-book with our unique Google optimized e-Paper software.
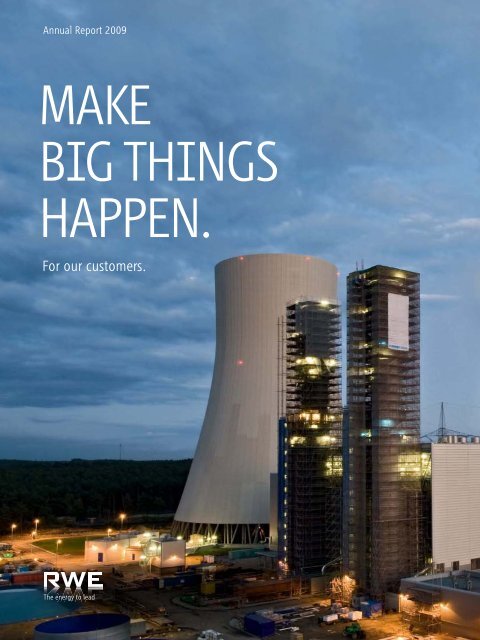
Annual Report <strong>2009</strong><br />
MAKE<br />
BIG THINGS<br />
HAPPEN.<br />
<strong>For</strong> <strong>our</strong> <strong>customers</strong>.
<strong>2009</strong> <strong>KEY</strong> FIGURES AT A GLANCE.<br />
• All earnings targets achieved<br />
• Recurrent net income up 5 %<br />
• Acquisition of Dutch energy utility Essent<br />
• Dividend of €3.50 per share proposed<br />
RWE Group <strong>2009</strong> 2008 +/-<br />
%<br />
External revenue € million 47,741 48,950 -2.5<br />
EBITDA € million 9,165 8,773 4.5<br />
Operating result € million 7,090 6,826 3.9<br />
Income from continuing operations before tax € million 5,598 4,866 15.0<br />
Net income € million 3,571 2,558 39.6<br />
Recurrent net income 1 € million 3,532 3,367 4.9<br />
Return on capital employed (ROCE) % 16.3 17.2 –<br />
Weighted average cost of capital (WACC) before tax % 9.0 8.5 –<br />
Value added € million 3,177 3,453 -8.0<br />
Capital employed € million 43,597 39,809 9.5<br />
Cash flows from operating activites € million 5,299 8,853 -40.1<br />
Capital expenditure € million 15,637 5,693 174.7<br />
Property, plant and equipment € million 5,913 4,454 32.8<br />
Financial assets € million 9,724 1,239 –<br />
Free cash flow € million -614 4,399 –<br />
Number of shares outstanding (weighted average) thousands 533,132 538,364 -1.0<br />
Earnings per share € 6.70 4.75 41.1<br />
Recurrent net income per share 1 € 6.63 6.25 6.1<br />
Dividend per share € 3.50 2 4.50 -22.2<br />
Dec 31, <strong>2009</strong> Dec 31, 2008<br />
Net debt of the RWE Group € million 25,787 18,659 38.2<br />
Workforce 3 70,726 65,908 7.3<br />
1 Net income excluding the non-operating result and excluding non-recurrent effects in the financial result, in the tax expense and in income<br />
from discontinued operations.<br />
2 Dividend proposal for RWE AG‘s <strong>2009</strong> fiscal year, subject to approval by the April 22, 2010 Annual General Meeting.<br />
3 Converted to full-time positions.<br />
The cover of this annual report shows a picture of <strong>our</strong> new gas-fired power station in Lingen, Germany, which will go online in the spring of 2010. It<br />
takes about half an h<strong>our</strong> for the plant to ramp up its capacity from zero to nearly 900 megawatts. Today, short ramp-up times are becoming increasingly<br />
important, because more and more extremely volatile wind electricity is being fed into the grid. Our gas-fired power plant in Lingen will ensure that<br />
electricity is available whenever <strong>our</strong> <strong>customers</strong> need it. Even during lulls.
WHAT WE DO.<br />
RWE is one of Europe’s five leading electricity and gas companies. We are active<br />
in the generation, trading, transmission and supply of electricity and gas. This<br />
integrated business model enables us to take advantage of the rising demand<br />
for energy. More than 70,000 employees supply over 16 million <strong>customers</strong> with<br />
electricity and approximately 8 million <strong>customers</strong> with gas. In fiscal <strong>2009</strong>, we<br />
recorded about €48 billion in revenue.<br />
Europe is <strong>our</strong> market: RWE is the No. 1 power producer in Germany, No. 2 in the<br />
Netherlands, and No. 3 in the UK. We continuously expand <strong>our</strong> position in Central<br />
and South Eastern Europe.<br />
Our power plant portfolio and <strong>our</strong> investment programme for building new,<br />
environmentally friendly and flexible generation capacity are the main basis for<br />
growing earnings in the future. Energy from renewables plays a key role. Our<br />
leading position in European energy trading helps us make optimal use of <strong>our</strong><br />
power plants on the market. We react to changes in customer needs by offering<br />
new products for homes, commerce and industry. In this context, climate protection<br />
and energy efficiency are becoming increasingly important.<br />
Our gas and oil production businesses are displaying above-average growth. In<br />
light of the long-term global rise in demand for gas, we plan to steadily increase<br />
the amount we produce in-house.<br />
ELECTRICITY AND GAS: RWE OFFERS EVERYTHING<br />
FROM A SINGLE SOURCE.<br />
Gas and oil<br />
production<br />
Conventional<br />
generation<br />
Power generation<br />
Renewable<br />
energy<br />
Energy trading /<br />
gas midstream<br />
Electricity and<br />
gas networks<br />
Electricity and<br />
gas sales<br />
Customers
THE RWE GROUP<br />
HOW WE HAVE REORGANISED OURSELVES.<br />
RWE AG<br />
Power<br />
generation<br />
Germany<br />
Sales and<br />
distribution<br />
networks<br />
Netherlands/<br />
Belgium<br />
United<br />
Kingdom<br />
Central and<br />
Eastern Europe<br />
Renewables<br />
Upstream<br />
gas & oil<br />
Trading/<br />
gas midstream<br />
THE RWE GROUP<br />
RWE Power<br />
RWE Vertrieb<br />
incl.<br />
RWE Aqua,<br />
eprimo<br />
Essent RWE npower RWE Hungária<br />
(Hungary)<br />
RWE Polska<br />
(Poland)<br />
RWE Innogy RWE Dea RWE Supply<br />
& Trading<br />
RWE Effizienz<br />
RWE Rheinland<br />
Westfalen Netz<br />
enviaM/<br />
MITGAS<br />
KEVAG<br />
VSE<br />
(Slovakia)<br />
RWE Transgas<br />
(Czech Republic)<br />
RWE<br />
Transgas Net<br />
(Czech Republic)<br />
LEW<br />
Süwag<br />
VSE<br />
KELAG<br />
RWE AG<br />
Amprion<br />
Electricity transmission<br />
system operator (unbundled)<br />
Thyssengas RWE Technology Internal services
what you can measure <strong>our</strong> success by.<br />
ebItDa<br />
Goal for <strong>2009</strong>: In the order of last year’s level<br />
Goal achieved in <strong>2009</strong>: Increase of 4 % to €9.2 billion<br />
Goal for 2010: Increase of 5 to 10 %<br />
operatIng result<br />
Goal for <strong>2009</strong>: In the order of last year’s level<br />
Goal achieved in <strong>2009</strong>: Increase of 4 % to €7.1 billion<br />
Goal for 2010: Increase of about 5 %<br />
recurrent net Income<br />
Goal for <strong>2009</strong>: In the order of last year’s level<br />
Goal achieved in <strong>2009</strong>: Increase of 5 % to €3.5 billion<br />
Goal for 2010: Increase of about 5 %<br />
DIvIDenD<br />
Goal for <strong>2009</strong>: Payout ratio of 50 to 60 % of recurrent net income<br />
Goal achieved in <strong>2009</strong>: Payout ratio of 53 % (proposed dividend: €3.50 per share)<br />
Goal for 2010: Payout ratio of 50 to 60 %<br />
effIcIency enhancement<br />
Goal for <strong>2009</strong>: €450 million compared to 2006<br />
Goal achieved in <strong>2009</strong>: €450 million<br />
Goal for 2010: €700 million compared to 2006
contents<br />
MAkE BIG ThInGs hAPPEn.<br />
<strong>For</strong> <strong>our</strong> <strong>customers</strong>.<br />
<strong>2009</strong> In BRIEf 20<br />
To ouR InvEsToRs 22<br />
Letter from the CEO 22<br />
RWE on the capital market 26<br />
1.0 REvIEW of oPERATIons 31<br />
1.1 Strategy and structure 32<br />
1.2 Economic environment 39<br />
1.3 Political environment 47<br />
1. 4 Major events 49<br />
1.5 Notes on reporting 55<br />
1.6 Business performance 57<br />
1.7 Financial position and net worth 81<br />
1.8 Notes to the financial statements<br />
of RWE AG (holding company) 87<br />
1.9 Innovation 92<br />
1.10 Development of risks and opportunities 95<br />
1.11 Outlook for 2010 105<br />
Review of operations (from page 31)
2.0 OUR RESPONSIBILITY 115<br />
2.1 Supervisory Board report 116<br />
2.2 Corporate governance 121<br />
2.3 Compensation report 124<br />
2. 4 Workforce 131<br />
2.5 Sustainability 133<br />
3.0 RESPONSIBILITY STATEMENT 138<br />
FURTHER INFORMATION 204<br />
Material investments 204<br />
The RWE Group‘s value management 207<br />
Boards 209<br />
Organisation chart of the RWE Group 214<br />
Organisation chart of RWE AG 216<br />
Glossary 217<br />
Index 220<br />
Imprint 221<br />
4.0 CONSOLIDATED FINANCIAL<br />
STATEMENTS 139<br />
4.1 Income statement 140<br />
4.2 Statement of recognised income<br />
and expenses 141<br />
4.3 Balance sheet 142<br />
4. 4 Cash flow statement 143<br />
4.5 Statement of changes in equity 144<br />
4.6 Notes 145<br />
4.7 Auditor‘s report 203<br />
Five-year overview<br />
Financial calendar<br />
Consolidated financial statements<br />
(from page 139)<br />
Fold-out contents in back cover
MAKE BIG<br />
THINGS<br />
HAPPEN.
Supplying energy is a complex task. It used to be enough to<br />
ensure affordable supplies around the clock. Today, we are<br />
also faced by global challenges such as climate change and the<br />
scarcity of res<strong>our</strong>ces. And what will tomorrow bring<br />
We conduct research and spend billions of euros so that we can<br />
provide <strong>our</strong> <strong>customers</strong> with solutions, be it of the order of tera<br />
or kilowatt h<strong>our</strong>s. Our position as a leading European power<br />
utility provides us with the possibility to do so, in technical,<br />
geographic and financial terms. Scale alone is not a strength.<br />
But making big things happen for <strong>our</strong> <strong>customers</strong> is.
Dieter Rabe, responsible for technical operations,<br />
gas compressor station, Brammer, Germany
LEFT OUT IN THE COLD.<br />
When things go wrong, rapid action is needed. As in the winter of <strong>2009</strong>, when<br />
the gas dispute between Russia and the Ukraine resulted in supply problems in<br />
Eastern Europe. Our cross-border crisis management enabled us to continue<br />
to reliably supply <strong>our</strong> <strong>customers</strong> in Hungary and the Czech Republic with gas.<br />
We also saw to it that Slovakian living rooms remained warm.
PRICE DECELERATOR.<br />
The medium-sized enterprises we serve want an energy partner who is just like them:<br />
hands-on and pragmatic. Can a heavyweight pull it off Sure thing. Like at Angus Chemie<br />
in Ibbenbüren. Our flexible electricity tariff enables the special chemicals manufacturer<br />
to quickly take advantage of drops in prices on the electricity exchange. And it is hedged<br />
against price increases.
Werner Sanning, engineer, in charge of the Responsible Care Department, Angus Chemie GmbH, Ibbenbüren, Germany<br />
Andreas Zünkler, certified chemical technician, Angus Chemie GmbH, Ibbenbüren, Germany
INTELLIGENT HOME.<br />
The future of energy-efficient living has already begun in Essen. The heat pumps<br />
we use in <strong>our</strong> ECOdrei pilot project greatly reduce the heating costs of 42 residential<br />
units, avoiding some 30 tons of carbon dioxide. Smart meters tell their owners how<br />
to conserve electricity, heat and water around the clock. This fetches an energy pass<br />
of the highest efficiency rating. And it guarantees happy <strong>customers</strong>. More than<br />
9,000 homes opted for <strong>our</strong> heat pump products in <strong>2009</strong>.<br />
Heidi Piva, resident of the ECOdrei<br />
housing development, Essen, Germany
HEALTHCARE REFORM.<br />
Sometimes energy efficiency can even promote health –— at least it does in the Muldental<br />
Clinic in Grimma, Germany. We tested every last bit of the facility’s entire energy<br />
infrastructure. This culminated in a heat insulation and heating system revamp concept.<br />
The result is something to be proud of: the clinic can save 100,000 euros every year.<br />
That is enough to hire a new physician.
Eberhard Träger, Energy officer,<br />
Muldentalkliniken GmbH, Grimma Hospital
Martin Neumann, Deputy Director, Wittgenstein<br />
biomass-fired combined heat and power plant, RWE Innogy
PERFECT DUO.<br />
Our municipal <strong>customers</strong> also increasingly want electricity generated<br />
from renewables, and we are happy to help them. Like in the Green<br />
Gecco Project. An undertaking uniting strong partners: a group of<br />
municipal utilities and RWE Innogy, <strong>our</strong> renewable energy specialist.<br />
We are pooling <strong>our</strong> power plant expertise and intend to invest a huge,<br />
triple-digit million euro sum through to 2012 alone. The Wittgenstein<br />
biomass-fired combined heat and power station may become the first<br />
project that we undertake together.
Dennis De Castro Paiva, comprehensive school pupil,<br />
enrolled in a long-term internship programme referred by “move on work! e.V.”
JUMP START.<br />
Responsibility has many dimensions at RWE. Promoting young people is one of<br />
them. The RWE Foundation’s mission is to enable young underprivileged people<br />
to take control of their lives by means of educational offerings. Through the<br />
<strong>For</strong>mula Education Grand Prix Project, initiated by “move on work! e.V.,” we assist<br />
pupils attending comprehensive schools in entering the world of employment by<br />
pro viding them with educational support and occupational mentoring. Thanks to<br />
the Foundation’s endowment of approximately 56 million euros, we can make<br />
big things happen. Personalised help that is effective.
THE ENERGY TO LEAD.<br />
“More growth, less CO 2 ” is the motto under which we aim to accomplish a great<br />
deal. Never before has RWE invested as much as it does today. Never before has<br />
RWE adapted its organisation as quickly as it does today. But the energy markets<br />
have never changed as rapidly as they do today, either. This is why “The energy to<br />
lead” is more than an ambition: Only those who shape change can be successful<br />
over the long term.<br />
Dr. Rolf Pohlig<br />
Chief Financial Officer<br />
Dr. Rolf Martin Schmitz<br />
Chief Operating Officer National<br />
Alwin Fitting<br />
Lab<strong>our</strong> Director
Dr. Jürgen Großmann<br />
President and CEO<br />
Dr. Leonhard Birnbaum<br />
Chief Strategy Officer<br />
Dr. Ulrich Jobs<br />
Chief Operating Officer International
20<br />
<strong>2009</strong> IN BRIEF.<br />
JANUARY<br />
RWE initiates acquisition of<br />
Dutch energy utility Essent<br />
We agree with the Dutch energy utility<br />
Essent on the conditions of a binding<br />
cash offer for a complete takeover of the<br />
company. The waste management and<br />
distribution grid businesses are carved<br />
out of the transaction, which we<br />
com plete successfully on September 30.<br />
As a result, we become one of the<br />
leading energy utilities in the Benelux<br />
region.<br />
MARCH<br />
Entry into the Turkish electricity<br />
market<br />
RWE and the Turkish-based energy<br />
company Turcas sign a joint-venture<br />
agreement to build a combined-cycle gas<br />
turbine power plant in Denizli. The<br />
facility’s planned net installed capacity<br />
is 775 megawatts. RWE will own a 70 %<br />
stake. The final investment decision is<br />
scheduled for the first half of 2010.<br />
APRIL<br />
Joint venture between RWE and<br />
E.ON places winning bid for land<br />
for new nuclear power plants in<br />
the UK<br />
MAY<br />
RWE Innogy acquires interest in<br />
Belgian offshore wind farm<br />
Our specialist for renewable energy<br />
acquires 27 % of the project company<br />
C-Power, developer of the first Belgian<br />
offshore wind farm. The plants are<br />
being built at Thornton Bank, up to<br />
30 kilometres off the coast. On com -<br />
pletion in 2013, the wind farm will have<br />
60 turbines with a total installed capa -<br />
city of 300 megawatts.<br />
FEBRUARY<br />
New RWE bonds issued<br />
RWE issues two Eurobonds for a com -<br />
bined €3 billion. This is followed in June<br />
by further placements of €1.5 billion and<br />
£1.5 billion. All issues are several times<br />
oversubscribed. They primarily serve to<br />
finance the acquisition of Essent.<br />
The Nuclear Decommissioning Authority<br />
auctions plots of land at three sites. Our<br />
joint venture with E.ON secures two<br />
plots. We therefore pass an important<br />
milestone en route to constructing<br />
and operating nuclear power stations<br />
in the UK.<br />
JUNE<br />
RWE continues sale of<br />
American Water<br />
Our stake in the US-based water utility<br />
amounting to 60.5 % after its IPO in<br />
2008 is reduced to less than 50 % in<br />
June. American Water is deconsolidated.<br />
Further share placements follow in the<br />
second half of the year. American Water<br />
is completely sold in November <strong>2009</strong>.
21<br />
JULY<br />
RWE establishes energy-efficiency<br />
company<br />
We pool <strong>our</strong> energy-efficiency activities<br />
for home and mobile applications in<br />
RWE Effizienz GmbH. Headquartered in<br />
Dortmund, Germany, the company’s<br />
purpose, among others, is to accelerate<br />
the use of modern power meters (smart<br />
meters) and computer systems used to<br />
control home technology (smart homes).<br />
RWE Effizienz is also active in the field of<br />
electric vehicles.<br />
SEPTEMBER<br />
RWE advances into the<br />
Dow Jones STOXX 50<br />
The index includes the 50 European<br />
companies with the largest free-float<br />
market capitalisation. RWE’s inclusion<br />
is very important as it means that<br />
numerous funds tracking the Dow Jones<br />
STOXX 50 must now also contain RWE<br />
shares. The composition of the index is<br />
reviewed and adjusted once a year.<br />
OCTOBER<br />
EU Commission ends anti-trust<br />
investigation of RWE<br />
DECEMBER<br />
RWE Innogy opens Rhyl Flats<br />
wind farm off the coast of Wales<br />
Its 25 wind turbines with a total capacity<br />
of 90 megawatts supply 61,000 homes<br />
with electricity. Rhyl Flats is RWE’s<br />
second large offshore wind farm in<br />
operation after North Hoyle, which we<br />
commissioned in 2004.<br />
Expansion of <strong>our</strong> upstream gas<br />
position off the UK coast<br />
RWE Dea acquires a 70 % interest in the<br />
Breagh field, presently the largest<br />
undeveloped natural gas discovery in the<br />
southern part of the UK North Sea. This<br />
gives us access to at least 13 billion<br />
cubic metres in res<strong>our</strong>ces. Another 2 to<br />
3 billion cubic metres are added by the<br />
acquisition of a 50 % stake in the Clipper<br />
South field’s concession blocks. With the<br />
two acqui sitions, RWE Dea also takes the<br />
operating lead.<br />
This confirms the position we defend<br />
and which is verified by independent<br />
auditors and external appraisers, namely<br />
that RWE is in compliance with market<br />
rules. The EU Commission had started<br />
investigating several European power<br />
utilities in 2006, following an electricity<br />
sector inquiry.<br />
Exit from Belene nuclear energy<br />
project in Bulgaria<br />
RWE will not participate in the construction<br />
or operation of a nuclear power<br />
plant in the northern part of the country.<br />
We terminate the joint venture agreement<br />
with the state-owned energy utility<br />
NEK because project financing could not<br />
be finalised within the agreed period.
22 Letter from the CEO<br />
RWE Annual Report <strong>2009</strong><br />
LETTER FROM THE CEO<br />
Being a safe haven is probably what most people expect from an energy utility like RWE. Especially<br />
when the wind is as turbulent as it was in <strong>2009</strong>, the year of the economic crisis. Reliable energy,<br />
secure jobs, sustainable investments, robust finances and a relatively low-risk share investment – did<br />
we manage to meet these diverse expectations last year<br />
Let’s take a look at the facts: We still rank among the five largest electricity and gas utilities in<br />
Europe. And we strengthened this position by acquiring Essent, No. 1 in the Dutch energy market.<br />
In <strong>2009</strong>, 16 million electricity and 8 million gas <strong>customers</strong> benefited from security of supply and fair
<strong>2009</strong> in brief To <strong>our</strong> investors Review of operations Our responsibility<br />
Responsibility statement Consolidated financial statements Further information<br />
Letter from the CEO 23<br />
prices. Whereas other utilities reduced their investments, we increased <strong>our</strong>s by one third to nearly<br />
€6 billion, thanks to <strong>our</strong> extremely healthy balance sheet. More than 70,000 people were working<br />
for us at the end of the year. Contrary to the trend, we added almost 1,000 employees to <strong>our</strong> payroll<br />
in Germany, taking responsibility in difficult times. RWE’s common share price including the dividend<br />
rose by 16 % in <strong>2009</strong>, leaving the European sector index far behind. Our proposed dividend for<br />
<strong>2009</strong> of €3.50 per share would currently give you a return that is about two percentage points higher<br />
than that of a ten-year German government bond. This is not a matter of c<strong>our</strong>se, even for a utility.<br />
We therefore believe we can be proud enough to claim that yes, y<strong>our</strong> RWE was a safe haven again<br />
in <strong>2009</strong>.<br />
Financial targets for <strong>2009</strong> achieved, despite the recession. Investing, creating jobs, and paying<br />
a dividend are things that can only be done by those who have their business under firm control and<br />
post healthy figures. RWE defied the crisis in <strong>2009</strong> and accomplished slightly more than we had<br />
promised you in <strong>our</strong> last annual report. Our aim had been to have earnings match the record level<br />
achieved in the previous year. But in fact, at €7.1 billion, the operating result for <strong>2009</strong> is above the<br />
year- earlier level, and, at €3.5 billion, recurrent net income is higher as well.<br />
How did we manage to largely decouple <strong>our</strong>selves from the economic slump and the significant decline<br />
in prices and demand There were two main reasons for this. First, we generate a large portion<br />
of <strong>our</strong> earnings from fairly crisis-proof operations: the production, transmission and sale of electricity<br />
and gas. Second, for years, <strong>our</strong> sales strategy has been following the principle of the cautious businessman:<br />
we hedge the prices of <strong>our</strong> electricity generation, <strong>our</strong> earnings mainstay, through forward<br />
sales up to three years prior to the electricity’s delivery. We had already sold vir tually all <strong>our</strong> production<br />
for <strong>2009</strong> and a substantial portion of <strong>our</strong> 2010 generation before the fi nancial crisis. Through<br />
<strong>our</strong> forward sales, we realised prices that are significantly above the current market level. We generated<br />
robust income from the regulated grid business and in the residential customer segment, which<br />
displays stable consumption. Industrial <strong>customers</strong> incurred substantial losses due to the downward<br />
economic spiral. However, this did not affect <strong>our</strong> earnings to the same extent, because we were<br />
careful in drawing up <strong>our</strong> supply agreements.<br />
RWE maintains c<strong>our</strong>se for growth, even in difficult times. The crisis is far from having been overcome.<br />
We expect that it will take several years for the European economy as well as electricity and<br />
gas consumption to get back to normal. This is compounded by the substantial uncertainties in energy<br />
policy regarding climate protection and the key question of what tomorrow’s energy supply<br />
should look like. What does that mean for us, <strong>our</strong> shareholders, employees and business partners<br />
Can we continue to afford billions in investment if the framework conditions remain uncertain<br />
Can we grow further
24 Letter from the CEO<br />
RWE Annual Report <strong>2009</strong><br />
Yes, we are staying on c<strong>our</strong>se for growth. Energy supply is a long-term business model for which<br />
one must not think in terms of years, but in terms of decades. This is why we review individual investment<br />
projects against the backdrop of the crisis and exchange them for more attractive ones if<br />
necessary. But we do not fearfully put <strong>our</strong> foot on the brake simply because <strong>our</strong> environment has<br />
deteriorated temporarily. Quite to the contrary, we intend to invest approximately €7 billion per year<br />
through to 2013 alone: to add 12 gigawatts of more climate-friendly coal and gas-fired power plants,<br />
to double <strong>our</strong> renewables-based generation capacity and <strong>our</strong> international gas and oil production,<br />
and to expand and modernise <strong>our</strong> electricity and gas networks. To learn about the details of what we<br />
are doing, please read the chapter entitled “Strategy and structure” in this annual report. This is how<br />
we are also taking advantage of the opportunities offered by the current crisis: Costs for large-scale<br />
new- build power plants have dropped because raw materials have become more affordable and<br />
many utilities and other investors have halted their projects.<br />
We can afford this investment programme because we also expect <strong>our</strong> earnings to grow in the next<br />
few years. Until 2012, we want to improve recurrent net income, the basis for determining y<strong>our</strong> dividend,<br />
by an average of about 5 % per year compared to 2008. However, we will not achieve the original<br />
forecast, which envisaged an increase of about 10 %. This is primarily due to unexpected delays<br />
in power plant new builds and gas production projects , which will have a positive effect on later fiscal<br />
years. Furthermore, gas and electricity margins will probably be lower than originally anticipated.<br />
High earnings expected for 2013, despite stricter CO 2 regulation. In the review of operations, you<br />
will also find a prognosis for fiscal 2013 for the first time. It is common knowledge that the framework<br />
conditions of CO 2 emissions trading will be tightened substantially in that year. This is why<br />
many investors have asked us to provide an assessment of the potential impact as early as possible.<br />
We are fulfilling this request, although such statements are accompanied by a great deal of uncertainty,<br />
particularly due to the volatility of commodity prices. Despite the deterioration in framework<br />
conditions for 2013, we expect the development to be positive overall. We anticipate that recurrent<br />
net income will surpass the high level achieved in <strong>2009</strong>.<br />
Dividend continuity — <strong>our</strong> claim. <strong>For</strong> years, the RWE share has ranked among those with the strongest<br />
dividends in the European utility sector, and we intend for that to continue. Thanks to the high<br />
expected level of earnings, we stand a good chance of being able to increase the dividend payment<br />
further. Our goal is to at least match the previous year’s dividend for each fiscal year from 2010 to<br />
2013. Only rarely will you find this dividend transparency elsewhere, even among utilities.
<strong>2009</strong> in brief To <strong>our</strong> investors Review of operations Our responsibility<br />
Responsibility statement Consolidated financial statements Further information<br />
Letter from the CEO 25<br />
The challenge of climate protection. A brief note on <strong>our</strong> current political environment: Although the<br />
Copenhagen UN Climate Conference did not provide any tangible results, climate protection has<br />
long become a permanent task for us. It is impossible to achieve the German government’s and the<br />
EU’s ambitious CO 2 goals without the utilities’ multi-billion-euro investment programmes. Yet many<br />
do not want to acknowledge the fact that we are financing the transition to a climate-friendly energy<br />
mix with cash flows from existing nuclear power plants and coal and gas-fired units. In addition, RWE<br />
is one of the biggest investors in renewable energy. It will take decades to complete the transition.<br />
Most of all, it needs investment-friendly framework conditions and the public acceptance of all economically<br />
and ecologically sensible technologies. Unfortunately, the public debate is very dogmatic<br />
at present, especially with regards to the issue of coal and nuclear-based generation. This worries me<br />
a lot. I therefore wish to see fair dialogue and pragmatic action by all those involved in 2010. The<br />
new fiscal year should be one of major decisions in energy policy.<br />
Leaner, faster, more international. <strong>For</strong> us, 2010 is also a year of homework. Last year, we restructured<br />
the Group’s organisation. In so doing, we made <strong>our</strong> national activities in Europe more<br />
powerful and gave <strong>our</strong> German business a stronger market orientation. Essent’s integration is part<br />
of the reorganisation. We have made good progress here so far. All these issues still require<br />
<strong>our</strong> attention, as we do not want to lose momentum in the market. At the same time, we continue to<br />
implement <strong>our</strong> cost-cutting and efficiency-enhancement programme.<br />
All of this demands an outstanding performance from <strong>our</strong> employees. On behalf of the Executive<br />
Board, I would like to express <strong>our</strong> sincere gratitude to them for the work they did in the fiscal year<br />
that just ended. And I would like to thank you, <strong>our</strong> investors, for y<strong>our</strong> trust, which we intend to continue<br />
to earn with all <strong>our</strong> might in the future. After all, the best way to “Make Big Things Happen,”<br />
which is the theme of this annual report, is to have strong partners.<br />
Sincerely y<strong>our</strong>s,<br />
Dr. Jürgen Großmann<br />
President and CEO of RWE AG<br />
Essen, February 12, 2010
26 RWE on the capital market RWE Annual Report <strong>2009</strong><br />
RWE ON THE CAPITAL MARKET<br />
Fiscal <strong>2009</strong> was a good year for stocks despite the severe economic crisis, because the economic<br />
outlook brightened somewhat. This enc<strong>our</strong>aged investors. Germany’s lead index, the DAX 30, was<br />
up 24 % for the year. RWE common shares closed <strong>2009</strong> with a gain of 16 %, clearly outperforming<br />
the sector’s average. The situation on bond markets also experienced relief. It became much<br />
cheaper to hedge credit risk over the c<strong>our</strong>se of the year.<br />
Performance of RWE common shares compared with the DAX 30 and the Dow Jones STOXX Utilities indices<br />
%<br />
30<br />
20<br />
10<br />
0<br />
-10<br />
-20<br />
-30<br />
Dec 31, 08<br />
Mar 31, 09<br />
Jun 30, 09<br />
Sep 30, 09<br />
Dec 31, 09<br />
Jan 31, 10<br />
RWE common share<br />
DAX 30<br />
Dow Jones STOXX Utilities<br />
Average weekly figures.<br />
Stock markets end downward trend. The steep downturn witnessed on stock markets since 2008<br />
came to a halt in March of <strong>2009</strong>. Share prices posted a strong recovery thereafter. In <strong>2009</strong>, the German<br />
lead index, the DAX 30, advanced by 24 % to 5,957 points. In fact it gained 62 % over the low<br />
for the year, which was on March 6 (3,666 points). In December, it briefly surpassed the 6,000-point<br />
mark. RWE shareholders can also look back on a pleasing year: At the end of <strong>2009</strong>, <strong>our</strong> common<br />
shares traded at €67.96, while <strong>our</strong> preferred shares closed at €62.29. This results in a total return (return<br />
on the share price plus the dividend) of 16 % and 28 % respectively for the year as a whole. RWE<br />
common shares displayed a weaker performance than the DAX 30, but managed to outperform the<br />
European sector index, Dow Jones STOXX Utilities (6%). At the beginning of <strong>2009</strong>, stock markets<br />
had been dominated by the economic crisis. Thereafter, positive economic indicators improved sentiment<br />
on stock markets considerably, primarily benefiting shares of cyclical branches of industry. As<br />
during the preceding stock market slump, share price peaks and troughs in the utility sector were<br />
more moderate. Moreover, the recession-induced drop in electricity and gas prices had a dampening<br />
effect. After the turn of the year, disappointing corporate figures and economic data led to an interruption<br />
in the upturn on stock markets. The DAX 30 closed the month of January 2010 at 5,609<br />
points, with RWE common shares trading at €64.24.
<strong>2009</strong> in brief To <strong>our</strong> investors Review of operations Our responsibility<br />
Responsibility statement Consolidated financial statement Further information<br />
RWE on the capital market 27<br />
Total return of RWE shares and important indices up to the end of <strong>2009</strong><br />
% p.a.<br />
1 year 5 years 10 years<br />
RWE common share 15.8 15.6 9.9<br />
RWE preferred share 27.5 18.3 12.3<br />
DAX 30 23.8 6.8 -1.5<br />
Dow Jones EURO STOXX 50 25.6 2.9 -2.6<br />
Dow Jones STOXX 50 28.7 1.7 -3.2<br />
Dow Jones STOXX 600 32.4 3.0 -1.5<br />
Dow Jones STOXX Utilities 6.2 8.4 5.7<br />
REXP 1 4.9 4.3 5.4<br />
1 Index for the performance of government securities on the German bond market.<br />
Long-term returns: RWE shares clearly outperform the DAX. RWE shares are an attractive investment,<br />
particularly for long-term investors: Those who paid €10,000 to buy shares in <strong>our</strong> company ten<br />
years ago and reinvested their dividends saw their investments grow to €25,657 (common shares) or<br />
€31,835 (preferred shares) by December 31, <strong>2009</strong>. This corresponds to an annual average return of<br />
9.9 % and 12.3 %, respectively. In contrast, the comparable total return posted by the DAX 30 was<br />
negative. An initial investment in the index would have had a negative return of 1.5 % per annum,<br />
dropping from €10,000 to €8,562.<br />
RWE share indicators <strong>2009</strong> 2008 2007 2006 2005<br />
Earnings per share € 6.70 4.75 4.74 6.84 3.97<br />
Recurrent net income per share € 6.63 6.25 5.29 4.38 4.01<br />
Cash flows from operating activities<br />
per share € 9.94 16.44 10.82 12.06 9.43<br />
Dividend per share € 3.50 1 4.50 3.15 3.50 1.75<br />
Common share price<br />
End of year € 67.96 63.70 96.00 83.50 62.55<br />
High € 68.58 100.64 97.90 89.85 63.24<br />
Low € 46.52 52.53 74.72 61.56 41.10<br />
Preferred share price<br />
End of year € 62.29 53.61 83.07 72.00 54.44<br />
High € 62.65 84.39 86.00 73.91 55.09<br />
Low € 41.75 37.46 66.33 54.18 34.79<br />
Dividend payment € million 1,867 1 2,401 1,689 1,968 984<br />
Number of shares outstanding (average) thousands 533,132 538,364 562,373 562,374 562,375<br />
Market capitalisation at the end of the year € billion 38.0 35.4 53.5 46.5 34.9<br />
1 Dividend proposal for RWE AG’s <strong>2009</strong> fiscal year, subject to the approval of the April 22, 2010, Annual General Meeting.
28 RWE on the capital market RWE Annual Report <strong>2009</strong><br />
Weighting of RWE shares and RWE bonds in important indices<br />
as of December 31, <strong>2009</strong><br />
Stock index<br />
Weighting<br />
%<br />
Bond index<br />
Weighting<br />
%<br />
DAX 30 5.3 iBoxx Euro Corporates 1.0<br />
Dow Jones STOXX 50 1.1 iBoxx Euro Utilities 7.7<br />
Dow Jones STOXX Utilities 9.0 iBoxx Sterling Utilities 10.1<br />
RWE included in Dow Jones STOXX 50. RWE joined the Dow Jones STOXX 50, the renowned stock<br />
index, effective from September 21. It comprises the 50 European companies with the highest<br />
free-float market capitalisation. RWE’s inclusion is important as it means that numerous funds<br />
tracking the STOXX 50 now also contain RWE shares. The composition of the Dow Jones STOXX 50<br />
is reviewed and adjusted once a year. The key parameter is the free-float market capitalisation at<br />
the close of trading at the end of August.<br />
€3.50 dividend per share proposed for <strong>2009</strong>. The Supervisory and Executive Boards of RWE AG will<br />
propose a dividend of €3.50 per share for fiscal <strong>2009</strong> to the Annual General Meeting on April 22,<br />
2010. Relative to recurrent net income, this results in a payout ratio of 53 %. We are thus within <strong>our</strong><br />
targeted range of between 50 % and 60 %. Based on the year-end closing share prices of <strong>our</strong> common<br />
and preferred shares, the dividend yields are 5.2 % and 5.6 %, respectively. This gives us<br />
a leading position in the DAX 30.<br />
Shareholder structure of RWE AG 1<br />
1% Employee shareholders 16 % RW Energie-Beteiligungsgesellschaft 80% Institutional shareholders:<br />
36% Germany<br />
5% Own shares<br />
17% USA/Canada<br />
12 % UK/Ireland<br />
13% Continental Europe<br />
14% Private shareholders<br />
excl. Germany<br />
4 % BlackRock<br />
2% Rest of the world<br />
60% Other institutional shareholders<br />
1 Percentages reflect shares in the subscribed capital. S<strong>our</strong>ces: Notifications of shareholdings in accordance<br />
with the German Securities Trading Act (WpHG) and shareholder identification, as of December <strong>2009</strong>.
<strong>2009</strong> in brief To <strong>our</strong> investors Review of operations Our responsibility<br />
Responsibility statement Consolidated financial statement Further information<br />
RWE on the capital market 29<br />
Shareholder base still widely diversified. At the end of <strong>2009</strong>, 80 % of RWE’s 562.4 million shares<br />
were owned by institutional investors, while 15 % were held by private investors (including employee<br />
shareholders). The remaining 5 % are owned by RWE. Institutional investors from Germany hold 36 %<br />
of the shares, with those in North America and the United Kingdom accounting for a combined 29 %<br />
and those in Continental Europe, excluding Germany, owning 13 %. RW Energie-Beteiligungsgesellschaft,<br />
in which municipal shares are pooled, is <strong>our</strong> single largest shareholder, holding 16 %. USbased<br />
asset management company BlackRock accounts for the largest RWE position outside Germany<br />
(4.2%). The free float of RWE common shares considered by Deutsche Börse AG in terms of index<br />
weighting was 80 % at the end of the year.<br />
Bond market crisis much less severe. International bond markets also experienced significant relief<br />
over the c<strong>our</strong>se of the year. Corporate spreads on reference interest rates for new bond placements<br />
declined considerably. Prices paid to hedge credit risk via credit default swaps (CDSs) also dropped.<br />
The iTraxx Europe index, which is made up of the prices of the five-year CDSs of 125 major European<br />
companies, was halved during the year under review. It climbed from 178 to over 200 basis points<br />
(March) before falling to 75 basis points. Most recently, prices paid for the five-year CDSs of energy<br />
utilities hovered around the level seen before the financial and economic crises. At the end of last<br />
year, only 45 basis points had to be paid to hedge RWE’s credit risk. In January <strong>2009</strong>, the spread had<br />
occasionally been above 100.<br />
Development of RWE‘s five-year credit default swap (CDS) compared with the CDS index iTraxx Europe<br />
in basis points<br />
250<br />
200<br />
150<br />
100<br />
50<br />
0<br />
Dec 31, 08<br />
Mar 31, 09<br />
Jun 30, 09<br />
Sep 30, 09<br />
Dec 31, 09<br />
Jan 31, 10<br />
RWE<br />
iTraxx Europe<br />
Average weekly figures.
30 RWE on the capital market RWE Annual Report <strong>2009</strong><br />
Investor Relations: focus on economic crisis and acquisition of Essent. Once again, we maintained intense<br />
dialogue with investors and analysts throughout the financial year. Focal issues included the acquisition of<br />
Dutch-based utility Essent and the effects of the economic crisis on <strong>our</strong> business. We held presentations and<br />
Q & A sessions for investors in 26 financial centres on more than 50 roadshows, at 12 con ferences, and at<br />
numerous one-on-one meetings. More than 130 investors came to <strong>our</strong> corpo rate head quarters in Essen to<br />
speak with management representatives. Additional communication activi ties i nclude presentations published<br />
on the internet. One highlight is the online publication entitled “RWE Facts & Figures” which contains detailed<br />
infor mation on RWE and the European energy sector and can be viewed at www.rwe.com/facts-and-figures-<strong>2009</strong>.<br />
During a conference call in December <strong>2009</strong>, we introduced the publication called “The Need for Smart Megawatts,“<br />
in which we describe the future of Europe’s power generation and the ensuing opportunities in the<br />
market for RWE. This is available at www.rwe.com/power-generation-in-europe-the-need-for-smart-megawatt.
31<br />
1.0 REVIEW OF OPERATIONS<br />
Recurrent net income<br />
up 5 % to<br />
¤3,532 million<br />
Proposed dividend<br />
€3.50 per share<br />
Two birds with one stone. Starting in 2012, we will supply electricity to about<br />
seven million people with the new hard coal twin unit in Hamm, Germany.<br />
This power plant’s technology is state of the art. Its 46 percent efficiency factor<br />
makes it 30 percent more efficient than its predecessors. And it also reduces<br />
CO 2 emissions by 2.5 million metric tons a year.
32 Strategy and structure<br />
RWE Annual Report <strong>2009</strong><br />
1.1<br />
STRATEGY AND STRUCTURE<br />
RWE ranks among Europe’s five leading electricity and gas companies. We want to improve this<br />
position. The market in which we operate is dynamic. Competition is becoming fiercer, and the<br />
demands placed on us by <strong>our</strong> <strong>customers</strong> are rising. Furthermore, political and regulatory requirements<br />
are becoming increasingly complex. At the same time, Europe’s energy markets continue to<br />
converge. We are tackling these challenges, investing billions of euros in tomorrow’s profitable<br />
and environmentally friendly energy supply, despite the economic crisis.<br />
Power utilities face huge challenges. We have not remained unaffected by the financial and<br />
economic crisis, either. But we can continue to implement <strong>our</strong> growth strategy thanks to <strong>our</strong> robust<br />
portfolio. Our investments in power plants, networks and gas and oil production demonstrate that<br />
energy supply is a long-term business. We must think in terms of decades, not years. Our strategy<br />
is therefore built on long-term fundamental trends. Our environment has not been changed by the<br />
current crisis, either. It is characterised by:<br />
• a persistent need for substantial investments in energy infrastructure, especially in power plants<br />
and networks to replace ageing facilities.<br />
• the European Union’s climate-protection goals for the reduction of greenhouse gas emissions.<br />
• <strong>customers</strong> expecting that their energy supply is secure and that their providers cope with the<br />
effects of volatile energy prices.<br />
• rules for price and investment-related decisions in the energy sector established by policymakers.<br />
• the European energy sector’s sustained consolidation.<br />
• the convergence of regional markets through trading and through the expansion of<br />
transmission networks.<br />
• the continued intensification of competition across all stages of the value chain in <strong>our</strong> business.<br />
Our strength: leading positions in key EU markets, good foothold in growth markets. An environment<br />
posing such challenges also offers new opportunities to strong, diverse market participants.<br />
What competitive advantages does RWE have to offer In terms of sales, we hold a leading market<br />
position with at least one of <strong>our</strong> main products (electricity and gas) in <strong>our</strong> core markets. We also<br />
strive to achieve this type of position when tapping into new markets.<br />
Market positions of the RWE Group<br />
in terms of sales<br />
Electricity<br />
Gas<br />
Germany No. 2 No. 3<br />
UK No. 3 No. 4<br />
Netherlands No. 2 No. 1<br />
Eastern Europe<br />
No. 2 in Hungary<br />
No. 3 in Slovakia<br />
Presence in the Czech Republic<br />
No. 6 in Poland<br />
Leading position in Hungary<br />
No. 2 in Slovakia<br />
No. 1 in the Czech Republic<br />
–<br />
Total Europe No. 3 No. 6
<strong>2009</strong> in brief To <strong>our</strong> investors Review of operations Our responsibility<br />
Responsibility statement Consolidated financial statements Further information<br />
Strategy and structure 33<br />
In <strong>our</strong> markets, we draw on the strengths that RWE is known for:<br />
• Our expertise in the construction and operation of power plants and networks is world renowned.<br />
We pool all <strong>our</strong> activities relating to the construction and modernisation of power plants in <strong>our</strong><br />
subsidiary RWE Technology, in order to extend <strong>our</strong> lead.<br />
• Via RWE Supply & Trading, we occupy one of the leading positions in European energy trading. We<br />
take advantage of its know-how not only in trading, but also in optimising the use of <strong>our</strong> power<br />
plants in the market as well as the procurement of gas, coal and CO 2 certificates.<br />
• We have vertically integrated activities. In the electricity business, for instance, we are not just a<br />
generator, but also a trader, sales company and, in certain cases, a network operator. This gives us<br />
more flexibility in offsetting market fluctuations at every stage of the value chain.<br />
• We realise synergies via <strong>our</strong> horizontal integration, e.g. the supply of electricity and gas from a<br />
single Group company.<br />
• Long-term, close partnerships with municipalities and industrial key accounts strengthen <strong>our</strong><br />
competitiveness.<br />
• Regionally diversified, fast-growing proprietary gas production improves <strong>our</strong> position in the field<br />
of gas procurement.<br />
• High cash flows and a robust balance sheet secure the financial basis for <strong>our</strong> growth activities.<br />
Pillars of<br />
growth<br />
Organic<br />
growth<br />
Mergers & Acquisitions<br />
Innovation<br />
RWE<br />
foundation<br />
Strong, integrated core business<br />
Corporate culture<br />
Our strategic principles. Our aim is to expand <strong>our</strong> electricity and gas business while reducing CO 2<br />
emissions. We can take advantage of the current market environment to do so: The global recession<br />
provides opportunities for financially strong companies with a robust foundation such as RWE. But<br />
we must think and plan far into the future. Therefore, <strong>our</strong> medium-term operating targets are in line<br />
with long-term principles.
34 Strategy and structure<br />
RWE Annual Report <strong>2009</strong><br />
The following is a summary of the cornerstones of <strong>our</strong> strategy:<br />
• We have a team- and performance-oriented corporate culture.<br />
• Our strong, integrated business, which delivers substantial and stable value, is the foundation for<br />
both <strong>our</strong> current and future success.<br />
• We want to grow organically wherever we can leverage <strong>our</strong> competitive advantages to achieve<br />
strong earnings growth.<br />
• Value-creating acquisitions are also to contribute to <strong>our</strong> growth in target markets.<br />
• Innovative technologies, business models and products set the stage for <strong>our</strong> long-term operational<br />
success.<br />
To this end, we always benefit from two competitive advantages: first, <strong>our</strong> long experience in achieving<br />
and safeguarding operational excellence in business processes and plant operations. This entails<br />
a continuous process of improvement along the value chain. An important building block is <strong>our</strong> current<br />
cost-cutting and efficiency programme on which we report on page 75. Second, we focus <strong>our</strong><br />
business on markets which are close to us: Our market is Europe — primarily North West, Central and<br />
Eastern Europe. This is where we best know <strong>our</strong> way around, this is where political and regulatory<br />
frameworks are largely comparable, and this is where we derive an advantage from regional synergies.<br />
In addition to Germany, <strong>our</strong> strategic focus lies on the UK, the Benelux region, Central and<br />
South Eastern Europe as well as Turkey. However, we also develop activities wherever necessary in order<br />
to supplement <strong>our</strong> business in the core regions. This applies, for example, to gas production outside<br />
Europe as well as liquefied natural gas (LNG) transport and trading.<br />
Gas and oil production Power generation Energy trading /gas<br />
midstream<br />
Electricity and<br />
gas networks<br />
Electricity and<br />
gas sales<br />
Conventional<br />
generation<br />
Renewable energy<br />
RWE Dea RWE Power RWE Innogy RWE<br />
Supply & Trading<br />
RWE Rheinland<br />
Westfalen Netz<br />
RWE Vertrieb<br />
German regional companies<br />
Central and Eastern European regional companies<br />
RWE npower<br />
RWE npower<br />
Essent<br />
Essent<br />
RWE Supply & Trading
<strong>2009</strong> in brief To <strong>our</strong> investors Review of operations Our responsibility<br />
Responsibility statement Consolidated financial statements Further information<br />
Strategy and structure 35<br />
We are and will remain a European, asset-backed electricity and gas company. And we are always<br />
aware of the fact that energy supply is not only an entrepreneurial challenge, but also brings with<br />
it significant social responsibilities. This means we have to ensure <strong>our</strong> <strong>customers</strong> are served in an<br />
economic, reliable and environmentally friendly manner. Only if all three requirements are met can<br />
we remain successful over the long term.<br />
RWE core markets with<br />
established market position<br />
Growth markets under<br />
observation<br />
Additional markets especially<br />
for renewables business<br />
0.25/<br />
1.25<br />
3.00/<br />
2.00<br />
0.25/<br />
2.25<br />
3.75/<br />
4.5<br />
x.y<br />
Electricity / gas consumption growth in % p.a.<br />
(2010 − 2020)<br />
The RWE strategy: greener, more robust and more international. Our strategy has three focal<br />
points: profitable growth in Europe, reducing CO 2 emissions, and adapting <strong>our</strong> business activities to<br />
the challenges of the market. We are pursuing six goals to achieve this:<br />
• Earnings growth in <strong>our</strong> core markets: Our focus lies especially on markets which are most important<br />
to RWE at present: Germany, the UK, the Netherlands and Central Eastern Europe.<br />
• Improved CO 2 emissions balance: Our groupwide power plant new-build programme and the<br />
acquisition of Essent make important contributions to achieving this goal. Our long-term objective<br />
is oriented towards average carbon dioxide emissions per megawatt h<strong>our</strong> (MWh) of electricity generated.<br />
We want to significantly reduce <strong>our</strong> power plant portfolio’s CO 2 intensity. Our goal is to<br />
take physical and financial measures to lower <strong>our</strong> CO 2 exposure to the level of an average competitor<br />
in <strong>our</strong> markets no later than 2020. Our assumption is that the emission factor customary on<br />
the market will be roughly 0.45 metric tons of CO 2 per MWh in 2020. By comparison, RWE emitted<br />
0.80 metric tons per MWh in the financial year that just ended.
36 Strategy and structure<br />
RWE Annual Report <strong>2009</strong><br />
• Value-added growth by expanding the renewable energy business: RWE Innogy wants to enlarge<br />
its renewable electricity generation base substantially. The aim is to have 4.5 gigawatts (GW) under<br />
construction or in operation by 2012.<br />
• Stronger international diversification: We want to grow the share of earnings achieved by <strong>our</strong><br />
activities outside Germany to about 50 % by 2013. In fiscal <strong>2009</strong>, it was 34 %.<br />
• Expansion of <strong>our</strong> gas midstream position: We intend to increase <strong>our</strong> annual gas procurement<br />
volume to 60 billion cubic metres by 2012. Thanks to <strong>our</strong> acquisition of Essent, we have already<br />
made a jump from 40 to about 50 billion cubic meters.<br />
• Strengthening of <strong>our</strong> upstream position: We want <strong>our</strong> annual gas and oil production to reach about<br />
70 million barrels of oil equivalent by 2015 at the latest. This would be more than twice as much as<br />
in the financial year just ended.<br />
From strategy to implementation: the biggest investment programme in RWE history. A main<br />
building block of <strong>our</strong> strategy is capital expenditure on power plants and networks. By the end of<br />
2013, we want to have commissioned over 14 GW in new generation capacity. Two thirds of this will<br />
be based on CO 2 -free and low-CO 2 technologies. We will finance this with the robust earnings of <strong>our</strong><br />
current generation portfolio. In turn, this means that we must be allowed to continue operating <strong>our</strong><br />
existing fossil fuel-fired and nuclear power plants profitably so that we can obtain the substantial<br />
funds needed to achieve <strong>our</strong> planned emission reductions. A clear political framework is required<br />
for this.<br />
Some €18 billion of the €28 billion in capital expenditure on property,<br />
plant and equipment between 2010 and 2013 are earmarked for growth and<br />
replacement investments, of which:<br />
~25% Other<br />
~50% CO 2 -free and low-<br />
CO 2 technologies<br />
~25% Highly efficient<br />
coal-based<br />
generation<br />
Renewables and gas-fired power plants<br />
Hard coal- and lignite-fired power plants<br />
Networks, midstream, gas and oil production and other projects
<strong>2009</strong> in brief To <strong>our</strong> investors Review of operations Our responsibility<br />
Responsibility statement Consolidated financial statements Further information<br />
Strategy and structure 37<br />
In addition to power plants and networks, we are expanding <strong>our</strong> gas business substantially. This<br />
includes <strong>our</strong> capital expenditure on six gas storage facilities and pipelines — of which the Asian-<br />
European Nabucco pipeline is the most prominent example — and the LNG business.<br />
We aim to spend a total of €28 billion from 2010 to 2013 on property, plant and equipment. We also<br />
make use of capital- conserving ways of reconfiguring <strong>our</strong> portfolio, for example, power plant capacity<br />
swaps and inno vative contractual solutions giving <strong>customers</strong> longer-term access to these capacities<br />
(“virtual power plants”).<br />
We do not rule out the possibility of making small acquisitions which complement <strong>our</strong> portfolio.<br />
However, having acquired the Dutch-based energy utility Essent (see page 49), we will focus on<br />
integrating this company for the time being.<br />
We measure all investment projects in terms of the extent to which they help us achieve the aforementioned<br />
goals. The key financial yardstick is the internal rate of return (IRR). It must at least<br />
match the cost of capital that reflects the risk profile of the division and country in question, plus a<br />
return premium.<br />
The new Group organisation: structures and processes for <strong>our</strong> strategy’s rapid implementation.<br />
Our organisation is the platform with which we achieve <strong>our</strong> goals. Therefore, it must constantly<br />
adapt to changes in market conditions and strategy. Last year, we set the stage for this in multiple<br />
areas:<br />
• We are bringing <strong>our</strong> activities more in line with the characteristics of national markets. The German<br />
sales and network business was streamlined. The regional companies RWE Rhein-Ruhr and RWE<br />
Westfalen-Weser-Ems were transformed into a sales company (RWE Vertrieb AG) and a distri bution<br />
network company (RWE Rheinland Westfalen Netz AG). The interim holding company RWE Energy<br />
ceased to exist. We transferred the responsibility for <strong>our</strong> international activities’ operations and<br />
regulatory matters to the local companies. This strengthens <strong>our</strong> presence in political processes,<br />
among other things. The local companies now report directly to the Group’s Executive Board. We<br />
pooled <strong>our</strong> business in the Netherlands and Belgium in Essent, which was consolidated for the first<br />
time as of September 30, <strong>2009</strong>.<br />
• This has been clearly separated from the supra-regional functions in support of the growth strategy.<br />
<strong>For</strong> instance, all power plant projects are being co-ordinated centrally by RWE Technology from<br />
2010 onwards. The functional companies RWE Innogy (renewables), RWE Dea (gas and oil production)<br />
and RWE Supply & Trading (energy trading and gas midstream) will maintain their transnational<br />
setup.
38 Strategy and structure<br />
RWE Annual Report <strong>2009</strong><br />
• The newly created “Strategic portfolio management” function ensures that we can achieve <strong>our</strong><br />
long-term goal of becoming “greener, more robust and more international” in line with the market.<br />
It is not only the success of individual investments and transactions that takes centre stage, but<br />
also the long-term effect of all measures on the portfolio. This is where we set <strong>our</strong> priorities for pivotal<br />
issues such as the economically sensible reduction of <strong>our</strong> CO 2 emissions, the power plant mix<br />
we aim for, and the gas procurement strategy we pursue.<br />
• RWE Supply & Trading has been strengthened significantly. Our corporate commercial asset<br />
management and corporate origination enable us to obtain more value from <strong>our</strong> asset portfolio,<br />
while improving <strong>our</strong> commodity risk management (e.g. <strong>our</strong> current electricity, gas, coal and CO 2<br />
positions).<br />
Value-oriented growth: the in-house control instrument. Our central control instrument is value<br />
added. This is how we embed <strong>our</strong> goal of adding value over the long term in the Group’s management<br />
processes. Value added is the return <strong>our</strong> divisions achieve on capital employed, minus the cost<br />
of capital. In addition to other individually agreed targets, this added value is also the yardstick for<br />
the performance-linked compensation of <strong>our</strong> executives and salaried staff. Details on RWE’s value<br />
management are described on pages 70 et seqq. and 207 et seq.
<strong>2009</strong> in brief To <strong>our</strong> investors Review of operations Our responsibility<br />
Responsibility statement Consolidated financial statements Further information<br />
Economic environment 39<br />
1.2<br />
ECONOMIC ENVIRONMENT<br />
As expected, <strong>2009</strong> was a difficult year. Europe experienced the most incisive drop in growth in the<br />
post-war era. Gross domestic product in Germany and the UK fell some 5 % below the year-earlier<br />
level. The recession also clearly left its mark on the energy markets. Electricity and gas consumption<br />
declined dramatically. Wholesale energy prices therefore remained far below the records seen<br />
in 2008.<br />
Economy bottoms out. The global financial and economic crises overshadowed <strong>2009</strong>. Estimates<br />
have the world economy shrinking by more than 2 %. In the Eurozone, real gross domestic product<br />
(GDP) was even some 4 % down year on year. However, marginal recovery trends were observed from<br />
the third quarter onwards. State economic stimulus packages and expansionary monetary policy<br />
made a major contribution to this.<br />
German economic output was 5 % lower than in 2008, the steepest decline in the post-war era. The<br />
reduction in equipment orders was a large factor. Exports, usually the driver of Germany’s economy,<br />
decreased by about 15 %. In the second half, however, exports benefited from a resurgence in demand<br />
from Asia, with China leading the way. Investment in construction also picked up slightly.<br />
Real GDP in the Netherlands and Belgium decreased by an estimated 4 % and 3 % respectively. The<br />
Netherlands experienced its first recession in 30 years. The drop in domestic demand played a significant<br />
role. Belgium’s economy is more dependent on exports, therefore, the country was especially<br />
hard hit by the major decline in foreign orders.<br />
The drop in GDP in the United Kingdom was an estimated 4.8 %. Not only is the general economic<br />
slump weighing on the country, but the UK is also suffering from a severe real estate crisis. As a<br />
result, many households saw their assets substantially devalued. Furthermore, the UK was especially<br />
hard hit by the turbulence in the financial sector which accounts for a much bigger share of economic<br />
output there than in other countries.<br />
Countries in Central Eastern Europe were diversely affected by the crisis. Those that strongly de pend<br />
on exports (Czech Republic and Slovakia) or have large amounts of private credit in foreign currency<br />
(Hungary) were most affected. In contrast, Poland benefited from the high share of domestic consumption,<br />
which was stable. Slovakia, which joined the European Monetary Union in <strong>2009</strong>, suffered<br />
under the strong euro and the resultant rise in export prices. Based on <strong>our</strong> estimates, GDP was<br />
down 4.1 % in the Czech Republic, 5.2 % in Slovakia, and 6.3 % in Hungary. Poland is likely to be the<br />
only eastern EU member state to have posted economic growth in <strong>2009</strong>, with an increase of an<br />
estimated 1.7 %.
40 Economic environment<br />
RWE Annual Report <strong>2009</strong><br />
Germany: slightly cooler weather and less windy. Whereas the economic trend is reflected above<br />
all in industrial demand for energy, residential consumption is significantly influenced by the weather.<br />
In Germany and Central Eastern Europe, the weather was cooler in the year under review than in<br />
2008. In contrast, there was no tangible change in the Benelux region or the UK. Weather conditions<br />
affect both energy consumption and the supply of electricity — mainly generation from wind turbines.<br />
In Germany, there was 11 % less wind in <strong>2009</strong> than the long-term average. Compared to the preceding<br />
year, the decrease in wind was 10 %. The decline in the UK and the Benelux region was more<br />
substantial. On the Iberian peninsula, however, a marginal gain was recorded.<br />
Economic crisis dampens energy consumption in RWE’s core markets. The recession left deep<br />
marks on energy consumption. The economy’s negative impact was slightly mitigated by relatively<br />
stable electricity usage by homes and the services sector. Based on available data, electricity<br />
demand in Germany was more than 5 % lower than in 2008. This is the steepest fall ever measured<br />
there. Likewise, demand for electricity was down considerably in the Netherlands (-6%), the UK<br />
(-5%), Poland (-4%), Hungary (-5%) and Slovakia (-11 %). Gas consumption was also significantly<br />
influenced by the economic downturn. Based on the latest estimates, it declined by 5 % in Germany,<br />
by 4 % in the Netherlands, by 7 % in the UK, by 6 % in the Czech Republic and by as much as 11 % in<br />
Hungary.<br />
Oil price markedly down year on year. The economic crisis also had a strong impact on energy and<br />
commodity prices. This applies especially to international crude oil markets, which have seen prices<br />
collapse since the record levels witnessed in the middle of 2008. Early in <strong>2009</strong>, the price of a barrel<br />
of Brent was occasionally a mere US$40. Production cut-backs by OPEC countries and the nascent<br />
hope of a global economic recovery drove prices back up. In the second half of the year, they<br />
plateaued around the 70-dollar mark. Averaged for the year, the price of Brent crude was US$62 per<br />
barrel, more than a third less than in the prior year (US$97).<br />
Gas prices still marked by 2008 crude oil boom. As a large portion of gas imports to Continental<br />
Europe is based on long-term contracts, which track oil prices, the latter also infl uence developments<br />
on the gas market. However, this typically occurs with a lag of several months. In addition, trading<br />
freely available volumes is gaining significance. Prices for these trades are not directly influenced<br />
by the price of oil. Major trading platforms are the National Balancing Point (NBP) in the UK and the<br />
Title Transfer Facility (TTF) in the Netherlands. These markets experienced a substantial reduction<br />
in prices, which had a trickle-down effect on the end-customer business, again with a time lag. Last<br />
fiscal year, gas became an average of 2 % cheaper for German homes and small commercial operations<br />
and 6 % less expensive for industrial enterprises. End-customer prices also declined in the
<strong>2009</strong> in brief To <strong>our</strong> investors Review of operations Our responsibility<br />
Responsibility statement Consolidated financial statements Further information<br />
Economic environment 41<br />
Netherlands. Developments in the UK varied: Whereas industrial gas bills were down 14 %, they were<br />
up 13 % for households. Gas became more expensive for both customer groups in the Czech Republic,<br />
with prices rising 3 % and 17 %, respectively. The situation in forward trading was as follows:<br />
Contracts for delivery in the 2010 calendar year (2010 forward) sold for an average of €18 per MWh<br />
on the TTF market in <strong>2009</strong>. This is 41 % less than was paid for the <strong>2009</strong> forward in 2008.<br />
Development of one-year forward prices on the Dutch TTF gas wholesale market<br />
€/MWh<br />
50<br />
40<br />
30<br />
20<br />
10<br />
0<br />
<strong>For</strong>ward for delivery in 2008<br />
<strong>For</strong>ward for delivery in <strong>2009</strong><br />
<strong>For</strong>ward for delivery in 2010<br />
Trading year: 2007 Trading year: 2008 Trading year: <strong>2009</strong><br />
Average monthly figures.<br />
S<strong>our</strong>ce: RWE Supply & Trading.<br />
Hard coal spot prices only half as high as in 2008. The price curve for power plant hard coal on<br />
international markets was similar to that of crude oil. Over the year, quotations flattened at a level<br />
that was much lower than in 2008. In <strong>2009</strong>, a metric ton (including freight and insurance) cost an<br />
average of US$71 in Rotterdam spot trading, 52 % less than in the previous year. In Europe and the<br />
USA, the economic crisis dampened demand for hard coal. Robust demand from China and India had<br />
a price-stabilising effect. Hard coal quotations also reflect sea freight rates, which were also markedly<br />
down year on year, due to low demand. In <strong>2009</strong>, the standard route from South Africa to Rotterdam<br />
cost an average of US$14 per metric ton, compared to US$30 in the previous year.<br />
German hard coal prices are determined by the German Federal Office of Economics and Export<br />
Control (BAFA). Since these prices track those of imported hard coal, they follow developments on<br />
international markets, albeit with a slight time lag. The BAFA price for the first nine months of <strong>2009</strong><br />
amounted to €81 per metric ton of hard coal unit. No corresponding figure was available for the<br />
f<strong>our</strong>th quarter when this report went to print, but experts estimate it to be €72. On this basis, the<br />
BAFA price for the year as a whole would be approximately €78 (previous year: €112).
42 Economic environment<br />
RWE Annual Report <strong>2009</strong><br />
CO 2 emissions trading: certificate prices occasionally below 10-euro mark. European trading of CO 2<br />
emission allowances (referred to as EU Allowances — EUAs) was also characterised by the recession.<br />
Production outages in energy-intensive plants resulted in a large number of additional certificates on<br />
the market, which depressed prices. In February, EUAs for <strong>2009</strong> occasionally traded at less than €10<br />
per metric ton of CO 2 . Averaged for the period under review, they sold for €13. This is much less<br />
than the price of EUAs in 2008 (€22). Credits earned from emission-reducing measures taken in developing<br />
and newly industrialising countries (referred to as Certified Emission Reductions — CERs)<br />
also became much cheaper. European companies may also cover domestic emissions up to a predetermined<br />
level by submitting CERs obtained through projects within the scope of the “Clean Development<br />
Mechanism” (CDM) cre ated by the Kyoto Protocol. The advantage is that the costs for these<br />
types of certificates are usually lower than the market prices of EUAs. Last year, <strong>2009</strong> CERs traded at<br />
an average of €12 per metric ton of CO 2 . The comparable figure for 2008 was €17.<br />
Development of CO 2 certificate prices in the European emissions trading system<br />
€/metric ton of CO 2<br />
40<br />
30<br />
20<br />
10<br />
0<br />
Trading year: 2007 Trading year: 2008 Trading year: <strong>2009</strong><br />
EU Allowance<br />
(EUA) for <strong>2009</strong><br />
Certified Emission Reduction<br />
(CER) for <strong>2009</strong><br />
Average weekly figures.<br />
S<strong>our</strong>ce: RWE Supply & Trading.<br />
Much lower electricity prices — high volatility due to wind and solar power. The substantial drop in<br />
the price of fuel and emission allowances was reflected on European wholesale electricity markets.<br />
In German spot trading on the European Energy Exchange (EEX), base-load contracts in the year under<br />
review traded at an average of €39 per MWh, while peak-load contracts sold for €51 per MWh.<br />
They were more than 40 % down on the corresponding figures for 2008. Prices are increasingly influenced<br />
by substantially fluctuating amounts of electricity fed into the German grid by wind turbines<br />
and solar power plants. This is a result of the progressive expansion of the renewable generation<br />
base. Last year, there were several situations of electricity oversupply on the EEX. As a result, the<br />
spot price was negative for certain h<strong>our</strong>s and twice averaged for the day (October 4/December 26).<br />
This means that utilities were able to earn money by taking their power stations offline and buying<br />
electricity instead of producing it. Sudden upward and downward price movements will probably<br />
occur more and more in future. This will open the door to additional profit opportunities for power<br />
plants capable of rapidly adapting their load to prevailing market conditions.
<strong>2009</strong> in brief To <strong>our</strong> investors Review of operations Our responsibility<br />
Responsibility statement Consolidated financial statements Further information<br />
Economic environment 43<br />
Development of wholesale electricity spot prices in Germany<br />
€/MWh<br />
140<br />
120<br />
100<br />
80<br />
60<br />
40<br />
20<br />
0<br />
Trading year: 2007 Trading year: 2008 Trading year: <strong>2009</strong><br />
Base load Peak load Average monthly figures.<br />
S<strong>our</strong>ce: EEX energy exchange.<br />
Development of one-year forward wholesale electricity prices in Germany<br />
€/MWh<br />
140<br />
120<br />
100<br />
80<br />
60<br />
40<br />
20<br />
0<br />
<strong>For</strong>ward for delivery in 2008 <strong>For</strong>ward for delivery in <strong>2009</strong> <strong>For</strong>ward for delivery in 2010<br />
Trading year: 2007 Trading year: 2008 Trading year: <strong>2009</strong><br />
Base load Peak load Average monthly figures.<br />
S<strong>our</strong>ce: RWE Supply & Trading.<br />
In <strong>2009</strong>, electricity forward trading displayed the following picture: In Germany, supply agreements<br />
for the following calendar year (2010 forward) traded at an average of €49 per MWh of base-load<br />
power and €70 per MWh of peak-load electricity. This is 30 % less than was paid for comparable<br />
contracts in the preceding year. The 2010 base-load forward fell to €43 at the end of February <strong>2009</strong>,<br />
the lowest level since the autumn of 2005. After a temporary recovery, it dropped back close to this<br />
figure at the end of the year.<br />
We sell forward nearly all of <strong>our</strong> in-house electricity generation output in order to reduce volume and<br />
price risks. Therefore, current electricity prices only had a minor impact on <strong>our</strong> income in the period<br />
under review. What is much more decisive is the price at which we concluded contracts for delivery<br />
in <strong>2009</strong> in preceding years. Since the sales were largely concluded before the start of the financial
44 Economic environment<br />
RWE Annual Report <strong>2009</strong><br />
crisis, the prices fetched were far above the present level. We sold <strong>our</strong> <strong>2009</strong> German generation for<br />
an average of €70 per MWh. This was also more than the comparable figure a year earlier. We had<br />
sold <strong>our</strong> production for 2008 at an average of €58 per MWh.<br />
The fact that we sold <strong>our</strong> electricity generation at higher prices in <strong>2009</strong> had a positive effect on<br />
earnings. Our nuclear power stations benefited especially from this, as their added revenue was not<br />
counteracted by any noteworthy additional fuel costs. The uranium we require has been secured via<br />
long-term purchase agreements with firm conditions. Moreover, in nuclear power generation, fuel<br />
procurement costs typically account for a small portion of total generation costs. Margins also improved<br />
in <strong>our</strong> lignite-based generation business. We have no significant fuel price risk exposure from<br />
lignite since we obtain this fuel from <strong>our</strong> own opencast mines. Our hard coal and gas power stations<br />
face a different situation. Their costs can fluctuate considerably, depending on the development of<br />
prices on fuel markets. Effects on earnings due to changes in electricity prices can therefore be<br />
more than offset. The earnings development of these power stations is predominantly influenced<br />
by so-called clean dark spreads (hard coal) and clean spark spreads (gas). These are calculated by<br />
deducting the cost of the respective fuel used and of CO 2 emissions from the price of electricity.<br />
The spreads for <strong>our</strong> German hard coal power plants achieved in the market were similar to the 2008<br />
level, and those for <strong>our</strong> gas power stations improved.<br />
The most recent decline in electricity wholesale prices was hardly felt by the German sales business<br />
with households and commercial operations. Electricity tariffs were an average of 5 % higher than in<br />
2008. This is because most of the sales companies had bought electricity in advance and their procurement<br />
costs had therefore still been influenced by the rise in wholesale prices in preceding years.<br />
In contrast, most electricity purchases by industrial enterprises are more short term. As a result,<br />
prices in this customer segment dropped by around 5 %.<br />
UK wholesale electricity prices also declined. In the year under review, the average spot price<br />
amounted to £37 (€41) per MWh for base-load contracts and £45 (€50) per MWh for peak-load electricity.<br />
This was only about half as much as in the previous year. On the UK forward market, base-load<br />
contracts for delivery in 2010 sold for an average of £44 (€50) per MWh and peak-load electricity<br />
sold for an average of £53 (€60) per MWh. The price level dropped by a third compared to what was<br />
paid for <strong>2009</strong> forwards in the previous year.
<strong>2009</strong> in brief To <strong>our</strong> investors Review of operations Our responsibility<br />
Responsibility statement Consolidated financial statements Further information<br />
Economic environment 45<br />
Development of wholesale electricity spot prices in the UK<br />
£/MWh<br />
140<br />
120<br />
100<br />
80<br />
60<br />
40<br />
20<br />
0<br />
Trading year: 2007 Trading year: 2008 Trading year: <strong>2009</strong><br />
Base load Peak load Average monthly figures.<br />
S<strong>our</strong>ce: RWE Supply & Trading.<br />
Development of one-year forward wholesale electricity prices in the UK<br />
£/MWh<br />
120<br />
100<br />
80<br />
60<br />
40<br />
20<br />
0<br />
<strong>For</strong>ward for delivery in 2008 <strong>For</strong>ward for delivery in <strong>2009</strong> <strong>For</strong>ward for delivery in 2010<br />
Trading year: 2007<br />
Trading year: 2008 Trading year: <strong>2009</strong><br />
Base load Peak load Average monthly figures.<br />
S<strong>our</strong>ce: RWE Supply & Trading.<br />
RWE sells forward most of its UK electricity production, similar to the policy it pursues in Germany.<br />
As <strong>our</strong> UK generation portfolio largely consists of hard coal and gas-fired power plants, RWE npower’s<br />
earnings trend largely depends on clean dark spreads and clean spark spreads realisable in the market.<br />
Overall, these were lower for <strong>2009</strong> than for 2008. The spreads worsened, also regarding shortterm<br />
spot market transactions. This is in part due to the economically induced reduction in demand<br />
for electricity, which mostly affected mid-merit and peak-load power plants. In addition, following<br />
several outages in the previous year, UK nuclear power stations had higher levels of availability. Their<br />
added generation was largely to the detriment of gas and hard coal-based electricity production.
46 Economic environment<br />
RWE Annual Report <strong>2009</strong><br />
Most of the utilities in the UK supply business lowered their tariffs in <strong>2009</strong>. Nevertheless, the price<br />
level averaged over the entire year was higher than in 2008 — by 3 % for households and small commercial<br />
enterprises, and by as much as 17 % for industrial and corporate <strong>customers</strong>. This reflected<br />
the fact that a large number of utilities had increased their prices during 2008. These adjustments<br />
had been necessary, because most of the supply companies had purchased electricity early on and<br />
therefore still had substantial procurement costs.<br />
End-customer prices also rose in most Central Eastern European electricity markets. Industrial<br />
<strong>customers</strong> in Poland and Slovakia had to pay 23 % and 21 % more year on year, respectively. In contrast,<br />
the level of prices for this customer group in Hungary dropped by 4 %. Residential electricity<br />
bills in all the aforementioned markets grew, rising by 17 % in Poland, 9 % in Hungary, and 3 % in<br />
Slovakia.
<strong>2009</strong> in brief To <strong>our</strong> investors Review of operations Our responsibility<br />
Responsibility statement Consolidated financial statements Further information<br />
Political environment 47<br />
1.3<br />
POLITICAL ENVIRONMENT<br />
Our economic success and the contribution we make to climate protection and security of supply<br />
essentially depend on the political environment in <strong>our</strong> markets. It was therefore all the more disappointing<br />
for us that the UN Climate Conference in Copenhagen failed to produce any tangible<br />
results. Nevertheless, there was some movement in energy policy in <strong>2009</strong>. The change in Germany’s<br />
government brightened the prospects for the continued use of CO 2 -free nuclear energy.<br />
And in the UK, the stage is currently being set for the increased use of nuclear power and energy<br />
from renewables.<br />
Germany’s new government in fav<strong>our</strong> of nuclear lifetime extension. The change in the country’s<br />
administration in the autumn of <strong>2009</strong> brought some movement into German energy policy. In its<br />
coalition agreement of October 26, the incumbent parties (CDU/CSU and FDP) set out their political<br />
programme, including such important topics as climate protection and security of supply. The agreement<br />
emphasises that Germany intends to defend its leading role in climate protection. The objective<br />
is to reduce domestic greenhouse gas emissions by 40 % by 2020, compared to 1990. Renewable<br />
energy is to make an important contribution. Among other things, the coalition agreement<br />
envisages amending the German Renewable Energy Act (REA) effective from January 2012, more<br />
planning security for offshore wind farm operators and a reduction in subsidies for solar facilities.<br />
The development of most significance to RWE relates to the lifetimes of Germany’s nuclear power<br />
stations. Their output is currently limited by the German Nuclear Energy Act and corresponds to 32<br />
years of normal operation. The coalition intends to extend these lifetimes in compliance with the<br />
strict German and international safety standards because it will be impossible to achieve the climate<br />
goals otherwise. The objective is to reach an agreement with the nuclear power plant operators as<br />
quickly as possible, establishing the details of a lifetime extension, including operating periods,<br />
safety requirements, etc. However, the timeframe remains unclear to date. The coalition agreement<br />
also addresses the construction of new, efficient coal-fired power plants, which is also to be possible<br />
in future. Furthermore, the coalition intends to rapidly translate the EU Directive of April 23, <strong>2009</strong> on<br />
the environmentally friendly geological storage of carbon dioxide into national law. This would provide<br />
a legal framework for operating fossil fuel-fired power stations with carbon capture and storage<br />
(CCS). The governing parties agreed to present an overall concept outlining German energy policy<br />
by October 2010 at the latest. The German Federal Ministry of Economics and the German Federal<br />
Ministry for the Environment are to draft a joint proposal. The first key points are expected to be<br />
presented by the summer of 2010.<br />
Copenhagen World Climate Conference falls short of expectations. The UN Climate Conference in<br />
Copenhagen took a disappointing c<strong>our</strong>se in December <strong>2009</strong>. The roughly 190 countries participating<br />
were unable to reach an agreement to succeed Kyoto encompassing global conditions for climate<br />
protection after 2012. The main concluding document, the “Copenhagen Accord,” is not legally binding.<br />
However, it does include a minimal consensus establishing the concrete goal of limiting global<br />
warming to less than two degrees centigrade compared to pre-industrial levels. But it remains to be
48 Political environment RWE Annual Report <strong>2009</strong><br />
seen how this target is achieved. The delegates did not agree on concrete objectives for lowering<br />
greenhouse gases, or on a schedule for the next steps. It is also unclear how and whether the Kyoto<br />
Clean Development Mechanism and Joint Implementation can be used after 2012.<br />
United Kingdom establishes strategy to realign energy supply. In July, the UK government published<br />
a White Paper on the energy sector, establishing its political guidelines. It accords substantial<br />
importance to security of supply and climate protection. The government is committed to reduce<br />
CO 2 emissions by 18 % by 2020, compared to 2008 levels. The objective is to increase the share of<br />
electri city generation accounted for by technologies that cause little or no emissions to 40 % during<br />
this period. A bill building on some of the White Paper’s goals was presented in November. Among<br />
other things, it envisages the mandatory introduction of social electricity and gas tariffs. In addition,<br />
it includes details on subsidy mechanisms for CCS pilot projects. Also in November, the UK government<br />
published draft papers setting out the details of its energy policy concept. Central fields of<br />
activity are the use of fossil fuels (especially using CCS technology), the increased use of nuclear<br />
power and renewable energy, and the expansion of network infrastructure. Planning and approval<br />
processes are to be accelerated. Furthermore, the government named sites suitable for the construction<br />
of new nuclear power stations, including Wylfa and Oldbury. We placed the winning bids for<br />
these two locations with E.ON (see page 50). The share of electricity production accounted for by<br />
energy from renewables is to be raised to 30 % by 2020. In future, new coal-fired power plants will<br />
only be approved if they include carbon capture and storage technology for an installed capacity of<br />
at least 300 MW.<br />
Third Single Energy Market Package creates independent transmission system operators without<br />
interfering with ownership. On July 15, <strong>2009</strong>, the EU Council of Ministers and the European Parliament<br />
agreed on the Third Single Energy Market Package designed to continue the deregulation<br />
of electricity and gas markets. The main issue was how to structure ownership relationships between<br />
the transmission system operators (TSOs) and their parent companies in a way that ensures nondiscriminatory<br />
third-party access and provides incentives for necessary investments in networks.<br />
The adopted guideline envisages network companies remaining within their respective groups, while<br />
in creasing their independence substantially. TSOs must be set up as completely self-sufficient companies.<br />
They must therefore be separated from other group companies in terms of company law and<br />
be capable of performing all operating tasks with their own personnel. The parent companies retain<br />
ownership, but the TSOs must take independent, uninfluenced decisions. The Council thus chose to<br />
go against the proposal submitted by the EU Commission earlier, which envisaged complete ownership<br />
unbundling. The guideline’s provisions remain to be translated into national law. By setting up<br />
RWE Transportnetz Strom as a fully self-sufficient company operating as Amprion, RWE has already<br />
put key elements of the unbundling rules into practice (see page 50).
<strong>2009</strong> in brief To <strong>our</strong> investors Review of operations Our responsibility<br />
Responsibility statement Consolidated financial statements Further information<br />
Major events 49<br />
1.4<br />
MAJOR EVENTS<br />
At RWE, fiscal <strong>2009</strong> was dominated by international growth. By acquiring Dutch-based Essent,<br />
we have become a leading energy utility in the Benelux region. We also continued <strong>our</strong> c<strong>our</strong>se for<br />
expansion in electricity generation and the upstream business. To be successful internationally,<br />
one has to adapt flexibly to regional circumstances and be able to act quickly. We significantly<br />
improved the prerequisites for this by carrying out comprehensive restructuring measures.<br />
Having sold <strong>our</strong> remaining stake in American Water, we are fully focused on the energy business.<br />
Acquisition of Dutch utility Essent. Thanks to the takeover of Essent N.V., RWE has advanced to<br />
become one of the largest energy utilities in the Benelux region. The acquisition was completed on<br />
September 30, <strong>2009</strong>. Essent’s waste management and distribution network operations have been<br />
carved out of the transaction. The same applies to Essent’s 50 % stake in the EPZ joint venture,<br />
operator of the Borssele nuclear power station. A c<strong>our</strong>t ruling on this part of the business is pending.<br />
The stake in EPZ will remain under ownership of Essent’s former shareholders until the proceedings<br />
have been concluded. The European Commission gave us anti-trust clearance on condition that<br />
Essent divest its 51 % stake in Stadtwerke Bremen (swb). This took place as of October 21, <strong>2009</strong>.<br />
Taking into account the sale of the stake in swb and the spin-out of the EPZ interest as well as further<br />
adjustments, the Essent transaction has a value of approximately €7.3 billion. The company is now<br />
managed by a f<strong>our</strong>-member executive board, headed by Peter Terium (46), who is of Dutch<br />
nationality and whose previous positions include that of Chairman of the Board of Directors of<br />
RWE S upply & Trading.<br />
American Water completely sold. After the initial public offering of the US water utility American<br />
Water in April 2008, we divested <strong>our</strong> remaining shares in the company in the last financial year.<br />
At the beginning of <strong>2009</strong>, we still held a 60.5 % stake. We placed <strong>our</strong> remaining shares in American<br />
Water in three tranches over the c<strong>our</strong>se of the year, for a total of US$1.9 billion (about €1.3 billion).<br />
New Group structure in place. In fiscal <strong>2009</strong>, we implemented reorganisation measures designed to<br />
make it easier for the RWE Group to hit its growth targets and stand its ground against the backdrop<br />
of increasingly fierce competition. As presented on page 37, we now manage <strong>our</strong> activities more in<br />
line with national markets. We can therefore adapt to local requirements more flexibly. Our German<br />
sales and distribution network businesses were reorganised and streamlined. The single most<br />
important measure is the merger of the two regional companies RWE Rhein-Ruhr AG and RWE Westfalen-Weser-Ems<br />
AG to form a sales company (RWE Vertrieb AG) and a distribution network company<br />
(RWE Rheinland Westfalen Netz AG). RWE Energy, the former holding company, ceased to exist. The<br />
two new entities and RWE’s other regional companies report directly to RWE AG. As a result of the<br />
reorganisation, we are reporting on fiscal <strong>2009</strong> based on a new segment structure. More detailed<br />
information on this can be found on pages 55 et seq.
50 Major events<br />
RWE Annual Report <strong>2009</strong><br />
New energy-efficiency company. We pooled <strong>our</strong> energy-efficiency activities in a new company as<br />
part of <strong>our</strong> reorganisation programme. Headquartered in Dortmund, Germany, RWE Effizienz GmbH<br />
began operating on July 1. Its product and consulting offerings target private <strong>customers</strong>, small and<br />
medium-sized enterprises, municipalities as well as service partners such as tradesmen and<br />
architects. It promotes, among other things, the use of modern electricity meters (smart meters) to<br />
improve monitoring of energy consumption as well as computer systems to control residential<br />
equipment and appliances (smart homes). Its activities also include electric vehicles.<br />
Pooling of power plant construction res<strong>our</strong>ces. We are also bundling <strong>our</strong> know-how in the field of<br />
power plant construction. RWE Technology GmbH, a new company, has been in charge of all largescale<br />
new-build projects with the exception of those in the field of renewable energy since January 1,<br />
2010. This enables us to realise synergies across markets, e.g. in engineering and supplier selection.<br />
RWE is building large-scale power stations in Germany, the Netherlands, and the UK with a combined<br />
installed capacity of 12 GW. Further new build projects are planned.<br />
Stronger organisational independence for the electricity transmission network. In July <strong>2009</strong>, we<br />
spun RWE Transportnetz Strom GmbH, which is responsible for operating <strong>our</strong> ultra-high-voltage<br />
network, out of the former RWE Energy AG and assigned it directly to RWE AG. Its expansion into a<br />
fully functional company capable of fulfilling all operational tasks with its own staff is well underway.<br />
The company has been operating under the name Amprion GmbH since September 1, <strong>2009</strong>. By<br />
taking this step, RWE has already largely met the requirements of the Third EU Single Energy Market<br />
Package adopted in July <strong>2009</strong>, which envisions increasing the autonomy of transmission and longdistance<br />
system operators within integrated energy companies.<br />
Joint venture with E.ON for building nuclear power stations in the UK. In January <strong>2009</strong>, RWE and<br />
E.ON established Horizon Nuclear Power Ltd., a joint venture for the development, construction and<br />
operation of nuclear power plants in the UK. At the end of April, the company secured land for this<br />
purpose. The Nuclear Decommissioning Authority had auctioned off plots of land at three locations.<br />
The joint venture placed the winning bids for two sites, Wylfa and Oldbury.<br />
Entry into the Turkish electricity market. In October of <strong>2009</strong>, we signed an agreement with Greekbased<br />
Metka Group to build a combined-cycle gas turbine (CCGT) power plant in Denizli in the west<br />
of Turkey. The 775 MW facility is to be owned and operated by a joint venture between RWE (70 %)<br />
and the Turkish energy company Turcas (30%). We intend to take a final decision on the investment<br />
in the first half of 2010. The CCGT plant is scheduled to go online at the end of 2012.
<strong>2009</strong> in brief To <strong>our</strong> investors Review of operations Our responsibility<br />
Responsibility statement Consolidated financial statements Further information<br />
Major events 51<br />
Exit from nuclear power project in Bulgaria. RWE will not participate in the construction or operation<br />
of a nuclear power station in Belene in northern Bulgaria. In October, we terminated the joint<br />
venture agreement to develop the project with the state-owned energy utility NEK, because project<br />
financing could not be finalised within the agreed period.<br />
Rapid expansion of renewable generation capacity. We made good progress in implementing<br />
<strong>our</strong> growth strategy in the field of energy from renewables in <strong>2009</strong>. A major factor besides the<br />
ac quisition of Essent was RWE Innogy’s extensive capital expenditure. In total, RWE had 2.5 GW<br />
of re newable generation capacity, with another 0.4 GW under construction. In addition, we are<br />
developing projects with a combined installed capacity of 17.1 GW. Wind turbines are the focal<br />
point. Furthermore, we invested in biomass-based electricity and heat generation and entered the<br />
market for solar thermal power plant technology in <strong>2009</strong>.<br />
Above all, we made significant progress in relation to offshore wind power generation. In December,<br />
we commissioned the Rhyl Flats (UK) wind farm, which has a total installed capacity of 90 MW. In<br />
Belgium, RWE Innogy acquired a 26.7 % stake in the Thornton Bank project, which has already been<br />
approved. On completion in 2013, this wind farm will have an installed capacity of 300 MW, of which<br />
30 MW have already been completed. We also achieved a major success in the procurement of plant<br />
components. We struck an agreement with REpower Systems for the company to provide us with<br />
250 REpower 5M/6M offshore wind turbines. A framework agreement to this effect was signed in<br />
February <strong>2009</strong>. The order has a total value of up to €2 billion. The wind energy facilities are scheduled<br />
for delivery from 2011 to 2015. Their rated outputs of 5 MW and 6 MW place them among the<br />
biggest and most powerful turbines worldwide. In addition, RWE Innogy placed an order to build<br />
two special ships for the construction of offshore wind facilities. The investment amounts to approximately<br />
€100 million per ship. Completion is anticipated for 2011. The scarcity of special ships is considered<br />
to be the largest potential bottleneck in the construction of offshore wind farms.<br />
RWE Innogy also posted further growth in onshore wind power generation. In May, we increased<br />
<strong>our</strong> interest in the Spanish wind farm operator Danta de Energías to 98.65 %. We previously held a<br />
stake of 49.33 % via an investment holding company in which we have a 90 % interest. Danta de<br />
Energías owns three wind farms in the province of Castile and León with a combined installed capacity<br />
of 130 MW. RWE Innogy also expanded its onshore wind capacity in the UK, Poland and France,<br />
by commissioning new plants in these countries.
52 Major events<br />
RWE Annual Report <strong>2009</strong><br />
Electricity and heat generation from biomass is another area in which RWE Innogy is on c<strong>our</strong>se<br />
for expansion. We reached a contractual agreement with the UK paper manufacturer Tullis Russell<br />
to supply its plant in Markinch (Scotland) with electricity and heat. <strong>For</strong> this purpose, we will build<br />
a biomass-fired thermal power station with an installed electric capacity of 50 MW, scheduled for<br />
commissioning in 2012. RWE has set aside €235 million for this investment.<br />
Expansion of upstream gas position in UK North Sea. RWE Dea acquired stakes in two undeveloped<br />
gas fields off the UK coast. At the end of July, the company signed an agreement to take a 70 % interest<br />
in the Breagh field, currently the largest undeveloped natural gas discovery in the southern UK<br />
North Sea. The price amounted to approximately €260 million. The Breagh gas field gives us access<br />
to a share of at least 13 billion cubic metres of the res<strong>our</strong>ces and the possibility to conduct further<br />
exploration in the surrounding fields. Also in July, RWE Dea acquired a 50 % stake in several concession<br />
blocks of the smaller Clipper South field. This increases <strong>our</strong> gas res<strong>our</strong>ces by another 2 to<br />
3 billion cubic metres. In total, RWE Dea therefore had 161 billion cubic metres in gas reserves and<br />
res<strong>our</strong>ces at the end of <strong>2009</strong>. With the new investments, we also take the operating lead in the<br />
develop ment of the fields. We intend to commence production in the next three years.<br />
RWE Dea sets stage for upstream activities in Caspian region. The Turkmenistan government has<br />
granted us the rights for the exploration and development of expected gas reserves in the south east<br />
of the Caspian Sea. A corresponding agreement was signed in mid-July. The contracted area spans<br />
940 square kilometres. It was only in April that we had entered into an energy partnership with the<br />
Turkmenistan government. It will involve looking into the possibility of gas deliveries from Turkmenistan<br />
to Europe, for instance via the planned Nabucco pipeline.<br />
Governments agree on basic conditions for operation of Nabucco pipeline. On July 13, the transit<br />
countries of the planned Nabucco long-distance gas pipeline signed an agreement in Ankara, Turkey,<br />
on the framework conditions for its use. It provides both investors and gas suppliers with a stable<br />
legal and operational basis. One of the agreement’s provisions stipulates that transmission capacity<br />
be split in half between the owner companies and other market participants, applying a uniform<br />
method for establishing tariffs. The Nabucco pipeline should give European <strong>customers</strong> access to new<br />
s<strong>our</strong>ces of gas in the Caspian region and the Middle East via a new route and promote competition<br />
in the international gas market. It will start at the eastern border of Turkey and run through Bulgaria,<br />
Romania and Hungary to Baumgarten near Vienna, Austria. Besides RWE, shareholders of the Nabucco<br />
consortium are OMV (Austria), MOL (Hungary), Transgaz (Romania), Bulgarian Energy Holding<br />
(Bulgaria) and BOTAS (Turkey). Based on the current status of the planning process, gas supplies are<br />
scheduled to start flowing through Nabucco in 2014. According to plans, on final completion, the<br />
system will have a size of up to 31 billion cubic metres per annum. The total investment is estimated<br />
at €7.9 billion.
<strong>2009</strong> in brief To <strong>our</strong> investors Review of operations Our responsibility<br />
Responsibility statement Consolidated financial statements Further information<br />
Major events 53<br />
Strengthening of position in Luxemb<strong>our</strong>g. RWE took a 19.8 % share in the new electricity and gas<br />
company Enovos, which was established under the direction of the Grand Duchy of Luxemb<strong>our</strong>g in<br />
<strong>2009</strong>. The utility operations of Cegedel, Soteg (Luxemb<strong>our</strong>g) and Saar Ferngas (south west of Germany)<br />
have been combined in the new entity. RWE incorporated its 30 % stake in Cegedel into the new<br />
company. We had initially shared it with the investment company Luxempart. We acquired Luxempart’s<br />
interest in Cegedel in January of <strong>2009</strong> for a purchase price of €188 million.<br />
RWE acquires ExxonMobil’s German heating business. At the end of June, RWE purchased FAVORIT<br />
Fernwärme GmbH from ExxonMobil for €143 million. FAVORIT is active in the German local and<br />
district heating sectors and employed more than 120 people in <strong>2009</strong>, earning €86 million in revenue.<br />
The company supplies a total of 1 million MWh in heat to 69,000 <strong>customers</strong>. FAVORIT’s core<br />
regions are Hamburg, North Rhine-Westphalia, Hesse and Baden-Württemberg.<br />
EU Commission ends anti-trust investigation of RWE. The European Commission has closed its antitrust<br />
investigation of RWE’s German electricity business. This was officially communicated to us in<br />
October and confirms <strong>our</strong> position, verified by independent certified public auditors and external appraisers,<br />
that RWE operates according to market rules and, in particular, does not withhold any electricity<br />
generation capacity or manipulate wholesale prices. The Commission had started investigating<br />
several European power utilities in 2006, following an electricity sector inquiry.<br />
Gas transmission anti-trust proceedings against RWE ended. The anti-trust abuse proceedings<br />
conducted by the EU Commission against the operator of <strong>our</strong> long-distance gas grid RWE Transportnetz<br />
Gas GmbH (now Thyssengas GmbH) have also been stopped. We have committed to selling the<br />
company to a third party which is independent of RWE. This commitment was officially confirmed by<br />
the EU Commission on March 18 and is therefore legally binding upon us. The EU had conducted an<br />
investigation against us on grounds that it suspected unjustified barriers were put in the way of<br />
gaining access to the German gas transmission system. Our commitment to selling Thyssengas is not<br />
an admission of guilt. We remain convinced that we have complied with the statutory regulations in<br />
the gas business, but we wanted to avoid protracted litigation. Thyssengas operates a grid with a<br />
length of approximately 4,000 kilometres. In fiscal <strong>2009</strong>, the company generated over €200 million<br />
in total revenue.<br />
Dr. Rolf Martin Schmitz joins Executive Board of RWE AG. In its meeting on February 24, <strong>2009</strong>, the<br />
Supervisory Board of RWE AG appointed Dr. Rolf Martin Schmitz to the Executive Board. Dr. Schmitz<br />
took office effective from May 1, <strong>2009</strong>. He is responsible for <strong>our</strong> German generation, network and<br />
sales operations. The 52-year-old engineer has a long successful track record in the energy business.<br />
His most recent position before joining RWE was that of Chairman of the Board of Management of<br />
RheinEnergie AG, based in Cologne, Germany.
54 Major events<br />
RWE Annual Report <strong>2009</strong><br />
Dr. Manfred Schneider new Chairman of the Supervisory Board of RWE AG. In an extraordinary<br />
meeting on May 1, <strong>2009</strong>, the Supervisory Board elected Dr. Manfred Schneider its chairman.<br />
Dr. Schneider, the former CEO of Bayer AG, has been a member of the Supervisory Board of RWE AG<br />
since 1992. He succeeded Dr. Thomas R. Fischer, who had chaired the body since the end of 2004<br />
and resigned this position for personal reasons as of April 30, <strong>2009</strong>.<br />
Major events after the period under review:<br />
RWE Innogy places winning bids for further offshore wind projects in the UK. Within the scope<br />
of an invitation to tender, in early January 2010, the UK government granted RWE Innogy permission<br />
to develop the Atlantic Array and Dogger Bank offshore wind projects. A call for bids had been initiated<br />
for the development rights to a total of nine zones suitable for wind turbines with an installed<br />
capacity of about 25 GW. We will initially develop the Atlantic Array project alone. It will have up to<br />
1.5 GW in generation capacity. <strong>For</strong> Dogger Bank, however, we placed the winning bid as part of a<br />
consortium called “<strong>For</strong>ewind,” which includes the UK utility Scottish & Southern Energy and the<br />
Norwegian energy companies Statoil and Statkraft. Up to 13 GW in wind-based production capacity<br />
can be built in this area. The consortium aims to develop around 9 GW. RWE Innogy owns a 25 %<br />
stake. By taking charge of these projects, we have undertaken to develop both zones to approval.<br />
We are not committed to build the wind farms thereafter.
<strong>2009</strong> in brief To <strong>our</strong> investors Review of operations Our responsibility<br />
Responsibility statement Consolidated financial statements Further information<br />
Notes on reporting 55<br />
1.5<br />
NOTES ON REPORTING<br />
New segment structure in fiscal <strong>2009</strong>. We are applying the new Group structure presented on pages<br />
37 et seq. and 49 for the first time in this report. Prior-year figures have been adjusted in order to<br />
allow for comparison. The segment breakdown is now more in line with national markets, and the<br />
interim holding company, RWE Energy, has ceased to exist. This results in a reporting structure with<br />
the seven following divisions:<br />
• Germany: This division consists of the “Generation” and “Sales and distribution networks” business<br />
areas. The first of these business areas includes RWE Power’s activities (excluding Hungarianbased<br />
Mátra). It does not contain RWE Innogy’s or Essent’s German electricity production. The<br />
“Sales and distribution networks” business area encompasses the new companies RWE Rheinland<br />
Westfalen Netz AG (including RWE Gasspeicher GmbH) and RWE Vertrieb AG (including eprimo<br />
and RWE Aqua). It also includes the German regional utilities, which operate their own electricity<br />
generation facilities to a small extent, besides handling the network and end-customer business.<br />
The new RWE Effizienz GmbH also belongs to this business area. This also applies to several non-<br />
German activities: <strong>our</strong> minority interest in Austrian-based KELAG and Luxemb<strong>our</strong>g-based Enovos as<br />
well as <strong>our</strong> water business in Zagreb, Croatia, which is run by RWE Aqua.<br />
• Netherlands/Belgium: This is the division under which we report on Essent, which was consolidated<br />
for the first time as of September 30, <strong>2009</strong>. It includes the company along with all of the<br />
assumed activities. Our former Dutch energy business (RWE Energy Nederland) was transferred to<br />
Essent effective from October 1. It has been assigned to the “Other, consolidation” item for the<br />
period before that.<br />
• United Kingdom: We present RWE npower in this item. It encompasses <strong>our</strong> entire UK generation<br />
and supply business with the exception of electricity production from renewables, which is overseen<br />
by RWE Innogy.<br />
• Central and Eastern Europe: This division covers <strong>our</strong> companies in Poland, Hungary, the Czech Republic<br />
and Slovakia. In Poland, we focus on electricity supply and the electricity distribution network.<br />
In Hungary, we also concentrate on lignite-based electricity generation, which is managed<br />
by <strong>our</strong> subsidiary Mátra. Before the reorganisation, Mátra belonged to RWE Power. Via minority<br />
interests, we are also active in gas sales and water supply in Hungary. In the Czech Republic, <strong>our</strong><br />
main activity is gas. Our local operations encompass regional supply, distribution, supra-regional<br />
transmission, transit and storage. In Slovakia, we are active in the electricity network and electri c-<br />
ity end-customer businesses through <strong>our</strong> minority interest in VSE and in the gas supply sector via<br />
the new RWE Gas Slovensko.
56 Notes on reporting<br />
RWE Annual Report <strong>2009</strong><br />
• Renewables: This division encompasses all of the activities of RWE Innogy, which specialises in<br />
electricity generation from renewable s<strong>our</strong>ces of energy.<br />
• Upstream gas & oil: This item consists of RWE Dea’s business. The company produces gas and oil,<br />
focusing on Europe and northern Africa.<br />
• Trading/gas midstream: This segment corresponds to RWE Supply & Trading. In addition to energy<br />
trading and the gas midstream activities, this division also subsumes the sales business with <strong>our</strong><br />
major German industrial and corporate <strong>customers</strong> previously handled by RWE Key Account before it<br />
was incorporated into RWE Supply & Trading in <strong>2009</strong>.<br />
The “Other, consolidation” item covers, among others, Amprion (formerly RWE Transportnetz Strom)<br />
and Thyssengas, which is for sale (formerly RWE Transportnetz Gas). It also includes the Group holding<br />
company, RWE AG, as well as <strong>our</strong> internal service providers, namely RWE Service, RWE IT and<br />
RWE Consulting. From 2010 onwards, we will also report on the new RWE Technology under “Other,<br />
consolidation” (see page 50).<br />
EBITDA includes operating income from investments. A further adjustment relates to the determination<br />
of EBITDA (earnings before interest, taxes, depreciation and amortisation), which now<br />
also includes operating income from investments. We have thus adapted the calculation of EBITDA<br />
to that of the operating result. The income contribution made by investments is expected to rise<br />
in the coming years and thus gain significance. This will be in part driven by RWE Innogy’s growth<br />
programme.<br />
American Water deconsolidated. As set out on page 49, we sold <strong>our</strong> entire stake in American Water<br />
last year. This enabled us to deconsolidate the company. It is no longer stated in the balance sheet<br />
for the period ended December 31, <strong>2009</strong>. Earnings contributed by American Water in <strong>2009</strong> are<br />
disclosed as part of “Income from discontinued operations.”
<strong>2009</strong> in brief To <strong>our</strong> investors Review of operations Our responsibility<br />
Responsibility statement Consolidated financial statements Further information<br />
Business performance 57<br />
1.6<br />
BUSINESS PERFORMANCE<br />
Electricity production<br />
by division<br />
Billion kWh<br />
Germany 1<br />
Netherlands/<br />
Belgium<br />
United Kingdom<br />
Central and Eastern<br />
Europe<br />
Renewables<br />
RWE Group<br />
<strong>2009</strong> 2008 <strong>2009</strong> 2008 <strong>2009</strong> 2008 <strong>2009</strong> 2008 <strong>2009</strong> 2008 <strong>2009</strong> 2008<br />
In-house generation 146.0 177.7 4.5 – 26.7 36.7 5.7 5.7 4.3 4.0 187.2 224.1<br />
Lignite 65.3 68.3 – – – – 5.6 5.6 – – 70.9 73.9<br />
Hard coal 31.8 44.0 1.6 – 10.7 18.0 – – – – 44.1 62.0<br />
Nuclear 33.9 49.3 – – – – – – – – 33.9 49.3<br />
Gas 11.5 12.7 2.1 – 15.8 18.2 0.1 0.1 0.2 0.2 29.7 31.2<br />
Renewable energy 1.6 1.5 0.8 – – – – – 4.1 3.8 6.5 5.3<br />
Pumped storage,<br />
oil, other 1.9 1.9 – – 0.2 0.5 – – – – 2.1 2.4<br />
Electricity purchased<br />
from third parties 33.9 33.8 1.5 – 25.9 2 18.1 2 20.3 21.4 0.1 0.3 112.8 3 110.1 3<br />
Total 179.9 211.5 6.0 – 52.6 54.8 26.0 27.1 4.4 4.3 300.0 334.2<br />
1 Including electricity procured from power plants not owned by RWE that we can deploy at <strong>our</strong> discretion on the basis of long-term agreements.<br />
In fiscal <strong>2009</strong>, it amounted to 18.3 billion kWh, of which 16.2 billion kWh were generated from hard coal.<br />
2 The United Kingdom division largely purchases electricity via RWE Supply & Trading.<br />
3 Including purchases by RWE Supply & Trading and companies subsumed under “Other, consolidation” (mainly Amprion).<br />
Electricity generation markedly down. In the financial year that just came to a close, the RWE Group<br />
produced 187.2 billion kilowatt h<strong>our</strong>s (kWh) of electricity — 16 % less than in 2008. In-house generation<br />
and power purchases combined for 300.0 billion kWh. This was 10 % less than in fiscal 2008. In<br />
the year under review, 38 % of electricity generation was from lignite, 24 % hard coal, 18 % nuclear,<br />
and 16 % gas. The share of renewable energy amounted to 3 %.<br />
• Germany: The Germany division produced 146.0 billion kWh of electricity. Relative to the Group,<br />
this corresponds to a share of 78 %. In addition to RWE Power’s German generation, this figure<br />
in cludes small amounts of electricity produced by regional companies. It also encompasses<br />
electricity generated by power plants not owned by RWE that we can deploy on the basis of longterm<br />
agreements. In contrast, it does not include electricity produced by RWE Innogy and Essent<br />
in Germany. The division’s generation was down 18 % compared to 2008. This is in part due to<br />
an outage at the Biblis nuclear power station for maintenance. Block B was offline from the end of<br />
January to the end of November <strong>2009</strong>. Block A was disconnected from the grid at the end of<br />
February <strong>2009</strong> and is scheduled to be ramped up again in March 2010. Without taking the outages<br />
at Biblis into account, electricity production was down 9 %. Most importantly, the contractually<br />
secured hard coal-fired power stations were used less. This is because, due to lower spot prices, we<br />
met some of the obligations arising from forward transactions with lower-cost electricity procured<br />
from third parties by RWE Supply & Trading, instead of through the use of these plants.<br />
• Netherlands/Belgium: All of Essent’s generation is under this division. Since we con solidated the<br />
Dutch utility for the first time as of September 30, <strong>2009</strong>, we have only included its f<strong>our</strong>th-quarter<br />
production for <strong>2009</strong>. It amounted to 4.5 billion kWh.
58 Business performance RWE Annual Report <strong>2009</strong><br />
• United Kingdom: RWE npower generated 26.7 billion kWh of electricity, 27 % less than in the<br />
previous year. As set out on page 45, the market conditions for hard coal and gas-fired power<br />
plants in the UK deteriorated considerably. This resulted from the cyclically induced decline in<br />
demand for electricity and the substantially improved availability of UK nuclear power stations.<br />
• Central and Eastern Europe: Generation in this region totalled 5.7 billion kWh, matching the previous<br />
year’s level, and largely comes from the Hungarian lignite-based power producer Mátra.<br />
• Renewables: RWE Innogy produced 4.3 billion kWh of electricity, nearly exclusively from renewable<br />
s<strong>our</strong>ces of energy, posting a gain of 8 %. This is a result of <strong>our</strong> strategy of increasing the share<br />
of total generation accounted for by renewable energy. In particular, the acquisition of the<br />
Spanish wind farm operator Urvasco Energía in June 2008 had a positive impact. Furthermore,<br />
RWE Innogy commissioned new wind farms. A counteracting effect was felt from the fact that<br />
the use of wind turbines experienced a weather-induced drop compared to the high level witnessed<br />
in 2008.<br />
In addition to <strong>our</strong> in-house generation, we procure electricity from external suppliers. These purchases<br />
totalled 112.8 billion kWh (2008: 110.1 billion kWh). This included electricity fed into RWE’s<br />
network by third parties, in accordance with the German Renewable Energy Act (EEG).<br />
Power plant capacity<br />
by division<br />
as of Dec. 31, <strong>2009</strong>, in MW<br />
Primary energy s<strong>our</strong>ce<br />
Germany 1<br />
Netherlands/<br />
Belgium<br />
United<br />
Kingdom<br />
Central and<br />
Eastern Europe<br />
Renewables<br />
RWE Group<br />
Hard coal 9,785 1,180 4,575 – – 15,540<br />
Lignite 10,162 – – 763 – 10,925<br />
Gas 4,169 1,802 3,026 147 – 9,144<br />
Nuclear 6,295 – – – – 6,295<br />
Renewable energy 306 651 – 1 1,574 2 2,532<br />
Pumped storage, oil, other 2,489 – 2,657 – – 5,146<br />
Total 33,206 3,633 10,258 911 1,574 49,582<br />
1 Including capacities of power stations not owned by RWE that we can deploy at <strong>our</strong> discretion on the basis of long-term agreements.<br />
As of December 31, <strong>2009</strong>, these capacities amounted to 8,712 MW, of which 6,547 MW were based on hard coal.<br />
2 Including small shares of other energy s<strong>our</strong>ces (gas, among others).<br />
Among Europe’s leading electricity generators with nearly 50 gigawatts in power plant capacity.<br />
At the end of the <strong>2009</strong> financial year, the RWE Group had an installed capacity of 49.6 GW. We rank<br />
fifth among Europe’s energy utilities. These figures include the contractually secured capacities mentioned<br />
earlier that are not owned by RWE. Our electricity generation capacity increased by 4.4 GW
<strong>2009</strong> in brief To <strong>our</strong> investors Review of operations Our responsibility<br />
Responsibility statement Consolidated financial statements Further information<br />
Business performance 59<br />
compared with 2008. The acquisition of Essent alone added 3.6 GW. Hard coal accounts for the<br />
biggest share of <strong>our</strong> installed capacity at 31 %, followed by lignite (22%), gas (18%) and nuclear<br />
power (13%). Renewable energy had a share of 5 %, which we intend to increase considerably in the<br />
future. Germany is the division that accounts for the largest share (67%) of <strong>our</strong> power plant capacity.<br />
The UK and the Netherlands/Belgium account for 21 % and 7 % respectively.<br />
Emissions balance<br />
Germany 1 Netherlands/<br />
Million metric tons of CO 2<br />
by country<br />
Belgium<br />
United Kingdom<br />
Central and<br />
Eastern Europe<br />
RWE Group<br />
<strong>2009</strong> 2008 <strong>2009</strong> 2008 <strong>2009</strong> 2008 <strong>2009</strong> 2008 <strong>2009</strong> 2008<br />
CO 2 emissions 123.3 140.9 2.7 – 16.6 24.8 6.5 6.4 149.1 172.1<br />
Free allocation of<br />
CO 2 certificates 83.1 84.9 2.4 – 14.9 14.9 4.8 4.8 105.2 104.6<br />
Shortage of<br />
CO 2 certificates 40.2 56.0 0.3 – 1.7 9.9 1.7 1.6 43.9 67.5<br />
1 Includes power stations not owned by RWE that we can deploy at <strong>our</strong> discretion on the basis of long-term agreements.<br />
In the year under review, they produced 15.4 million metric tons of CO 2<br />
and were allocated certificates for 19.8 million metric tons.<br />
CO 2 emissions down 13 %. In fiscal <strong>2009</strong>, <strong>our</strong> electricity generation operations emitted 149.1 million<br />
metric tons of carbon dioxide. RWE-owned power plants accounted for 133.7 million metric tons, and<br />
the remaining 15.4 million metric tons come from contractually secured capacity. Although Essent<br />
was consolidated for the first time, emissions decreased by 23.0 million metric tons, or 13 % compared<br />
to the previous year. This is due to the significant decline in electricity generated in Germany<br />
and the UK. We emitted 12 % and 33 % less CO 2 in these countries than in 2008. In the f<strong>our</strong>th quarter,<br />
Essent emitted 2.7 million metric tons. In the year under review, we were allocated free state<br />
certificates corresponding to 105.2 million metric tons in CO 2 emissions. We received emissions<br />
allowances for 83.1 million metric tons in Germany, 14.9 million metric tons in the UK, and 2.4 million<br />
metric tons in the Netherlands. In total, the allocation was far from being enough to cover <strong>our</strong><br />
emissions. Therefore, we had to purchase certificates. At the Group level, the shortage amounted to<br />
43.9 million metric tons. However, it was much smaller than in 2008.<br />
In the trading period from 2008 to 2012 and thereafter, we are allowed to cover a maximum of<br />
100 million metric tons of <strong>our</strong> CO 2 emissions by submitting certificates obtained through Kyoto<br />
“Clean Development Mechanism” and “Joint Implementation” projects. This is advantageous because<br />
the cost of these certificates is usually below the market price of emissions allowances allocated<br />
by EU member states. By the end of the <strong>2009</strong> financial year, we had contractually secured certificates<br />
for about 75.2 million metric tons of carbon dioxide. Taking project risks into account, we<br />
estimate that this will give us emissions certificates covering 43.9 million metric tons. We have<br />
already received certificates for 10.1 million metric tons.
60 Business performance RWE Annual Report <strong>2009</strong><br />
Gas and oil production down year on year. In the year under review, RWE Dea produced 2,920 million<br />
cubic metres of gas and 2,336 thousand cubic metres of oil. Converting the gas to oil equivalent<br />
and adding it to crude oil production results in a total production of 5,163 thousand cubic metres, or<br />
32.5 million barrels. This was 10 % less than in 2008. Our natural gas production declined by 12 %.<br />
Quantities obtained from the UK North Sea decreased substantially. In that region, we experienced a<br />
natural drop in production as existing reserves are being gradually exhausted. Our gas production in<br />
Germany and Egypt also dropped, whereas it grew in Norway. The crude oil production of RWE Dea<br />
was 7 % lower than in 2008. Here again, there was a natural decline in production, which primarily<br />
affected <strong>our</strong> German and Danish fields. In Denmark, the situation was compounded by the fact that<br />
production was interrupted for repairs. In contrast, production in Norway increased.<br />
Electricity sales mirror reduction in power plant use. In fiscal <strong>2009</strong>, we supplied 282.8 billion kWh<br />
of electricity to outside <strong>customers</strong>. Electricity sales are typically lower than generation levels. The<br />
main reasons are transmission losses and in-house use by lignite production operations and pumped<br />
storage power stations. Electricity sales were 11 % down on 2008. This drop is largely attributable<br />
to RWE Supply & Trading and is primarily due to the fact that trading of externally s<strong>our</strong>ced electricity<br />
is not recognised in the sales volume. Excluding the trading activities, consolidated electricity sales<br />
were essentially flat, despite the negative economic influence. One reason for this was that new<br />
<strong>customers</strong> were won in the German distributor segment.<br />
Electricity sales volume of the RWE Group in <strong>2009</strong> (2008) by region<br />
%<br />
17.7 (16.5) UK<br />
70.3 (74.7) Germany<br />
6.1 (5.8) Hungary<br />
2.9 (0.5) Netherlands<br />
3.0 (2.5) Other
<strong>2009</strong> in brief To <strong>our</strong> investors Review of operations Our responsibility<br />
Responsibility statement Consolidated financial statements Further information<br />
Business performance 61<br />
External electricity<br />
sales volume<br />
Billion kWh<br />
Private and<br />
commercial <strong>customers</strong><br />
Industrial and<br />
corporate <strong>customers</strong><br />
Distributors Electricity trading Total<br />
<strong>2009</strong> 2008 <strong>2009</strong> 2008 <strong>2009</strong> 2008 <strong>2009</strong> 2008 <strong>2009</strong> 2008<br />
Germany 26.1 26.8 27.3 27.0 54.6 47.1 – – 108.0 100.9<br />
Netherlands/Belgium 3.5 – 2.0 – – – 1.3 – 6.8 –<br />
United Kingdom 20.1 21.4 29.8 31.1 – – – – 49.9 52.5<br />
Central and Eastern Europe 8.7 9.4 9.0 10.3 7.1 5.7 – – 24.8 25.4<br />
Trading/gas midstream – – 26.8 31.2 – – 32.6 70.1 59.4 101.3<br />
Renewables 0.1 0.1 0.1 0.5 1.6 1.1 – – 1.8 1.7<br />
RWE Group 1 59.3 58.8 95.7 100.6 93.9 87.6 33.9 70.1 282.8 317.1<br />
1 Including sales of the “Other, consolidation” segment (primarily of Amprion).<br />
• Germany: This division sold 108.0 billion kWh of electricity, 7 % more than in 2008. In the distributor<br />
segment, we won new <strong>customers</strong> and expanded volumes in existing contracts. Sales in<br />
the industrial and corporate customer segment posted a marginal gain, despite the economic<br />
crisis. We also served new <strong>customers</strong> in this segment. Furthermore, we expanded the residential<br />
and small commercial customer base. By the end of <strong>2009</strong>, the Germany division was supplying<br />
6,863,000 <strong>customers</strong> with electricity, 87,000 more than in the preceding year. These figures only<br />
include fully consolidated companies. Our sales subsidiary eprimo increased its market share<br />
considerably. The company was serving 626,000 electricity <strong>customers</strong> at the end of the year.<br />
• Netherlands/Belgium: After the acquisition of Essent as of September 30, <strong>2009</strong>, the division<br />
contributed 6.8 billion kWh to the RWE Group’s electricity sales volume. As explained earlier,<br />
RWE Energy Nederland’s supply activities are also included. <strong>For</strong> the period prior to the Essent<br />
acquisition, they are included in “Other, consolidation” at the Group level. Effective from December<br />
31, the division was supplying 2,316,000 <strong>customers</strong> with electricity, of which 2,144,000 were<br />
in the Netherlands and 172,000 were in Belgium.<br />
• United Kingdom: RWE npower’s electricity sales amounted to 49.9 billion kWh, which were 5 %<br />
down on 2008. The weak economy led to receding sales volumes primarily in the industrial and<br />
corporate customer segment as well as to more cost-aware energy consumption by households.<br />
Furthermore, <strong>our</strong> UK market share shrank somewhat, owing to fierce price competition. As of<br />
December 31, <strong>2009</strong>, RWE npower was serving 4,147,000 electricity <strong>customers</strong>, 82,000 fewer than<br />
a year earlier. We currently have a 15 % share of the UK residential market.
62 Business performance RWE Annual Report <strong>2009</strong><br />
• Central and Eastern Europe: Electricity sales achieved by this division totalled 24.8 billion kWh.<br />
This is marginally less than in 2008. We suffered economically and competition-induced declines in<br />
the corporate customer segment in Hungary. However, the number of homes we serve there increased.<br />
In total, we had 2,231,000 electricity <strong>customers</strong> in Hungary at year-end, 42,000 more<br />
than in 2008. We also felt the effects of the weaker economy in Poland. Despite this, in the year<br />
under review, <strong>our</strong> Polish electricity customer base expanded by 21,000 to 901,000.<br />
• Trading/gas midstream: RWE Supply & Trading sold 59.4 billion kWh of electricity, 41 % less than in<br />
2008. The main reason for this is that the company covered less of its electricity sales on the<br />
wholesale market via in-house generation than in 2008. It often met its supply obligations with<br />
lower-cost purchases from third parties. In such cases, the trading volumes are not included in external<br />
sales. The economic crisis led to a decline in sales in the former RWE Key Account business.<br />
A stabilising effect was felt from the fact that <strong>our</strong> contracts generally include a purchase obligation<br />
(“take-or-pay” clause).<br />
Gas sales volume of the RWE Group by region in <strong>2009</strong> (2008)<br />
%<br />
22.7 (24.5) Czech Republic 43.1 (47.2) Germany<br />
17.0 (10.3) Netherlands<br />
15.8 (17.8) UK<br />
1.4 (0.2) Other
<strong>2009</strong> in brief To <strong>our</strong> investors Review of operations Our responsibility<br />
Responsibility statement Consolidated financial statements Further information<br />
Business performance 63<br />
External gas sales volume<br />
Billion kWh<br />
Private and<br />
commercial <strong>customers</strong><br />
Industrial and<br />
corporate <strong>customers</strong><br />
Distributors<br />
Total<br />
<strong>2009</strong> 2008 <strong>2009</strong> 2008 <strong>2009</strong> 2008 <strong>2009</strong> 2008<br />
Germany 22.8 24.4 16.4 23.0 55.7 62.2 94.9 109.6<br />
Netherlands/Belgium 17.9 – 16.2 – 2.0 – 36.1 –<br />
United Kingdom 45.1 48.5 6.8 9.0 – – 51.9 57.5<br />
Central and Eastern Europe 33.1 33.5 27.5 31.5 15.3 14.4 75.9 79.4<br />
Upstream gas & oil – – 2.8 2.7 16.2 17.4 19.0 20.1<br />
Trading/gas midstream – – 18.9 19.4 14.2 8.0 33.1 27.4<br />
RWE Group 1 125.7 114.2 102.9 111.6 103.4 102.0 332.0 327.8<br />
1 Including sales by RWE Energy Nederland. The company was assigned to the “Other, consolidation“ segment in the first three quarters of <strong>2009</strong><br />
and in the entire previous year.<br />
Gas sales slightly higher year on year. External gas sales amounted to 332.0 billion kWh, marginally<br />
up on the 2008 level. Excluding the effect of Essent’s first-time consolidation, sales would have<br />
decreased by 7 %. Many industrial <strong>customers</strong> ramped down production in response to the weak economy<br />
and therefore used less gas.<br />
• Germany: In the year being reviewed, this division sold 94.9 billion kWh of gas. This represents<br />
a drop of 13 % compared to 2008. In reaction to increasingly fierce competition in the German gas<br />
market, some of <strong>our</strong> <strong>customers</strong> switched suppliers or started diversifying their gas procurement.<br />
This primarily applied to the German distributors. In addition, the recession caused industrial<br />
operations to use less gas and households to make more cost-aware use of gas. However, belowaverage<br />
temperatures in January and December stimulated demand somewhat. Moreover, eprimo<br />
won new <strong>customers</strong>, serving 47,000 homes by the end of <strong>2009</strong>. In total, <strong>our</strong> fully consolidated<br />
German gas sales companies had 1,072,000 <strong>customers</strong> at the cut-off date, 36,000 more than a<br />
year earlier.<br />
• Netherlands/Belgium: In the f<strong>our</strong>th quarter, Essent (including RWE Energy Nederland) contributed<br />
36.1 billion kWh to the RWE Group’s gas sales volume. At the end of <strong>2009</strong>, Essent was supplying<br />
1,979,000 <strong>customers</strong> with gas, of which 1,920,000 were in the Netherlands and 59,000 were in<br />
Belgium.<br />
• United Kingdom: RWE npower’s gas sales were down 10 % to 51.9 billion kWh. One of the reasons<br />
was the reduction in demand among industrial enterprises, due to the economic situation. Gas<br />
consumption by households and small commercial operations also dropped. This was due to energy<br />
savings, partly in reaction to the economic crisis. By December 31, <strong>2009</strong>, RWE npower had<br />
2,641,000 gas <strong>customers</strong>. We won a net 21,000 <strong>customers</strong> in the year under review. The number<br />
of <strong>customers</strong> to whom we supply both electricity and gas rose by 121,000 to 2,348,000.
64 Business performance RWE Annual Report <strong>2009</strong><br />
• Central and Eastern Europe: Gas sales recorded by this division declined by 4 % to 75.9 billion kWh.<br />
Cyclically and competition-induced losses in the Czech Republic were the main reason. Our customer<br />
base in that country shrank by 23,000 to 2,281,000 over the c<strong>our</strong>se of the year. A positive<br />
effect came from the fact that we now sell gas in Slovakia as well. Established in July 2008, <strong>our</strong><br />
sales subsidiary RWE Gas Slovensko delivered 2.2 billion kWh of gas to corporate <strong>customers</strong>.<br />
• Upstream gas & oil: RWE Dea delivered 19.0 billion kWh of gas to external <strong>customers</strong>, falling<br />
below the prior-year figure by 5 %. This was due to the decline in gas production.<br />
• Trading/gas midstream: RWE Supply & Trading’s external gas sales volume totalled 33.1 billion kWh.<br />
This company focuses on procuring gas for RWE Group companies and therefore pre dominantly<br />
generates internal sales. The company’s external sales consist of supplies to major industrial and<br />
corporate <strong>customers</strong>. They also reflect sales of surplus purchases, which we sell directly to distributors<br />
or on the wholesale market. In the latter case, similar to electricity, this portion is not<br />
included in sales. The share accounted for by direct sales to distributors was much higher in <strong>2009</strong><br />
than in 2008. This is the main reason gas sales rose by 21 %.<br />
RWE Group revenue 1 by region in <strong>2009</strong> (2008)<br />
%<br />
18.1 (20.3) UK 62.0 (62.6) Germany<br />
19.6 (16.5) Rest of<br />
Europe<br />
0.3 (0.6) Other<br />
1 Including natural gas/electricity tax.
<strong>2009</strong> in brief To <strong>our</strong> investors Review of operations Our responsibility<br />
Responsibility statement Consolidated financial statements Further information<br />
Business performance 65<br />
External revenue<br />
€ million<br />
<strong>2009</strong> 2008 +/–<br />
%<br />
Germany 19,386 18,606 4.2<br />
Power generation 1,056 1,093 -3.4<br />
Sales and distribution networks 18,330 17,513 4.7<br />
Netherlands/Belgium 1,799 – –<br />
United Kingdom 7,843 8,618 -9.0<br />
Central and Eastern Europe 5,254 5,776 -9.0<br />
Renewables 245 269 -8.9<br />
Upstream gas & oil 1,208 1,765 -31.6<br />
Trading/gas midstream 6,937 8,663 -19.9<br />
Other, consolidation 5,069 5,253 -3.5<br />
RWE Group 47,741 48,950 -2.5<br />
of which:<br />
Electricity revenue 31,225 31,359 -0.4<br />
Direct electricity tax 1,041 964 8.0<br />
Gas revenue 12,443 13,768 -9.6<br />
Oil revenue 1,024 1,164 -12.0<br />
External revenue marginally down year on year. In <strong>2009</strong>, the RWE Group generated €47.7 billion in<br />
external revenue. This was 2 % less than in the previous year despite Essent’s first-time consolidation.<br />
The main reason was that we sold less in-house generation. Currency exchange rates also had<br />
a negative impact on the revenue trend. Sterling, <strong>our</strong> major foreign currency, lost value compared<br />
with the euro. Averaged for fiscal <strong>2009</strong>, Sterling cost €1.12; in the preceding year, the equivalent<br />
was €1.25. The Czech crown, the Hungarian forint and the Polish zloty also decreased in value. In<br />
contrast, the US dollar rose from €0.68 to €0.72. Net of major consolidation and currency effects,<br />
revenue was down 3 %.<br />
• Germany: The division’s external revenue amounted to €19.4 billion, 4 % up year on year. Electricity<br />
revenue rose by 12 % to €13.6 billion. The aforementioned improvement of the sales volume<br />
and price increases due to higher procurement costs contributed to this. Notably, <strong>our</strong> sales companies<br />
generally purchase electricity far in advance, similar to <strong>our</strong> competitors. Therefore, <strong>2009</strong> procurement<br />
costs were still affected by the price peaks seen on the wholesale market in 2008. Gas<br />
sales by the Germany division resulted in €4,052 million in revenue, 16 % less than in 2008. The<br />
decline in sales mentioned earlier was a reason. Price-related effects also caused revenue to drop.<br />
Our German regional utilities reduced tariffs several times in <strong>2009</strong>. In so doing, they passed the<br />
advantage derived from declining procurement costs through to their <strong>customers</strong>.
66 Business performance RWE Annual Report <strong>2009</strong><br />
• Netherlands/Belgium: The new division earned €1,799 million in revenue in the last three months<br />
of the year being reviewed. €737 million and €813 million of this were attributable to the electricity<br />
and gas businesses, respectively.<br />
• United Kingdom: External revenue generated by RWE npower dropped by 9 % to €7,843 million,<br />
mainly due to currency effects. Excluding them, revenue would have recorded a marginal increase.<br />
Electricity revenue amounted to €5,418 million, down 10 %, and down 1 % excluding currency<br />
effects. Gas revenue declined by 7 % to €1,997 million. It increased by 3 % in Sterling terms. Revenue<br />
from both products was hampered by decreases in sales. But in total, changes in prices had a<br />
positive effect: RWE npower lifted its electricity and gas tariffs for household <strong>customers</strong> by an<br />
average of 14 % and 26 % at the end of August 2008. This was followed by a competition-induced<br />
cut in electricity tariffs by 8 % as of March 31, <strong>2009</strong>.<br />
• Central and Eastern Europe: We posted external revenue amounting to €5,254 million in this<br />
division, €2,453 million of which came from the electricity business, with €2,705 million stemming<br />
from <strong>our</strong> gas operations. Compared to 2008, we recorded declines of 9 % for both products.<br />
Currency effects also played a role here. Excluding them, revenue would have been essentially flat.<br />
We suffered volume-induced declines in revenue in the Czech gas and Hungarian electricity businesses.<br />
However, they were contrasted by a number of positive effects. Revenue generated by the<br />
Polish supply business grew in terms of both price and volume. Increases in electricity tariffs in<br />
Hungary and gas prices in the Czech Republic, as well as RWE Gas Slovensko’s start of operations,<br />
also added revenue.<br />
• Renewables: RWE Innogy’s external revenue totalled €245 million. This was 9 % less than in the<br />
previous year. Lower electricity prices, which had an especially strong impact on <strong>our</strong> Spanish<br />
wind activities, were the main contributors. The fact that the Spanish wind power producer<br />
Urvasco Energía, which was acquired in June 2008, was consolidated for the full year for the first<br />
time in <strong>2009</strong>, had a counteracting effect. €144 million, or more than half, of RWE Innogy’s external<br />
revenue was generated in Germany, primarily from electricity and heat generated by biomass<br />
and gas-fired thermal power stations. Production from German hydroelectric power plants only<br />
accounts for a small proportion, since most of it is sold internally. Revenue outside Germany<br />
predominantly stems from wind turbines in the UK and Spain.<br />
• Upstream gas & oil: This division’s external revenue was down by 32 % to €1,208 million. RWE Dea<br />
sold its crude oil production at much lower dollar prices than in the preceding fiscal year. The<br />
negative impact on revenue was slightly mitigated by the US currency’s gain on the euro. Average<br />
gas prices realised were also down year on year. The decline in gas and oil sales was also reflected<br />
in revenue.<br />
• Trading/gas midstream: External revenue achieved by RWE Supply & Trading totalled €6,937 million,<br />
dropping by 20 % compared to 2008. Most of it was achieved by selling the Group’s in-house<br />
electricity generation on the wholesale market. However, in <strong>2009</strong> the division increasingly met its<br />
supply obligations through purchases from third parties. This reduced revenue, because only the<br />
margins on these transactions are recognised in revenue.
<strong>2009</strong> in brief To <strong>our</strong> investors Review of operations Our responsibility<br />
Responsibility statement Consolidated financial statements Further information<br />
Business performance 67<br />
EBITDA<br />
€ million<br />
<strong>2009</strong> 2008 +/–<br />
%<br />
Germany 5,811 5,545 4.8<br />
Power generation 3,889 3,500 11.1<br />
Sales and distribution networks 1,922 2,045 -6.0<br />
Netherlands/Belgium 277 – –<br />
United Kingdom 445 714 -37.7<br />
Central and Eastern Europe 1,285 1,142 12.5<br />
Renewables 126 103 22.3<br />
Upstream gas & oil 437 748 -41.6<br />
Trading/gas midstream 986 487 102.5<br />
Other, consolidation -202 34 –<br />
RWE Group 9,165 8,773 4.5<br />
Reconciliation of income from operating activities to EBITDA<br />
€ million<br />
<strong>2009</strong> 2008 +/–<br />
%<br />
Income from operating activities 7,326 5,887 24.4<br />
+ Income from investments 262 454 -42.3<br />
– Non-operating result -498 485 –<br />
Operating result 7,090 6,826 3.9<br />
+ Operating depreciation and amortisation 2,075 1,947 6.6<br />
EBITDA 9,165 8,773 4.5<br />
Operating result<br />
€ million<br />
<strong>2009</strong> 2008 +/–<br />
%<br />
Germany 4,780 4,560 4.8<br />
Power generation 3,428 3,072 11.6<br />
Sales and distribution networks 1,352 1,488 -9.1<br />
Netherlands/Belgium 180 – –<br />
United Kingdom 247 534 -53.7<br />
Central and Eastern Europe 1,055 908 16.2<br />
Renewables 56 55 1.8<br />
Upstream gas & oil 203 494 -58.9<br />
Trading/gas midstream 985 486 102.7<br />
Other, consolidation -416 -211 -97.2<br />
RWE Group 7,090 6,826 3.9
68 Business performance RWE Annual Report <strong>2009</strong><br />
Operating result 4 % up year on year. The RWE Group’s operating earnings improved further in<br />
<strong>2009</strong>. EBITDA increased by 4 % to €9,165 million, and the operating result also rose by 4 %, to<br />
€7,090 million. Net of currency effects, both these figures were 6 % higher year on year. The main<br />
drivers were good earnings from <strong>our</strong> German electricity generation, the unusually high earnings<br />
contribution made by RWE Supply & Trading, and the first-time consolidation of Essent in the f<strong>our</strong>th<br />
quarter. This was contrasted by significant drops in earnings in gas and oil production as well as in<br />
the UK energy business. Excluding the effect of Essent’s first-time consolidation, both EBITDA and<br />
<strong>our</strong> operating result were up 2 % compared to 2008. We therefore slightly exceeded the forecast<br />
we issued in February <strong>2009</strong>. Without Essent, we had expected to post figures in the order of the<br />
previous year.<br />
• Germany: The division posted an operating result of €4,780 million. This represents an increase of<br />
5 % over 2008. Developments in the “Power generation” and “Sales and distribution networks”<br />
business areas were as follows:<br />
Power generation: Our German electricity production improved its operating result by 12 % to<br />
€3,428 million. This was mainly due to the realisation of higher prices for <strong>our</strong> generation. We had<br />
sold most of it forward before <strong>2009</strong> at an average price of €70 per MWh (prior year: €58 per MWh).<br />
However, compared with the previous year, the division’s earnings were also marked by negative<br />
effects, in particular the outage of both of the Biblis nuclear power plant’s units for maintenance<br />
purposes (€967 million) and a negative effect of prices on fuel procurement costs (€357 million).<br />
Staff costs also rose. In contrast, due to the reduction in electricity production, the expense we<br />
incurred owing to the shortage of CO 2 emission allowances was lower in <strong>2009</strong> (€959 million) than<br />
in 2008 (€1,089 million).<br />
Sales and distribution networks: The operating result posted by this business area declined by 9 %<br />
to €1,352 million. Negative effects were felt from the fact that the price of some of <strong>our</strong> gas purchases<br />
tracks developments on the oil market. However, the prices in these contracts are much<br />
higher than the current quotations in international gas trading. A portion of <strong>our</strong> forward purchases<br />
can therefore not be sold profitably. Conversely, earnings in the German electricity sales business<br />
improved, because we optimised <strong>our</strong> procurement strategy. No notable additional negative effects<br />
resulted from the introduction of incentive-based regulation to the German network sector.<br />
• Netherlands/Belgium: In the f<strong>our</strong>th quarter, the new division recorded an operating result of<br />
€180 million. Essent’s activities, which were assumed with effect from September 30, <strong>2009</strong>,<br />
contributed €141 million. The remaining €39 million is attributable to RWE Energy Nederland.<br />
• United Kingdom: RWE npower’s operating result amounted to €247 million, slightly less than half<br />
of the previous year’s level. Net of currency effects, the decrease was 49 %. Our electricity generation<br />
activities recorded a substantial drop because power plant margins achievable in the UK market<br />
were lower than in the preceding year. This primarily affected the short-term position management<br />
(STPM) of RWE npower’s generation capacity. In 2008, owing to the outages of competitors’
<strong>2009</strong> in brief To <strong>our</strong> investors Review of operations Our responsibility<br />
Responsibility statement Consolidated financial statements Further information<br />
Business performance 69<br />
power stations, the division’s STPM had made an unusually high contribution to earnings. Expenses<br />
incurred to purchase CO 2 emission allowances in <strong>2009</strong> amounted to €51 million (prior year:<br />
€194 million). Earnings also deteriorated in the UK supply business. As explained earlier, due to<br />
competitive pressure, RWE npower lowered electricity tariffs at the end of March <strong>2009</strong>, although<br />
electricity procurement costs had risen. Measures to promote energy savings in households also<br />
led to approximately €80 million in additional expenditure. UK energy companies are obliged to do<br />
so within the scope of government programmes. In order to stabilise earnings, RWE npower cut<br />
costs substantially in <strong>2009</strong>, leading to €120 million in relief.<br />
• Central and Eastern Europe: The operating result achieved by this division grew by 16 % to<br />
€1,055 million. The significant rise was largely driven by <strong>our</strong> Czech gas business, as sales companies<br />
in that country raised their prices. Furthermore, the Czech regulator approved higher network<br />
fees. Hungarian-based Mátra also posted a gain, in part because the company increased its<br />
electricity production from biomass. Cost reductions also contributed to the growth in earnings.<br />
Currency effects had a counteracting impact, as did the aforementioned declines in sales suffered<br />
by <strong>our</strong> Hungarian electricity and Czech gas sales activities.<br />
• Renewables: RWE Innogy recorded an operating result of €56 million, roughly matching the yearearlier<br />
level. Positive factors were the first-time full-year consolidation of Urvasco Energía, the<br />
acquisition of the Spanish wind farm operator Danta de Energías, and the commissioning of new<br />
wind farms. Negative effects were felt in particular due to RWE Innogy’s extensive capital expenditure<br />
programme, as it goes hand in hand with run-up costs and requires additional manpower. Declining<br />
electricity prices dampened the earnings trend as well. This primarily related to <strong>our</strong> generation<br />
business in Spain.<br />
• Upstream gas & oil: RWE Dea experienced a 59 % drop in its operating result to €203 million. This<br />
was mainly due to the decline in oil and gas prices. However, the impact was slightly buffered by<br />
the fact that the company hedged about a third of its oil production in advance. The fact that<br />
RWE Dea produced less oil and gas than in 2008 depressed earnings even more. In contrast, a<br />
positive effect was felt from the marked decrease in exploration costs. It is predominantly due to<br />
the fact that the share of successful exploratory wells was higher than in 2008. Expenses incurred<br />
for successful wells are capitalised on the balance sheet, whereas, for dry wells, they are directly<br />
recognised in the income statement.<br />
• Trading/gas midstream: RWE Supply & Trading more than doubled its operating result to €985 million.<br />
Our good performance in energy trading was essentially equal to 2008. In addition, we benefited<br />
from the fact that, in compliance with IFRS, major successful forward transactions concluded<br />
in earlier years have only started to have a positive effect on the income statement in <strong>2009</strong>. This<br />
primarily applies to the external marketing of electricity produced by RWE Power and RWE npower.<br />
Margins realised from these trading transactions can only be accounted for as profit or loss on realisation<br />
of the underlying transactions, i.e. at the time of delivery of the electricity. In the year under<br />
review, the share of successful trading transactions directly recognised in the operating result
70 Business performance RWE Annual Report <strong>2009</strong><br />
was larger than in 2008. This had a positive impact as well. RWE Supply & Trading also recorded a<br />
strong gain in the gas midstream business. This was due to significant one-off effects, including<br />
the reversal of provisions accrued in preceding years to cover purchase agreement uncertainties.<br />
In addition, we received strong earnings contributions from the continuous optimisation of <strong>our</strong><br />
international gas procurement portfolio.<br />
• Other, consolidation: The operating result stated under this item worsened by €205 million to<br />
–€416 million, despite the earnings improvements posted by Amprion, the electricity transmission<br />
system operator. The main reason were the negative effects of intra-group consolidations, which<br />
rose considerably.<br />
Key figures for value<br />
management by division<br />
Operating<br />
result<br />
<strong>2009</strong><br />
Capital ROCE<br />
employed <strong>2009</strong><br />
<strong>2009</strong> 1<br />
Capital costs<br />
before taxes<br />
<strong>2009</strong><br />
Absolute<br />
value<br />
added<br />
<strong>2009</strong><br />
Weighted<br />
average cost<br />
of capital<br />
2008<br />
Absolute<br />
value<br />
added<br />
2008<br />
€ million € million % % € million % € million<br />
Germany 4,780 2 27,650 17.3 9.5 2,164 3 9.0 2,243 3<br />
Power generation 3,428 2 12,923 26.6 10.0 2,146 9.5 1,874<br />
Sales and distribution networks 1,352 14,727 9.2 9.0 27 8.5 371<br />
Netherlands/Belgium 180 1,380 13.0 9.0 56 – –<br />
United Kingdom 247 5,009 4.9 10.0 -254 9.5 30<br />
Central and Eastern Europe 1,055 5,305 19.9 9.0 578 8.5 436<br />
Renewables 56 2,323 2.4 9.5 -165 8.5 -66<br />
Upstream gas & oil 203 2,114 9.6 13.0 -72 12.0 277<br />
Trading/gas midstream 985 1,648 59.8 10.0 821 9.5 393<br />
Other, consolidation -416 -1,832 – – 49 – 140<br />
RWE Group 7,090 2 43,597 16.3 9.0 3,177 8.5 3,453<br />
1 Averaged for the year.<br />
2 To determine ROCE and value added, €11 million in interest income from lease accounts receivable must be added.<br />
3 Due to the consideration of the different costs of capital, this figure is not identical to the sum of the value contributions made by “Power generation” and<br />
“Sales and distribution networks.”<br />
RWE achieves a return on capital employed of 16.3 %. Our strategy centres on increasing the<br />
company’s value. Additional value is created when the return on capital employed (ROCE) exceeds<br />
the cost of capital. In fiscal <strong>2009</strong>, <strong>our</strong> ROCE was 16.3 %, clearly surpassing the Group’s cost of capital<br />
before tax, which was 9.0 %. In the preceding year, we used a Group cost of capital of 8.5 %. The increase<br />
in the cost of capital reflects the fact that <strong>our</strong> market environment has become more volatile.
<strong>2009</strong> in brief To <strong>our</strong> investors Review of operations Our responsibility<br />
Responsibility statement Consolidated financial statements Further information<br />
Business performance 71<br />
Our organic performance can primarily be deduced from the development of absolute value added,<br />
the central controlling instrument for all of the RWE Group’s activities. It is an important criterion<br />
for assessing investments and determining <strong>our</strong> executives’ performance-linked payments. Absolute<br />
value added is obtained by multiplying the difference between ROCE and cost of capital by capital<br />
employed. In fiscal <strong>2009</strong>, the RWE Group’s value added amounted to €3,177 million. This is 8 % less<br />
than in 2008 (€3,453 million), despite the marginal improvement in the operating result. The reason<br />
for this is the increase in the Group’s cost of capital which went hand in hand with corresponding<br />
adjustments in all divisions. Furthermore, <strong>our</strong> intensified investment activity led to a higher asset<br />
base. New plants are assigned to capital employed during the construction phase even if they do not<br />
contribute to earnings yet.<br />
• Germany: Value added by the division totalled €2,164 million, representing the largest contribution<br />
within the RWE Group, but falling slightly below the previous year’s figure (€2,243 million). If<br />
the cost of capital had not been raised, value added would have grown marginally. This is due to<br />
the improved earnings of <strong>our</strong> power generation operations, whereas considerable investments in<br />
power plant new builds and the decline in earnings in the sales and distribution networks business<br />
area had a counteracting effect.<br />
• Netherlands/Belgium: €56 million in value was added in this division, €17 million of which was<br />
attributable to Essent’s first-time consolidation, with RWE Energy Nederland’s sales business<br />
contributing €39 million. As the division’s operating result was only included for the f<strong>our</strong>th quarter<br />
of <strong>2009</strong> when determining value added, we considered capital employed on a pro-rata basis as<br />
well.<br />
• United Kingdom: RWE npower’s value added was negative, amounting to –€254 million, falling<br />
far below the positive figure recorded in the previous year (€30 million). This was predominantly<br />
due to the steep fall in earnings.<br />
• Central and Eastern Europe: The fact that this division’s earnings improved compared to 2008 is<br />
also reflected in the development of its value added. It grew by €142 million to €578 million.<br />
• Renewables: RWE Innogy’s value added fell by €99 million to –€165 million. This reflects the<br />
substantial investment in the expansion of the generation portfolio and the higher capital cost<br />
base.<br />
• Upstream gas & oil: RWE Dea also failed to cover its cost of capital. At –€72 million, its value<br />
contribution was far below the previous year’s high level (€277 million). This was mainly due to the<br />
significant deterioration of its earnings. Again, intensified investing activity and the rise in the<br />
cost of capital also had an impact.
72 Business performance RWE Annual Report <strong>2009</strong><br />
• Trading/gas midstream: RWE Supply & Trading produced €821 million in value added, the secondhighest<br />
contribution within the RWE Group. The division posted an increase of €428 million on a<br />
year-on-year basis. The main driver was the unusually high earnings contribution in <strong>2009</strong>.<br />
Detailed information on the value management concept can be found on pages 207 et seq.<br />
Reconciliation to net income: positive one-off effects. The reconciliation from the operating result<br />
to net income is characterised by positive one-off effects of the fair valuation of commodity<br />
derivatives. Compared to the previous year, the absence of the charges incurred owing to American<br />
Water’s IPO also had an impact. This was contrasted by higher interest expenses and a write-down<br />
of <strong>our</strong> stake in US-based Excelerate Energy.<br />
Non-operating result<br />
€ million<br />
<strong>2009</strong> 2008 +/–<br />
€ million<br />
Capital gains 35 89 -54<br />
Impairment losses – – –<br />
Restructuring, other 463 -574 1,037<br />
Non-operating result 498 -485 983<br />
In the year under review, the non-operating result amounted to €498 million. This was a marked<br />
improvement on the previous year’s figure (–€485 million). Its components developed as follows:<br />
• As in 2008, there were no notable capital gains. The single largest contribution came from the<br />
transfer of electricity networks and sales activities of the former RWE Rhein-Ruhr to Stadtwerke<br />
Neuss. This transaction, through which we acquired a 24.9 % stake in the municipal utility,<br />
un covered hidden reserves.<br />
• The result stated under “Restructuring, other” amounted to €463 million, up by €1,037 million<br />
compared to 2008. This was largely due to effects relating to the accounting treatment of<br />
derivative transactions, which are concluded to hedge the prices of forward contracts (underlying<br />
transactions). Pursuant to IFRS, these derivatives are accounted for at fair value at the corresponding<br />
balance sheet date, whereas the underlying transactions (which show the exact opposite<br />
reaction) are only recognised with an effect on profit or loss later on, when they are realised. This<br />
results in short-term effects on earnings, which are neutralised over time. The derivatives largely<br />
related to gas forward sales of RWE Supply & Trading, RWE Vertrieb and RWE Energy Nederland.<br />
Changes in their fair values led to €720 million in income, following the expense of €404 million in<br />
the preceding year. A counteractive effect was felt from the US$250 million (€179 million)<br />
write-down of <strong>our</strong> at-equity investment in Excelerate Energy. The US liquefied natural gas (LNG)
<strong>2009</strong> in brief To <strong>our</strong> investors Review of operations Our responsibility<br />
Responsibility statement Consolidated financial statements Further information<br />
Business performance 73<br />
transport specialist has not been able to meet <strong>our</strong> profitability expectations so far, due to the<br />
underlying conditions in the LNG market, which are difficult at present. The “Restructuring, other”<br />
item also includes income resulting from changes in nuclear and mining provisions. At €411 million,<br />
it was much higher in <strong>2009</strong> than in the previous year (€167 million). This was primarily due to<br />
changes in the estimates for mining provisions. We assume that the costs we will incur to restore<br />
lignite mining properties will be lower, among other things. We recognised €252 million in amortisation<br />
on RWE npower’s customer base. It was therefore somewhat lower than 2008’s comparable<br />
figure (€279 million) for currency-related reasons.<br />
Financial result<br />
€ million<br />
<strong>2009</strong> 2008 +/-<br />
€ million<br />
Interest income 589 807 -218<br />
Interest expenses -1,224 -965 -259<br />
Net interest -635 -158 -477<br />
Interest accretion to non-current provisions -957 -738 -219<br />
Other financial result -398 -579 181<br />
Financial result -1,990 -1,475 -515<br />
In the year under review, the financial result decreased by €515 million to –€1,990 million. Its components<br />
developed as follows:<br />
• Net interest declined by €477 million to –€635 million. Debt rose due to <strong>our</strong> growth investments<br />
and the acquisition of Essent, causing the interest expenses to increase. Charges also resulted<br />
from the fees on the credit line we were granted by banks in the run-up to the acquisition of<br />
Essent. In addition, sales of securities led to a reduction in interest income.<br />
• The interest accretion to non-current provisions rose by €219 million to €957 million. One reason<br />
for this was the decline in income from <strong>our</strong> pension funds due to a drop in assets. When the interest<br />
accretion is calculated, this income is deducted. Furthermore, we lowered the discount rates for<br />
other non-current provisions and made a corresponding upward adjustment to the provisions. The<br />
impact from this is also reflected in the interest accretion.<br />
• The “Other financial result” improved by €181 million. But, at –€398 million, it was still clearly<br />
in the red. Two of the reasons were that we realised book losses on the sale of securities and writedowns<br />
on securities in the year under review. However, these charges had been much higher in<br />
2008, due to the crisis experienced by financial markets.
74 Business performance RWE Annual Report <strong>2009</strong><br />
As a result of the aforementioned effects, <strong>our</strong> continuing operations generated €5,598 million in<br />
income before tax. This was 15 % more than in the prior year. Our effective tax rate rose by f<strong>our</strong><br />
percentage points to 33 %, in part because the previous year’s figure still included one-off effects.<br />
In 2008, we successfully concluded tax litigation cases in the UK and Germany.<br />
Income from continuing operations after tax totalled €3,740 million, up 9 % on 2008. The RWE<br />
Group’s discontinued operations (American Water) earned €91 million in income. In the preceding<br />
year, the company had recorded a loss of €567 million, which was in relation to the IPO of American<br />
Water. When we floated 39.5 % of the shares in the company in April 2008, the issue price was below<br />
the carrying amount and we wrote down the value of <strong>our</strong> remaining stake in the company accordingly.<br />
As presented on page 49, we sold the remaining shares in American Water in several tranches<br />
in <strong>2009</strong>.<br />
The minority interest declined by €58 million to €260 million. This was caused by the gradual sale of<br />
American Water, among other things.<br />
The RWE Group’s net income rose by 40 % to €3,571 million. Our earnings per share advanced<br />
from €4.75 to €6.70. The number of RWE shares outstanding decreased due to the share buyback<br />
con ducted between February and May 2008. In <strong>2009</strong>, they averaged 533.1 million, compared<br />
to 538.4 million in the prior year.<br />
Reconciliation to net income <strong>2009</strong> 2008 +/–<br />
%<br />
Operating result € million 7,090 6,826 3.9<br />
Non-operating result € million 498 -485 202.7<br />
Financial result € million -1,990 -1,475 -34.9<br />
Income from continuing operations before tax € million 5,598 4,866 15.0<br />
Taxes on income € million -1,858 -1,423 -30.6<br />
Income from continuing operations € million 3,740 3,443 8.6<br />
Income from discontinued operations € million 91 -567 116.0<br />
Income € million 3,831 2,876 33.2<br />
Minority interest € million 260 318 -18.2<br />
Net income € million 3,571 2,558 39.6<br />
Recurrent net income € million 3,532 3,367 4.9<br />
Earnings per share € 6.70 4.75 41.1<br />
Recurrent net income per share € 6.63 6.25 6.1<br />
Effective tax rate % 33 29 –
<strong>2009</strong> in brief To <strong>our</strong> investors Review of operations Our responsibility<br />
Responsibility statement Consolidated financial statements Further information<br />
Business performance 75<br />
Recurrent net income improved by 5 %. The key figure that is decisive for <strong>our</strong> dividend policy is<br />
recurrent net income. It does not include the non-operating result. Major non-recurrent effects in<br />
the financial result, in income taxes and in income from discontinued operations are also excluded.<br />
In the year under review, recurrent net income totalled €3,532 million, 5 % more than in 2008. As<br />
Essent only contributed to the operating result in the f<strong>our</strong>th quarter of <strong>2009</strong>, we only recognised<br />
the costs of acquisition financing incurred in that period. Excluding Essent, recurrent net income<br />
increased by 3 %. We therefore exceeded the forecast we had issued in February <strong>2009</strong>, which envisaged<br />
a figure in the order of the preceding year.<br />
Planned efficiency enhancements<br />
compared to 2006<br />
€ million (accumulated)<br />
2007 2008 <strong>2009</strong> 2010 2011 2012<br />
100 200 450 700 900 1,200<br />
Efficiency-enhancement programme: target for <strong>2009</strong> achieved. We are still making good progress<br />
with the efficiency-enhancement programme we initiated in 2007. By taking measures to reduce<br />
costs and increase revenue, we aim to gradually lift annual earnings by a total of €1.2 billion by the<br />
end of 2012. The reference year is 2006. One of the project’s goals is to enhance the performance of<br />
<strong>our</strong> German electricity and gas network business, which should limit the effect of tariff cuts mandated<br />
by the network regulator. Further savings are to be achieved through improvements in IT services<br />
and purchasing as well as the pooling of back-office functions. Moreover, we intend to increase revenue<br />
by improving the technical availability of <strong>our</strong> power plants. We had envisaged obtaining additional<br />
earnings from the programme every year, gradually rising to €450 million until <strong>2009</strong>, compared<br />
to 2006. We have achieved this target.
76 Business performance RWE Annual Report <strong>2009</strong><br />
Capital expenditure on financial assets<br />
€ million<br />
<strong>2009</strong> 2008 +/–<br />
€ million<br />
Germany 1,325 53 1,272<br />
Power generation 45 1 44<br />
Sales and distribution networks 1,280 52 1,228<br />
Netherlands/Belgium 7,794 – 7,794<br />
United Kingdom 114 1 113<br />
Central and Eastern Europe 3 11 -8<br />
Renewables 286 812 -526<br />
Upstream gas & oil – – –<br />
Trading/gas midstream 141 321 -180<br />
Other, consolidation 61 41 20<br />
RWE Group 9,724 1,239 8,485<br />
Capital expenditure on property, plant and equipment<br />
€ million<br />
<strong>2009</strong> 2008 +/–<br />
€ million<br />
Germany 2,813 2,180 633<br />
Power generation 1,791 1,420 371<br />
Sales and distribution networks 1,022 760 262<br />
Netherlands/Belgium 156 – 156<br />
United Kingdom 853 610 243<br />
Central and Eastern Europe 368 355 13<br />
Renewables 447 290 157<br />
Upstream gas & oil 855 606 249<br />
Trading/gas midstream 2 – 2<br />
Other, consolidation 419 413 6<br />
RWE Group 5,913 4,454 1,459<br />
Capital expenditure on property, plant and equipment a third higher year on year. The RWE Group<br />
increased capital spending by €9.9 billion to €15.6 billion. Our capital expenditure on financial assets<br />
totalled €9,724 million, which was nearly eight times higher than in 2008. The acquisition of the<br />
Dutch utility Essent was the main factor. We spent €5,913 million in capital on property, plant and<br />
equipment. This was a third more than in the preceding year. Nevertheless, we remained slightly behind<br />
<strong>our</strong> expectations, in part due to delays in power plant projects. In February <strong>2009</strong>, we had forecast<br />
capital expenditure on property, plant and equipment in the order of €6.5 billion for the Group<br />
excluding Essent.
<strong>2009</strong> in brief To <strong>our</strong> investors Review of operations Our responsibility<br />
Responsibility statement Consolidated financial statements Further information<br />
Business performance 77<br />
• Germany: Capital expenditure by this division amounted to €4,138 million. This represents an increase<br />
of 85 % compared to 2008. The division’s business areas displayed the following development:<br />
Power generation: Capital spending by this business area was up 29 % to €1,836 million. Almost<br />
all of this money was spent on property, plant and equipment. The major project is the 2,100 MW<br />
dual-block lignite-fired power plant in Neurath near Cologne, Germany. However, delays occurred,<br />
primarily due to quality-related problems experienced by suppliers and a severe accident in 2007.<br />
Based on <strong>our</strong> current planning, both units will go online in 2011. In addition, RWE Power is building<br />
an 887 MW combined-cycle gas turbine power station in Lingen and a 1,528 MW twin-unit hard<br />
coal facility in Hamm (both Germany). Quality-related problems experienced by suppliers led to<br />
delays here as well. The Lingen gas-fired power station is scheduled for commissioning in 2010,<br />
and the hard coal twin unit in Hamm is due to commence production in 2012. Also among the<br />
projects being developed by RWE Power is the 1,560 MW twin-unit hard coal facility in the Dutch<br />
port of Eemshaven. Construction on this plant started at the beginning of <strong>2009</strong>. Our schedule<br />
envisages putting the facility online in 2013. We plan to assign the project to the Netherlands/<br />
Belgium division in <strong>our</strong> reporting from 2010 onwards. These new-build power plants will enable us<br />
to achieve significant improvements in terms of efficiency and emissions. Furthermore, the new<br />
units will be capable of switching loads much faster than old facilities. This enables us to take<br />
advantage of price fluctuations in electricity spot trading by making more flexible use of <strong>our</strong><br />
power plants.<br />
Sales and distribution networks: We spent €2,302 million in capital in this business area.<br />
€1,280 million was earmarked for financial assets. €800 million thereof was spent to acquire the<br />
20 % stake in the former regional company RWE Westfalen-Weser-Ems held by municipal shareholders.<br />
An additional €188 million was used to purchase the remaining shares in a joint venture which<br />
owns 19.8 % of the new Luxemb<strong>our</strong>g-based energy utility Enovos (see page 53). Furthermore, we<br />
acquired the German district heating company FAVORIT from ExxonMobil for €143 million. As<br />
mentioned earlier, by transferring network and sales activities to Stadtwerke Neuss, we also took a<br />
24.9 % stake in that company. Capital expenditure on property, plant and equipment amounted to<br />
€1,022 million. A sizeable portion of this was dedicated to the expansion and modernisation of<br />
network infrastructure. Moreover, we invested in the enlargement of <strong>our</strong> gas storage capacity.<br />
• Netherlands/Belgium: Capital expenditure in this division totalled €7,950 million. Including<br />
ancillary acquisition costs, €7,794 million was used to take over Essent. We acquired the Dutch<br />
energy utility as of September 30, <strong>2009</strong>, along with its stake in Bremer Stadtwerke (swb), which<br />
was sold on in October. After Essent had been consolidated for the first time, the division spent<br />
€156 million in capital on property, plant and equipment. The major projects are the Moerdijk 2<br />
and Claus C combined-cycle gas turbine power plants in the Netherlands. They are both under<br />
construction. Moerdijk 2 is being built directly adjacent to the Moerdijk power plant and can make<br />
use of the latter’s high-voltage connection, gas supply lines and cooling system. It will have an<br />
installed capacity of 426 MW and is scheduled to go online in 2011. Claus C is envisaged to have
78 Business performance RWE Annual Report <strong>2009</strong><br />
an installed capacity of 1,304 MW and replace the existing Claus B (640 MW) gas-fired power<br />
station. According to <strong>our</strong> schedule, the facility will go online in 2012. We have set aside approximately<br />
€1.5 billion for these two projects until their completion.<br />
• United Kingdom: RWE npower increased capital expenditure by 58 % to €967 million. Spending on<br />
financial assets accounted for €114 million, a small share of total capital expenditure. These funds<br />
were used to acquire the Superior Plumbing Installation Group (SPI), which specialises in providing<br />
mechanical and electrical installations and maintenance services. Capital expenditure on property,<br />
plant and equipment amounted to €853 million. Centre stage was taken by the construction<br />
of two state-of-the-art combined-cycle gas turbine power stations. One facility is being built at<br />
Staythorpe, which will have an installed capacity of 1,650 MW and is due to go online in 2010. The<br />
second plant, located at Pembroke, will have an installed capacity of 2,188 MW, and is scheduled<br />
to begin generating electricity in 2012.<br />
• Central and Eastern Europe: Capital expenditure totalled €371 million, roughly matching the 2008<br />
level. It was almost exclusively used on property, plant and equipment. Most of the funds were<br />
dedicated to the electricity and gas network infrastructure. Furthermore, we invested in the expansion<br />
of <strong>our</strong> Czech gas storage capacity.<br />
• Renewables: RWE Innogy aims to expand its renewable generation base significantly and is making<br />
good progress. Capital expenditure on property, plant and equipment and financial assets totalled<br />
€733 million, a third less than the previous year’s figure, which included several sizeable acquisitions.<br />
In the year under review, RWE Innogy spent €286 million on financial assets (prior<br />
year: €812 million). This included the acquisition of shares in the Thornton Bank offshore wind<br />
farm and in the Spanish wind power generator Danta de Energías. Furthermore, we made advance<br />
payments for commissioned special ships that we intend to use to build offshore wind farms. In<br />
addition, RWE Innogy granted loans, which are not classified as capital expenditure on financial<br />
assets, to affiliated companies: €220 million in funds were dedicated to the Greater Gabbard Offshore<br />
Winds Ltd. joint venture, which is building the namesake wind farm off the UK coast. We<br />
hold a 50 % stake in the company. RWE Innogy’s capital expenditure on property, plant and equipment<br />
totalled €447 million. The majority of the funds was earmarked for wind power projects, including<br />
the construction of the 90 MW Rhyl Flats wind farm off the coast of Wales, which we completed<br />
in December <strong>2009</strong>. Including the aforementioned loans, RWE Innogy spent approximately<br />
€1 billion in capital to expand its renewable generation base.<br />
• Upstream gas & oil: Capital spending at RWE Dea amounted to €855 million, up 41 % year on year.<br />
The focus was placed on developing existing discoveries in preparation for production. In July,<br />
RWE Dea also acquired stakes in two undeveloped gas fields in the UK North Sea (see page 52).
<strong>2009</strong> in brief To <strong>our</strong> investors Review of operations Our responsibility<br />
Responsibility statement Consolidated financial statements Further information<br />
Business performance 79<br />
• Trading/gas midstream: RWE Supply & Trading spent €143 million in capital, almost all of which<br />
was dedicated to financial assets. The latter accounted for less than half of the previous year’s<br />
figure, which included the acquisition of a 50 % stake in Excelerate Energy, the US LNG company.<br />
Additions to Excelerate Energy’s equity were the single largest item in the year under review.<br />
• Other, consolidation: This item includes €480 million in capital expenditure for <strong>2009</strong>, largely relating<br />
to property, plant and equipment. Most of the funds were used by Amprion to modernise and<br />
expand the electricity transmission grid.<br />
Employee headcount much higher due to acquisition of Essent. As of the balance-sheet date, the<br />
RWE Group employed 70,726 people (converted to full-time positions). The workforce expanded by<br />
4,818 personnel, or 7%, compared to December 31, 2008. Company acquisitions added 4,948 staff<br />
members, 4,287 of which are allocable to Essent alone. A further 480 came from the Superior Plumbing<br />
Installation Group (SPI), which was acquired by RWE npower. Operating changes resulted in the<br />
loss of 1,108 positions in <strong>our</strong> non-German Group companies, whereas 978 were added in Germany.<br />
RWE Power and RWE Innogy had a large number of new hires. One of the reasons was increasing<br />
investment. As in prior years, we trained far more people than required to cover <strong>our</strong> own needs. By<br />
December 31, <strong>2009</strong>, 3,081 young adults were in a professional training programme at RWE. Staff<br />
figures do not include trainees.<br />
Workforce 1 Dec 31, 09 Dec 31, 08 +/–<br />
%<br />
Germany 33,605 33,684 -0.2<br />
Power generation 15,346 15,101 1.6<br />
Sales and distribution networks 18,259 18,583 -1.7<br />
Netherlands/Belgium 4,695 – –<br />
United Kingdom 12,224 12,747 -4.1<br />
Central and Eastern Europe 11,289 11,627 -2.9<br />
Renewables 980 712 37.6<br />
Upstream gas & oil 1,279 1,144 11.8<br />
Trading/gas midstream 989 883 12.0<br />
Other 2 5,665 5,111 10.8<br />
RWE Group 70,726 65,908 7.3<br />
1 Converted to full-time positions.<br />
2 Including Amprion, Thyssengas, RWE IT, RWE Service and RWE Consulting. The 2008 figure also includes RWE Energy Nederland.
80 Business performance RWE Annual Report <strong>2009</strong><br />
Continued savings in Group purchasing. RWE Service, <strong>our</strong> internal service provider, is in charge of<br />
purchasing goods and services. This does not include the procurement of commodities, insurance<br />
services, or power plant components needed for new build projects. RWE Service uses standardised<br />
purchasing systems and complies with the principles of best practice. The company realised substantial<br />
savings in fiscal <strong>2009</strong> yet again, inter alia through the systematic recording of major product<br />
groups and suppliers. In addition, it has introduced groupwide standards for processes, IT systems<br />
and purchasing tools, stepped up its participation in auctions, and carried out a comprehensive<br />
quali fication programme for procurement personnel.<br />
Raw materials are s<strong>our</strong>ced by <strong>our</strong> generation companies directly on the market, or via RWE Supply<br />
& Trading. In <strong>2009</strong>, the amount of hard coal procured to generate electricity totalled 16.2 million<br />
metric tons of hard coal unit (HCU), compared to 19.0 million metric tons in the previous year. This<br />
includes coal for power plants not owned by RWE that we can deploy at <strong>our</strong> discretion on the basis of<br />
long-term agreements. In the financial year that just came to a close, RWE Power s<strong>our</strong>ced 10.5 million<br />
metric tons of HCU (previous year: 13.9 million metric tons), and RWE npower purchased 5.2 million<br />
metric tons (previous year: 5.1 million metric tons). Essent accounts for 0.5 million metric tons,<br />
but was again only included for the f<strong>our</strong>th quarter. The considerable decline in purchasing volume in<br />
the RWE Group is due to the reduced utilisation of <strong>our</strong> hard coal power stations. We cover 50 % of<br />
coal demand through <strong>our</strong> own German power plants from domestic production s<strong>our</strong>ces. Russia is<br />
RWE npower’s major supplier region, delivering some 70 % of the hard coal used in <strong>our</strong> UK power<br />
plants.<br />
RWE s<strong>our</strong>ces lignite from proprietary opencast mines. In the Rhineland, <strong>our</strong> main mining region, we<br />
produced 92 million metric tons of lignite in <strong>2009</strong> (previous year: 96 million metric tons). Our power<br />
plants used 82 million metric tons to generate electricity, and we used 10 million metric tons to<br />
manufacture refined products.<br />
Our gas purchasing is pooled in RWE Supply & Trading. Including Essent on a full twelve-month basis<br />
gives us an annual procurement volume in the order of 50 billion cubic metres. About half of it is<br />
s<strong>our</strong>ced from the National Balancing Point in the UK and the Title Transfer Facility in the Netherlands,<br />
both of which are wholesale markets. Furthermore, we purchase gas on the basis of long-term takeor-pay<br />
agreements, the conditions of which are strongly orientated towards the development of oil<br />
price indices. We conclude such supply agreements largely with companies in Russia, Norway, Germany<br />
and the Netherlands. Approximately 3 % of <strong>our</strong> gas purchase volume is covered by RWE Dea’s<br />
in-house production.
<strong>2009</strong> in brief To <strong>our</strong> investors Review of operations Our responsibility<br />
Responsibility statement Consolidated financial statements Further information<br />
Financial position and net worth 81<br />
1.7<br />
FINANCIAL POSITION AND NET WORTH<br />
The acquisition of the Dutch-based energy utility Essent caused us to take extensive financing<br />
measures in <strong>2009</strong>. We issued apple6.2 billion in bonds for this. Due to the acquisition, <strong>our</strong> net debt<br />
rose to €25.8 billion. It is now 2.8 times as high as <strong>our</strong> EBITDA. In future, we will orientate <strong>our</strong>selves<br />
towards an upper limit of 3.0. This is how we intend to secure <strong>our</strong> good credit ratings over<br />
the long term.<br />
Central financing. The RWE Group’s financing is the responsibility of RWE AG, the corporate headquarters.<br />
RWE AG usually issues bonds via RWE Finance B.V. Only in specific cases do other<br />
subsidiaries raise capital directly, especially if it is more advantageous economically to make use of<br />
local credit and capital markets. Furthermore, RWE AG acts as co-ordinator when Group companies<br />
assume a liability: The company co-ordinates and decides on the scope of warranties issued and<br />
letters of comfort signed. Pooling these activities is a basic prerequisite for managing and monitoring<br />
financial risks centrally. Moreover, this strengthens <strong>our</strong> position when negotiating with banks,<br />
business partners, suppliers and <strong>customers</strong>.<br />
Financial flexibility. We primarily meet <strong>our</strong> financing needs with the high and relatively stable cash<br />
flows that we generate from <strong>our</strong> operating activities. In addition, we have access to a number of<br />
flexible financing instruments. One of <strong>our</strong> major tools is the Debt Issuance Programme (DIP) for<br />
long-term refinancing on the capital market. The maximum nominal volume of bonds that we can<br />
issue through the DIP totals €30 billion. At the end of <strong>2009</strong>, a nominal €16.4 billion in bonds were<br />
outstanding. In addition to the DIP, we have a US$5 billion commercial paper programme for shortterm<br />
financing on the money market. As of December 31, <strong>2009</strong>, a foreign-currency equivalent of<br />
€0.2 billion in RWE commercial paper was outstanding.<br />
Two €2.0 billion credit lines serve as an additional liquidity reserve. They will remain available to us<br />
until October 2011. We have not used them so far. A €9 billion credit line granted to us by banks at<br />
the beginning of <strong>2009</strong> in the run-up to the Essent acquisition has not been used either. We financed<br />
the acquisition directly by issuing bonds and using <strong>our</strong> own funds and cancelled that line of credit.<br />
Neither the aforementioned financing programmes, nor the current credit facilities, contain specific<br />
financial covenants such as interest coverage, leverage or capitalisation ratios that could trigger<br />
actions, such as acceleration of repayment or provision of additional collateral. Likewise, they do not<br />
contain rating triggers.
82 Financial position and net worth<br />
RWE Annual Report <strong>2009</strong><br />
Maturity profile of the RWE Group‘s capital market debt (as of Dec 31, <strong>2009</strong>)<br />
Maturity<br />
€ billion<br />
2.5<br />
2.0<br />
1.5<br />
1.0<br />
0.5<br />
0.0<br />
Year<br />
’10 ’11 ’12 ’13 ’14 ’15 ’16 ’17 ’18 ’19 ’20 ’21 ’22 ’23 ’24 ’25 ’26 ’27 ’28 ’29 ’30 ’31 ’32 ’33 ’34 ’35 ’36 ’37 ’38 ’39<br />
RWE AG/RWE Finance<br />
RWE places bonds to refinance the acquisition of Essent. In <strong>2009</strong>, we issued a total of €6.2 billion<br />
in bonds via RWE Finance B.V. They are denominated in euros and Sterling. Their maturities range<br />
from 2.5 to 30 years. All of the issuances were several times oversubscribed. This proves that RWE<br />
continues to have a good reputation as a bond issuer. These funds were used to finance the acquisition<br />
of Essent and in part to finance the strong rise in capital expenditure on property, plant and<br />
equipment. The weighted average remaining term to maturity of RWE’s outstanding bonds was nine<br />
years at the end of the period under review. €0.6 billion in bonds come due in 2010.<br />
RWE Group’s capital market debt as of Dec 31, <strong>2009</strong><br />
by remaining term to maturity<br />
0 - 3 years 4 - 7 years 8 - 12 years > 12 years<br />
Nominal volume € billion 3.9 5.1 3.7 3.7<br />
Relative share of total volume % 24 31 22 23<br />
Net debt up to €25.8 billion. As of the balance sheet date, <strong>our</strong> net debt amounted to €25.8 billion.<br />
It increased by €7.1 billion in the <strong>2009</strong> financial year. This was mainly due to the acquisition of<br />
Essent (€6.9 billion). In addition, <strong>our</strong> capital expenditure on property, plant and equipment<br />
(€5.9 billion) and <strong>our</strong> dividend payment (€2.6 billion) hit record levels. In contrast, cash flows from<br />
operating activities dampened the rise in liabilities. Furthermore, we deconsolidated American Water’s<br />
net debt when we sold the company. It amounted to €4.2 billion at the end of 2008. Changes<br />
in foreign exchange rates caused debt to rise by €0.2 billion. Sterling lost ground to the euro averaged<br />
for the period under review. However, if one compares the exchange rates at the <strong>2009</strong> and<br />
2008 balance sheet dates, it gained on the euro.
<strong>2009</strong> in brief To <strong>our</strong> investors Review of operations Our responsibility<br />
Responsibility statement Consolidated financial statements Further information<br />
Financial position and net worth 83<br />
Net debt<br />
€ million<br />
Dec 31, 09 Dec 31, 08 +/–<br />
%<br />
Cash and cash equivalents 3,074 1,249 146.1<br />
Marketable securities 3,443 8,052 -57.2<br />
Other financial assets 3,247 4,832 -32.8<br />
Financial assets of continuing operations 9,764 14,133 -30.9<br />
Bonds, other notes payable, bank debt, commercial paper 17,707 11,839 49.6<br />
Other financial liabilities 2,439 1,644 48.4<br />
Financial liabilities of continuing operations 20,146 13,483 49.4<br />
Net financial debt of continuing operations 10,382 -650 –<br />
Provisions for pensions and similar obligations 3,281 2,738 19.8<br />
Surplus of plan assets over benefit obligations 79 – –<br />
Provisions for nuclear waste management 9,491 9,465 0.3<br />
Mining provisions 2,712 2,866 -5.4<br />
Net debt of continuing operations 25,787 14,419 78.8<br />
Net debt of discontinued operations – 4,240 –<br />
Net debt of the RWE Group 25,787 18,659 38.2<br />
Securing current A rating is top priority. Assessments of creditworthiness made by independent<br />
rating agencies have a substantial influence on a company’s options to raise capital. The better the<br />
rating, the easier it is to gain access to international capital markets and the better the conditions<br />
for debt financing. Therefore, we benefit from the fact that the two leading rating agencies, Moody’s<br />
and Standard & Poor’s, have given RWE high credit ratings. Their most recent ratings are A2 and A.<br />
They already take into account <strong>our</strong> acquisition of Essent. It had caused both agencies to review their<br />
ratings in <strong>2009</strong>. Standard & Poor’s confirmed <strong>our</strong> rating, but lowered the outlook from “stable” to<br />
“negative.” In November, Moody’s lowered <strong>our</strong> rating by one notch. Its outlook for RWE is also<br />
“negative.“ We aim to at least maintain <strong>our</strong> present ratings. The following table provides an overview<br />
of <strong>our</strong> credit ratings at the end of January 2010:<br />
Credit rating Moody’s Standard & Poor’s<br />
Long-term A2 / negative outlook A / negative outlook<br />
Short-term P-1 A-1
84 Financial position and net worth<br />
RWE Annual Report <strong>2009</strong><br />
Leverage factor up to 2.8. We manage <strong>our</strong> debt based on recognised parameters. One of the key<br />
figures is the ratio of net debt to EBITDA, which we refer to as the “leverage factor.” This key performance<br />
indicator is of more informational value than the debt total as it reflects the company’s<br />
earning power and, in turn, the company’s ability to service the debt. In February 2008, we set<br />
<strong>our</strong>selves the goal to keep <strong>our</strong> leverage factor between 2.8 and 3.4 from 2010 at the latest. In fiscal<br />
2008, it was 2.1. The acquisition of Essent and <strong>our</strong> capital expenditure programme caused it to rise<br />
to 2.8 in <strong>2009</strong>, which is within the targeted range. In 2010 and subsequent years, we want to orientate<br />
<strong>our</strong>selves towards an upper limit of 3.0. This is how we intend to safeguard <strong>our</strong> current rating.<br />
Cost of debt slightly higher. In <strong>2009</strong>, <strong>our</strong> cost of debt (including hedges) amounted to 4.9 % of the<br />
RWE Group’s average financial liabilities. This was marginally up on 2008 (4.6%). Our issuance of<br />
new bonds made a significant contribution to this. The average coupon for the bonds issued in the<br />
year under review was 4.9 %.<br />
Currency distribution of financial debt essentially unchanged. By the end of <strong>2009</strong>, <strong>our</strong> interestbearing<br />
financial debt totalled €18.1 billion. This was €5.6 billion more than in the preceding year.<br />
New issuances and bond redemptions added a net €6.2 billion. Including currency hedges, at the<br />
end of the year under review, 54 % of <strong>our</strong> financial debt was in euros, 37 % in Sterling and 5 % in<br />
US dollars.<br />
Cash flows from operating activities down on previous year due to special items. In fiscal <strong>2009</strong>, we<br />
generated €5,299 million in cash flows from operating activities. This was much less than in the prior<br />
year (€8,853 million). Special items were the main reason. Among other things, the cash we used to<br />
purchase CO 2 emissions allowances increased considerably. We had to buy a much greater quantity<br />
of certificates for 2008 because the framework conditions of European emissions trading became<br />
tighter. However, it was not until <strong>2009</strong> that this resulted in an additional burden to cash flows, as<br />
emissions allowances purchased for a certain calendar year are typically paid for at the beginning of<br />
the following one. The additional cash outflow amounted to €1,071 million. A special item in working<br />
capital also contributed to the drop in cash flows from operating activities. This is because we<br />
fixed the price for some of <strong>our</strong> electricity generation early on via forward sales on the EEX energy<br />
exchange. By concluding these types of hedges, we aim to limit the short-term infl uence of volatile<br />
commodity prices on <strong>our</strong> earnings. On the balance sheet date, the prices established in the forward<br />
contracts for large parts of this generation were higher than prices on the electricity market. Our<br />
contracting partners were required to provide us with payments to make up the difference<br />
(“variation margins”). Netting them with the variation margins paid by us results in a positive cash<br />
flow effect of €321 million. However, the net cash inflow of €1,753 million in 2008 was much higher.
<strong>2009</strong> in brief To <strong>our</strong> investors Review of operations Our responsibility<br />
Responsibility statement Consolidated financial statements Further information<br />
Financial position and net worth 85<br />
Cash flow statement<br />
€ million<br />
<strong>2009</strong> 2008 +/–<br />
%<br />
Cash flows from operating activities 5,299 8,853 -40.1<br />
of which: impact of the change in working capital -795 1,687 -147.1<br />
Cash flows from investing activities -8,326 -3,584 -132.3<br />
Cash flows from financing activities 4,839 -5,907 181.9<br />
Effects of changes in foreign exchange rates and other changes<br />
in value on cash and cash equivalents 13 -35 137.1<br />
Net changes in cash and cash equivalents 1,825 -673 371.2<br />
Cash flows from operating activities 5,299 8,853 -40.1<br />
Minus capital expenditure on property, plant and equipment and on intangible assets -5,913 -4,454 -32.8<br />
Free cash flow -614 4,399 -114.0<br />
Cash outflows for investing activities totalled €8,326 million. This is the sum by which <strong>our</strong> cash outflows<br />
for investing activities (including changes in cash investments) exceeded proceeds from the<br />
disposal of assets and the sale of companies. The single largest item was the acquisition of Essent.<br />
The purchase price paid was €7,574 million. Assumed cash and cash equivalents of €686 million must<br />
be deducted from this sum.<br />
Cash flows from financing activities amounted to €4,839 million. They primarily stem from the bond<br />
issuances in February and June <strong>2009</strong>, whereas the dividend payment had a counteracting effect.<br />
Cash and cash equivalents rose by €1,825 million in the year under review.<br />
Cash flows from operating activities, minus capital expenditure on property, plant and equipment,<br />
result in free cash flow, which amounted to -€614 million, and was much lower than in 2008<br />
(€4,399 million). The decrease in cash flows from operating activities and the significant rise in<br />
capital expenditure on property, plant and equipment were the reasons.
86 Financial position and net worth<br />
RWE Annual Report <strong>2009</strong><br />
Balance sheet structure Dec 31, <strong>2009</strong> Dec 31, 2008<br />
€ million % € million %<br />
Assets<br />
Non-current assets 56,563 60.5 41,763 44.7<br />
Intangible assets 17,320 18.5 11,202 12.0<br />
Property, plant and equipment 28,627 30.6 21,762 23.3<br />
Current assets 36,875 39.5 51,667 55.3<br />
Receivables and other assets 1 27,396 29.3 31,433 33.6<br />
Assets held for sale – – 8,710 9.3<br />
Total 93,438 100.0 93,430 100.0<br />
Equity and liabilities<br />
Equity 13,717 14.7 13,140 14.1<br />
Non-current liabilities 45,633 48.8 36,793 39.4<br />
Provisions 22,315 23.9 21,072 22.6<br />
Financial liabilities 17,019 18.2 11,154 11.9<br />
Current liabilities 34,088 36.5 43,497 46.5<br />
Other liabilities 2 25,132 26.9 28,769 30.8<br />
Liabilities held for sale – – 6,714 7.2<br />
Total 93,438 100.0 93,430 100.0<br />
1 Including financial accounts receivable, trade accounts receivable, and tax refund claims.<br />
2 Including trade accounts payable and income tax liabilities.<br />
Balance sheet structure: marginal improvement in the equity ratio. As of December 31, <strong>2009</strong>, the<br />
RWE Group’s balance sheet total amounted to €93.4 billion. This includes €15.9 billion from the<br />
acquisition of the Dutch energy utility Essent. The fact that <strong>our</strong> balance sheet total matched the<br />
previous year’s level nevertheless is in part due to the deconsolidation of American Water, which had<br />
an effect of €8.7 billion. Marketable securities were down by €4.4 billion. We sold some of them,<br />
mainly to finance the acquisition of Essent. Our financial accounts receivable from sureties (margins<br />
and collateral) declined by €1.5 billion, while derivative positions were down €2.3 billion. In contrast,<br />
changes in foreign exchange rates at the balance sheet date caused the balance sheet total to<br />
increase by €1.2 billion. Last fiscal year, the RWE Group’s equity ratio rose from 14.1 % to 14.7 %.<br />
Equity and non-current liabilities covered 105 % of <strong>our</strong> non-current assets at the balance sheet<br />
date — proof of RWE’s solid finance and capital structure.
<strong>2009</strong> in brief To <strong>our</strong> investors Review of operations Our responsibility<br />
Responsibility statement Consolidated financial statements Further information<br />
Notes to the financial statements of RWE AG 87<br />
1.8<br />
NOTES TO THE FINANCIAL STATEMENTS<br />
OF RWE AG (HOLDING COMPANY)<br />
RWE AG’s role in the Group. As the management holding company of the RWE Group, RWE AG<br />
handles central management tasks. Its economic situation is largely determined by the subsidiaries’<br />
activities.<br />
Financial statements. RWE AG prepares its financial statements in compliance with the rules set out<br />
in the German Commercial Code (HGB) and the German Stock Corporation Act (AktG). They are submitted<br />
to Bundesanzeiger Verlagsgesellschaft mbH, Cologne, Germany, the operator of the electronic<br />
Federal Gazette (Bundesanzeiger) and published in the electronic Bundesanzeiger. They can be ordered<br />
from us and are also available on the internet.<br />
Balance sheet of RWE AG (abridged)<br />
€ million<br />
Non-current assets<br />
Dec 31,<br />
<strong>2009</strong><br />
Dec 31,<br />
2008<br />
Financial assets 40,039 30,298<br />
Current assets<br />
Accounts receivable from affiliated companies 3,896 9,870<br />
Other accounts receivable and other assets 778 788<br />
Marketable securities and cash and cash equivalents 3,711 4,834<br />
Total assets 48,424 45,790<br />
Equity 9,453 9,416<br />
Provisions 7,360 7,341<br />
Accounts payable to affiliated companies 29,966 26,029<br />
Other liabilities 1,645 3,004<br />
Total equity and liabilities 48,424 45,790<br />
Income statement of RWE AG (abridged)<br />
€ million<br />
<strong>2009</strong> 2008<br />
Net income from financial assets 3,662 3,751<br />
Net interest -1,091 -961<br />
Other income and expenses 982 330<br />
Profit from ordinary activities 3,553 3,120<br />
Taxes on income -1,115 -285<br />
Net profit 2,438 2,835<br />
Profit carried forward 7 83<br />
Allocation to retained earnings -578 -510<br />
Distributable profit 1,867 2,408
88 Notes to the financial statements of RWE AG RWE Annual Report <strong>2009</strong><br />
Assets. The net worth of RWE AG is determined by the management of investments and the performance<br />
of management functions for the Group companies. The holding company holds the shares in<br />
the Group companies and performs financing functions for them. In the year under review, its assets<br />
were primarily affected by the merger with RWE Energy AG. Major effects resulted from the fact that<br />
RWE AG assumed financial assets and liabilities vis-à-vis other companies from RWE Energy, whereas<br />
its accounts receivable from RWE Energy were eliminated. The acquisition of Essent also affected<br />
RWE AG’s assets. The takeover was carried out via a subsidiary which received €3.8 billion in equity<br />
from us for this purpose. In the year being reviewed, a total of €4.7 billion in non-current and current<br />
securities were sold. Our non-current assets include 28.8 million of <strong>our</strong> own shares with a carrying<br />
amount of €2.0 billion.<br />
The €3.3 billion in provisions for pensions contained in the provisions include coverage for the vested<br />
benefits of RWE AG’s and its subsidiaries’ current and former employees. RWE AG was reimbursed<br />
for pension expenses by the companies concerned. This caused a corresponding reduction of income<br />
from investments.<br />
As of December 31, <strong>2009</strong>, RWE AG’s equity ratio was 19.5 %. It was slightly lower than in the preceding<br />
year (20.6%) although <strong>our</strong> equity base was essentially unchanged. This was because the balance<br />
sheet total increased. This resulted from the acquisition and financing of Essent as well as the merger<br />
with RWE Energy, among other things.<br />
Financial position. One of RWE AG’s key tasks is to procure funds for its subsidiaries’ ongoing business<br />
activities. The subsidiary RWE Finance B.V. handles most of the company’s external refinancing<br />
on the capital market by issuing bonds backed by RWE AG. In the financial year that just ended,<br />
these types of issuances had a substantial influence on RWE AG’s financial position. In a volatile<br />
capital market environment, we successfully placed three Eurobonds with a total nominal volume of<br />
€4.5 billion and two Sterling bonds with a total nominal volume of £1.5 billion in <strong>2009</strong>. The issuances<br />
were used to finance the acquisition of Essent, among other things. As of December 31, <strong>2009</strong>,<br />
RWE bonds and commercial paper outstanding amounted to €16.4 billion and €0.2 billion, respectively.<br />
The sale of the remaining shares in American Water also had a substantial impact on the<br />
financial position.<br />
Earnings position. RWE AG’s earnings are largely determined by the earnings generated by its<br />
subsidiaries. Income from financial assets, which was primarily contributed by RWE Power AG and<br />
the companies of the sales and distribution network business area, was nearly on a par year on year.<br />
Net interest deteriorated due to the aforementioned financing activity. In contrast, the “Other income<br />
and expenses” item improved substantially because we recognised write-ups on securities due<br />
to increases in value. Income taxes paid by subsidiaries were higher than in 2008. However, this also<br />
applies to the tax expense, in part due to the absence of one-off effects seen in the preceding year.
<strong>2009</strong> in brief To <strong>our</strong> investors Review of operations Our responsibility<br />
Responsibility statement Consolidated financial statements Further information<br />
Notes to the financial statements of RWE AG 89<br />
The Supervisory and Executive Boards of RWE AG will propose to the Annual General Meeting on<br />
April 22, 2010, that a dividend of €3.50 per share be paid for fiscal <strong>2009</strong>. Relative to the Group’s<br />
recurrent net income, this results in a payout ratio of 53 %. It is thus within the target range<br />
of 50 % to 60 %.<br />
Takeover provisions: disclosure in compliance with Secs. 315, Para. 4 and 289, Para. 4 of the<br />
German Commercial Code (HGB) and report of the Executive Board in accordance with<br />
Sec. 176, Para. 1, Sentence 1 of the German Stock Corporation Act (AktG). RWE AG’s subscribed<br />
capital remained unchanged, consisting of 523,405,000 no-par-value common shares in the name of<br />
the bearer (93.1 % of the subscribed capital) and 39,000,000 no-par-value preferred shares in the<br />
name of the bearer without voting rights (6.9% of the subscribed capital). The remaining rights and<br />
obligations are determined by the German Stock Corporation Act (AktG). Holders of non-voting preferred<br />
shares have a right to a preferred share of profits of €0.13 per share when the distributable<br />
profit is distributed. The composition of subscribed capital and, above all, the legal definition of the<br />
non-voting preferred shares issued by RWE are in compliance with the provisions of the law and of<br />
the Articles of Incorporation.<br />
In compliance with Sec. 21, Para. 1 of the German Securities Trading Act (WpHG), on December 21,<br />
2007, RW Energie-Beteiligungsgesellschaft mbH & Co. KG, Dortmund, informed us that it held<br />
16.089 % of RWE AG’s voting stock at the time.<br />
Executive Board members are appointed and dismissed in accordance with Secs. 84 et seq. of the<br />
German Stock Corporation Act (AktG) in connection with Sec. 31 of the German Co-Determination<br />
Act (MitbestG). Amendments to the Articles of Incorporation are made pursuant to Secs. 179 et<br />
seqq. in connection with Sec. 16, Para. 5 of the Articles of Incorporation of RWE AG. According to<br />
Sec. 16, Para. 5 of the Articles of Incorporation, unless otherwise provided for by law or in the Articles<br />
of Incorporation, the Annual General Meeting shall adopt all resolutions with a simple majority<br />
of the votes cast; in so far as a majority of the capital stock represented is required, the simple<br />
majority shall suffice. We thus made use of the legal possibility of determining a different capital<br />
ma jority for amendments to the Articles of Incorporation than prescribed by law. Amendments<br />
to the Articles of Incorporation that only concern the wording, without changing content, may be<br />
decided upon by the Supervisory Board (Sec. 10, Para. 9 of the Articles of Incorporation).<br />
Pursuant to the resolution passed by the Annual General Meeting on April 22, <strong>2009</strong>, the company<br />
was authorised to purchase shares of any class in RWE until October 21, 2010, totalling up to 10 % of<br />
the share capital. The purchase may be limited to shares of a single class. It is at the company’s discretion<br />
to purchase the shares on the stock market or by making a public call for shares. This can be<br />
done through the use of put or call options. The own shares may then be called in. If common shares<br />
are bought back, they can also be transferred to third parties within the scope of mergers or acquisitions,<br />
or sold in another manner. A sale not conducted on the stock exchange or via a tender to all<br />
shareholders may only be made in exchange for cash. Moreover, the price at the time of sale may not<br />
be significantly lower than the stock-market price for common shares bearing the same rights.
90 Notes to the financial statements of RWE AG RWE Annual Report <strong>2009</strong><br />
Common shares bought back may be used to redeem convertible and option bonds issued on the<br />
basis of the resolutions passed by the Annual General Meeting of April 22, <strong>2009</strong>. The authorisation<br />
may be exercised in full or in part and also for partial amounts.<br />
Pursuant to the resolution passed by the Annual General Meeting on April 22, <strong>2009</strong>, the Executive<br />
Board was authorised to issue option or convertible bonds until April 21, 2014. The bonds’ combined<br />
nominal value is limited at €6 billion. The shareholders’ subscription rights can be waived if the<br />
bonds are issued at a price in line with the market and the new shares do not account for more than<br />
10 % of the share capital. The Executive Board may also waive the shareholders’ subscription rights<br />
in order to avoid allocation of fractions of shares that would result from the subscription. This can<br />
also be done in order to offer the shares to holders of earlier convertible and option bonds in a<br />
number to which they would be entitled on conversion or exercise of the option as shareholders. Pursuant<br />
to Sec. 4, Para. 3a and 3b of the Articles of Incorporation, €143,975,680 in conditional capital,<br />
divided among 56,240,500 common shares in the name of the bearer, may be used to exercise convertible<br />
and option rights.<br />
Pursuant to Sec. 4, Para. 2 of the Articles of Incorporation, the Executive Board is authorised to increase<br />
the company’s capital stock with the Supervisory Board’s approval by up to €287,951,360<br />
until April 16, 2013, either at once or in several increments through the issuance of no-par-value<br />
common shares in the name of the bearer in exchange for contributions in cash or in kind (authorised<br />
capital). The shareholders’ subscription rights can be waived with the Supervisory Board’s approval,<br />
in order to avoid allocation of fractions of shares. The subscription rights can also be waived<br />
in order to issue shares in exchange for contributions in kind within the scope of mergers or for the<br />
purpose of acquiring stakes in companies. Subscription rights can also be waived in the event of a<br />
cash capital increase if the price at which the new shares are issued is not significantly lower than<br />
the price at which shares outstanding are traded on the stock market, and if the portion of the capital<br />
stock accounted for by the new shares, for which subscription rights are waived, does not exceed<br />
10 % in total. The Executive Board shall be empowered, subject to the consent of the Supervisory<br />
Board, to determine the further details and conditions of the share issuance. Shares from authorised<br />
capital are added to shares from conditional capital in cases where they are both issued waiving the<br />
shareholders’ subscription rights. In such cases, the capital stock may not be increased by more than<br />
20 % through the issuance of new shares.<br />
RWE AG’s syndicated credit lines have a change of control clause including the following main<br />
provisions: In the event of a change of control or majority at RWE, the lenders shall enter into negotiations<br />
with RWE on a continuation of the credit line. Should an agreement with the majority of the<br />
lenders not be reached within 30 days from such a change of control, the lenders have a special right<br />
of termination.
<strong>2009</strong> in brief To <strong>our</strong> investors Review of operations Our responsibility<br />
Responsibility statement Consolidated financial statements Further information<br />
Notes to the financial statements of RWE AG 91<br />
Executive Board members have a special right of termination in the event of a change of control. On<br />
execution of this special right of termination, Executive Board members receive a one-off payment in<br />
the amount of the compensation due until the end of the duration of the contract originally agreed,<br />
which shall correspond to at least twice their total contractual annual compensation and shall not<br />
correspond to more than three times their total contractual annual compensation. This is in line with<br />
the requirements of the German Corporate Governance Code. Dr. Jürgen Großmann was granted this<br />
special right of termination before the amendment to the German Corporate Governance Code,<br />
which took effect in 2008. On exercise of his special right of termination, he shall receive a one-off<br />
payment that covers all of the remuneration due until the expiry of his employment contract as well<br />
as the amount contractually agreed instead of a pension commitment.<br />
The 2005 long-term incentive plan (Beat) for the Executive Board and executives of RWE AG and of<br />
affiliated companies includes a provision for a change of control. In such events, all holders of<br />
performance shares under the Beat programme receive a compensatory payment. The amount of the<br />
compensatory payment is determined by multiplying the price paid for RWE shares as part of the<br />
takeover by the final number of performance shares as of the date of the takeover offer, in line with<br />
the plan conditions.<br />
The authorisation to conduct share buybacks, the authorised capital, the provision governing changes<br />
of control over the syndicated credit lines and the provisions effective in the event of a change<br />
of control in the Executive Board members’ contracts and in the 2005 long-term incentive plan (Beat)<br />
are in line with generally accepted German capital market standards.
92 Innovation RWE Annual Report <strong>2009</strong><br />
1.9<br />
INNOVATION<br />
Coal-fired power plants with carbon capture units, solar power from the desert, remote-controlled<br />
household appliances and electric vehicles have one thing in common: They are gentle on the<br />
climate. They could become a fixture in tomorrow’s energy landscape. Our research and development<br />
activities aim to contribute to this. After all, we feel a commitment to the goal of ensuring<br />
reliable and affordable energy supplies over the long term through innovative solutions.<br />
Research and development (R&D) is very important to RWE. We can only remain competitive over<br />
the long term if we continually invest in new technologies and refine existing ones. This is an area<br />
in which we greatly rely on <strong>our</strong> co-operation with partners in plant engineering and the chemical<br />
industry as well as research institutes. As a result, <strong>our</strong> activities are only partially reflected in the<br />
RWE Group’s figures. Last financial year, we spent €110 million on R&D, €5 million more than in<br />
2008. The main reason for this is that we included Essent’s R&D expenditure in the year under<br />
review. Three hundred and fifty of <strong>our</strong> employees were solely or partially dedicated to R&D work.<br />
This also represents an increase, in part due to the acquisition of Essent. Moreover, we initiated a<br />
series of new projects in <strong>2009</strong>.<br />
Research and development <strong>2009</strong> 2008 2007 2006 2005<br />
R&D costs € million 110 105 74 73 55<br />
R&D employees 350 330 270 273 223<br />
Climate protection drives the development of new electricity generation technologies. Our competitiveness<br />
depends on whether we succeed in bringing electricity generation based on fossil<br />
fuels — especially coal — in line with the goal of protecting the climate. One of the keys is the capture<br />
and storage of carbon dioxide when producing electricity. We plan to build a power plant in Hürth,<br />
near Cologne, Germany, in which coal is converted to a gaseous state, the CO 2 is captured, and the<br />
electricity is generated in gas and steam turbines. This is referred to as IGCC (Integrated Gasification<br />
Combined Cycle) technology, which captures roughly 90 % of the carbon dioxide contained in the<br />
flue gas. However, we are hardly making any progress with the project at present, because Germany<br />
still lacks a legal framework for subterranean CO 2 storage.<br />
Another method of producing climate-friendly electricity besides IGCC is the removal of carbon dioxide<br />
from flue gas (CO 2 scrubbing). The advantage of post-combustion CO 2 scrubbing is that many existing<br />
power plants can be retrofitted for this purpose. In August <strong>2009</strong>, RWE Power, BASF and Linde<br />
commissioned a pilot plant using this technology at the Niederaussem site in Germany. This is where<br />
we are testing a newly developed CO 2 scrubbing agent for large-scale application. Our objective is to<br />
put the method to commercial use by 2020. The REAplus project will benefit us in this area as well:<br />
In co-operation with Austrian Energy & Environment, an energy and environmental technology sys-
<strong>2009</strong> in brief To <strong>our</strong> investors Review of operations Our responsibility<br />
Responsibility statement Consolidated financial statements Further information<br />
Innovation 93<br />
tem supplier, we installed a highly effective flue gas desulphurisation unit, which began operating at<br />
the same location in July of <strong>2009</strong>. The idea is that the cleaner the flue gas, the better the capture of<br />
carbon dioxide.<br />
The fiscal year saw us give the go-ahead for yet another CO 2 scrubbing project. We will build a 3 MW<br />
pilot plant on the premises of <strong>our</strong> Aberthaw hard coal-fired power station in the UK in co-operation<br />
with Shell subsidiary Cansolv, which we will use to test scrubbing agents other than the ones being<br />
evaluated in Niederaussem. This will give us a number of technological options, all of which are being<br />
developed in competition to each other. In addition, RWE Power and RWE Dea are concerning<br />
themselves with the entire process, covering the capture, transport and storage of carbon dioxide,<br />
within the scope of a project in New Haven (Connecticut) USA. The partners are the US power utility<br />
American Electric Power (AEP) and the plant engineering company Alstom. Among other things,<br />
we are conducting research on a capture method based on ammonium, developed by Alstom. In<br />
October of <strong>2009</strong>, we activated a carbon capture system in a demonstration plant and began storing<br />
carbon dioxide underground at AEP’s Mountaineer site.<br />
Capturing and storing carbon dioxide reduces efficiency when generating electricity. This is one of<br />
the reasons we constantly work on increasing the efficiency of <strong>our</strong> power plants. The demonstration<br />
facility for drying lignite before the combustion process at <strong>our</strong> Niederaussem site, commissioned in<br />
February <strong>2009</strong>, is one of the activities serving this purpose. The method used here — fluidised bed<br />
drying with internal waste heat utilisation — improves the efficiency of lignite-based electricity production<br />
by some f<strong>our</strong> percentage points. RWE developed this technology and had it patented. We<br />
have already sold a licence to an Australian buyer.<br />
Desertec initiative: electricity from the desert for Europe. Besides enlarging <strong>our</strong> generation footprint<br />
based on established technologies, <strong>our</strong> strategy in the field of renewable energy also encompasses<br />
in-house research and development work as well as the construction of demonstration plants.<br />
Moreover, we acquire stakes in young companies developing promising technologies. Large-scale<br />
projects involving partners are also conceivable. In October of <strong>2009</strong>, for instance, we established<br />
the Desertec Industrial Initiative (Dii) with eleven companies. Dii’s objective is to develop framework<br />
conditions for investments required to supply Europe, the Middle East and North Africa with<br />
large amounts of solar and wind power. If the project progresses successfully, North African generation<br />
capacity may suffice to cover approximately 15 % of Europe’s demand for electricity in 2050.<br />
Solar thermal power plants are intended to play a key role in this. They bundle sunlight using mirrors<br />
to heat up special oil, and use this heat to produce vap<strong>our</strong> to drive turbines. The project partners are<br />
working on feasibility studies, proposals for reference projects, and an implementation plan for the<br />
overall concept.
94 Innovation RWE Annual Report <strong>2009</strong><br />
New approaches to electricity storage and networks. Expanding installed renewable energy capacity<br />
poses new challenges for power utilities in many respects. In future, electricity feed-ins will fluctuate<br />
more and more. Therefore, it is important to develop new efficient storage concepts early on.<br />
Against this backdrop, RWE Power is working with the German Aerospace Centre as well as General<br />
Electric Group and Züblin to develop a highly efficient pressurised-air storage facility. When electricity<br />
supply is high, air is compressed and forced into subterranean cavities where it is stored. This<br />
compressed air can be used to generate electricity when needed. A major challenge faced by this<br />
project is to develop components enabling the high levels of efficiency of pressurised-air storage<br />
power plants, especially for the compressor and heat storage sections.<br />
The expansion of the renewable energy footprint is making the demands placed on electricity networks<br />
more complex. <strong>For</strong> example, the rising number of small, distributed generation units causes<br />
substantial shifts in the load conditions of low and medium-voltage networks. In July of <strong>2009</strong>, we<br />
launched the “Grids for the Power Supply of the Future” project with Dortmund Technical University,<br />
ABB and Consentec GmbH which analyses the new requirements that network have to fulfil. The<br />
objective is to use this as a basis for developing viable concepts for solutions for maintaining <strong>our</strong><br />
networks’ high levels of functionality and profitability.<br />
Energy efficiency in living and mobility. Efficiency is not sought after only in generating energy, but<br />
also in its use. Established as of July 1, <strong>2009</strong>, RWE Effizienz GmbH wants to help make consumer<br />
behavi<strong>our</strong> more thrifty through new product and consulting offerings. In December of <strong>2009</strong>, the<br />
company started working with the north German electronics specialist ELV/eQ-3. The aim is to create<br />
systems for making efficient use of electricity and heat in homes marketable. These systems will be<br />
designed to enable the user-friendly control of heating, light and household appliances.<br />
Electric vehicles are another promising field of R&D we have tapped into. RWE has already begun to<br />
set up intelligent infrastructure in Germany. By this undertaking, we aim to build a network of charging<br />
stations that will initially cover catchment areas, combined with a billing system, enabling people<br />
to recharge their vehicles quickly and conveniently. We have developed a large share of the required<br />
systems <strong>our</strong>selves. At present, we are testing them in regional pilot projects with Daimler (Berlin)<br />
and Renault (North Rhine-Westphalia). Technical aspects are not the only focal point. We also intend<br />
to gain knowledge of customer acceptance.<br />
The future of energy supply after 2030. Energy efficiency, res<strong>our</strong>ce conservation, security of supply<br />
and climate protection are goals that will also be faced by future generations. Anyone working on<br />
tomorrow’s concepts like RWE must also think about the day after. We are looking at possible roads<br />
to the future of energy supply beyond 2030 on the basis of numerous studies. This involves examining<br />
all conceivable technologies and assessing them, especially with regard to cost as well as their<br />
contributions to climate protection and security of supply. Results obtained from <strong>our</strong> analyses for<br />
Germany and the UK so far give us a basis for discussing the whole picture of the future of energy,<br />
which also serves as a foundation for making decisions concerning the composition of <strong>our</strong> R&D portfolio<br />
going forward.
<strong>2009</strong> in brief To <strong>our</strong> investors Review of operations Our responsibility<br />
Responsibility statement Consolidated financial statements Further information<br />
Development of risks and opportunities 95<br />
1.10 DEVELOPMENT OF RISKS AND OPPORTUNITIES<br />
As a company with international operations, RWE is exposed to a number of risks. In <strong>our</strong> view,<br />
systematically recording, assessing and controlling them are key elements of sound company<br />
management. At the same time, opportunities must be identified and taken advantage of. Our risk<br />
policy aims to increase the company’s value without taking on risks that are unreasonably high.<br />
This approach has proven itself, especially in the economic crisis.<br />
Organisation of risk management in the RWE Group. Responsibility for the groupwide risk management<br />
system sits with the Executive Board of RWE AG. It establishes the rules and minimum<br />
standards, defines the caps for the aggregated market and credit risks and takes decisions on transactions<br />
that can result in substantial risks. The corporate “Group Risk Management” department<br />
reports directly to the Chief Financial Officer and exercises control and co-ordination functions. Its<br />
tasks include developing groupwide specifications for methods and processes, regular reporting, and<br />
monitoring risks. It derives limits for the operating companies’ commodity and credit risks from the<br />
risk caps determined by the Executive Board.<br />
Risks in financial reporting are monitored by RWE AG’s “Group Accounting” corporate department.<br />
This department also reports directly to the CFO. It uses an internal control system, which is described<br />
in detail on pages 102 et seqq. We also take compliance risks very seriously. Monitoring and<br />
controlling them is the responsibility of the “Compliance” corporate department. It reports to the<br />
CEO and President of RWE AG and, if members of the Executive Board are affected, also directly to<br />
the Chairman of the Supervisory Board and the Chairman of the Audit Committee. Our Group companies<br />
ensure the uniform implementation of the groupwide risk management guidelines under the<br />
specialist supervision of the aforementioned corporate departments.<br />
In addition, the following committees handle corporate operative risk management tasks:<br />
• Risk Committee: This body handles the tracking and monitoring of commodity price risks and<br />
credit risks arising from trading, sales and purchasing activities. This ensures close monitoring of<br />
those risks that are pivotal to us. The CFO of RWE AG is the Chairman of the Risk Committee. He is<br />
supported by the heads of the following corporate departments: Group Risk Management, Group<br />
Finance and Value Chain Management. The CFOs and/or the managing directors in charge of<br />
finance at RWE Dea, Essent, RWE Innogy, RWE npower, RWE Power, RWE Supply & Trading,<br />
RWE Transgas and RWE Vertrieb also sit on the Risk Committee. They ensure uniform compliance<br />
with groupwide commodity and credit risk management directives. They are assisted in this by<br />
their companies’ risk controlling departments, which are separated from the operating units in<br />
organi sational terms.
96 Development of risks and opportunities RWE Annual Report <strong>2009</strong><br />
• Risk Management Committee: This body is responsible for monitoring and refining the risk<br />
management system. It is composed of the heads of RWE AG’s following corporate departments:<br />
Compliance, Controlling, Finance, Legal / Board Affairs, Accounting, Risk Management, Audit,<br />
Strategy and Insurance. The Risk Management Committee is chaired by the head of the Group<br />
Risk Management Department.<br />
• Asset Management Committee: It defines, among other things, the long-term financial asset<br />
strategy, taking the earnings prospects and risks into account. This includes selecting suitable asset<br />
classes (bonds, stocks, etc.) and the allocation of the company’s funds to the individual asset<br />
categories. This committee’s members are the CFO of RWE AG, the head of corporate finance and<br />
the CFOs of RWE Power, RWE Dea, RWE npower, LEW, enviaM and Süwag.<br />
Risk management as a continuous process: Risk management has been integrated into <strong>our</strong> operating<br />
workflow as a continuous process. In the RWE Group, risks and opportunities are identified<br />
and classified early on. We evaluate risks according to their probability of occurrence and damage<br />
potential and aggregate them at the Group company level and at the Group level. Risk monitoring<br />
covers the medium-term planning horizon. However, it may extend beyond that for material strategic<br />
risks. Risks that share the same cause are aggregated to one position. If a risk can be reduced, the<br />
residual risk is reported together with the countermeasures already taken. A risk’s damage potential<br />
is defined in relation to the operating result and equity of the business unit concerned and the<br />
Group as a whole. Risks with a high probability of occurrence or damage potential are mitigated by<br />
taking operational measures. Where necessary, we account for them by taking precautionary steps<br />
on the balance sheet, e.g. provisions. We evaluate and manage opportunities as part of <strong>our</strong> regular<br />
planning process.<br />
We prepare standardised reports on <strong>our</strong> risks and opportunities for <strong>our</strong> management and supervisory<br />
committees on a quarterly basis. The Executive Board of RWE AG is immediately informed of unforeseen<br />
material changes to the risk situation. Our Group Audit Department regularly appraises the<br />
quality and functionality of <strong>our</strong> risk management system. However, it is impossible to guarantee<br />
absolute security with respect to the identification and management of risks or the effectiveness of<br />
the controls. This is an area where we are limited by potential human error.<br />
Overall assessment of the risk and opportunity situation by executive management. The markets<br />
in which we are primarily active are among the most politically and economically stable in the world.<br />
But, even here, we are exposed to substantial risks. As a utility, we plan <strong>our</strong> investments decades in<br />
advance. We are therefore especially dependent on reliable political framework conditions in the energy<br />
sector. However, they harb<strong>our</strong> substantial uncertainty in some respects, such as the future of<br />
nuclear energy in Germany, European trading of CO 2 emission allowances, and legal issues concern-
<strong>2009</strong> in brief To <strong>our</strong> investors Review of operations Our responsibility<br />
Responsibility statement Consolidated financial statements Further information<br />
Development of risks and opportunities 97<br />
ing the approval of power plant new builds. These topics currently demand a lot of <strong>our</strong> attention.<br />
We believe this is associated with both risks and opportunities. In addition to energy policy, the<br />
economy’s development has lasting effects on <strong>our</strong> earning power. If the economic slump persists,<br />
it will cause demand for energy to drop. Furthermore, there is a threat of counterparty defaults.<br />
We would be affected above all if electricity and gas prices remained low for years. We largely sell<br />
<strong>our</strong> electricity generation and gas purchasing volumes forward, in order to limit the earnings risks<br />
arising from the short-term volatility of prices. In Germany, we have sold forward almost all of <strong>our</strong><br />
generation for 2010 and over 70 % of <strong>our</strong> generation for 2011 (as of January 31, 2010). Our gas<br />
purchases have been fully hedged for 2010 and partially hedged for 2011. Given the lower level of<br />
commodity prices at present, pressure on prices is also increasing in the sales business. This gives<br />
rise to the risk of declining margins and customer losses. Counterparty defaults have been moderate<br />
so far. The current economic situation also provides opportunities for us. <strong>For</strong> instance, RWE continues<br />
to be considered a safe bond issuer and is thus in a position to finance projects, the implementation<br />
of which has become much more difficult for other companies. Further opportunities arise from<br />
the lower prices of capital goods such as power plant components — above all in the field of renewable<br />
energy. Overall, the risk structure of <strong>our</strong> business has not changed. At present, there are no identifiable<br />
risks that jeopardise the continued operation of RWE AG or the RWE Group.<br />
Major risk and opportunity categories. The following illustrates the risks and opportunities which<br />
may have a substantial impact on <strong>our</strong> asset, financial and earnings positions. They can be divided<br />
among the following categories:<br />
• Risks and opportunities arising from the volatility of commodity prices: The development of<br />
prices on commodity markets greatly influences <strong>our</strong> earnings, especially in the field of electricity<br />
generation. <strong>For</strong> example, decreasing electricity prices or rising fuel costs may lead to a decline in<br />
generation margin contributions. However, opportunities arise from counteracting price trends. In<br />
<strong>our</strong> upstream business, changes in the market price of oil and gas can influence <strong>our</strong> earnings. Another<br />
area exposed to risk is the sales business. This is partly because it is possible that increasing<br />
procurement costs may not be fully passed through to end-customer prices, or because changes in<br />
temperature may lead to unexpected fluctuation in demand. We assess the price risks to which we<br />
are exposed on the procurement and sales markets taking account of current forward prices and<br />
expected price volatility. Commodity and credit risks faced by generation and sales companies are<br />
managed by following hedging rules established by RWE AG in its role as holding company. In the<br />
generation business, we limit risks by selling most of <strong>our</strong> electricity early on, via forward contracts,<br />
and hedging the price of fuels and emissions certificates in line with the electricity sales.
98 Development of risks and opportunities RWE Annual Report <strong>2009</strong><br />
RWE Supply & Trading plays a central role when it comes to managing commodity price risks. The<br />
company is the RWE Group’s interface to the world’s wholesale markets for energy and energy<br />
commodities. It markets large portions of the Group’s generation position and purchases the<br />
fossil fuels and CO 2 emissions certificates needed to produce electricity. Through its role as internal<br />
transaction partner, it limits the earnings risks stemming from price swings on energy<br />
markets for the generation and sales businesses, thus creating a stable basis of calculation.<br />
RWE Supply & Trading thus pools the risk and value added from commodity transactions for the<br />
Group and pools the expertise for these transactions centrally. RWE Supply & Trading also uses<br />
commodity derivatives based on contracts that are settled physically (delivery) and financially<br />
(cash settlement) to minimise risk in the procurement and sales businesses. The trading activities<br />
are not exclusively oriented towards reducing risks. RWE Supply & Trading undertakes proprietary<br />
trading in adherence with limits, in order to make use of changes in prices on energy markets.<br />
The RWE Group’s risk management system for energy trading is firmly aligned with best practice<br />
as applied to the trading transactions of banks. Transactions are concluded with third parties only<br />
if certain credit risk limits can be complied with. Groupwide guidelines provide structures and<br />
processes for the treatment of commodity risks and associated credit risks with respect to third<br />
parties and within the Group. The commodity price risks in <strong>our</strong> subsidiaries are constantly monitored<br />
and reported to the responsible bodies, including the Risk Committee of RWE AG. Furthermore, the<br />
Executive Board of RWE AG is kept informed of <strong>our</strong> consolidated commodity risk positions by way<br />
of quarterly reports. The Group companies inform Group Risk Management about their positions,<br />
and the corporate department consolidates them. This procedure is not followed for market risks<br />
arising in connection with the pure trades conducted by RWE Supply & Trading. Such risks are<br />
stated separately.<br />
The upper risk limits in the energy trading business are set and constantly monitored by the Executive<br />
Board of RWE AG. Among other things, we calculate the Value at Risk (VaR) to quantify price<br />
risks. The central risk controlling parameter is the Global VaR, which limits trading activities of<br />
RWE Supply & Trading and may not exceed €40 million. In principle, the VaR figures within the<br />
RWE Group are based on a confidence interval of 95 % and a holding period of one day. This means<br />
that, with a probability of 95 %, the maximum daily loss does not exceed the Global VaR. In fiscal<br />
<strong>2009</strong>, RWE Supply & Trading’s Global VaR averaged €14.0 million, and the daily maximum was<br />
€21.1 million. However, <strong>our</strong> risk analysis is not only based on the amount of VaR. We also constantly<br />
factor extreme scenarios into stress tests, determine the influence they can have on liquidity and<br />
earnings, and take countermeasures whenever the risks are too high.
<strong>2009</strong> in brief To <strong>our</strong> investors Review of operations Our responsibility<br />
Responsibility statement Consolidated financial statements Further information<br />
Development of risks and opportunities 99<br />
• Financial risks and opportunities: The volatility of foreign exchange rates, interest rates and share<br />
prices can also have a significant effect on <strong>our</strong> earnings. The management of financial risks is<br />
governed by a specific guideline and is the responsibility of the CFO of RWE AG. As explained<br />
earlier, the Asset Management Committee manages risks arising from investments in securities.<br />
At the RWE AG level, the Financial Controlling Department handles the operational implementation<br />
of the financial risk management system. It is also responsible for reporting on this risk category.<br />
Due to <strong>our</strong> international activities, currency risk management is very important. Group companies<br />
are obliged to hedge currency risks via RWE AG. The parent company determines the net financial<br />
position for each currency and hedges it with external market partners if necessary. The VaR concept<br />
is one of the tools used to measure and limit risk. In the year under review, the average VaR<br />
for RWE AG’s foreign currency position was less than €1 million.<br />
Significant importance is also given to the management of interest rate risks. They primarily relate<br />
to <strong>our</strong> interest-bearing investments and financial debt. Negative changes in value caused by unexpected<br />
interest rate movements are hedged with non-derivative and derivative financial instruments.<br />
In fiscal <strong>2009</strong>, the average VaR (including hedges) was €168 million for <strong>our</strong> financial debt<br />
and €21 million for interest-bearing investments. Furthermore, we are exposed to risks associated<br />
with fluctuation in share prices. The average VaR (including hedges) for this risk was €21 million.<br />
Risks and opportunities from changes in the value of securities are controlled by a professional<br />
fund management system. The Group’s financial transactions are recorded centrally using special<br />
software and monitored by RWE AG. This enables the balancing of risks across individual companies.<br />
Range of action, responsibilities and controls are set out in internal guidelines, to which <strong>our</strong><br />
Group companies are obliged to adhere.<br />
• Creditworthiness of business partners: Our business relations with financial institutions, trading<br />
partners, <strong>customers</strong> and suppliers expose us to credit risks, especially in the current economic<br />
crisis. We counter them in part by closely tracking the creditworthiness of <strong>our</strong> counterparties.<br />
Credit risk management is governed by a dedicated guideline which is valid throughout the Group.<br />
The Risk Committee is in charge of monitoring credit risks. Its operating requirements are implemented<br />
by risk controlling units at RWE AG and at the Group companies.<br />
We manage credit risks by setting limits and by adjusting them on a timely basis, especially in the<br />
event of changes in creditworthiness. If necessary, we request cash collateral or bank guarantees.<br />
We also take out credit insurance policies insofar as economically feasible. In the financial and energy<br />
trading activities, we conclude credit transactions largely with banks and trading partners of
100 Development of risks and opportunities RWE Annual Report <strong>2009</strong><br />
good creditworthiness. We determine their credit standing using an internal assessment method.<br />
<strong>For</strong> banks, we use external ratings and an early warning indicator, which we developed in light of<br />
the financial market crisis. We sell a significant portion of <strong>our</strong> electricity generation on the exchange.<br />
The credit risk for these sales is assumed by a clearing unit. As a rule, over-the-counter<br />
trading transactions are concluded on the basis of framework agreements, e.g., those prescribed<br />
by the European Federation of Energy Traders (EFET). In addition, we agree on collateral.<br />
We measure the credit risks of the energy trading and financial activities on a daily basis.<br />
• Liquidity risk: Liquidity risks consist of the danger of <strong>our</strong> liquidity reserves no longer being suffi -<br />
cient to meet financial obligations in a timely manner. At RWE, such obligations result above all<br />
from the refinancing of due financial liabilities. Furthermore, we must put up collateral if trading<br />
contracts (e.g. with exchanges) marked to market result in a loss. Despite the sustained economic<br />
crisis, we classify <strong>our</strong> liqui dity risk as low. The basis for this is <strong>our</strong> solid financing: We have strong<br />
cash flows from operating activities, substantial cash and cash equivalents, unused credit lines,<br />
and further financial latitude through <strong>our</strong> Commercial Paper and Debt Issuance Programmes (see<br />
page 81). Our careful planning ensures that we are liquid at all times.<br />
• Risks and opportunities associated with corporate strategy: Decisions on capital expenditure<br />
on property, plant and equipment and acquisitions are associated with serious risks and opportunities,<br />
due to the amount of capital employed and the fact that it is tied up long term. When a<br />
company is acquired, problems can arise in relation to the integration of employees, processes and<br />
technologies. RWE has specific accountability provisions and approval processes in place to prepare<br />
and implement strategic decisions concerning capital expenditure on property, plant and<br />
equipment and acquisitions, as is the case with the acquisition and integration of Essent. Closely<br />
monitoring both <strong>our</strong> markets and competitors helps us record strategic risks and opportunities<br />
adequately and early on.<br />
• Continuity of business activities: We operate technologically complex and interconnected production<br />
plants in all parts of <strong>our</strong> value chain. Uninsured damage can be incurred by <strong>our</strong> lignite mining<br />
equipment, power stations, power plant components and grids. There is an increasing risk of outages<br />
in <strong>our</strong> power plants due to the ageing of their components. In addition, the construction of<br />
new plants can be delayed due to accidents, faulty material or time-consuming approval procedures.<br />
Our grid business is exposed to the risk of facilities being damaged by force majeure such<br />
as severe weather conditions. We limit these risks through high safety standards as well as regular<br />
audit, maintenance and servicing work. If appropriate, we take out insurance policies.
<strong>2009</strong> in brief To <strong>our</strong> investors Review of operations Our responsibility<br />
Responsibility statement Consolidated financial statements Further information<br />
Development of risks and opportunities 101<br />
• Regulation: The RWE Group’s exposure to the constant change in the political, legal and social<br />
environment in which it does business can be expected to have a substantial impact on earnings.<br />
Lignite and hard coal power plants account for a significant portion of <strong>our</strong> electricity generation<br />
portfolio. This represents a substantial risk due to the EU-wide CO 2 emissions trading system. Risks<br />
can arise above all from increases in the cost of procuring CO 2 certificates. In December 2008, the<br />
EU member states agreed that the Western European electricity sector will hardly be allocated any<br />
free certificates from 2013 onwards. This will cause <strong>our</strong> CO 2 costs to be much higher than in the<br />
current trading period, which will last until 2012. We intend to continue reducing emissions and<br />
make <strong>our</strong> power generation portfolio more flexible through <strong>our</strong> investment programme. Furthermore,<br />
we limit CO 2 risks through climate-protection projects in developing and newly industrialising<br />
countries within the scope of the Kyoto Clean Development Mechanism and Joint Implementation<br />
programme.<br />
In Germany, risks also arise from the monitoring of anti-competitive pricing practices, the legal<br />
framework of which became stricter at the end of 2007. The German Federal Cartel Office has been<br />
reviewing the energy wholesale sector and pricing in the fields of electricity, gas and district heat<br />
supply since the spring of <strong>2009</strong>. This also affects certain RWE companies.<br />
The incentive-based regulation of <strong>our</strong> German electricity and gas network companies in effect<br />
since <strong>2009</strong> is also associated with earnings risks. Uncertainty exists for example regarding the recognition<br />
of costs incurred to procure electricity to compensate for transmission losses. We intend<br />
to limit the effects of regulation on <strong>our</strong> earnings by taking measures to cut costs and enhance<br />
efficiency.<br />
• IT security: Our business processes are supported by efficient data processing systems. Nevertheless,<br />
we cannot rule out a lack of availability of IT infrastructure or of the security of <strong>our</strong> data. We<br />
mitigate these risks by regularly investing in hardware and software, applying high security standards<br />
as well as raising user awareness and limiting access privileges. Our IT is largely based on<br />
standards common in the market. Its operations are run in modern data centres. We manage IT<br />
risks during the development of IT solutions designed to support business processes with a mandatory<br />
groupwide process for engineering and managing IT projects.<br />
• Human res<strong>our</strong>ces: Competition for the best talent is becoming increasingly fierce. To secure and<br />
strengthen <strong>our</strong> position in this area, when recruiting staff, we highlight RWE’s attractiveness as an<br />
employer and strive to retain experts and executives over the long term. In addition to performance-based<br />
compensation and progressive employee benefits, we put a lot of effort into the varied<br />
prospects offered throughout the RWE Group: trainee programmes, cross-disciplinary career paths,
102 Development of risks and opportunities RWE Annual Report <strong>2009</strong><br />
assignments in various European Group companies as well as attractive continued education and<br />
advanced training offerings. We limit staff fluctuation risks by ensuring suitable replacements are<br />
in place and by planning for successors early on.<br />
• Legal procedures: Individual RWE Group companies are involved in litigation and arbitration<br />
proceedings due to their operations or sale of companies, or out-of-c<strong>our</strong>t claims have been fi led<br />
against some of them. However, we do not expect any major negative repercussions on the<br />
RWE Group’s economic or financial position. Furthermore, Group companies are directly involved<br />
in various procedures with public authorities or are at least affected by their results.<br />
Raw materials production and power generation activities might be curtailed by risks arising from<br />
approval processes for <strong>our</strong> opencast mines and nuclear power plants. Furthermore, there is a risk<br />
of financial loss when capital is spent on power plant new builds before all of the constructionrelated<br />
decisions have been taken by the public authorities. We take precautionary measures<br />
against this by preparing <strong>our</strong> applications for approval with great care and ensuring that approval<br />
processes are handled competently.<br />
Conciliation proceedings in connection with the legal restructuring of companies are currently<br />
pending. They were initiated by outside shareholders in order to examine the appropriateness of<br />
the conversion ratios and/or the amount of cash paid in compensation. In <strong>our</strong> opinion, associated<br />
risks are low, as these figures were calculated by independent experts. If different legally enforceable<br />
decisions are reached, we will pay a cash compensation to the affected shareholders, including<br />
those who are not directly involved in the conciliation proceedings.<br />
Report on the Internal Control and Risk Management System – statements in accordance with<br />
Sec. 315, Para. 2, No. 5 and Sec. 289, Para. 5 of the German Commercial Code (HGB): Risks associated<br />
with financial reporting reflect the fact that <strong>our</strong> annual and interim financial statements may<br />
contain misrepresentations that may have a significant influence on the decisions made by their<br />
addressees. Our accounting-based internal controlling system (ICS) aims to detect potential s<strong>our</strong>ces<br />
of error and limit the resulting risks. It covers the financial reporting of the entire RWE Group.<br />
This enables us to ensure with sufficient certainty that the parent company and consolidated financial<br />
statements are prepared in compliance with statutory regulations.<br />
The design of the accounting-related ICS largely mirrors the organisation of <strong>our</strong> accounting and<br />
financial reporting process. One of the main features of this process is the control over the entire<br />
Group and its operating units. The basis is provided by the target parameters determined by the<br />
Executive Board of RWE AG. Building on them and <strong>our</strong> expectations concerning the operating<br />
trend, we develop <strong>our</strong> medium-term budget once a year. It includes the following fiscal year’s figures<br />
as well as the figures planned for subsequent years. We prepare forecasts in line with the
<strong>2009</strong> in brief To <strong>our</strong> investors Review of operations Our responsibility<br />
Responsibility statement Consolidated financial statements Further information<br />
Development of risks and opportunities 103<br />
budget for financial years underway. The Executive Board of RWE AG and the management boards<br />
of its major subsidiaries convene once a quarter in order to evaluate the interim and annual financial<br />
statements and update the forecasts.<br />
Accounting is mostly handled locally. Occasionally, this function is performed by Group companies<br />
as a service to their subsidiaries. Certain processing tasks such as payroll accounting are pooled at<br />
internal service providers like RWE Service GmbH or are at least subject to uniform groupwide<br />
quality standards. As holding company, RWE AG performs central accounting tasks. These include<br />
the consolidation of figures, the accounting treatment of provisions for pensions in Germany, and<br />
goodwill impairment tests. RWE AG is also in charge of tasks relating to the management and monitoring<br />
of financial instruments, money transactions, cash investments and tax group accounting.<br />
External service providers are commissioned in certain cases.<br />
The CEOs and CFOs or the managing directors of major subsidiaries as well as select RWE AG department<br />
heads must take an internal balance-sheet oath for external half and full-year reporting.<br />
Only once all of the internal balance-sheet oaths have been taken do the members of the Executive<br />
Board of RWE AG take an external half and full-year balance-sheet oath and sign the responsibility<br />
statement. Thereby, they confirm that the prescribed accounting standards and the RWE Group’s<br />
accounting guidelines have been adhered to and that the figures give a true and fair view of the net<br />
assets, financial position and results of operations. In addition, the effectiveness of the ICS is confirmed<br />
at the end of the year.<br />
We prepare <strong>our</strong> financial statements using a groupwide reporting system that we also use to prepare<br />
the budgets and forecasts. All fully consolidated subsidiaries use this system. It forms the basis<br />
for a standardised data reporting process within the Group. The financial accounting systems<br />
are largely maintained by RWE Service GmbH.<br />
We identify risks in financial reporting at the divisional level on the basis of quantitative, qualitative<br />
and process-related criteria. The foundations of the ICS are <strong>our</strong> generally binding guidelines<br />
and ethical values, which are also set forth in RWE’s Code of Conduct. Building on this, the<br />
minimum requirements of the major processing steps ensure the integrity of data collection and<br />
management. The risks of individual balance-sheet items resulting from subjective discretion or<br />
complex transactions are recorded in a groupwide risk and control matrix. Once a year, we use a<br />
control process introduced in <strong>2009</strong> to determine whether the necessary control measures have<br />
actually been implemented and carried out properly. This is done by external auditors, the internal<br />
Audit Department, or the management in charge of performing the controls.
104 Development of risks and opportunities RWE Annual Report <strong>2009</strong><br />
When in session, the Audit Committee of the Supervisory Board regularly concerns itself with the<br />
effectiveness of the accounting-related ICS. Once a year, the CFO of RWE AG holds a presentation<br />
on the risks of financial reporting to this committee. He also explains which control measures were<br />
taken and how the proper implementation of the controls was verified.<br />
Our Group Audit Department is certified to the International Standards for the Professional Practice<br />
of Internal Auditing of the Institute of Internal Auditors (IIA). In organisational and disciplinary<br />
matters, it reports directly to the CEO.<br />
Corporate Governance Declaration in accordance with Sec. 289a of the German Commercial<br />
Code (HGB): The Executive Board of RWE Aktiengesellschaft issued a corporate governance<br />
statement in accordance with Sec. 289a of the German Commercial Code on February 12, 2010<br />
and made it accessible to the general public on the internet at www.rwe.com/corporategovernance-declaration-sec-289a-HGB.
<strong>2009</strong> in brief To <strong>our</strong> investors Review of operations Our responsibility<br />
Responsibility statement Consolidated financial statements Further information<br />
Outlook for 2010 105<br />
1.11 OUTLOOK FOR 2010<br />
The economy will only recover slowly. Nevertheless, we are confident that the RWE Group will continue<br />
to improve earnings from operations in 2010. Our operating result is expected to rise by<br />
around 5 %. We are optimistic in relation to the coming years as well. This also applies to 2013: We<br />
anticipate that <strong>our</strong> earnings will be better then, compared to <strong>2009</strong>, despite the substantial burdens<br />
added by emissions trading.<br />
Economy picks up again. The economy’s slight recovery witnessed since the middle of <strong>2009</strong> is likely<br />
to continue this year. However, setbacks are still conceivable. Based on initial forecasts, global economic<br />
output in 2010 will be more than 2 % higher than last year. We estimate that in the Eurozone,<br />
it will grow by less than 2 %. Stimulus originally provided by state economic packages is fading. Furthermore,<br />
banks are maintaining their restrictive lending policies. Investing activity will also be moderate,<br />
given the industry’s persistently low capacity utilisation. Germany’s economy may achieve a<br />
growth rate of up to 2 % in 2010. However, gross domestic product (GDP) will return to its 2008 level<br />
no earlier than 2012. Germany’s strong dependency on exports may prove to be a pillar of the economy<br />
in 2010, owing to rising foreign demand. We anticipate that Dutch GDP will grow by more than<br />
1 % and Belgian GDP will advance by about 1 %. The effects of the crisis are expected to be felt for<br />
quite some time in the United Kingdom. Consumer spending in the UK is likely to stagnate due to<br />
the substantial devaluation of assets resulting from the real estate crisis and mounting unemployment.<br />
Furthermore, the tight situation in the banking sector will probably hinder the financing of investments<br />
over the long term. In 2010, UK GDP is expected to grow by roughly 1 %. Initial estimates<br />
for <strong>our</strong> key markets in Central Eastern Europe paint an inhomogeneous picture. Expansion is forecast<br />
to be moderate in Poland (+2.7 %), the Czech Republic (+1.5 %) and Slovakia (+2.1%), whereas Hungary’s<br />
economy is set to continue shrinking in 2010 (-0.2%).<br />
Rapid recovery of energy consumption not in sight. The expected marginal economic recovery will<br />
have a positive effect on demand for energy. As regards electricity, however, we anticipate very little<br />
growth. Production by energy-intensive industries will remain curtailed both in 2010 and subsequent<br />
years. We expect that German electricity consumption in 2010 will not be much higher than in <strong>2009</strong>.<br />
Our forecast for the Netherlands is similar. In the UK, demand for electricity had already been on the<br />
decline from 2006 to 2008 due to progress made in the field of energy efficiency. At best, it will<br />
match last year’s level in 2010. In contrast, electricity usage in Central Eastern Europe may increase<br />
by more than 2 %. Given the economy’s more dynamic development in these countries, it is also<br />
likely to rise significantly in subsequent years.<br />
Since demand for gas depends more on temperature than electricity, it is subject to greater fluctuation<br />
and difficult to predict. Leaving potential weather-related effects aside, gas usage in Germany,<br />
the Netherlands, and the UK should come close to last year’s level in 2010. There may be some economic<br />
stimulus, as is the case with electricity. However, increasing energy efficiency is resulting in<br />
lasting reductions in consumption in the aforementioned countries. In general, <strong>our</strong> Central Eastern
106 Outlook for 2010<br />
RWE Annual Report <strong>2009</strong><br />
European markets are expected to record marginal growth excluding weather-related effects. In<br />
addition to economic effects, the mounting significance of gas compared to other s<strong>our</strong>ces of energy<br />
plays a role in these countries.<br />
Fuel and electricity prices to remain much lower than 2008’s record level. Due to demand, energy<br />
prices will probably remain far below the highs achieved in 2008 in the foreseeable future. However,<br />
they may rise slightly compared to <strong>2009</strong>, depending on the speed at which the economy emerges<br />
from the crisis. The oil market painted the following picture in late January 2010: A barrel of Brent<br />
sold for US$72 in spot trading, which was above the previous year’s average. The forward market<br />
currently has a contango structure, i.e. the later the delivery, the higher the price. Purchases of Brent<br />
crude for the current year made at the end of January 2010 cost between US$72 (delivery in March)<br />
and US$76 (delivery in the f<strong>our</strong>th quarter).<br />
The development of crude oil prices will also be reflected on the Continental European gas market.<br />
This is due to the fact that long-term gas import agreements track oil prices, as mentioned earlier.<br />
Taking into account the time lag and the current Brent forward prices, the oil-indexed gas price for<br />
2010 at the end of January was €21 per MWh. Last year’s comparable figure was of a similar order.<br />
Prices presently observed at Europe’s major trading points are much lower: Anyone who bought gas<br />
on the Dutch TTF market at the end of <strong>2009</strong> (for 2010) paid approximately €14 per MWh. We expect<br />
gas procurement via the TTF to also be more affordable over the remaining c<strong>our</strong>se of the year than<br />
purchases made via long-term, oil-indexed contracts.<br />
Hard coal prices in the year underway will also fall significantly short of the record level seen in<br />
2008. However, they should increase marginally compared to <strong>2009</strong>. At the end of January 2010,<br />
a metric ton cost US$86 in Rotterdam spot trading (including freight and insurance to Rotterdam),<br />
which was more than the prior-year average (US$71). In addition, forward contracts for 2010 and<br />
subsequent years have the aforementioned contango structure. The BAFA quotation, which determines<br />
the price of German hard coal, will mirror the development on international markets with a lag<br />
of several months. It is likely to be slightly down on <strong>2009</strong>’s average, which is an estimated €78 per<br />
metric ton of hard coal unit.<br />
In European CO 2 emissions trading, prices do not have the prospect of increasing significantly in the<br />
near future. As energy-intensive industries are only ramping up production slowly, they continue to<br />
have a surplus of certificates, which they can sell on the market. This will depress prices. Moreover,<br />
the international community failed to agree on a successor agreement to Kyoto at the Copenhagen<br />
World Climate Conference in December <strong>2009</strong>. If the conference had been successful, it would have<br />
strengthened the trust placed in the long-term survival of emissions trading substantially. At the<br />
end of January, the right to emit a metric ton of CO 2 cost €13. This corresponds to the average<br />
market price for <strong>2009</strong>.
<strong>2009</strong> in brief To <strong>our</strong> investors Review of operations Our responsibility<br />
Responsibility statement Consolidated financial statements Further information<br />
Outlook for 2010 107<br />
Persistently low hard coal, gas and CO 2 certificate prices are reflected in electricity prices. As set out<br />
on page 43, the 2010 base-load forward cost an average of €49 on the German wholesale market last<br />
year, and was thus much cheaper than the <strong>2009</strong> forward in the preceding year. Similar to fuel, the<br />
coming years have a contango price structure: At the end of January 2010, base-load electricity for<br />
delivery in 2011 in Germany sold for €50 per MWh. The same contract for subsequent years traded at<br />
€53 (2012) and €56 (2013).<br />
We have sold forward nearly all of <strong>our</strong> German electricity generation for 2010. The price we realised<br />
was below the corresponding figure for <strong>2009</strong> (€70 per MWh). A portion of <strong>our</strong> German production<br />
has also already been placed on the market for the years ahead: over 70 % for 2011 and over 30 % for<br />
2012. In principle, when concluding forward contracts, we hedge the volume and price of the<br />
required fuel at the time the contract is signed. This also applies to the purchase of emission<br />
certificates.<br />
Investment programme for more growth and less CO 2 . Now that the acquisition of Essent has been<br />
completed, <strong>our</strong> strategic focus lies on organic growth and achieving further CO 2 reductions. We are<br />
rolling out the biggest programme for spending capital on property, plant and equipment in RWE<br />
history in order to make progress in these areas. An average of €7 billion per annum has been set<br />
aside through to 2013 for this purpose. The following cornerstones demonstrate the points of focus<br />
we have chosen: More than half of the €28 billion total has been earmarked for organic growth and<br />
efficiency improvements, nearly two thirds of <strong>our</strong> capital expenditure will be dedicated to activities<br />
outside Germany, and roughly half will be spent on electricity generation projects.<br />
We are already building eight large-scale power stations in Germany, the UK and the Netherlands.<br />
We intend to use them to replace old plants or gain market share (see pages 77 et seq.). The growth<br />
strategy we are pursuing in the field of nuclear energy is more long-term in nature. This is an area in<br />
which we want to gain a foothold with E.ON in the UK. Furthermore, we have teamed up with partners<br />
to plan the construction and operation of two nuclear power plant units in the south east of<br />
Romania. The final investment decision is scheduled to be taken in 2011. This year, we intend to<br />
take a decision on the construction of a gas-fired power station in Turkey. It would enable us to tap<br />
into a further attractive market: Just like the countries of Central and Eastern Europe, Turkey harb<strong>our</strong>s<br />
more growth potential than <strong>our</strong> more mature markets over the long term, because its infrastructure<br />
is relatively old and its demand for electricity and gas is rising. In gas and oil production,<br />
we continue to work on achieving <strong>our</strong> goal of doubling output no later than 2015. We will spend<br />
roughly €4 billion to this end through to 2013, focusing on Norway, Egypt and the UK. A sum of a<br />
similar order has been earmarked for electricity and gas networks. Germany’s incentive-based regulation<br />
offers us fairly stable framework conditions for the years ahead.
108 Outlook for 2010<br />
RWE Annual Report <strong>2009</strong><br />
Still full steam ahead with renewables. We intend to grow by spending capital especially in the field<br />
of renewable energy. RWE Innogy largely develops proprietary projects. The company benefits from<br />
the fact that, in some cases, wind farm component prices are now 10 % to 20 % lower than before the<br />
economic crisis. We anticipate that RWE Innogy’s operating result will post double-digit growth rates<br />
every year. By fiscal 2013, the company aims to have hit the €500 million mark. We will invest over<br />
€5 billion in total to this end.<br />
Large-scale offshore projects currently take centre stage: The Greater Gabbard wind farm off the UK<br />
coast, in which we have a 50 % stake, is already under construction and will have an installed capacity<br />
of 504 MW on completion in 2011. We intend to begin construction of the German Nordsee Ost<br />
offshore wind farm before year-end. It will have a total installed capacity of 295 MW and is expected<br />
to be commissioned in 2012. The 576 MW Gwynt y Môr wind farm off the coast of Wales, which is<br />
scheduled to be built between 2011 and 2014, is another large-scale project in its preparatory stages.<br />
It is pending the final investment decision. We will also enlarge <strong>our</strong> onshore wind turbine portfolio,<br />
especially in Italy and the UK. Biomass is another field in which we are active. We are building<br />
combined heat and power stations in Germany and Scotland and a biomass pellet production plant<br />
in the USA.<br />
All eyes on climate protection. Avoiding CO 2 is one of <strong>our</strong> main strategic goals. Given that we are<br />
one of Europe’s biggest power producers, we feel we shoulder special responsibility. The stable and<br />
strong cash flows from <strong>our</strong> current power plant business give us the financial clout we need to gradually<br />
reconfigure <strong>our</strong> generation portfolio under <strong>our</strong> own steam. This kind of change will not happen<br />
overnight. It will take more than a decade. But we will already make significant progress on this road<br />
in the next few years. We intend to take emission-reducing and financial measures to reduce <strong>our</strong> CO 2<br />
risk to the level of an average competitor in <strong>our</strong> markets by no later than 2020 (see page 35). In view<br />
of the high share of <strong>our</strong> portfolio accounted for by lignite and hard coal-fired power plants, this is an<br />
ambitious target. Huge investments will be necessary in order to achieve this: About half of the<br />
growth and replacement investments amounting to just over apple18 billion through 2013 will be accounted<br />
for by CO 2 -free or low-CO 2 electricity production technologies. We have earmarked nearly<br />
25 % in additional funds for state-of-the-art coal power stations, which will be up to 30% more efficient<br />
than their predecessors. In addition, we are investing in CO 2 -reduction projects outside Europe<br />
within the scope of the Kyoto Clean Development Mechanism and Joint Implementation. Our work<br />
also includes reviewing options for conducting virtual power plant swaps with other electricity generators<br />
and buying CO 2 certificates on the wholesale market for future periods early on.
<strong>2009</strong> in brief To <strong>our</strong> investors Review of operations Our responsibility<br />
Responsibility statement Consolidated financial statements Further information<br />
Outlook for 2010 109<br />
However, we believe climate protection is not merely an environmental task. It is also an economic<br />
challenge. EU emissions trading is causing electricity generation costs to increase substantially. We<br />
had to spend more than €1 billion to buy CO 2 certificates in <strong>2009</strong> alone. From 2013 onwards, CO 2<br />
regulation will become stricter and we will hardly be allocated any allowances for free. Against this<br />
backdrop, it is all the more important that we achieve <strong>our</strong> emissions goals.<br />
Selective acquisition strategy. The takeover of Essent will be <strong>our</strong> biggest step in terms of growth via<br />
acquisition for the next few years. We are not ruling out further acquisitions, but if we make any,<br />
they will be of a significantly smaller order. We are exploring how we can expand <strong>our</strong> market share or<br />
establish footholds by acquiring stakes in established local energy companies, especially in the<br />
eastern and south eastern parts of Europe. However, we generally consider acquisitions only if <strong>our</strong><br />
financial criteria are met. The major yardstick is the internal rate of return (IRR). It must at least<br />
correspond to the cost of capital, plus a value added. Our agenda also presently includes an important<br />
divestment: the sale of <strong>our</strong> long- distance gas network operator Thyssengas. We intend to initiate the<br />
disposal process this year.<br />
<strong>For</strong>ecast for 2010. Significant earnings growth expected. Essent’s integration will change <strong>our</strong> financial<br />
reporting for 2010: From 2010 onwards, we will state the company’s proprietary trading under<br />
RWE Supply & Trading and its wind electricity generation under RWE Innogy. To ensure transparency,<br />
we will present the earnings contributions of Essent’s aforementioned activities as separate items.<br />
Our goal for 2010 is to clearly surpass last year’s high level of earnings. The full-year consolidation<br />
of the Dutch energy utility Essent for the first time will have a positive impact. Last year, we only<br />
included Essent for a quarter. As regards generation, we expect the availability of <strong>our</strong> Biblis nuclear<br />
power plant to rise. Price-driven reductions in the cost of procuring fuel and CO 2 emission allowances<br />
should also have an earnings-improving effect. In contrast, RWE Supply & Trading will fall short<br />
of the unusually high earnings achieved in <strong>2009</strong>. We will benefit from <strong>our</strong> efficiency- enhance ment<br />
programme this year as well. Our target for 2010 is €700 million compared to 2006.
110 Outlook for 2010<br />
RWE Annual Report <strong>2009</strong><br />
Outlook for 2010<br />
€ million<br />
<strong>2009</strong> 2010 forecast vs. <strong>2009</strong><br />
EBITDA 9,165 + 5 – 10 %<br />
Operating result 7,090 Approx. + 5 %<br />
Germany 4,780 Significantly above previous year<br />
Power generation 3,428 Significantly above previous year<br />
Sales and distribution networks 1,352 Above previous year<br />
Netherlands/Belgium 180 Significantly above previous year<br />
United Kingdom 247 Slightly above previous year<br />
Central and Eastern Europe 1,055 Below previous year<br />
Renewables 56 Significantly above previous year<br />
Upstream gas & oil 203 Significantly above previous year<br />
Trading /gas midstream 985 Significantly below previous year<br />
Recurrent net income 3,532 Approx. + 5 %<br />
We anticipate that EBITDA will rise by between 5 % and 10 % compared to <strong>2009</strong> (€9,165 million).<br />
The operating result (€7,090 million) is expected to post a gain of approximately 5 %. Our forecast<br />
for recurrent net income (€3,532 million), the basis for determining the dividend, is also an increase<br />
of approximately 5 %.<br />
• Germany: The division’s operating result for 2010 is anticipated to be significantly higher year on<br />
year.<br />
Power generation: The earnings growth forecast for the Germany division will largely come from<br />
RWE Power. The Biblis nuclear power plant’s two units, which were only online for a short period of<br />
time in <strong>2009</strong> due to maintenance, will make a much larger contribution to production this year. We<br />
have already sold forward nearly all <strong>our</strong> 2010 German generation. As mentioned earlier, the electricity<br />
price realised is lower than in <strong>2009</strong>. However, this is likely to be more than compensated for<br />
by the fact that expenses incurred for fuel and CO 2 emission certificates have declined. We also<br />
expect power station maintenance to have a less negative effect.<br />
The sales and distribution networks business area is predicted to close 2010 up year on year. We<br />
expect to see slight operating improvements in terms of both margins and volume in <strong>our</strong> electricity<br />
and gas sales activities. In addition, one-off charges in the gas business, which had a negative<br />
effect on last year’s operating result, will not occur this year (see page 68). However, we anticipate<br />
that German electricity and gas grid regulation will have further negative effects, above all because<br />
fees charged by network operators at the beginning of network regulation were too high. The<br />
excess amounts must be refunded via appropriately reduced network fees from 2010 onwards. We<br />
intend to partially offset these additional burdens by reducing costs.
<strong>2009</strong> in brief To <strong>our</strong> investors Review of operations Our responsibility<br />
Responsibility statement Consolidated financial statements Further information<br />
Outlook for 2010 111<br />
• The Netherlands/Belgium division will close the year significantly up on the last one, due to consolidations.<br />
Having included the Dutch energy utility Essent last year only on a one-quarter basis, the<br />
company will be considered for a full twelve months for the first time this year. As mentioned earlier,<br />
Essent’s proprietary trading and wind power generation will be stated under RWE Supply & Trading<br />
and RWE Innogy from 2010 onwards.<br />
• The United Kingdom division’s operating result is expected to recover slightly in 2010, following<br />
the weak <strong>2009</strong> fiscal year. We anticipate to see added earnings contributed by the commissioning<br />
of <strong>our</strong> new gas-fired power station at Staythorpe. The f<strong>our</strong> units are scheduled to go online in the<br />
second half of the year. However, <strong>our</strong> generation margins are likely to decline overall. We expect<br />
the purchase of CO 2 emission allowances to result in a higher expense than in <strong>2009</strong>. In the supply<br />
business, RWE npower continues to feel the negative impact of the competition-induced electricity<br />
price reductions made last year. This is compounded by the persistently high expenses caused by<br />
government programmes obliging UK utilities to promote energy saving measures for residential<br />
<strong>customers</strong> and municipalities and to support low-income homes. In fiscal <strong>2009</strong>, RWE npower took<br />
extensive cost-related measures positively affecting earnings by €120 million. The task at hand<br />
now is to safeguard the realised savings. RWE npower is working on additional efficiency measures<br />
on top of this.<br />
• The Central and Eastern Europe division is unlikely to fully match the operating result recorded last<br />
year. Margins in the Czech gas supply business are expected to deteriorate. Furthermore, we will<br />
probably be unable to match the high operating result achieved in the Hungarian electricity<br />
business last year. However, we anticipate that we will benefit from higher income from <strong>our</strong> Czech<br />
gas network companies and the continuation of <strong>our</strong> efficiency-enhancement programme this year.<br />
• The renewables division’s operating result is expected to improve significantly due to the integration<br />
of Essent’s wind farms and the continued expansion of the generation base. However, the<br />
ongoing investment projects are causing substantial run-up costs. The earnings increase will<br />
accelerate in the years ahead.<br />
• The upstream gas & oil division anticipates to post strong earnings growth compared to the weak<br />
year of <strong>2009</strong>. In the oil business, RWE Dea expects higher realised prices and production output.<br />
However, the rise in production will also lead to higher depreciation as well as production and<br />
operating costs.
112 Outlook for 2010<br />
RWE Annual Report <strong>2009</strong><br />
• The trading/gas midstream division is currently expected to close the year with an operating result<br />
that is significantly lower than last year’s unusually high figure. The planned margins in the energy<br />
trading business are unlikely to match the very high level achieved in <strong>2009</strong>. However, we will again<br />
benefit from the fact that some of the good trading performance we displayed in preceding years<br />
will be reflected in the operating result with a time lag. The supply activities (gas midstream business)<br />
will also be down on the previous year’s figure, which includes extraordinary income from<br />
the reversal of provisions. In addition, in some cases, gas sales prices have declined more than <strong>our</strong><br />
procurement costs. This will have a negative effect on RWE Supply & Trading in 2010.<br />
Dividend for fiscal 2010. Our dividend proposal for fiscal 2010 will be in line with <strong>our</strong> usual payout<br />
ratio of 50 % to 60 %. The basis for calculating the payout ratio is recurrent net income, which is adjusted<br />
for one-off effects and which we intend to increase by about 5 % compared to last year. This<br />
offers prospects for growing <strong>our</strong> dividend.<br />
Capital expenditure on property, plant and equipment set to rise substantially. We will spend<br />
much more capital on property, plant and equipment in 2010. The strongest growth is anticipated to<br />
occur in the Netherlands/Belgium segment, owing to Essent’s full-year consolidation for the first<br />
time. The RWE Group’s investing activity will focus on the construction of highly efficient fossil fuelfired<br />
power plants and the significant expansion of <strong>our</strong> renewable generation capacity. Capital earmarked<br />
for this will continue to rise in 2010. Our upstream subsidiary RWE Dea will step up its<br />
spending on oil and gas production. Its regional areas of focus are Norway, Egypt and the UK. Funds<br />
set aside for <strong>our</strong> electricity and gas networks as well as gas storage are also set to rise in 2010. In total,<br />
the RWE Group’s capital expenditure on property, plant and equipment is likely to reach around<br />
€7 billion in 2010. This would be nearly 20 % more than in <strong>2009</strong>.<br />
Leverage factor: cap compliance despite higher net debt. Our net debt, which amounted to<br />
€25.8 billion at the end of <strong>2009</strong>, is expected to continue to increase this financial year. We anticipate<br />
a rise of up to €4 billion, which will largely be caused by <strong>our</strong> comprehensive investment programme.<br />
Our leverage factor, which reflects the ratio of net debt to EBITDA, will therefore probably be slightly<br />
higher than in <strong>2009</strong> (2.8), but it should not exceed 3.0.<br />
Headcount: marginal growth expected. We anticipate that <strong>our</strong> workforce will expand further this<br />
financial year. Nearly all divisions are creating jobs as they implement their investment programmes.<br />
Research and development: budget raised. Our research and development (R&D) expenditure will<br />
grow further. As before, we are concentrating on measures to improve the efficiency and reduce the<br />
emissions of <strong>our</strong> electricity generation activities. More than half of <strong>our</strong> R&D budget has been set<br />
aside for this. Detailed information on <strong>our</strong> major R&D projects is provided on pages 92 et seqq.
<strong>2009</strong> in brief To <strong>our</strong> investors Review of operations Our responsibility<br />
Responsibility statement Consolidated financial statements Further information<br />
Outlook for 2010 113<br />
Earnings forecast through to 2012. In February of <strong>2009</strong>, we presented an outlook on <strong>our</strong> mediumterm<br />
earnings trend through to 2012. The reference year was 2008. We had not yet considered<br />
Essent in <strong>our</strong> assumptions. This outlook continues to apply, with the exception of <strong>our</strong> forecast for<br />
recurrent net income:<br />
• Our forecast had <strong>our</strong> operating result growing by an average of 5 % to 10 % a year compared to<br />
2008. We currently expect to arrive at the lower end of this range. Reasons for this are delays in<br />
large-scale power plant and upstream projects as well as more conservative assumptions concerning<br />
realisable gas and electricity margins.<br />
• We had anticipated that recurrent net income, the basis for determining the dividend, would rise<br />
by an average of approximately 10 % per annum. <strong>For</strong> the aforementioned reasons, we now expect<br />
it to grow by an average of approximately 5 % per year.<br />
This prognosis is based on the assumption that the electricity price realised in Germany for 2012 will<br />
amount to at least €60 per MWh. Furthermore, we estimate that a barrel of Brent crude will cost a<br />
minimum of US$80, gas will sell for at least €25 per MWh, and emission allowances will trade at a<br />
maximum of €20 per metric ton of carbon dioxide.<br />
We expect Essent to increase its operating result by some 10 % every year through to 2012. This<br />
forecast considers all of Essent’s activities, including the proprietary trading and wind energy<br />
businesses, which will be assigned to other divisions in <strong>our</strong> reporting from 2010 onwards. The basis<br />
is the pro-forma operating result that Essent achieved for the full twelve months of <strong>2009</strong>. It totals<br />
approximately €500 million.<br />
Operating result in 2013 higher than in <strong>2009</strong>. We anticipate seeing very negative effects on <strong>our</strong> operating<br />
result in fiscal 2013 due to tighter European emission trading scheme framework conditions.<br />
Starting on January 1, 2013, power producers like RWE will have to buy almost all the CO 2 certificates<br />
they need. Nevertheless, we expect <strong>our</strong> overall development for that financial year to be positive.<br />
Our forecast has all three earnings figures (EBITDA, the operating result and recurrent net income)<br />
exceeding their <strong>2009</strong> levels. The fundamental assumptions regarding commodity prices correspond<br />
to the ones for the period through to 2012, with the exception of the price of CO 2 , which we expect<br />
will range from €20 to €30 per metric ton for 2013.<br />
Dividend trend through to 2013. Our payout ratio of 50 % to 60 % of recurrent net income continues<br />
to apply. In light of the high earnings level expected, we stand a good chance of increasing the dividend<br />
payments. Our goal is to at least match the previous year’s dividend for each fiscal year from<br />
2010 to 2013. This will ensure that <strong>our</strong> shareholders are paid an attractive dividend.
114 Outlook for 2010<br />
RWE Annual Report <strong>2009</strong><br />
<strong>For</strong>ward-looking statements. This report contains forward-looking statements regarding the future<br />
development of the RWE Group and its companies as well as economic and political developments.<br />
These statements are assessments that we have made based on information available to us at the<br />
time this document was prepared. In the event that the underlying assumptions do not materialise<br />
or additional risks arise, actual performance can deviate from the performance expected at present.<br />
Therefore, we cannot assume responsibility for the correctness of these statements.
115<br />
2.0 OUR RESPONSIBILITY<br />
Environmental expenditure<br />
in <strong>2009</strong><br />
€2.2 billion<br />
OUR RESPONSIBILITY<br />
Trainees employed<br />
by RWE<br />
3,100<br />
Wind instead of hot air. We intend to expand <strong>our</strong> renewable electricity generation<br />
capacity to 4.5 gigawatts in the next few years. Wind will play an important role. In<br />
December <strong>2009</strong>, we commissioned the Rhyl Flats wind farm off the coast of Wales.<br />
Its 90 megawatts in installed capacity make it the largest renewable power station<br />
in Wales. The farm’s 25 wind turbines supply 61,000 households with electricity.
116 Supervisory Board report<br />
RWE Annual Report <strong>2009</strong><br />
2.1<br />
SUPERVISORY BOARD REPORT<br />
Dear Shareholders,<br />
In fiscal <strong>2009</strong>, the Supervisory Board fulfilled all of the duties imposed on it by German law and the<br />
company’s Articles of Incorporation. We regularly advised the Executive Board on running the company<br />
and monitored business management measures. In so doing, we were consulted on all decisions<br />
of fundamental importance to RWE. The Executive Board informed the Supervisory Board of all<br />
the material aspects of business developments, major events and transactions, as well as of the current<br />
earnings situation, exposure to risk and risk management regularly, extensively and in a timely<br />
manner, both in writing and verbally.<br />
In the year under review, the Supervisory Board convened f<strong>our</strong> ordinary meetings and one extraordinary<br />
meeting. None of the Supervisory Board members attended less than half of the meetings. The<br />
average participation rate was 95 %. The Supervisory Board passed the resolutions required of it by<br />
law or the Articles of Incorporation. We took <strong>our</strong> decisions on the basis of reports and draft resolutions<br />
submitted by the Executive Board. We were informed of projects and transactions of special importance<br />
or urgency in a timely manner between meetings. When necessary, we were asked for approval<br />
by circular or in committee meetings. Furthermore, as Chairman of the Supervisory Board,<br />
I was constantly in touch with the Executive Board in order to immediately discuss events of material<br />
importance to the RWE Group’s situation and development.<br />
Main points of debate. One of the central topics of debate in fiscal <strong>2009</strong> was the Group’s organisational<br />
structure, which had to be brought more in line with the company’s current strategic orientation.<br />
In addition, we dealt in depth and in several sessions with the acquisition of the shares in<br />
the Dutch-based Essent N.V. and the changes to the acquisition structure that became necessary<br />
during the process. The acquisition was completed in the third quarter. Futhermore, we concerned<br />
<strong>our</strong>selves with the sale of all the remaining shares in American Water still held by RWE. The Supervisory<br />
Board formed a separate committee for the resolutions necessary in this context. This special<br />
committee passed the resolutions required to place the shares on the New York Stock Exchange at its<br />
meeting on March 3, <strong>2009</strong> and by circular. As all of the placements were successful, in the meantime,<br />
the stake has been divested completely.<br />
Moreover, we concerned <strong>our</strong>selves at length with the successful bidding process carried out by <strong>our</strong><br />
joint venture with E.ON for the acquisition of two plots of land for nuclear power plant new builds in<br />
the UK and passed the resolutions necessary for this purpose. Furthermore, the Supervisory Board<br />
received regular updates on the status of large-scale power plant new-build projects. In view of the<br />
increasing significance of renewable energy to RWE, consultative sessions also addressed major<br />
RWE Innogy projects. All of the measures and transactions mentioned here have been commented<br />
on in detail in the annual report (see pages 49 et seqq.).
<strong>2009</strong> in brief To <strong>our</strong> investors Review of operations Our responsibility<br />
Responsibility statement Consolidated financial statements Further information<br />
Supervisory Board report 117<br />
Dr. Manfred Schneider<br />
Vorsitzender Chairman of the des Aufsichtsrats<br />
der Supervisory RWE AG Board of RWE AG<br />
The Supervisory Board also set aside time to discuss the framework conditions of energy policy.<br />
Among other things, we discussed the EU Climate Package and its impact on the company’s strategy<br />
with the Executive Board.<br />
The Executive Board regularly informed us of the revenue and earnings, measures to reduce costs,<br />
and price developments on the energy markets. In <strong>our</strong> session on December 10, <strong>2009</strong>, we adopted<br />
the Executive Board’s planning for 2010 and the forecast for 2011 and 2012. We received detailed<br />
commentary in cases where there were deviations from plans and goals established previously.<br />
In this Supervisory Board meeting, we also dealt with the most recent amendments to the German<br />
Corporate Governance Code (see page 121). A considerable amount of time was also dedicated to<br />
the German Act on the Appropriateness of Management Board Compensation (VorstAG) which came<br />
into force in August <strong>2009</strong>. We adapted <strong>our</strong> rules of procedure to the changed framework conditions.<br />
The Supervisory Board passed all resolutions required to make any necessary adjustments to the<br />
compensation system for the Executive Board at its meeting on February 23, 2010.<br />
Furthermore, the Supervisory Board subjected its work to an efficiency review and discussed its<br />
results. Any need for change will be considered in the Supervisory Board’s future work.<br />
Committees. The Supervisory Board has five committees. Their members are listed on page 211.<br />
These committees are charged with preparing issues and resolutions of the Supervisory Board meetings.<br />
In certain cases, they exert decision-making powers conferred on them by the Supervisory<br />
Board. The Supervisory Board is regularly informed of the work done by the committees by their<br />
chairmen.
118 Supervisory Board report<br />
RWE Annual Report <strong>2009</strong><br />
The Executive Committee convened two ordinary and one extraordinary meeting in the <strong>2009</strong> financial<br />
year. Among other things, it did preparatory work for the Supervisory Board debates, especially<br />
concerning the <strong>2009</strong> financial statements of RWE Aktiengesellschaft and the Group, as well as the<br />
budget for fiscal 2010. In cases where issues were urgent and their treatment could not be postponed<br />
until the next Supervisory Board meeting, the Executive Committee passed the required resolutions<br />
of approval.<br />
The Audit Committee convened five times in <strong>2009</strong>. It discussed the quarterly reports, the financial<br />
statements for the first half and the annual financial statements at length and prepared the award<br />
of the audit contract to the independent auditor. This involved obtaining a statement of independence<br />
from the auditor. In addition, the Audit Committee monitored the auditor’s qualifications.<br />
Special attention was paid to the Group’s risk management and the internal controlling system,<br />
particularly at RWE Supply & Trading. Delays in the implementation of power plant new-build projects<br />
were also a subject of discussion, as were the IT strategy and network se curity as well as the economic<br />
development of RWE Innogy. The Audit Committee concerned itself in detail with compliance, with<br />
due regard to the progress and results of the 2008 compliance audit. Another point of focus were the<br />
audit results of the Internal Audit Department and its audit schedule.<br />
The half-year and quarterly reports were discussed at length with the Executive Board and the independent<br />
auditor. The independent auditor was present at all of the meetings, participated in some<br />
of the debates, and reported on the audit and/or the audit-like review of the quarterly reports, the<br />
half-year financial statements and the annual financial statements.<br />
The Personnel Affairs Committee held three meetings. Debates primarily addressed the compensation<br />
system and the amount of remuneration as well as the German Act on the Appropriateness of<br />
Management Board Compensation (VorstAG). Furthermore, the Committee prepared the Supervisory<br />
Board’s personnel-related decisions.<br />
In the financial year that just ended, there was no reason to convene the Mediation Committee,<br />
which complies with Sec. 27, Para. 3 of the German Co-Determination Act (MitbestG).<br />
The Nomination Committee was in session twice to work on the proposals for candidates to succeed<br />
Mr. Van Miert, Mr. Holl and Dr. Fischer.<br />
Financial statements for fiscal <strong>2009</strong>. The financial statements of RWE Aktiengesellschaft, which<br />
were prepared by the Executive Board in compliance with the German Commercial Code (HGB), the<br />
financial statements of the Group, which were prepared in compliance with International Financial<br />
Reporting Standards (IFRSs), the combined review of operations for RWE Aktiengesellschaft and the<br />
Group, and the accounts were scrutinised by PricewaterhouseCoopers Aktiengesellschaft Wirtschaftsprüfungsgesellschaft<br />
and were issued an unqualified auditor’s opinion. The auditors were elected
<strong>2009</strong> in brief To <strong>our</strong> investors Review of operations Our responsibility<br />
Responsibility statement Consolidated financial statements Further information<br />
Supervisory Board report 119<br />
by the Annual General Meeting on April 22, <strong>2009</strong> and commissioned by the Supervisory Board to<br />
audit the financial statements of RWE AG and the Group. Documents supporting the annual financial<br />
statements, the annual report and the auditor’s audit report were submitted to all the members of<br />
the Supervisory Board in good time. The Executive Board also commented orally on the documents in<br />
the Supervisory Board’s balance sheet meeting of February 23, 2010. The responsible independent<br />
auditors reported at this meeting on the material results of the audit and were available to answer<br />
questions. The Audit Committee had concerned itself in depth with the financial statements of<br />
RWE Aktiengesellschaft and the Group, as well as audit reports, during its meeting on February 22,<br />
2010, with the auditor present. It recommended that the Supervisory Board approve the financial<br />
statements as well as the appropriation of profits proposed by the Executive Board.<br />
The Supervisory Board thoroughly reviewed the financial statements of RWE Aktiengesellschaft and<br />
the Group, the combined review of operations for RWE Aktiengesellschaft and the Group, and the<br />
proposed appropriation of distributable profit. No objections were raised as a result of this review.<br />
As recommended by the Audit Committee, the Supervisory Board approved the auditor’s results of<br />
the audit of both financial statements, and adopted the financial statements of RWE Aktiengesellschaft<br />
and the Group for the period ended December 31, <strong>2009</strong>. The <strong>2009</strong> annual financial statements<br />
are thus adopted. The Supervisory Board concurs with the appropriation of profits proposed<br />
by the Executive Board, which anticipates a dividend payment of €3.50 per share.<br />
Changes in personnel on the Supervisory and Executive Boards. Professor Karel Van Miert, who had<br />
been a member of the Supervisory Board since June 7, 2001, passed away on June 22, <strong>2009</strong>. In his<br />
work, Professor Van Miert drew on his extensive expertise and many years of political experience. We<br />
will hon<strong>our</strong> his memory. On July 16, <strong>2009</strong>, the Essen District C<strong>our</strong>t appointed Dr. Dieter Zetsche his<br />
successor on the Supervisory Board.<br />
My predecessor, Dr. Thomas R. Fischer, relinquished his position as Chairman of the Supervisory<br />
Board effective as of the end of the day on April 30, <strong>2009</strong>. I was elected his successor in an extraordinary<br />
meeting on May 1, <strong>2009</strong>. Dr. Fischer retired from the Supervisory Board as of January 31,<br />
2010. In line with the proposal received from the Nomination Committee, the Executive Board filed a<br />
request with the Essen District C<strong>our</strong>t to appoint Dr. Wolfgang Schüssel to the Supervisory Board as<br />
Dr. Fischer’s successor. Heinz-Eberhard Holl also retired from his position as shareholder representative<br />
on the Supervisory Board with effect from January 31, 2010. On December 29, <strong>2009</strong>, Frithjof Kühn<br />
was appointed his successor by the Essen District C<strong>our</strong>t as of February 1, 2010.<br />
Karl-Heinz Römer retired from his position as employee representative on the Supervisory Board with<br />
effect from the end of the day of September 30, <strong>2009</strong>. Hans Peter Lafos was appointed his successor<br />
by c<strong>our</strong>t decree on October 28, <strong>2009</strong>.
120 Supervisory Board report<br />
RWE Annual Report <strong>2009</strong><br />
We thank Dr. Fischer as well as Messrs. Holl and Römer for their dedicated and constructive work for<br />
the benefit of the company.<br />
At its meeting on February 24, <strong>2009</strong>, the Supervisory Board appointed Dr. Rolf Martin Schmitz to the<br />
Executive Board of RWE Aktiengesellschaft as of no later than July 1, <strong>2009</strong>. Dr. Schmitz took office<br />
with effect from May 1, <strong>2009</strong>.<br />
On behalf of the Supervisory Board, I thank the RWE Executive Board and all the Group’s employees<br />
for the work they did in the financial year that just came to a close. Their dedication and expertise<br />
made a major contribution to the company’s commercial success.<br />
On behalf of the Supervisory Board<br />
Dr. Manfred Schneider<br />
Chairman<br />
Essen, February 23, 2010
<strong>2009</strong> in brief To <strong>our</strong> investors Review of operations Our responsibility<br />
Responsibility statement Consolidated financial statements Further information<br />
Corporate governance 121<br />
2.2<br />
CORPORATE GOVERNANCE<br />
Responsible and transparent corporate governance is one of the cornerstones of sustained<br />
success. Our guiding principle is always the most up-to-date version of the German Corporate<br />
Governance Code which was introduced in 2002. We issued an unconditional statement of<br />
compliance for the eighth straight time in February 2010.<br />
Comprehensive implementation of the Code. “Corporate governance” defines the responsible and<br />
transparent management and monitoring of a company focused on long-term commercial success.<br />
RWE uses this as a yardstick. We use the recommendations of the German Corporate Governance<br />
Code (hereinafter referred to as the “Code”) as the main benchmark for this. The Code aims to increase<br />
the confidence placed by domestic and international investors, <strong>customers</strong>, employees and<br />
the public in German listed companies. It is prepared by the Government Commission of the German<br />
Corporate Governance Code, which submitted the first version of the Code in February 2002. Since<br />
then, the Commission has reviewed the Code every year against the backdrop of domestic and<br />
international developments and adapted it whenever necessary.<br />
The Government Commission revised the Code again in <strong>2009</strong>, adopting the current version on<br />
June 18. The amendments aimed to take into account the change in the legal framework — especially<br />
the provisions of the German Act on the Appropriateness of Management Board Compensation<br />
(VorstAG, hereinafter referred to as the “Act”) — and to improve the prerequisites for the professional<br />
work of super visory boards. Some of the amendments to the Code go above and beyond the Act.<br />
Companies are now recommended to establish a deductible for directors’ and officers’ liability insurances<br />
(D&O insurances) for supervisory board members. It should correspond to the deduc tible for<br />
management board members established by the Act, which is now legally prescribed, and must<br />
amount to at least 10 % of the damage and at least one-and-a-half times the member’s annual compensation.<br />
In addition, the new recommendation was followed, namely to take account of both<br />
positive and negative developments in determining the variable components of executive board<br />
compensation. If a supervisory board commissions an external expert to assess the appropriateness<br />
of remuneration, the management board or the company must ensure that the expert is independent.<br />
Another new recommendation envisages supervisory boards taking diversity into account<br />
when composing a management board.<br />
RWE complies with all the amendments made to the law and the Code. The Supervisory Board<br />
re viewed the structure of the Executive Board compensation for compatibility with the Act, based on<br />
the suggestions made by the Personnel Affairs Committee. We have made the necessary adjustments<br />
in compliance with statutory regulations. Our D&O insurance for members of the Executive and<br />
Supervisory Boards already included an appropriate deductible. We will adapt it to the new rules<br />
included in the Act and the Code in due c<strong>our</strong>se. Dr. Dieter Zetsche, Frithjof Kühn and Dr. Wolfgang<br />
Schüssel were proposed for the by-elections to the Supervisory Board of RWE AG by the Nomination<br />
Committee. The independence and diversity criteria were taken into account, in compliance with the<br />
Code’s new recommendation.
122 Corporate governance<br />
RWE Annual Report <strong>2009</strong><br />
We therefore continue to comply with all of the recommendations of the current version of the<br />
Code. With just a few exceptions, we consider the suggestions included therein. In February 2010,<br />
RWE issued an unqualified statement of compliance for the eighth time in a row.<br />
Our listed Group company Lechwerke AG is also putting the Code into practice, taking account of the<br />
fact that it is a part of the Group. Deviations from the Code’s recommendations have been disclosed<br />
in Lechwerke AG’s statement of compliance.<br />
Transparency of directors’ dealings and potential conflicts of interest. Transparency is a core<br />
element of good corporate governance. It is necessary especially in cases where transactions concluded<br />
by the Executive Board may lead to conflicts of interest. We would like to highlight the<br />
following aspects of RWE’s corporate governance practice:<br />
• Material transactions concluded between RWE or a Group company and an Executive Board<br />
member or related party were in line with prevailing market standards. No conflicts of interest of<br />
members of the Executive Board going above and beyond such transactions were notified. No<br />
contracts were concluded between RWE AG and members of the Supervisory Board. No conflicts of<br />
interest of Supervisory Board members were notified.<br />
• Executive Board members and one member of the Supervisory Board purchased RWE shares in<br />
the year under review. No sales were notified to us. We published information on transactions notified<br />
to us in accordance with Sec. 15a of the German Stock Corporation Act (WpHG) throughout<br />
Europe. The following is a breakdown of the transactions we were notified of:<br />
Transaction<br />
date<br />
Name<br />
Reason for<br />
mandatory<br />
disclosure / function<br />
Type of financial<br />
instrument<br />
Trans action<br />
(purchase /<br />
sale)<br />
Price per<br />
share<br />
in €<br />
Number<br />
of<br />
shares<br />
Total<br />
volume<br />
in €<br />
Mar 20, <strong>2009</strong> Dr. Leonhard Birnbaum Exec. Board member RWE common share Purchase 49.03662 1,013 49,674.10<br />
Mar 21, <strong>2009</strong> Alwin Fitting Exec. Board member RWE common share Purchase 49.03662 2,013 98,710.72<br />
Mar 22, <strong>2009</strong> Dr. Ulrich Jobs Exec. Board member RWE common share Purchase 49.03662 1,013 49,674.10<br />
Mar 23, <strong>2009</strong> Dr. Rolf Pohlig Exec. Board member RWE common share Purchase 49.03662 2,013 98,710.72<br />
May 15, <strong>2009</strong> Dr. Rolf Martin Schmitz Exec. Board member RWE common share Purchase 56.05300 2,013 112,834.69<br />
Aug 20, <strong>2009</strong> Carl-Ludwig von Boehm-Bezing Sup. Board member RWE common share Purchase 61.08000 400 24,432.00<br />
Aug 27, <strong>2009</strong> Dr. Ulrich Jobs Exec. Board member RWE common share Purchase 65.49600 1,100 72,045.60
<strong>2009</strong> in brief To <strong>our</strong> investors Review of operations Our responsibility<br />
Responsibility statement Consolidated financial statements Further information<br />
Corporate governance 123<br />
The RWE shares and related financial instruments directly or indirectly held by members of the<br />
Executive and Supervisory Boards account for less than 1 % of the shares issued by RWE.<br />
We publish further information on <strong>our</strong> corporate governance practices on the internet at<br />
www.rwe.com/investorrelations. This web page also provides access to <strong>our</strong> Articles of Incorporation,<br />
the bylaws of the Supervisory Board and the Ex ecutive Board, RWE’s code of conduct, all the<br />
corporate governance reports and statements of compliance as well as the corporate governance<br />
declaration in accordance with Sec. 289a of the German Commercial Code (HGB).<br />
Statement of compliance in accordance with Sec. 161 of the German Stock Corporation Act. After<br />
an orderly audit, the Executive and Supervisory Boards of RWE AG issued the following declaration of<br />
compliance:<br />
RWE Aktiengesellschaft complies with all of the recommendations of the Government Commission of<br />
the German Corporate Governance Code issued in the August 5, <strong>2009</strong> version of the Code. Like wise,<br />
from the last statement of compliance on February 24, <strong>2009</strong> to August 5, <strong>2009</strong>, RWE Aktien -<br />
gesell schaft has complied with all of the recommendations of the version of the Code issued on<br />
August 8, 2008, and since August 6, <strong>2009</strong>, has complied with all of the recommendations of the<br />
August 5, <strong>2009</strong>, version of the Code.<br />
RWE Aktiengesellschaft<br />
On behalf of the Supervisory Board<br />
On behalf of the Executive Board<br />
Dr. Manfred Schneider Dr. Jürgen Großmann Dr. Rolf Pohlig<br />
Essen, February 23, 2010
124 Compensation report RWE Annual Report <strong>2009</strong><br />
2.3<br />
COMPENSATION REPORT<br />
<strong>For</strong> us, transparent reporting on Executive and Supervisory Board compensation is one of the core<br />
elements of good corporate governance. On the following pages, we have provided information on<br />
the principles of RWE AG’s compensation system as well as on its structure and the payments. The<br />
<strong>2009</strong> Compensation Report takes into account all statutory regulations and fully complies with the<br />
recommendations of the German Corporate Governance Code. It is part of the combined review of<br />
operations and the corporate governance report.<br />
Executive Board compensation<br />
Compensation structure. The compensation structure and amount of compensation of Executive<br />
Board members are determined by the Supervisory Board and reviewed on a regular basis. The existing<br />
compensation system ensures that Executive Board members are compensated in a manner commensurate<br />
with their activities and responsibilities and is in line with common practice within the<br />
Group and on the external market. It takes into account not only their personal performance, but<br />
also the company’s business situation, its performance and prospects for the future.<br />
In light of the German Act on the Appropriateness of Management Board Compensation (VorstAG)<br />
which came into force on August 5, <strong>2009</strong>, the Supervisory Board reviewed the compensation and will<br />
adapt it as necessary. Most importantly, the compensation structure will be brought more in line<br />
with sustainable business development. Once it has been updated, the Supervisory Board will<br />
present the compensation system to the Annual General Meeting for approval. The compensation<br />
system valid for the year under review is presented in the following passages.<br />
Short-term compensation components. The total cash compensation consists of a non-performancebased,<br />
fixed component and a variable, performance-related component. If the degree to which targets<br />
have been achieved is 100%, the total cash compensation breaks down into 40% for the fixed<br />
component and 60% for the variable component. The variable component consists of a company bonus,<br />
accounting for 70%, and an individual bonus, accounting for 30%. The company bonus is based<br />
on the Group’s value added. If the figure budgeted for the fiscal year in question is achieved, the<br />
degree to which the target has been achieved is 100%. The degree to which the target has been<br />
achieved as regards the company bonus can amount to between 50% and 150%. The personal bonus<br />
depends on the degree to which the goals agreed between the Chairman of the Supervisory Board<br />
and each Executive Board member at the beginning of the financial year have been achieved. The<br />
maximum degree to which this target can be achieved is 120%.<br />
Above and beyond this, Executive Board members receive non-cash compensation and other compensation,<br />
consisting primarily of sums reflecting the use of company cars according to German<br />
fiscal guidelines and accident insurance premiums.
<strong>2009</strong> in brief To <strong>our</strong> investors Review of operations Our responsibility<br />
Responsibility statement Consolidated financial statements Further information<br />
Compensation report 125<br />
Compensation also includes payment for exercising Supervisory Board mandates held by Executive<br />
Board members at affiliates. All this income is deducted from the variable compensation and therefore<br />
does not increase the total compensation.<br />
The short-term compensation components paid to members of the Executive Board for fiscal <strong>2009</strong><br />
were as follows:<br />
Short - term Executive<br />
Board compensation<br />
in <strong>2009</strong><br />
Non-performancebased<br />
compensation<br />
Performancebased<br />
compensation<br />
Non-cash<br />
and other<br />
remuneration<br />
Payment<br />
for exercise of<br />
mandates 1<br />
Other<br />
payments<br />
€ ‘000 <strong>2009</strong> 2008 <strong>2009</strong> 2008 <strong>2009</strong> 2008 <strong>2009</strong> 2008 <strong>2009</strong> 2008 <strong>2009</strong> 2008<br />
Dr. Jürgen Großmann 2 2,700 2,700 4,431 4,315 24 47 7 20 2,000 2,000 9,162 9,082<br />
Dr. Leonhard Birnbaum 680 170 1,259 307 22 5 0 0 0 0 1,961 482<br />
Alwin Fitting 680 680 1,246 1,174 16 17 13 52 0 0 1,955 1,923<br />
Dr. Ulrich Jobs 760 680 1,282 1,084 23 23 125 148 0 0 2,190 1,935<br />
Dr. Rolf Pohlig 760 700 1,340 1,232 31 33 67 40 0 0 2,198 2,005<br />
Dr. Rolf Martin Schmitz<br />
(since May 1, <strong>2009</strong>) 453 0 742 0 12 0 97 0 0 0 1,304 0<br />
Total 6,033 4,930 10,300 8,112 128 125 309 260 2,000 2,000 18,770 15,427<br />
1 Income from the exercise of mandates is part of variable compensation.<br />
2 Dr. Jürgen Großmann receives an annual €2,000,000 instead of a pension commitment.<br />
Total<br />
Long-term incentive compensation. With the exception of the Chairman of the Executive Board,<br />
Dr. Jürgen Großmann, performance shares were awarded to members of the Executive Board as part<br />
of the Beat 2005 long-term incentive plan (“Beat” for short). Performance shares are granted on condition<br />
that the Executive Board members invest in RWE shares a sum which is equal to one-third of<br />
the value of the performance shares granted after taxes. The shares must be held for the respective<br />
Beat tranche’s entire three-year waiting period. Any necessary notifications of directors’ dealings<br />
were published.<br />
The Beat programme supplements the compensation system with a long-term incentive component<br />
by rewarding the sustainable contribution made by executives to the company’s success. The company’s<br />
performance is measured using Total Shareholder Return (TSR) of RWE shares, which covers both<br />
the development of the share price and reinvested dividends. The payout factor is determined by<br />
comparing RWE’s TSR with the TSR of other companies in the Dow Jones STOXX Utilities Index.<br />
Executives entitled to participate in Beat receive a conditional allocation of performance shares every<br />
year. A performance share allocated in the fiscal year consists of the conditional right to receive a<br />
payout in cash following a waiting period of three years. However, a payout only takes place if, on<br />
conclusion of the waiting period, the RWE share’s performance is better than the performance of<br />
25% of the companies in the peer group, measured in terms of their index weighting as of the inception<br />
of the programme. Consequently, the decisive factor is not only RWE’s position among the companies<br />
in the peer group, but also which of the companies RWE outperforms.
126 Compensation report RWE Annual Report <strong>2009</strong><br />
Payment in the fiscal year corresponds to the average RWE share price during the last 20 trading<br />
days prior to the expiry of the programme, the number of conditionally allocated performance<br />
shares, and the payout factor. Payment for Executive Board members is limited to one-and-a-half<br />
times the value of the performance shares at grant.<br />
Performance shares granted under Beat in the year under review break down as follows:<br />
Long - term incentive<br />
Beat: <strong>2009</strong> tranche<br />
share-based payment<br />
No. Fair value<br />
upon grant<br />
€ ‘000<br />
Dr. Leonhard Birnbaum 62,867 750<br />
Alwin Fitting 62,867 750<br />
Dr. Ulrich Jobs 62,867 750<br />
Dr. Rolf Pohlig 62,867 750<br />
Dr. Rolf Martin Schmitz 62,867 750<br />
Total 314,335 3,750<br />
In the year under review, the long-term incentive 2006 Beat tranche was paid out as follows:<br />
Long - term incentive<br />
share-based payment<br />
Beat: 2006 tranche<br />
payout<br />
€ ’000<br />
Alwin Fitting 1,500<br />
Dr. Ulrich Jobs 297<br />
Total 1,797<br />
Executive Board members still hold performance shares from the Beat programme’s 2007 and 2008<br />
tranches from Executive Board activity in previous years. These allocations are not part of total compensation<br />
for the <strong>2009</strong> financial year. Instead, they are part of total compensation for fiscal 2007<br />
and 2008 and, as such, are presented in the compensation reports for these two prior years.<br />
German Accounting Standard (DRS) 17 mandates that the portion of the total expense recognised<br />
for share-based payments allocable to Executive Board members must be disclosed and itemised.<br />
The following expenses were recognised for long-term incentive share-based payments in the period<br />
under r eview:
<strong>2009</strong> in brief To <strong>our</strong> investors Review of operations Our responsibility<br />
Responsibility statement Consolidated financial statements Further information<br />
Compensation report 127<br />
Allocation to expenses for long-term incentive share-based payments<br />
2007/2008/<strong>2009</strong> tranches<br />
<strong>2009</strong><br />
€ ‘000<br />
2008<br />
€ ‘000<br />
Dr. Leonhard Birnbaum 1 433 71<br />
Alwin Fitting 941 1,640<br />
Dr. Ulrich Jobs 941 663<br />
Dr. Rolf Pohlig 941 477<br />
Dr. Rolf Martin Schmitz 319 0<br />
Total 3,575 2,851<br />
1 The allocation to expenses in 2008 was made for the period prior to his appointment to the Executive Board.<br />
Total compensation. In total, the Executive Board received €18,770,000 in short-term compensation<br />
components in fiscal <strong>2009</strong>. In addition to this, long-term compensation components from the <strong>2009</strong><br />
tranche of the Beat programme amounting to €3,750,000 were allocated. Total compensation of the<br />
Executive Board for fiscal <strong>2009</strong> thus amounted to €22,520,000.<br />
Employment termination benefits. Benefits due in the event of a termination of Executive Board<br />
activity are detailed below.<br />
Pension commitments. The members of the Executive Board — with the exception of its Chairman,<br />
Dr. Großmann — received pension commitments (direct commitments), which grant them or their<br />
surviving dependants entitlement to a life-long pension and surviving dependants’ benefits. These<br />
benefits are due in the event of retirement upon reaching the age of 60 (retirement age), permanent<br />
disability, death and early termination or non-extension of the employment contract by the company.<br />
The amount of qualifying income and the level of benefits determined by the duration of service<br />
are taken as a basis for each member’s individual pension and surviving dependants’ benefits. Profit<br />
participation and other fringe benefits are not factored into the pension. The ceiling for pension<br />
benefits for members of the Executive Board is 60 % of the last qualifying income on the day before<br />
they reach the retirement age. The widow’s pension amounts to 60 % of her husband’s pension, the<br />
orphan’s pension amounts to 20 % of the widow’s pension. Vested old-age pension benefits do not<br />
expire. The amount of the old-age pension and the surviving dependants’ benefits are reviewed<br />
every three years, taking account of all major circumstances, with due regard to changes in the cost<br />
of living. Due to earlier provisions, there are some differences in the pension commitments in terms<br />
of the calculation of the level of benefits, the crediting of other pensions and benefits, and the adjustment<br />
mode selected for pensions and surviving dependants’ benefits.
128 Compensation report RWE Annual Report <strong>2009</strong><br />
In the event of an early termination or non-extension of an employment contract, Executive Board<br />
members shall only receive payment if the termination or non-extension was occasioned by the company<br />
and effected without due cause. In such cases, they start receiving pension payments when<br />
they leave the company, but no earlier than on completion of their 55 th year of age. In the event of a<br />
non-extension or early termination of an employment contract, only 50 % of income earned through<br />
other activities until the end of the Executive Board member’s 60 th year of age or the beginning of<br />
the member’s occupational disability is taken into account in determining the pension payments.<br />
The service cost of pension commitments in fiscal <strong>2009</strong> totalled €439,000. At the end of the year under<br />
review, the present value of the defined benefit obligation was €14,203,000. The following is a<br />
breakdown of service costs and the present value of pension benefits, taking into account both age<br />
and years of service.<br />
Pensions<br />
Predicted annual<br />
pension on reaching<br />
the company age<br />
limit (60 years) 1<br />
€ ‘000<br />
Service<br />
cost<br />
Defined benefit<br />
obligation<br />
€ ‘000<br />
€ ‘000<br />
Age <strong>2009</strong> 2008 <strong>2009</strong> 2008 <strong>2009</strong> 2008<br />
Dr. Leonhard Birnbaum 43 245 245 85 0 635 402<br />
Alwin Fitting 56 283 283 136 140 3,935 2,696<br />
Dr. Ulrich Jobs 56 274 245 155 101 3,761 2,784<br />
Dr. Rolf Pohlig 57 274 252 63 64 2,159 1,549<br />
Dr. Rolf Martin Schmitz 2 52 370 0 0 0 3,713 0<br />
439 305 14,203 7,431<br />
1 Based on compensation qualifying for pensions as of December 31, <strong>2009</strong>.<br />
2 Dr. Schmitz’s expected pension includes pension benefit entitlements from former employers. €1,152,000 in provisions were transferred<br />
to RWE to cover this.<br />
As regards Executive Board members, vested pension benefits from earlier employment and years of<br />
service for previous employers which have been recognised, are credited to the company’s pension<br />
payments by contractual arrangement.<br />
Change of control. Executive Board members have a special right of termination in the event that<br />
the company loses its independence as the result of control being taken over by shareholders or<br />
third parties. In such cases, they have the right to retire from the Executive Board within six months<br />
of the time at which the change of control becomes known and to request that their employment<br />
contract be terminated in combination with a one-off payment. To the extent necessary to ensure the<br />
company’s survival, however, the Supervisory Board can demand that the Executive Board member<br />
remain in office until the end of the six-month period.
<strong>2009</strong> in brief To <strong>our</strong> investors Review of operations Our responsibility<br />
Responsibility statement Consolidated financial statements Further information<br />
Compensation report 129<br />
A change of control as defined by this provision occurs when a shareholder or a group of shareholders<br />
acting jointly, or third parties acting jointly, acquire at least 30 % of the voting rights in a company,<br />
or if any of the aforementioned can exert a controlling influence on the company in another<br />
manner. A controlling influence may also exist if one or several jointly acting shareholders or third<br />
parties hold more than half of the voting stock represented at three consecutive Annual General<br />
Meetings. The aforementioned provisions do not apply if the change of control puts the control of<br />
the company in the hands of individual or jointly acting cities or communities or companies which<br />
are majority-owned by an entity under public law in the Federal Republic of Germany.<br />
On termination of their employment contracts, Executive Board members receive a one-off payment<br />
in the amount of the compensation due until the end of the duration of the contract originally<br />
agreed, which shall not be higher than three times their total contractual annual compensation and<br />
shall not be less than twice their total contractual annual compensation.<br />
As regards benefits, effective as of the end of the employment contract’s agreed duration, Executive<br />
Board members are treated as if the company had not extended their employment contracts at that<br />
time, without there being a material reason in the sense of Section 626 of the German Civil Code<br />
(BGB).<br />
The Chairman of the Executive Board, Dr. Jürgen Großmann, was granted a special right of termination<br />
before the amendment to the German Corporate Governance Code with effect from June<br />
6, 2008. On exercise of his contractually secured special right of termination, Dr. Großmann shall<br />
receive a one-time payment that covers all of the remuneration due until the expiry of his employment<br />
contract, including the amount contractually agreed instead of a pension commitment.<br />
In the event of a change of control, all the performance shares granted to the Executive Board and<br />
entitled executives shall expire. Instead, a compensatory payment shall be made, which shall be determined<br />
when the takeover offer is made. The amount shall be in line with the price paid for RWE<br />
shares at the time of the takeover. This shall then be multiplied by the final number of performance<br />
shares. Performance shares shall also expire in the event of a merger with another company. In this<br />
case, the compensatory payment shall be calculated based on the expected value of the performance<br />
shares at the time of the merger. This expected value shall be multiplied by the number of performance<br />
shares granted, pro-rated up to the date of the merger.<br />
Severance cap. If an Executive Board mandate is otherwise terminated early without due cause,<br />
Executive Board members shall receive a severance payment of no more than two total annual compensations<br />
and no more than the compensation due until the end of the employment contract. Total<br />
annual compensation is the sum resulting from the fixed component and the value of payment in<br />
kind at the time of the termination as well as the company bonus and the personal bonus of the previous<br />
financial year. This provision applies to all new employment contracts and contract extensions<br />
and for the first time to the conclusion of Dr. Birnbaum’s employment contract.
130 Compensation report RWE Annual Report <strong>2009</strong><br />
Supervisory Board compensation<br />
The compensation of the Supervisory Board is set forth in the Articles of Incorporation and is determined<br />
by the Annual General Meeting. Supervisory Board members receive a fixed compensation of<br />
€40,000 per fiscal year for their services after each fiscal year. The compensation increases by €225<br />
for every €0.01 by which the dividend exceeds €0.10 per common share. The Chairperson of the Supervisory<br />
Board receives three times and the Deputy Chairperson receives twice the aforementioned<br />
amount. If a committee has been active at least once in a fiscal year, committee members receive<br />
one-and-a-half times the compensation and the committee chairperson receives twice the compensation.<br />
If a member of the Supervisory Board holds several offices on the Supervisory Board of RWE AG<br />
concurrently, he or she receives compensation only for the highest-paid position. Out-of-pocket expenses<br />
are refunded.<br />
Supervisory Board compensation<br />
<strong>2009</strong> base<br />
compensation<br />
<strong>2009</strong> committee<br />
compensation<br />
€ ‘000 Fixed Variable Fixed Variable <strong>2009</strong> 2008<br />
Dr. Thomas R. Fischer, Chairman until April 30, <strong>2009</strong> 66 127 0 0 193 417<br />
Dr. Manfred Schneider, Chairman since May 1, <strong>2009</strong> 100 192 0 0 292 209<br />
Frank Bsirske, Deputy Chairman 80 154 0 0 234 278<br />
Dr. Paul Achleitner 40 77 20 38 175 209<br />
Werner Bischoff 40 77 20 38 175 209<br />
Carl-Ludwig von Boehm-Bezing 40 77 40 77 234 278<br />
Heinz Büchel 40 77 20 38 175 209<br />
Dieter Faust 40 77 20 38 175 209<br />
Andreas Henrich 40 77 0 0 117 104<br />
Heinz-Eberhard Holl 40 77 20 38 175 209<br />
Hans-Peter Lafos (since Oct 28, <strong>2009</strong>) 7 14 0 0 21 0<br />
Dr. Gerhard Langemeyer 40 77 20 38 175 209<br />
Dagmar Mühlenfeld 40 77 20 38 175 209<br />
Dr. Wolfgang Reiniger 40 77 0 0 117 139<br />
Günter Reppien 40 77 20 38 175 209<br />
Karl-Heinz Römer (until Sep 30, <strong>2009</strong>) 30 57 0 0 87 139<br />
Dagmar Schmeer 40 77 20 38 175 143<br />
Dr.-Ing. Ekkehard D. Schulz 40 77 20 38 175 209<br />
Uwe Tigges 40 77 20 38 175 209<br />
Prof. Karel Van Miert (until June 22, <strong>2009</strong>) 19 36 0 0 55 139<br />
Manfred Weber 40 77 0 0 117 11<br />
Dr. Dieter Zetsche (since July 16, <strong>2009</strong>) 19 35 0 0 54 0<br />
Total 921 1,770 260 495 3,446 3,947<br />
Total<br />
In total, the emoluments of the Supervisory Board amounted to €3,446,000 in fiscal <strong>2009</strong>. Additionally,<br />
certain Supervisory Board members were paid compensation totalling €296,000 for exercising<br />
mandates at subsidiaries.
<strong>2009</strong> in brief To <strong>our</strong> investors Review of operations Our responsibility<br />
Responsibility statement Consolidated financial statements Further information<br />
Workforce 131<br />
2.4<br />
WORKFORCE<br />
The demands placed on modern personnel policy are high: find and recruit talent, develop<br />
em ployees, offer them flexibility, and retain them long-term. Another task became a major item<br />
on RWE’s agenda in fiscal <strong>2009</strong>: the integration of Essent staff. Only if we succeed in this will we<br />
be able to achieve the goals we set <strong>our</strong>selves when we acquired the Dutch-based energy utility.<br />
Integration of Dutch utility Essent. Combining two companies always brings about great change for<br />
their employees, especially when they come from different countries. This is why we did not leave<br />
anything to chance when we acquired Essent. Immediately after announcing the transaction in January<br />
of <strong>2009</strong>, we prepared plans for integration, which we started to implement directly after the deal<br />
closed on September 30, <strong>2009</strong>. One of the most urgent tasks we faced was to appoint suitable candidates<br />
to executive positions at Essent. We have accomplished this for the top three management<br />
levels. Most of these executives had already been working for Essent. In addition, we had to integrate<br />
the personnel of RWE’s existing Dutch sales company into Essent’s organi sational structure. We<br />
also made good progress in this regard. However, the biggest challenge is to integrate Essent and its<br />
employees into the RWE Group both in organisational and cultural terms. Essent has already adopted<br />
existing RWE standards for personnel-related issues such as talent management, executive compensation<br />
and personnel controlling. Essent managers already attend group wide events and training<br />
sessions on a regular basis. Furthermore, employees share ideas and experiences with the other RWE<br />
companies.<br />
Pooling of executive support services, continued education and advanced training in the<br />
RWE Group. In 2008, we initiated a comprehensive analysis of <strong>our</strong> major business processes. Our<br />
goal was to identify functions and processes which we could make more efficient and cost-effective.<br />
Based on the results of this analysis, we decided to centralise executive support services. This was<br />
done with effect from September 1, <strong>2009</strong>. The new unit is called Group Executive Services and is<br />
the point of contact for all RWE companies seeking advice on contract drafting, compensation and<br />
payroll accounting. Human res<strong>our</strong>ce development, which will be handled by the newly established<br />
Development Centre in co-operation with the Group companies’ personnel departments, was also<br />
centralised. It provides customised development as well as continued education and advanced training<br />
measures, and is also in charge of the groupwide executive programmes. By taking this step,<br />
we are improving the efficiency and focus of <strong>our</strong> employee development operations in a more costeffective<br />
way.<br />
Succession planning. Every entrepreneur wants to make sure their business is in order before handing<br />
it over. What is a matter of c<strong>our</strong>se for medium-sized enterprises also applies to big companies<br />
like RWE. Every year, we identify employees who have the potential to succeed any one of around<br />
350 executives at the upper management levels. In addition, we set up candidate pools for specific<br />
fields of activity. The basis for this is the regular assessment of those of <strong>our</strong> employees who have
132 Workforce RWE Annual Report <strong>2009</strong><br />
leadership skills. The executive boards of RWE AG and the Group companies nominate successor<br />
candidates across all companies for key management positions at the Group’s annual succession conferences.<br />
Last fiscal year, we filled more than 90 % of the management positions that had become<br />
vacant with suitable internal candidates.<br />
No corners cut in training despite economic crisis. We ensure that the Group can continue to meet<br />
its need for qualified young professionals through <strong>our</strong> apprenticeships. In addition to the curriculum,<br />
<strong>our</strong> training programmes offer a variety of ways to gain further qualifications. Young people can<br />
participate in challenging projects or complete part of their apprenticeships in one of RWE‘s Group<br />
companies outside Germany. We also enable and promote the combination of apprenticeships with a<br />
c<strong>our</strong>se of study in a variety of fields. RWE is currently training just under 3,100 adolescents for more<br />
than 30 occupations. Despite the economic crisis, this matches the numbers achieved in preceding<br />
years. In <strong>2009</strong>, about 1,000 young people embarked on a training programme with us. We offer<br />
three times as many apprenticeships as required to cover <strong>our</strong> own needs.<br />
Employee shares still in high demand. We want the company’s success to pay off for <strong>our</strong> employees<br />
as well. Part of their compensation reflects that. In addition, we issue employee shares, enabling <strong>our</strong><br />
employees in Germany to take a share in the company under affordable conditions. Last year,<br />
21,900 staff members subscribed a total of 406,000 shares. The programme was thus taken advantage<br />
of by 52 % of the workforce entitled to take part in it. Our employees currently own about<br />
1 % of RWE’s subscribed capital.<br />
Accident rate declines for the eighth straight year. We want <strong>our</strong> employees to return to their homes<br />
just as healthy as when they leave for work. To live up to this ambition, we work on continuously<br />
improving occupational safety and health protection within the RWE Group. By 2012, we intend to<br />
have passed an important milestone en route to achieving “zero accident” status, reducing the number<br />
of work-related accidents for every million working h<strong>our</strong>s to less than 3.0. In fiscal <strong>2009</strong>, the<br />
ratio was 4.3, declining for the eighth year in a row. These figures cover all accidents that occur<br />
when staff members are doing their work or are on business trips and that result in more than one<br />
day of missed work. The number of severe accidents decreased, dropping from 48 (2006) to eight<br />
(<strong>2009</strong>). This is a sign of RWE’s growing safety culture. To make even more progress in this area, we<br />
launched the groupwide “Sicher voRWEg” campaign in early 2008. Its objective is to spread the<br />
principles of occupational safety and health protection throughout the Group and to make routine<br />
operational processes safer. We held over 150 workshops so that executive board members, managing<br />
directors, managers and expert personnel could become more familiar with the issue. Furthermore,<br />
a number of measures were initiated to improve occupational safety. We are working on involving<br />
all <strong>our</strong> employees as well as those of <strong>our</strong> partner companies who are working for us in the<br />
programme. We also took a major organisational step: As of September 1, <strong>2009</strong>, we established the<br />
“Occu pational Medicine/Occupational Health Care Management” and “Occupational Safety” departments<br />
as groupwide centres of competence.
<strong>2009</strong> in brief To <strong>our</strong> investors Review of operations Our responsibility<br />
Responsibility statement Consolidated financial statements Further information<br />
Sustainability 133<br />
2.5<br />
SUSTAINABILITY<br />
There is no alternative to sustainable business development, especially for power utilities such as<br />
RWE. Our business model has been designed for the long term. When we invest in power plants<br />
and networks, <strong>our</strong> plans cover decades. We depend on public acceptance to ensure that these<br />
projects are successful. Listening to the issues and expectations of the public and, wherever possible,<br />
aligning <strong>our</strong> goals with their views is a core element of <strong>our</strong> business model.<br />
Ten fields of action oriented towards sustainability. Our corporate responsibility (CR) strategy<br />
focuses on ten fields of action, including such topics as climate protection, energy efficiency,<br />
security of supply and demographic change (see below). These areas contain the major challenges<br />
to managing a company reliably and with a long-term orientation. We set up a comprehensive CR<br />
management system in order to implement <strong>our</strong> strategy. The departments of the Group companies<br />
executing <strong>our</strong> CR strategy are responsible for these activities. Co-ordination is handled by corporate<br />
headquarters. We intend to make CR a fixture in all business processes. As illustrated by the following<br />
commentary, we made good progress towards this goal. More detailed information is provided in<br />
<strong>our</strong> sustainability report, which will be released in April 2010. The publi cation is called “Our Responsibility.<br />
Report <strong>2009</strong>” and can be accessed online at www.rwe.com/responsibility. This internet page<br />
contains further information on <strong>our</strong> goals and measures in the field of sustain ability.<br />
(1) Climate protection. By investing billions of euros in modernising <strong>our</strong> power plant portfolio and<br />
expanding <strong>our</strong> renewable energy base, we are making an important contribution to conserving natural<br />
res<strong>our</strong>ces and protecting the climate. We aim to substantially reduce the CO 2 intensity of <strong>our</strong><br />
power plant portfolio. By taking physical and financial measures, we aim to reduce <strong>our</strong> CO 2 exposure<br />
to that of the average competitor in <strong>our</strong> markets by no later than 2020. We assume that the emission<br />
factor in the markets in which we are active will generally be 0.45 metric tons of CO 2 per MWh of<br />
electricity generated by 2020. Last year, RWE emitted 0.80 metric tons per MWh.<br />
(2) Energy efficiency. We associate goals such as climate protection and res<strong>our</strong>ce conservation not<br />
only with the production of energy, but also with its use. Efficiency is crucial here as well. We have<br />
pooled the work we do to help <strong>our</strong> <strong>customers</strong> save energy in RWE Effizienz GmbH, which was established<br />
on July 1, <strong>2009</strong>. These activities range from LPG for cars (Liquefied Petroleum Gas) and smart<br />
meters to the “house of the future.” Furthermore, the company set up a German internet portal<br />
at www.energiewelt.de, which includes a number of pointers and informs readers of subsidy programmes<br />
and manufacturer offerings. Another of RWE Effizienz GmbH’s mainstays is the promotion<br />
of electric vehicles. Even today, with the current energy mix, electric cars are already more gentle on<br />
the climate than cars powered by conventional internal combustion engines. They enable travel<br />
using completely CO 2 -free energy. In September of 2008, we launched a joint-venture project to<br />
promote electric vehicles in co-operation with Daimler. We plan to put 100 electric Smart cars on the<br />
roads of Berlin, with RWE setting up the necessary infrastructure. We are rolling out similar projects<br />
in other major German cities and in Warsaw, Poland. In order to build a nationwide network of public
134 Sustainability RWE Annual Report <strong>2009</strong><br />
and private charging stations, we joined forces with the German automobile assistance club ADAC,<br />
car park operator APCOA, car rental company SIXT and Siemens. By the end of <strong>2009</strong>, we had already<br />
commissioned over 100 charging stations in Germany. We also aim to reduce the emissions of <strong>our</strong><br />
own vehicle fleet. Our plan is to lower its CO 2 emissions by 20 % by 2012. To this end, we introduced<br />
a “Green Company Car Policy” in <strong>2009</strong>, for which we received the environmental “Green Fleet<br />
Award.”<br />
(3) Security of supply. Our <strong>customers</strong> rely on the energy they need being available around the clock<br />
now and in the future. An important lever for improving security of supply is the increase of crossborder<br />
transmission capacity. We have already reported on the Nabucco gas pipeline project that we<br />
participate in (see page 52). Furthermore, we plan to build a new German/Dutch high-voltage<br />
connection in co-operation with TenneT TSO. The interconnector is to increase transmission capacity<br />
between the two countries from 3,800 MW at present to a maximum of 5,800 MW. Last year, we<br />
completed <strong>our</strong> preparations for the approval procedure.<br />
(4) Pricing. More and more, public debate deals with energy costs. Our <strong>customers</strong> expect us to have<br />
fair prices and are increasingly willing to switch providers. By offering innovative products tailored to<br />
the needs of homes and commercial operations, we succeeded in <strong>2009</strong> in defending <strong>our</strong> position in<br />
the market, despite an increase in competition. Our “ProKlima” product is very popular, guaranteeing<br />
a fixed tariff over three years. Residential <strong>customers</strong> are thus given planning security and<br />
flexibility as they can cancel the agreement on an annual basis. What also sets ProKlima apart is that<br />
all the electricity sold through it is generated by hydroelectric and nuclear power plants and is therefore<br />
nearly CO 2 -free. By the end of <strong>2009</strong>, more than 400,000 <strong>customers</strong> had already opted for this<br />
product.<br />
(5) Social responsibility. As we are an energy utility, we have strong links with the communities at<br />
<strong>our</strong> sites, some of which have been in existence for many years. It is therefore a matter of c<strong>our</strong>se for<br />
us to champion social issues around <strong>our</strong> sites. <strong>For</strong> example, RWE is a main sponsor of the “European<br />
Capital of Culture RUHR.2010.” At the beginning of <strong>2009</strong>, the RWE Foundation began work, which<br />
pools <strong>our</strong> charitable activities and, among other things, continues the work done by the former<br />
RWE Youth Foundation. It is endowed with a capital stock of €56 million and mainly promotes the<br />
education, culture, and social integration of young people. Through <strong>our</strong> “RWE Companius” initiative,<br />
we support the strong effort put in by RWE employees for social causes. Since <strong>2009</strong>, RWE Companius<br />
has been set up throughout the Group. Last year, we spent €2.3 million to promote 2,289 projects.
<strong>2009</strong> in brief To <strong>our</strong> investors Review of operations Our responsibility<br />
Responsibility statement Consolidated financial statements Further information<br />
Sustainability 135<br />
(6) Demographic development. In most of the European markets in which RWE is active, low birth<br />
rates are causing the population’s average age to rise. This poses a variety of challenges for companies<br />
such as RWE. Given the Group’s current age structure, the number of employees leaving the<br />
company due to attrition can be expected to rise considerably after 2015. <strong>For</strong> us, this translates into<br />
a loss of both knowledge and experience. In addition, the number of suitable up-and-coming staff<br />
will decline steadily: Recruitment has already become much more competitive than it was several<br />
years ago. With this in mind, we develop programmes to systematically identify future personnel<br />
needs. The results form the basis for planning staff deployment according to <strong>our</strong> needs and ensuring<br />
the continued availability of qualified employees. We already take advantage of many ways to win<br />
young talent for RWE and create a working environment that meets their expectations. This includes<br />
striking a healthy work-life balance. The fact that a rising number of RWE companies receive certification<br />
from the German “berufundfamile” (“workandfamily”) audit proves that we are charting the<br />
right c<strong>our</strong>se in this respect. In the last few years, the audit has become a recognised seal of highquality<br />
family-conscious personnel policy, under the patronage of the German family and economics<br />
ministries.<br />
(7) Supply chain. Safeguarding human rights, humane working conditions and the fight against<br />
corruption may be a matter of c<strong>our</strong>se for us, but does the same hold true for <strong>our</strong> suppliers Our<br />
sense of responsibility is not limited to the confines of <strong>our</strong> plant premises. By implementing a supply<br />
chain management system, we want to ensure that <strong>our</strong> business relationships with external partners<br />
adhere to <strong>our</strong> groupwide code of conduct. According to the code, we are forbidden from maintaining<br />
business relationships with suppliers who are publicly known to infringe the fundamental ethical<br />
principles set forth by the UN “Global Compact” initiative. We use groupwide database systems to<br />
manage <strong>our</strong> suppliers within the scope of standard purchasing. We have been systematically reviewing<br />
the procurement of fuel, especially hard coal, since 2007. The risk that suppliers may neglect fundamental<br />
environmental and social standards is usually much lower in the procurement of plants and<br />
complex components, because they almost exclusively come from OECD member states.<br />
(8) Innovation. We can only achieve <strong>our</strong> goals in the fields of climate protection, energy efficiency<br />
and security of supply if we have access to cutting-edge technology. This is why research and development<br />
(R&D) is so important to us. Last year, <strong>our</strong> R&D costs amounted to €110 million. The chapter<br />
called “Innovation” on pages 92 et seqq. provides detailed information on <strong>our</strong> activities in this field.<br />
(9) Occupational health and safety. We also aim to accomplish a lot in this area: Our aim is to<br />
reduce the number of work-related lost time incidents to 3.0 for every million work h<strong>our</strong>s by 2012. In<br />
<strong>2009</strong>, the accident rate was 4.3, recording a drop for the eighth year in a row. We have reported on<br />
<strong>our</strong> targets and measures for improving occupational safety and health on page 132.
136 Sustainability RWE Annual Report <strong>2009</strong><br />
(10) Environmental protection. Environmentally friendly behavi<strong>our</strong> is a fundamental precondition for<br />
achieving public acceptance and for obtaining operating permits for <strong>our</strong> plants and networks. In<br />
<strong>2009</strong>, once again, RWE companies did not commit any material regulatory violations. In addition, we<br />
earmarked substantial funds for environmental protection. More than half of this was spent on<br />
climate protection. These funds were primarily used to modernise <strong>our</strong> power plants and expand <strong>our</strong><br />
renewable electricity generation base. A substantial share of <strong>our</strong> environmental expenditure was<br />
dedicated to clean air and above all the operation of flue gas desulphurisation units. Action we take<br />
to protect nature and conserve landscapes mainly encompass the recultivation of lignite mining sites.<br />
Environmental expenditure<br />
Cost Capital expenditure Total<br />
€ million<br />
<strong>2009</strong> 2008 <strong>2009</strong> 2008 <strong>2009</strong> 2008<br />
Clean air 242 265 103 88 345 353<br />
Nature and landscape protection 75 79 12 15 87 94<br />
Water protection 105 192 22 15 127 207<br />
Waste disposal 172 168 – 8 172 176<br />
Noise abatement 5 12 5 2 10 14<br />
Brownfield sites, soil contamination 5 5 1 – 6 5<br />
Climate protection 162 98 1,320 1,168 1,482 1,266<br />
Total 766 819 1,463 1,296 2,229 2,115<br />
RWE again qualifies for two acclaimed sustainability indices. Last year, RWE received two major<br />
awards in the field of sustainable business management and climate protection. We were included<br />
in the “Carbon Disclosure Leadership Index” for the third time, having been included in 2006 and<br />
2008. This hon<strong>our</strong> is in recognition of <strong>our</strong> comprehensive reporting on <strong>our</strong> CO 2 emissions and<br />
climate-protection strategy. The index is put together by the “Carbon Disclosure Project” (CDP)<br />
investor group. Furthermore, RWE was included in the Dow Jones Sustainability Index (DJSI) for a<br />
further year. We are the only German utility to have been included in the DJSI without interruption<br />
since its inception in 1999. The Dow Jones Sustainability indices are established and published by<br />
SAM in co-operation with Dow Jones Indexes and STOXX Limited. They are widely recognised as<br />
the world’s prime index group for corporate performance in the field of sustainability.<br />
Sustainability indicators. Any strategy is only as good as its implementation, and this is evidenced<br />
by figures. The following is an overview of performance indicators, the development of which we<br />
ascribe significant importance. They are divided into categories, i.e. environment, society and corporate<br />
governance. The selection of indicators is in line with the recommendations of the Society<br />
of Investment Professionals in Germany (DVFA).
<strong>2009</strong> in brief To <strong>our</strong> investors Review of operations Our responsibility<br />
Responsibility statement Consolidated financial statements Further information<br />
Sustainability 137<br />
Field Performance indicator <strong>2009</strong> 2008 2007<br />
Environment RWE power plant portfolio 1<br />
NO X emissions 2 g/kWh 0.67 0.67 0.76<br />
SO 2<br />
emissions 2 g/kWh 0.32 0.39 0.57<br />
Particulate emissions 2 g/kWh 0.023 0.028 0.034<br />
Ash 2 thousand mt 5,637 6,406 6,687<br />
Gypsum 2 thousand mt 1,322 1,533 1,671<br />
Primary energy consumption billion kWh 358.8 396.0 411.7<br />
Water consumption 2,3 m 3 /MWh 1.74 1.49 1.69<br />
Scope 1 CO 2 emissions 4 million mt 133.7 145.0 152.5<br />
Specific CO 2 emissions mt/MWh 0.795 0.749 0.861<br />
Total power plant portfolio 5<br />
Scope 1 CO 2 emissions 4 million mt 149.1 172.1 187.1<br />
Specific CO 2 emissions mt/MWh 0.796 0.768 0.866<br />
Scope 3 CO 2 emissions 6 million mt 138.5 135.4 134.9<br />
Capital expenditure of the renewables division € million 733 1,102 – 7<br />
Share of the Group’s electricity generation<br />
accounted for by renewables % 3.5 8 2.4 2.4<br />
Society Employees 9 70,726 65,908 63,439<br />
Share of women in the company % 26.1 25.6 25.2<br />
Share of women in executive positions 10 % 9.0 8.9 8.9<br />
Fluctuation rate % 8.7 8.8 9.1<br />
Training days per employee (Germany) 4.8 4.6 4.2<br />
Health ratio % 95.4 95.4 95.6<br />
Lost-time incident frequency LTIF 11 4.3 5.3 6.1<br />
Fatal work-related accidents 12 5 12 9<br />
Corporate governance Share of the RWE Group’s revenue earned in<br />
countries with a high or very high risk<br />
of corruption 13 % 12.7 12.9 11.8<br />
R&D costs € million 110 105 74<br />
1 Power plants under RWE ownership.<br />
2 Figures for <strong>2009</strong> exclude the Netherlands/Belgium and Hungary.<br />
3 Difference between power plant water withdrawals and returns to rivers and other surface waters; excluding power plants with sea water cooling.<br />
4 Scope 1: direct emissions from in-house s<strong>our</strong>ces.<br />
5 Including power stations not under RWE ownership, but that we can deploy at <strong>our</strong> discretion on the basis of long-term agreements.<br />
6 Scope 3: CO 2<br />
emissions of electricity purchases (net) and of gas sales.<br />
7 RWE Innogy was established in February 2008.<br />
8 Electricity generation based on wind (2.2 TWh), hydro (3.4 TWh) and biomass (0.9 TWh).<br />
9 Converted to full-time positions.<br />
10 Figures for <strong>2009</strong> exclude Essent.<br />
11 Sum of all accidents for every million h<strong>our</strong>s worked. Excluding employees of third-party companies.<br />
12 Including employees of third-party companies.<br />
13 Countries rated lower than six on a scale of zero to ten in the Corruption Perceptions Index by the anti-corruption organisation<br />
Transparency International, with ten corresponding to the lowest risk of corruption.
138 Responsibility statement<br />
RWE Annual Report <strong>2009</strong><br />
3.0<br />
RESPONSIBILITY STATEMENT<br />
To the best of <strong>our</strong> knowledge, and in accordance with the applicable reporting principles, the consolidated<br />
financial statements give a true and fair view of the assets, liabilities, financial position and<br />
profit or loss of the Group, and the Group review of operations includes a fair review of the development<br />
and performance of the business and the position of the Group, together with a description of<br />
the principal opportunities and risks associated with the expected development of the Group.<br />
Essen, 12 February 2010<br />
The Executive Board<br />
Großmann Birnbaum Fitting<br />
Jobs<br />
Pohlig<br />
Schmitz
139<br />
4.0 CONSOLIDATED FINANCIAL STATEMENTS<br />
Operating result<br />
up 4 % to<br />
¤7,090 million<br />
Earnings per share<br />
rise by more than 40 % to<br />
¤6.70<br />
CONSOLIDATED FINANCIAL STATEMENTS<br />
Leading energy trader in Europe. With some 1,000 employees at f<strong>our</strong> locations,<br />
RWE Supply & Trading is responsible for all of the RWE Group’s energy trading<br />
and gas procurement activities on the European wholesale markets. Above and<br />
beyond this, <strong>our</strong> traders also ensure that we market <strong>our</strong> electricity and gas<br />
production as effectively as possible.
140 Income statement<br />
RWE Annual Report <strong>2009</strong><br />
4.1 INCOME STATEMENT<br />
€ million Note <strong>2009</strong> 2008<br />
Revenue (including natural gas tax/electricity tax) (1) 47,741 48,950<br />
Natural gas tax/electricity tax (1) 1,550 1,450<br />
Revenue (1) 46,191 47,500<br />
Changes in finished goods and work in progress 44 112<br />
Other own work capitalised 210 92<br />
Other operating income (2) 1,610 933<br />
Cost of materials (3) 29,838 32,686<br />
Staff costs (4) 4,610 4,415<br />
Depreciation, amortisation, and impairment losses (5) 2,357 2,246<br />
Other operating expenses (6) 3,924 3,403<br />
Income from operating activities of continuing operations 7,326 5,887<br />
Income from investments accounted for using the equity method (7) 131 372<br />
Other income from investments (7) 131 82<br />
Financial income (8) 1,699 1,862<br />
Finance costs (8) 3,689 3,337<br />
Income from continuing operations before tax 5,598 4,866<br />
Taxes on income (9) 1,858 1,423<br />
Income from continuing operations 3,740 3,443<br />
Income from discontinued operations 91 -567<br />
Income 3,831 2,876<br />
of which: minority interest 260 318<br />
of which: net income/income attributable to RWE AG shareholders 3,571 2,558<br />
Basic and diluted earnings per common and preferred share in € (29) 6.70 4.75<br />
of which: from continuing operations in € (6.58) (5.96)<br />
of which: from discontinued operations in € (0.12) (-1.21)
<strong>2009</strong> in brief To <strong>our</strong> investors Review of operations Our responsibility<br />
Responsibility statement Consolidated financial statements Further information<br />
Statement of recognised income and expenses 141<br />
4.2 STATEMENT OF RECOGNISED INCOME AND EXPENSES 1<br />
€ million Note <strong>2009</strong> 2008<br />
Income 3,831 2,876<br />
Currency translation adjustment 8 -70<br />
Fair valuation of financial instruments available for sale (30) 383 -230<br />
Fair valuation of financial instruments used for hedging purposes (30) 122 555<br />
Other comprehensive income of investments accounted for using the equity method (pro rata) 36<br />
Actuarial gains and losses of defined benefit pension plans and similar obligations (25) -788 -859<br />
Other comprehensive income -239 -604<br />
Total comprehensive income 3,592 2,272<br />
of which: attributable to RWE AG shareholders (3,442) (1,851)<br />
of which: attributable to minority interests (150) (421)<br />
1 Figures stated after taxes.
142 Balance sheet<br />
RWE Annual Report <strong>2009</strong><br />
4.3 BALANCE SHEET<br />
Assets<br />
Note Dec 31, <strong>2009</strong> Dec 31, 2008<br />
€ million<br />
Non-current assets<br />
Intangible assets (10) 17,320 11,202<br />
Property, plant and equipment (11) 28,627 21,762<br />
Investment property (12) 182 180<br />
Investments accounted for using the equity method (13) 3,736 3,268<br />
Other non-current financial assets (14) 709 681<br />
Financial receivables (15) 1,118 1,314<br />
Other receivables and other assets (16) 2,488 1,192<br />
Income tax assets (17) 507 555<br />
Deferred taxes (18) 1,876 1,609<br />
56,563 41,763<br />
Current assets<br />
Inventories (19) 3,115 2,540<br />
Financial receivables (15) 3,422 4,419<br />
Trade accounts receivable (20) 9,530 10,415<br />
Other receivables and other assets (16) 13,784 16,106<br />
Income tax assets 660 493<br />
Marketable securities (21) 3,290 7,735<br />
Cash and cash equivalents (22) 3,074 1,249<br />
Assets held for sale 8,710<br />
36,875 51,667<br />
93,438 93,430<br />
Equity and Liabilities<br />
Note Dec 31, <strong>2009</strong> Dec 31, 2008<br />
€ million<br />
Equity (23)<br />
RWE AG shareholders’ interest 12,792 11,587<br />
Minority interest 925 1,553<br />
13,717 13,140<br />
Non-current liabilities<br />
Provisions (25) 22,315 21,072<br />
Financial liabilities 1 (26) 17,019 11,154<br />
Other liabilities (28) 3,972 2,984<br />
Deferred taxes (18) 2,327 1,583<br />
45,633 36,793<br />
Current liabilities<br />
Provisions (25) 5,829 5,685<br />
Financial liabilities (26) 3,127 2,329<br />
Trade accounts payable (27) 9,697 11,031<br />
Income tax liabilities 218 112<br />
Other liabilities (28) 15,217 17,626<br />
Liabilities held for sale 6,714<br />
34,088 43,497<br />
93,438 93,430<br />
1 Of which interest-bearing: €16,802 million (previous year: €10,983 million).
<strong>2009</strong> in brief To <strong>our</strong> investors Review of operations Our responsibility<br />
Responsibility statement Consolidated financial statements Further information<br />
Cash flow statement 143<br />
4.4 CASH FLOW STATEMENT<br />
€ million Note (33) <strong>2009</strong> 2008<br />
Income 3,831 2,876<br />
Depreciation, amortisation, impairment losses/write-backs 2,464 2,381<br />
Changes in provisions -10 794<br />
Changes in deferred taxes 97 778<br />
Income from disposal of non-current assets and marketable securities 69 196<br />
Other non-cash income/expenses -357 141<br />
Changes in working capital -795 1,687<br />
Cash flows from operating activities of continuing operations 5,299 8,853<br />
Cash flows from operating activities of discontinued operations 11 473<br />
Cash flows from operating activities 5,310 9,326<br />
Intangible assets/property, plant and equipment/investment property<br />
Capital expenditure -5,913 -4,454<br />
Proceeds from disposal of assets 103 106<br />
Acquisitions and investments<br />
Capital expenditure -8,801 -1,155<br />
Proceeds from disposal of assets/divestitures 2,328 1,071<br />
Changes in marketable securities and cash investments 4,427 2,179<br />
Cash flows from investing activities of continuing operations<br />
(before transfer to contractual trust arrangements) -7,856 -2,253<br />
Transfer to contractual trust arrangements -470 -1,331<br />
Cash flows from investing activities of continuing operations<br />
(after transfer to contractual trust arrangements) -8,326 -3,584<br />
Cash flows from investing activities of discontinued operations -78 -767<br />
Cash flows from investing activities -8,404 -4,351<br />
Net change in equity (incl. minority interest) 186 -2,497<br />
Dividends paid to RWE AG shareholders and minority interests -2,592 -2,005<br />
Issuance of financial debt 11,592 6,641<br />
Repayment of financial debt -4,347 -8,046<br />
Cash flows from financing activities of continuing operations 4,839 -5,907<br />
Cash flows from financing activities of discontinued operations 65 290<br />
Cash flows from financing activities 4,904 -5,617<br />
Net cash change in cash and cash equivalents 1,810 -642<br />
Effects of changes in foreign exchange rates and other changes in value on cash and cash equivalents 13 -35<br />
Net cash change in cash and cash equivalents from discontinued operations 2 4<br />
Net change in cash and cash equivalents 1,825 -673<br />
Cash and cash equivalents at beginning of the reporting period 1,249 1,922<br />
Cash and cash equivalents at end of the reporting period 3,074 1,249
144 Statement of changes in equity<br />
RWE Annual Report <strong>2009</strong><br />
4.5 STATEMENT OF CHANGES IN EQUITY<br />
Statement of<br />
Changes<br />
in Equity<br />
€ million<br />
Note (23)<br />
Subscribed<br />
capital of<br />
RWE AG<br />
Additional<br />
paid-in<br />
capital of<br />
RWE AG<br />
Retained<br />
earnings<br />
and<br />
distributable<br />
profit<br />
Own<br />
shares<br />
Accumulated other<br />
comprehensive income<br />
Currency<br />
translation<br />
adjustments<br />
Fair value measurement<br />
of financial<br />
instruments<br />
Available<br />
for sale<br />
Used for<br />
hedging<br />
purposes<br />
RWE AG<br />
shareholders’<br />
interest<br />
Minority<br />
interest<br />
Balance at Jan 1, 2008 1,440 1,288 11,077 277 -18 -139 13,925 734 14,659<br />
Capital paid in 3 3<br />
Settlement of conciliation<br />
proceedings -130 130<br />
Share buybacks -2,500 -2,500 -2,500<br />
Dividends paid 1 -1,689 -1,689 -190 -1,879<br />
Income 2,558 2,558 318 2,876<br />
Other comprehensive<br />
income -876 -165 -256 590 -707 103 -604<br />
Total comprehensive<br />
income 1,682 -165 -256 590 1,851 421 2,272<br />
Other changes 585 585<br />
Balance at Dec 31, 2008 1,440 1,158 11,200 -2,500 112 -274 451 11,587 1,553 13,140<br />
Capital paid in 10 10<br />
Sales of own shares -52 228 176 176<br />
Dividends paid 1 -2,401 -2,401 -121 -2,522<br />
Income 3,571 3,571 260 3,831<br />
Other comprehensive<br />
income -769 115 403 122 -129 -110 -239<br />
Total comprehensive<br />
income 2,802 115 403 122 3,442 150 3,592<br />
Other changes -12 -12 -667 -679<br />
Balance at Dec 31, <strong>2009</strong> 1,440 1,158 11,537 -2,272 227 129 573 12,792 925 13,717<br />
1 Due to the reclassification of minority interests to other liabilities as per IAS 32, the total dividends paid do not correspond to the dividends paid to RWE AG shareholders<br />
and minority interests as reported in the cash flow statement.<br />
Total
<strong>2009</strong> in brief To <strong>our</strong> investors Review of operations Our responsibility<br />
Responsibility statement Consolidated financial statements Further information<br />
Notes 145<br />
4.6 NOTES<br />
Basis of presentation<br />
RWE AG, headquartered at Opernplatz 1, 45128 Essen,<br />
Germany, is the parent company of the RWE Group (“RWE”<br />
or “Group”).<br />
The consolidated financial statements for the period ended<br />
December 31, <strong>2009</strong> were approved for publication on February<br />
12, 2010 by the Executive Board of RWE AG. The statements<br />
were prepared in accordance with the International<br />
Financial Reporting Standards (IFRSs) applicable in the EU, as<br />
well as in accordance with the supplementary accounting regulations<br />
applicable pursuant to Sec. 315a, Para. 1 of the German<br />
Commercial Code (HGB). The previous year’s figures were calculated<br />
according to the same principles.<br />
A statement of changes in equity has been disclosed in<br />
addition to the income statement, the statement of recognised<br />
income and expenses, the balance sheet and the cash flow<br />
statement. The notes to the financial statements also include<br />
segment reporting.<br />
Several balance sheet and income statement items have been<br />
combined in the interests of clarity. These items are stated and<br />
explained separately in the notes to the financial statements.<br />
The income statement is structured according to the nature of<br />
expense method.<br />
The consolidated financial statements have been prepared<br />
in euros. Unless specified otherwise, all amounts are stated in<br />
millions of euros (€ million).<br />
These consolidated financial statements were prepared for the<br />
<strong>2009</strong> fiscal year (January 1 to December 31).<br />
The Executive Board of RWE AG is responsible for the completeness<br />
and accuracy of the consolidated financial statements<br />
and the review of operations of the Group, which is combined<br />
with the review of operations of RWE AG.<br />
Internal control systems, the use of uniform directives throughout<br />
the Group, and <strong>our</strong> programmes for basic and advanced<br />
staff training ensure that the consolidated financial statements<br />
and combined review of operations are adequately prepared.<br />
Compliance with legal regulations and the internal guidelines<br />
as well as the reliability and viability of the control systems are<br />
continuously monitored throughout the Group.<br />
In line with the requirements of the German Corporate Control<br />
and Transparency Act (KonTraG), the Group’s risk management<br />
system enables the Executive Board to identify risks at an early<br />
stage and initiate countermeasures, if necessary.<br />
The consolidated financial statements, the combined review of<br />
operations and the report of the independent auditors are<br />
discussed in detail by the Audit Committee and at the Supervisory<br />
Board’s meeting on financial statements with the independent<br />
auditors present. The results of the Supervisory<br />
Board’s examination are presented in the report of the Supervisory<br />
Board (pages 116 to 120 of this annual report).
146 Notes RWE Annual Report <strong>2009</strong><br />
Scope of consolidation<br />
In addition to RWE AG, the consolidated financial statements<br />
contain all material German and foreign companies which<br />
RWE AG controls directly or indirectly. Material associates and<br />
joint ventures are accounted for using the equity method.<br />
Investments in subsidiaries, joint ventures or associates which<br />
are of secondary importance from a Group perspective are<br />
accounted for in accordance with IAS 39. Subsidiaries which<br />
are not included in the scope of consolidation account for<br />
less than 1 % of the Group’s revenue, income and debt. Subsidiaries<br />
with negative income or equity are generally fully<br />
c onsolidated.<br />
A collective listing of the Group’s investments in accordance<br />
with Sec. 313, Para. 2, Nos. 1 to 4 and Para. 3 of the German<br />
Commercial Code (HGB) will be published in the electronic<br />
Federal Gazette (Bundesanzeiger). Material consolidated in-<br />
vestments, investments accounted for using the equity<br />
method, and other investments are listed on pages 204 to 206<br />
of this annual report.<br />
In the year under review, 69 companies domiciled in Germany<br />
and 98 outside of Germany were consolidated for the first<br />
time. Thirteen companies outside of Germany are no longer<br />
included in the scope of consolidation. Nineteen companies<br />
(of which twelve in Germany) were merged. Thirty-f<strong>our</strong> associates<br />
(of which eight in Germany) were accounted for using the<br />
equity method for the first time. In respect of companies<br />
outside of Germany which were accounted for using the equity<br />
method in the previous year, one company was sold and<br />
one company was fully consolidated. First-time consolidation<br />
and deconsolidation generally take place when control is<br />
transferred.<br />
Scope of consolidation<br />
Germany<br />
Dec 31, <strong>2009</strong><br />
<strong>For</strong>eign<br />
countries<br />
Dec 31, <strong>2009</strong><br />
Total<br />
Dec 31, <strong>2009</strong><br />
Total<br />
Dec 31, 2008<br />
Fully consolidated companies 209 244 453 318<br />
Investments accounted for using the equity method 74 52 126 94<br />
Corporate acquisitions. The following share acquisitions were<br />
significant:<br />
On September 30, <strong>2009</strong>, RWE acquired 100 % of the Dutchbased<br />
power utility Essent N.V.’s voting stock in exchange for a<br />
payment totalling €7,794 million (of which €220 million was<br />
contingent), including €13 million in other transaction costs.<br />
This resulted in recognition of the following assets and liabilities:<br />
Balance-sheet items<br />
of the Essent Group<br />
€ million<br />
IFRS carrying<br />
amounts<br />
prior to<br />
first-time<br />
consolidation<br />
IFRS carrying<br />
amounts<br />
(fair value) upon<br />
first-time<br />
consolidation<br />
Non-current assets 3,913 6,738<br />
Current assets 5,514 5,706<br />
Non-current liabilities 1,089 2,300<br />
Current liabilities 5,525 5,783<br />
Net assets 2,813 4,361<br />
Minority interest -2<br />
Acquisition cost 7,794<br />
Goodwill 3,435<br />
Within the framework of allocating the purchase price, reserves<br />
mainly relate to non-current assets, of which €1,612 million<br />
were assigned to intangible assets and €716 million to property,<br />
plant and equipment.
<strong>2009</strong> in brief To <strong>our</strong> investors Review of operations Our responsibility<br />
Responsibility statement Consolidated financial statements Further information<br />
Notes 147<br />
The goodwill of €3,435 million mainly stems from non-capitalisable<br />
intangible assets related to planned projects and from<br />
other anticipated future economic benefits and synergy effects.<br />
Since first-time consolidation, the Essent Group has contributed<br />
€1,208 million to Group revenue and €74 million to Group<br />
income.<br />
The 51 % stake in Stadtwerke Bremen, which was acquired as a<br />
part of the acquisition of Essent with the intent to sell, has<br />
been sold in the meantime.<br />
The goodwill of €119 million stems mainly from anticipated<br />
future economic benefits.<br />
Since the first-time consolidation, the acquired companies have<br />
contributed €55 million to Group revenue and €4 million to<br />
Group income.<br />
If all business combinations in fiscal <strong>2009</strong> had been completed<br />
as of January 1 of the year, Group income and Group revenue<br />
would have amounted to approximately €4.0 billion and<br />
€50.6 billion, respectively.<br />
Due to the transaction’s complex structure and size, certain accounting<br />
aspects of this business acquisition have not yet been<br />
finalised.<br />
In another transaction, on May 7, <strong>2009</strong>, the stake held in the<br />
Spanish wind farm operator Danta de Energías, S. A., Spain was<br />
increased. RWE Innogy acquired 49.32 % for €48 million, bringing<br />
<strong>our</strong> current ownership interest in Danta de Energías to<br />
98.65 %.<br />
Furthermore, in the segment Sales and distribution networks,<br />
€143 million was paid to acquire 100 % of the shares in<br />
FAVORIT Fernwärme GmbH on June 30, <strong>2009</strong>.<br />
In addition to the Essent Group, acquisitions resulted in recognition<br />
of the following assets and liabilities:<br />
Balance-sheet items of the<br />
other acquired companies<br />
€ million<br />
IFRS carrying<br />
amounts<br />
prior to<br />
first-time<br />
consolidation<br />
IFRS carrying<br />
amounts<br />
(fair value)<br />
upon first-time<br />
consolidation<br />
Non-current assets 108 262<br />
Current assets 48 48<br />
Non-current liabilities 96 143<br />
Current liabilities 40 40<br />
Net assets 20 127<br />
Minority interest -6<br />
Previous value of shareholding -15<br />
Revaluation of previous<br />
shareholding -34<br />
72<br />
Acquisition cost 191<br />
Goodwill 119<br />
With regard to investments accounted for using the equity<br />
method, the following acquisitions took place in fiscal <strong>2009</strong>:<br />
• Enovos International S.A., Luxemb<strong>our</strong>g, acquisition of<br />
19.8 %, €188 million in acquisition costs<br />
• C-Power N.V., Belgium, acquisition of 26.73 %, €44 million in<br />
acquisition costs<br />
The acquisition price of companies consolidated for the first<br />
time was mainly paid in cash or cash equivalents.<br />
Discontinued Operations.<br />
Since initiation of the sale of American Water Works Company<br />
Inc., Wilmington / Delaware, USA, this company has been stated<br />
as a discontinued operation. Following the sale of the first<br />
share tranche in 2008, the remaining 96.74 million shares were<br />
sold in three more tranches in fiscal <strong>2009</strong>, at a price of<br />
US$17.25, US$19.25 and US$21.63 per share. Following sale of<br />
the first tranche during the second quarter of <strong>2009</strong>, the investment<br />
was deconsolidated and stated as an associated company<br />
until its final sale in accordance with IFRS 5, reported as an<br />
“asset held for sale”. As in the previous year, all earnings and<br />
expense components for American Water are shown in “Income<br />
from discontinued operations.”
148 Notes RWE Annual Report <strong>2009</strong><br />
Key figures for the activities of American Water during the period<br />
of full consolidation are presented in the following table:<br />
Key figures for American Water<br />
€ million<br />
Jan-Mar<br />
<strong>2009</strong><br />
Jan-Dec<br />
2008<br />
Revenue 426 1,589<br />
Expenses/income -323 -1,167<br />
Ordinary income from discontinued<br />
operations before tax 103 422<br />
Taxes on income -39 -168<br />
Income 64 254<br />
Fair value adjustments -39 -821<br />
Income from discontinued<br />
operations 25 -567<br />
Moreover, after deconsolidation and loss of the voting majority<br />
in American Water, sales proceeds of €42 million, fair value adjustments<br />
of -€2 million and income from investments of €26<br />
were reported in income from discontinued operations.<br />
In the year under review, another significant event was the disposal<br />
of the shares in Cegedel S.A., Luxemb<strong>our</strong>g, an investment<br />
accounted for using the equity method, which was merged<br />
with other companies to form the new entity Enovos International<br />
S.A., Luxemb<strong>our</strong>g.<br />
Changes in the scope of consolidation (excluding “Assets<br />
and liabilities held for sale”) resulted in the recognition of<br />
€10,437 million in non-current assets (including deferred taxes),<br />
€4,409 million in current assets (excluding cash and cash<br />
equivalents), €589 million in cash and cash equivalents and<br />
€12,202 million in non-current and current liabilities.<br />
The total sales price for divested subsidiaries (excluding<br />
American Water) amounted to €222 million (previous year:<br />
€0 million), which was paid in cash or cash equivalents.<br />
Effects of changes in the scope of consolidation have been<br />
stated in the notes insofar as they are of particular importance.<br />
As of December 31, 2008, €8,432 million in non-current assets,<br />
€278 million in current assets, €5,824 million in non-current liabilities,<br />
and €890 million in current liabilities were attributable<br />
to American Water.
<strong>2009</strong> in brief To <strong>our</strong> investors Review of operations Our responsibility<br />
Responsibility statement Consolidated financial statements Further information<br />
Notes 149<br />
Consolidation principles<br />
The financial statements of German and foreign companies<br />
included in the scope of the Group’s financial statements<br />
are prepared using uniform accounting policies. On principle,<br />
subsidiaries whose fiscal years do not end on the Group’s<br />
balance-sheet date (December 31) prepare interim financial<br />
statements as of this date.<br />
Business combinations are reported according to the purchase<br />
method. Pursuant to this method, capital consolidation takes<br />
place by offsetting the purchase price against the acquired<br />
subsidiaries’ revalued prorated net assets at the time of ac -<br />
quisition. Subsidiaries’ identifiable assets, liabilities and<br />
contingent liabilities are measured at full fair value, regardless<br />
of the amount of the minority interest. Intangible assets are<br />
reported separately from goodwill if they are separable from<br />
the company or if they stem from a contractual or other right.<br />
In accordance with IFRS 3, no new restructuring provisions<br />
are recognised within the scope of the purchase price allocation.<br />
Acquisition costs not allocated to assets, liabilities, or<br />
contingent liabilities are capitalised as goodwill. Negative<br />
goodwill from first-time consolidation is included in income.<br />
Expenses and income as well as receivables and payables<br />
between consolidated companies are eliminated. Intra-group<br />
profits and losses are eliminated.<br />
These consolidation principles also apply to investments<br />
accounted for using the equity method. In these cases, however,<br />
goodwill is not reported separately: it is included in the recognised<br />
value of the investment. Such goodwill is not amortised<br />
either. If impairment losses on the equity value become<br />
necessary, we report such under income from investments accounted<br />
for using the equity method. The financial statements<br />
of investments accounted for using the equity method are also<br />
prepared using uniform accounting policies.<br />
Capitalised goodwill is not amortised: it is tested for impairment<br />
once every year, or more frequently if there are indications<br />
of impairment. In the event of deconsolidation, residual<br />
carrying amounts of capitalised goodwill are taken into account<br />
when calculating income from disposals. If shares in a subsidiary<br />
are sold without losing the ability to control the subsidiary,<br />
the residual carrying amount of capitalised goodwill is derecognised<br />
proportionally with an effect on income.
150 Notes RWE Annual Report <strong>2009</strong><br />
<strong>For</strong>eign currency translation<br />
In their individual financial statements, the companies measure<br />
non-monetary foreign currency transactions at the balancesheet<br />
date using the exchange rate in effect on the date they<br />
were initially recognised. Monetary items are converted using<br />
the exchange rate valid on the balance-sheet date. Exchange<br />
rate gains and losses from the measurement of monetary<br />
balance-sheet items in foreign currency occurring up to the<br />
balance-sheet date are recognised in the income statement<br />
under other operating income or expenses.<br />
Functional foreign currency translation is applied when converting<br />
the financial statements of companies outside of the euro<br />
area. As the principal foreign enterprises included in the<br />
consolidated financial statements conduct their business activities<br />
independently in their national currencies, their balancesheet<br />
items are translated into euros in the consolidated<br />
financial statements using the average exchange rate prevailing<br />
on the balance-sheet date. This also applies for goodwill,<br />
which is viewed as an asset of the economically autonomous<br />
foreign entity. Differences to previous-year translations are<br />
reported in other comprehensive income without an effect on<br />
income. Expense and income items are translated using annual<br />
average exchange rates. When translating the adjusted equity<br />
of foreign companies accounted for using the equity method,<br />
the same procedure is followed.<br />
The following exchange rates (among others) were used as a<br />
basis for foreign currency translations:<br />
Exchange rates<br />
Average<br />
Year-end<br />
in €<br />
<strong>2009</strong> 2008 Dec 31, <strong>2009</strong> Dec 31, 2008<br />
1 US dollar 0.72 0.68 0.69 0.72<br />
1 pound sterling 1.12 1.25 1.13 1.05<br />
100 Czech korunas 3.77 3.99 3.78 3.72<br />
100 Hungarian forints 0.35 0.40 0.37 0.38<br />
1 Polish zloty 0.23 0.28 0.24 0.24
<strong>2009</strong> in brief To <strong>our</strong> investors Review of operations Our responsibility<br />
Responsibility statement Consolidated financial statements Further information<br />
Notes 151<br />
Accounting policies<br />
Intangible assets are accounted for at amortised cost. With<br />
the exception of goodwill, all intangible assets have finite useful<br />
lives and are amortised using the straight-line method. Useful<br />
lives and methods of amortisation are reviewed on an annual<br />
basis.<br />
Software for commercial and technical applications is amortised<br />
over three to five years. “Operating rights” refer to the<br />
entirety of the permits and approvals required for the operation<br />
of a power plant. Such rights are generally amortised over<br />
the economic life of the power plant, using the straight-line<br />
method. Easement agreements in the electricity and gas business,<br />
and other easement rights, generally have useful lives of<br />
up to 20 years. Concessions in the water business generally<br />
have terms of up to 25 years. Capitalised customer relations are<br />
amortised over a useful life of up to ten years. Useful lives and<br />
methods of amortisation are reviewed on an annual basis.<br />
Goodwill is not amortised; instead it is subjected to an impairment<br />
test once every year, or more frequently if there are<br />
indications of impairment.<br />
Development costs are capitalised if a newly developed product<br />
or process can be clearly defined, is technically feasible<br />
and it is the company’s intention to either use the product or<br />
process itself or market it. Furthermore, asset recognition<br />
requires that there be a sufficient level of certainty that the<br />
development costs lead to future cash inflows. Capitalised<br />
development costs are amortised over the time period during<br />
which the products are expected to be sold. Research expenditures<br />
are recognised as expenses in the period in which they<br />
are incurred.<br />
An impairment loss is recognised for an intangible asset, if<br />
the recoverable amount of the asset is less than its carrying<br />
amount. A special regulation applies for cases when the asset<br />
is part of a cash-generating unit. Such units are defined as<br />
the smallest identifiable group of assets which generates cash<br />
inflows; these inflows must be largely independent of cash inflows<br />
from other assets or groups of assets. If the asset is a<br />
part of a cash-generating unit, the impairment loss is calculated<br />
based on the recoverable amount of this unit. If goodwill<br />
was allocated to a cash-generating unit and the carrying<br />
amount of the unit exceeds the recoverable amount, the allocated<br />
goodwill is initially written down by the difference.<br />
Impairment losses which must be recognised in addition to<br />
this are taken into account by reducing the carrying amount<br />
of the other assets of the cash-generating unit on a prorated<br />
basis. If the reason for an impairment loss recognised in prior<br />
years has ceased to exist, a write-back is performed. The increased<br />
carrying amount resulting from the write-back may not,<br />
however, exceed the amortised cost. Impairment losses on<br />
goodwill are not reversed.<br />
Property, plant and equipment is stated at depreciated cost.<br />
Since the beginning of <strong>2009</strong>, borrowing costs are capitalised as<br />
part of the asset’s cost, if they are incurred directly in connection<br />
with the acquisition or production of an asset for which a<br />
considerable period of time is required to prepare the asset for<br />
use or sale (“qualified asset”). If necessary, the cost of property,<br />
plant and equipment may contain the estimated expenses<br />
for the decommissioning of plants or site restoration. Maintenance<br />
and repair costs are recognised as expenses.<br />
Exploratory wells are accounted for at cost, according to the<br />
successful efforts method, i.e. expenses for exploration activities<br />
are only capitalised for successful projects, for example,<br />
when wells lead to the discovery of crude oil or natural gas.<br />
Seismology and geology expenditures are recognised as expenses.<br />
Within the framework of the unit-of-production method,<br />
capitalised exploration assets are not depreciated or<br />
amortised in the exploration phase, but rather after production<br />
begins. Exploration assets are tested for impairment as soon as<br />
facts and information indicate that the carrying value exceeds<br />
the recoverable amount.<br />
With the exception of land and leasehold rights, as a rule,<br />
property, plant and equipment is depreciated using the<br />
straight-line method, unless in exceptional cases another<br />
depreciation method is better suited to the usage pattern.
152 Notes RWE Annual Report <strong>2009</strong><br />
The depreciation of RWE’s typical property, plant and equipment<br />
is calculated according to the following useful lives,<br />
which apply throughout the Group:<br />
prior years has ceased to exist, write-backs are performed. In<br />
such cases, however, the increased carrying amount may not<br />
exceed the depreciated cost.<br />
Useful life in years<br />
Buildings 12 – 80<br />
Technical plants<br />
Thermal power plants 15 – 40<br />
Wind turbines up to 20<br />
Electricity grids 20 – 45<br />
Water main networks 20 – 75<br />
Gas and water storage facilities 20 – 70<br />
Gas distribution facilities 14 – 30<br />
Mining facilities 4 – 25<br />
Mining developments 33 – 35<br />
Wells in Upstream gas & oil up to 19<br />
Property, plant and equipment held under a finance lease is<br />
capitalised at the fair value of the leased asset or the present<br />
value of the lease payments, depending on which is lower.<br />
They are depreciated using the straight-line method over the<br />
expected useful life or the lease term, whichever is shorter.<br />
Impairment losses for property, plant and equipment are<br />
recognised according to the principles described for intangible<br />
assets. If the reason for an impairment loss recognised in prior<br />
years has ceased to exist, a write-back is performed. In such<br />
cases, the increased carrying amount resulting from the writeback<br />
may not exceed the depreciated cost.<br />
Investment property consists of all real property held to earn<br />
rental income or for long-term capital appreciation rather than<br />
for use in production or for administrative purposes. This property<br />
is measured at depreciated cost. Transaction costs are also<br />
included in the initial measurement. Depreciable investment<br />
property is depreciated over 12 to 80 years using the straightline<br />
method. Fair values of investment property are stated in<br />
the Notes and are determined using internationally accepted<br />
valuation methods such as the discounted cash flow method or<br />
are derived from the current market prices of comparable real<br />
estate.<br />
Impairment losses for investment property are also recognised<br />
according to the principles described for intangible assets.<br />
Accordingly, if the reason for an impairment loss recognised in<br />
Investments accounted for using the equity method are initially<br />
accounted for at cost and thereafter based on the carrying<br />
amount of their prorated net assets. The carrying amounts<br />
are increased or reduced annually by prorated profits or losses,<br />
dividends and all other changes in equity. Goodwill is not<br />
reported separately: it is included in the recognised value of<br />
the investment. Goodwill is not amortised. An impairment loss<br />
is recognised for investments accounted for using the equity<br />
method, if the recoverable amount is less than the carrying<br />
amount.<br />
Other financial assets are comprised of shares in non-consolidated<br />
subsidiaries and in joint ventures/associates not<br />
accounted for using the equity method, as well as other investments<br />
and non-current marketable securities; these assets are<br />
nearly exclusively shown in the category “Available for sale”.<br />
This category includes financial instruments which are neither<br />
loans or receivables, nor financial investments held to maturity,<br />
and which are not measured at fair value through profit or loss.<br />
Initially and in the following periods, they are measured at<br />
fair value as long as such can be determined reliably. They are<br />
initially valued on their settlement date. Unrealised gains<br />
and losses are stated as other comprehensive income, with due<br />
consideration of any deferred taxes. Gains or losses are recognised<br />
in the income statement upon sale of the financial<br />
instruments. If there are objective, material indications of a<br />
reduction in the value of an asset, an impairment loss is recognised<br />
with an effect on income. Indications of impairment can<br />
include significant financial difficulties of the debtor, default or<br />
delinquency on payments of interest or principal, or the disappearance<br />
of an active market for a financial asset as a result<br />
of problems in the financial system.<br />
Receivables are comprised of financial receivables, trade<br />
accounts receivable and other receivables. With the exception<br />
of financial derivatives, receivables and other assets are stated<br />
at amortised cost. Allowances for doubtful accounts are based<br />
on the actual default risk. As a rule, the amounts of receivables<br />
are corrected through the use of an allowance account, in accordance<br />
with internal Group guidelines. Prepayments received<br />
from <strong>customers</strong> for consumption which is yet to be metered<br />
and billed are netted out against trade accounts receivable of<br />
the utilities.
<strong>2009</strong> in brief To <strong>our</strong> investors Review of operations Our responsibility<br />
Responsibility statement Consolidated financial statements Further information<br />
Notes 153<br />
Loans reported under financial receivables are stated at amortised<br />
cost. Loans with interest rates common in the market are<br />
shown on the balance sheet at nominal value; as a rule, however,<br />
non-interest or low-interest loans are disclosed at their<br />
present value discounted using an interest rate commensurate<br />
with the risks involved.<br />
CO 2 emission allowances are accounted for as intangible assets<br />
and reported under other assets. Allowances which are purchased<br />
and allowances allocated free of charge are both stated<br />
at cost and are not amortised.<br />
Deferred taxes result from temporary differences in the carrying<br />
amount in the separate IFRS financial statements and<br />
the tax base, and from consolidation procedures. Deferred tax<br />
assets also include tax reduction claims resulting from the<br />
expected utilisation of existing loss carryforwards in subsequent<br />
years. Deferred taxes are capitalised when it is sufficiently<br />
certain that they can be used. The amount of deferred<br />
taxes is assessed based on the tax rates applicable or expected<br />
to be applicable in the specific country at the time of realisation,<br />
with due consideration of the tax regulations valid or<br />
adopted as of the balance-sheet date. The tax rate used to<br />
calculate deferred taxes in Germany is 30.9 %, as in the previous<br />
year. This is derived from the 15 % corporate tax rate effective<br />
since 2008, the 5.5 % solidarity surcharge, and the Group’s<br />
average local trade tax rate in Germany. Deferred tax assets<br />
and deferred tax liabilities are netted out for each company<br />
and/or tax group.<br />
Inventories are assets which are held for sale in the ordinary<br />
c<strong>our</strong>se of business (finished goods and goods for resale), which<br />
are in the process of production (work in progress – goods and<br />
services) or which are consumed in the production process or in<br />
the rendering of services (raw materials including nuclear fuel<br />
assemblies and excavated earth for lignite mining).<br />
Insofar as inventories are not acquired primarily for the purpose<br />
of realising a profit on a short-term resale transaction,<br />
they are carried at the lower of cost or the net realisable value.<br />
Production costs reflect the full costs directly related to production<br />
and are determined based on the normal capacity. In addition<br />
to directly allocable costs, production costs include adequate<br />
portions of required materials and production overheads,<br />
including production-related depreciation. Borrowing costs,<br />
however, are not capitalised as part of the cost. The valuation<br />
is generally based on average values. The usage of excavated<br />
earth for lignite mining is calculated using the FIFO method.<br />
If the net realisable value of inventories written down in earlier<br />
periods has increased, the reversal of the write-down is recognised<br />
as a reduction of the cost of materials.<br />
Nuclear fuel assemblies are stated at depreciated cost. Depreciation<br />
is determined by operation and capacity, based on consumption<br />
and the reactor’s useful life.<br />
Inventories which are acquired primarily for the purpose of<br />
realising a profit on a short-term resale transaction are stated<br />
at their net realisable value less distribution costs. Changes in<br />
value are recognised with an effect on income.<br />
Securities classified as current marketable securities essentially<br />
consist of marketable securities held in special funds as well as<br />
fixed-interest securities which have a maturity of more than<br />
three months and less than one year from the date of acquisition.<br />
All of these securities are classified as “Available for sale”<br />
and are stated at fair value. The transaction costs directly<br />
associated with the acquisition of the financial asset are included<br />
in the initial measurement. These securities are initially<br />
measured on their settlement date. Unrealised gains and losses<br />
are included in other comprehensive income, with due consideration<br />
of any deferred taxes. Gains or losses are recognised in<br />
the income statement at the time of sale. If there are objective,<br />
material indications of a reduction in value, an impairment loss<br />
is recognised with an effect on income.<br />
Financial assets are derecognised when the contractual rights<br />
to cash flows from the asset expire or if the entity transfers the<br />
financial asset. The latter applies when substantially all the<br />
risks and rewards of ownership of the asset are transferred, or<br />
the entity no longer has control of the asset.<br />
Cash and cash equivalents consist of cash on hand, demand<br />
deposits and current fixed-interest securities with a maturity of<br />
three months or less from the date of acquisition.
154 Notes RWE Annual Report <strong>2009</strong><br />
Assets are stated under “Assets held for sale” if they can be<br />
sold in their present condition and their sale is highly probable.<br />
Such assets may be certain non-current assets, asset groups<br />
(“disposal groups”) or operations (“discontinued operations”).<br />
Liabilities intended to be sold in a transaction together with<br />
assets are a part of a disposal group or discontinued operations,<br />
and are reported separately under “Liabilities held for<br />
sale”.<br />
Non-current assets held for sale are no longer depreciated or<br />
amortised. They are recognised at fair value less costs to sell,<br />
as long as this amount is lower than the carrying amount.<br />
Gains or losses on the valuation of specific assets held for sale<br />
and of disposal groups are stated under income from continuing<br />
operations until final completion of the sale.<br />
The item “Income from discontinued operations” in the income<br />
statement includes income from operating activities as well as<br />
gains or losses resulting from recognition at fair value or from<br />
the disposal of activities.<br />
The groupwide stock option plans are accounted for as cashsettled<br />
share-based payment. At the balance-sheet date, a<br />
provision is recognised in the amount of the prorated fair value<br />
of the payment obligation. Changes in the fair value are recognised<br />
with an effect on income. The fair value of options is<br />
determined using generally accepted valuation methodologies.<br />
Provisions are recognised for all legal or constructive obligations<br />
to third parties which exist on the balance-sheet date and<br />
relate to past events, and with regard to which it is probable<br />
that an outflow of res<strong>our</strong>ces will be required, and the amount<br />
of which can be reliably estimated. Provisions are carried at the<br />
individually most likely outcome and are not offset against<br />
reimbursement claims. If the provision to be measured involves<br />
a large number of items, the obligation is estimated by weighting<br />
all possible outcomes by their probability of occurrence<br />
(“expected value” method).<br />
All non-current provisions are recognised at their prospective<br />
settlement amount, which is discounted as of the balance-sheet<br />
date. In the determination of the settlement amount, any cost<br />
increases likely to occur up until the time of settlement are taken<br />
into account.<br />
If necessary, the cost of property, plant and equipment may<br />
contain the estimated expenses for the decommissioning of<br />
plants or site restoration, for which decommissioning, restoration<br />
and similar provisions are recognised. If changes in<br />
the discount rate or changes in the estimated timing or amount<br />
of the payments result in changes in these provisions, the<br />
carrying amount of the respective asset is adjusted by the same<br />
amount. If the decrease in the provision exceeds the carrying<br />
amount of the underlying asset, the excess is recognised<br />
immediately through profit or loss. Releases of provisions are<br />
credited to the expense account on which the provision was<br />
originally recognised.<br />
Provisions for pensions and similar obligations are recognised<br />
for defined benefit plans. These are obligations of the company<br />
to pay future and ongoing post-employment benefits to entitled<br />
current and former employees and their surviving dependents.<br />
In particular, the obligations refer to retirement pensions.<br />
Individual commitments are generally calculated according to<br />
the employees’ length of service and compensation.<br />
Provisions for defined benefit plans are based on the actuarial<br />
present value of the respective obligation. This is measured<br />
using the projected unit credit method. This benefit/years-ofservice<br />
method not only takes into account the pension benefits<br />
and benefit entitlements known as of the balance-sheet<br />
date, but also anticipated future increases in salaries and pension<br />
benefits. The calculation is based on actuarial reports,<br />
taking into account appropriate biometric parameters (for Germany,<br />
in particular the “Richttafeln 2005G” by Klaus Heubeck).<br />
The provision derives from the balance of actuarial present<br />
value of the obligations and the fair value of the plan assets.<br />
The service cost is disclosed in staff costs. The interest cost<br />
and expected return on plan assets are included in the financial<br />
result.
<strong>2009</strong> in brief To <strong>our</strong> investors Review of operations Our responsibility<br />
Responsibility statement Consolidated financial statements Further information<br />
Notes 155<br />
Actuarial gains and losses are fully recognised in the fiscal year<br />
in which they occur. They are reported as a component of other<br />
comprehensive income outside of profit or loss in a consolidated<br />
statement of recognised income and expenses and immediately<br />
assigned to retained earnings. They remain outside<br />
profit or loss in subsequent periods as well.<br />
In the case of defined contribution plans, the enterprise’s<br />
obligation is limited to the amount it contributes to the plan.<br />
The contributions to the plan are recognised as expenses and<br />
disclosed under staff costs.<br />
Waste management provisions in the nuclear energy sector are<br />
based on obligations under public law, in particular the German<br />
Atomic Energy Act, and on restrictions stipulated in operating<br />
licenses. These provisions are measured using estimates, which<br />
are based on and defined in contracts, on information from<br />
internal and external specialists and expert opinions, as well as<br />
on data from the German Federal Office for Radiation Protection<br />
(BfS).<br />
Provisions for mining damage are recognised to cover land<br />
recultivation obligations and obligations to restore mining<br />
damage that has already occurred or been caused. Such risks<br />
and obligations are those that exist as of the balance-sheet<br />
date or are identifiable when the balance sheet is being prepared.<br />
The provisions must be recognised due to obligations<br />
under public law, such as the German Federal Mining Act, and<br />
formulated, above all, in operating schedules and water law<br />
permits. Provisions are generally recognised based on the increase<br />
in the obligation, e.g. in line with lignite production.<br />
Such provisions are measured at full expected cost or according<br />
to estimated compensation payments.<br />
Furthermore, provisions are made owing to obligations under<br />
public law to dismantle production facilities and fill wells. The<br />
amount of these provisions is determined on the basis of total<br />
cost estimates, which reflect past experience and the comparative<br />
rates determined by the German Association of Oil and<br />
Natural Gas Production Industry. An analogous approach is taken<br />
for foreign subsidiaries.<br />
A provision is recognised to cover the obligation to deliver<br />
CO 2 emission allowances to the respective authorities; this provision<br />
is measured at the book value of the CO 2 allowances<br />
capitalised for this purpose. If a portion of the obligation is not<br />
covered with the available allowances, the provision for this<br />
portion is measured using the market price of the allowances<br />
on the reporting date.<br />
Liabilities consist of financial liabilities, trade accounts payable<br />
and other liabilities. Upon initial recognition, liabilities are<br />
stated at fair value including transaction costs. Liabilities from<br />
finance lease agreements are measured at the lower of fair value<br />
of the leased asset or present value of minimum lease payments.<br />
In the periods thereafter, liabilities (except for financial<br />
derivatives) are carried at amortised cost.<br />
Deferred income and prepayments from <strong>customers</strong> are recognised<br />
as liabilities under other liabilities. Deferred income<br />
includes advances and contributions in aid of construction and<br />
building connection that are carried as liabilities by the utilities<br />
and which are generally amortised and included in income over<br />
the useful life of the corresponding asset. As a rule, this item<br />
also includes taxable and non-taxable government grants for<br />
capital expenditure on non-current assets, which are recognised<br />
as other operating income in line with the assets’ depreciation.<br />
Certain minority interests are also presented under other liabilities.<br />
Specifically, this pertains to purchase price obligations<br />
from put options on minority interests that are recognised in<br />
accordance with IAS 32.<br />
Derivative financial instruments are recognised as assets or<br />
liabilities. All derivative financial instruments are measured at<br />
fair value regardless of their purpose. Changes in this value are<br />
recognised with an effect on income, unless the instruments<br />
are used for hedge accounting purposes. In such cases, recognition<br />
of changes in the fair value depends on the type of<br />
hedging transaction.<br />
Fair value hedges are used to hedge assets or liabilities carried<br />
on the balance sheet against the risk of a change in their fair<br />
value. Hedges of unrecognised firm commitments are also<br />
recognised as fair value hedges. <strong>For</strong> fair value hedges, changes<br />
in the fair value of the hedging instrument or the fair value of<br />
the respective underlying transactions are recognised in the<br />
income statement. This means that gains and losses from the<br />
fair valuation of the hedging instrument are allocated to the
156 Notes RWE Annual Report <strong>2009</strong><br />
same line items of the income statement as those of the underlying<br />
hedged transaction. In this regard, changes in the fair<br />
value of the underlying transaction must pertain to the hedged<br />
portion of the overall risk. In the event that unrecognised firm<br />
commitments are hedged, changes in the fair value of the firm<br />
commitments with regard to the hedged risk result in the recognition<br />
of an asset or liability with an effect on income.<br />
Cash flow hedges are used to hedge the risk of variability in<br />
cash flows related to an asset or liability carried on the balance<br />
sheet or related to a highly probable forecast transaction. If a<br />
cash flow hedge exists, unrealised gains and losses from the<br />
hedging instrument are initially stated as other comprehensive<br />
income. Such gains or losses are disclosed in the income statement<br />
when the hedged underlying transaction has an effect on<br />
income. If forecast transactions are hedged and such transactions<br />
lead to the recognition of a financial asset or financial liability<br />
in subsequent periods, the amounts that were recognised<br />
in equity until this point in time are recognised in the income<br />
statement in the period during which the asset or liability affects<br />
the income statement. If the transactions result in the<br />
recognition of non-financial assets or liabilities, the amounts<br />
recognised in equity without an effect on income are included<br />
in the initial cost of the asset or liability.<br />
The purpose of hedges of a net investment in a foreign entity is<br />
to hedge the currency risk from investments with foreign functional<br />
currencies. Unrealised gains and losses from hedges are<br />
recognised in other comprehensive income until disposal.<br />
IAS 39 stipulates the conditions for the recognition of hedging<br />
relationships. Amongst other things, the hedging relationship<br />
must be documented in detail and be effective. According to<br />
IAS 39, a hedging relationship is “effective” when the changes<br />
in the fair value of the hedging instrument are within 80 to<br />
125 %, both prospectively and retrospectively, of the opposite<br />
change in the fair value of the hedged item. Only the effective<br />
portion of a hedge is recognised in accordance with these<br />
rules. The ineffective portion is recognised immediately in the<br />
income statement with an effect on income.<br />
requirements (own-use contracts) are not accounted for as<br />
derivative financial instruments, but rather as executory contracts.<br />
If the contracts contain embedded derivatives, the<br />
derivatives are accounted separately from the host contract, if<br />
the economic characteristics and risks of the embedded derivatives<br />
are not closely related to the economic characteristics<br />
and risks of the host contract. Written options to buy or sell a<br />
non-financial item which can be settled in cash are not own-use<br />
contracts.<br />
Contingent liabilities are possible obligations to third parties<br />
or existing obligations, which are not recognised because it is<br />
not probable that an outflow of economic benefits will be required<br />
to settle the obligations or the amount of which cannot<br />
be measured reliably. Contingent liabilities are only recognised<br />
on the balance sheet, if they were assumed within the framework<br />
of a business combination. The amounts disclosed in the<br />
notes correspond to the exposure at the balance-sheet date.<br />
Management judgments in the application of accounting policies.<br />
Management judgments are required in the application of<br />
accounting policies. In particular, this pertains to the following<br />
items:<br />
• With regard to certain contracts a decision must be made as<br />
to whether they are to be treated as derivatives or as socalled<br />
own-use contracts, and be accounted for as executory<br />
contracts.<br />
• Financial assets must be allocated to the categories “Held to<br />
maturity investments”, “Loans and receivables”, “Financial<br />
assets available for sale”, and “Financial assets at fair value<br />
through profit or loss”.<br />
• With regard to “Financial assets available for sale” a decision<br />
must be made as to if and when reductions in value are to be<br />
recognised as impairments with an impact on income.<br />
• With regard to assets held for sale, it must be determined if<br />
they can be sold in their current condition and if the sale of<br />
such is highly probable. If both conditions apply, the assets<br />
and any related liabilities must be reported and measured as<br />
“Assets held for sale” or “Liabilities held for sale”, respectively.<br />
Contracts that were entered into and continue to be held for<br />
the purpose of receipt or delivery of non-financial items in accordance<br />
with the company’s expected purchase, sale or usage
<strong>2009</strong> in brief To <strong>our</strong> investors Review of operations Our responsibility<br />
Responsibility statement Consolidated financial statements Further information<br />
Notes 157<br />
The explanation of the accounting policies contains a description<br />
of the decisions taken by the RWE Group with regard to<br />
these items.<br />
techniques. Amongst other things, special attention is paid to<br />
the anticipated future cash flows and determination of the<br />
discount r ate.<br />
Management estimates and judgments. Preparation of consolidated<br />
financial statements pursuant to IFRS requires assumptions<br />
and estimates to be made, which have an impact on the<br />
recognised value of the assets and liabilities carried on the<br />
balance sheet, on income and expenses and on the disclosure<br />
of contingent liabilities.<br />
The impairment test for goodwill is based on certain assumptions<br />
pertaining to the future, which are regularly adjusted.<br />
Based on current knowledge, there are not expected to be any<br />
changes in these assumptions which would cause the recoverable<br />
amounts to fall below the carrying amounts of the cashgenerating<br />
units in fiscal 2010.<br />
Amongst other things, these assumptions and estimates relate<br />
to the accounting and measurement of provisions. With regard<br />
to pension provisions and similar obligations, the discount<br />
rate and the expected return on the plan assets are important<br />
estimates. The discount rate for pension obligations is determined<br />
on the basis of yields on senior, fixed-rate corporate<br />
bonds on the financial markets as of the balance-sheet date.<br />
Due to the financial market crisis, the yield spreads of corporate<br />
bonds compared to government bonds have increased.<br />
The range of yields on high-quality corporate bonds observed<br />
on the market has also widened, and these yields are used as<br />
the basis for determining the discount rate. In Germany, an<br />
increase or decrease of one percentage point in the discount<br />
rate would result in a reduction of €1,287 million (previous<br />
year: €1,057 million) or an increase of €1,638 million (previous<br />
year: €1,269 million), respectively, in the present value of the<br />
obligations of <strong>our</strong> pension plans. <strong>For</strong> the Group companies in<br />
the UK, identical changes in the discount rate would reduce or<br />
increase pension obligations by €529 million (previous year:<br />
€367 million) or €653 million (previous year: €451 million),<br />
respectively. However, as the commitments stemming from<br />
company pension plans are primarily covered by funds and the<br />
value of most fund assets typically exhibits negative correlation<br />
with the market yields of fixed-interest securities, the pension<br />
provisions − as determined taking into account the existing<br />
fund assets − only depend on the prevailing level of market<br />
interest rates to a limited degree.<br />
<strong>For</strong> the accounting of business combinations, the identifiable<br />
assets, liabilities and contingent liabilities are recognised at<br />
fair value as of the date of acquisition. In this regard, the most<br />
important estimates relate to the determination of the fair<br />
value of these items as of the acquisition date: fair value is calculated<br />
either on the basis of the independent reports of external<br />
valuation experts or internally, using suitable valuation<br />
Deferred tax assets are recognised if realisation of future tax<br />
benefits is probable. Actual future income for tax purposes and<br />
hence the actual realisability of deferred tax assets, however,<br />
may deviate from the estimation made when the deferred taxes<br />
are capitalised.<br />
Further information on the assumptions and estimates upon<br />
which these consolidated financial statements are based can be<br />
found in the explanations of the individual items.<br />
All assumptions and estimates are based on the circumstances<br />
and forecasts prevailing on the balance-sheet date. Furthermore,<br />
as of the balance-sheet date realistic assessments of<br />
overall economic conditions in the sectors and regions in which<br />
the Group conducts operations are taken into consideration<br />
with regard to the prospective development of business. Actual<br />
amounts may deviate from the estimated amounts if the overall<br />
conditions develop differently than expected. In such cases,<br />
the assumptions, and, if necessary, the carrying amounts of the<br />
affected assets and liabilities are adjusted.<br />
As of the date of preparation of the consolidated financial<br />
statements it is not presumed that there will be a material<br />
change in the assumptions and estimates.<br />
Capital management. The broader framework for optimised<br />
capital management is determined by the strategic approach of<br />
the RWE Group, which is focused on increasing the value of <strong>our</strong><br />
business over the long term, in the interests of <strong>our</strong> investors,<br />
employees and <strong>customers</strong>. To achieve this goal, the RWE Group<br />
endeav<strong>our</strong>s to constantly optimise its existing operations<br />
(“ operational excellence”), to safeguard its market position<br />
through investment in growth and, if necessary, to broaden its<br />
portfolio via acquisitions that create value.
158 Notes RWE Annual Report <strong>2009</strong><br />
Within capital management, this strategic approach involves<br />
the use of a debt target to actively manage the balance sheet.<br />
The target is based on net debt (net financial debt including all<br />
material non-current provisions, less the surplus of plan assets<br />
over benefit obligations) and a debt factor which is derived<br />
from this (net debt divided by EBITDA). The debt factor is not<br />
to exceed 3.0, and thus complies with a solid rating. At the<br />
end of the period under review, this factor was 2.8 (previous<br />
year: 2.1).<br />
The RWE Group considers maintaining a solid credit rating, and<br />
thus ensuring its financial flexibility to be very important.<br />
The credit rating is influenced by a number of qualitative and<br />
quantitative factors. These include aspects such as profitability<br />
and the amount of cash flows as well as market conditions,<br />
competition, and the political framework.<br />
At present, the two leading rating agencies, Moody’s and<br />
Standard & Poor’s, assign the ratings A2 and A, both with a<br />
negative outlook, to the bonds issued by RWE AG and by<br />
RWE Finance B.V. with a guarantee by RWE AG. RWE thus continues<br />
to have investment-grade ratings and remains committed<br />
to retaining the current rating level. RWE’s short-term<br />
credit ratings are P-1 and A-1. The review of operations also<br />
contains information on the assessment of RWE’s creditworthiness<br />
by the rating agencies.<br />
Changes in accounting policies<br />
The International Accounting Standards Board (IASB) has<br />
approved a number of changes to the existing International<br />
Financial Accounting Standards (IFRSs) and adopted several<br />
new IFRSs, which became effective as of January 1, <strong>2009</strong>. The<br />
RWE Group is applying the following IFRSs in the reporting<br />
period for the first time:<br />
Amendments to IFRS 7 (<strong>2009</strong>) “Improving Disclosures about<br />
Financial Instruments” stipulates extended disclosure in the<br />
notes concerning financial instruments. In particular, a socalled<br />
“fair value hierarchy” must be presented, showing<br />
whether fair values of financial instruments are determined<br />
based on published market prices or currently unobservable<br />
internal company data. Furthermore, disclosure requirements<br />
for liquidity risks arising from financial instruments have been<br />
extended. Their first-time application resulted in additional disclosure<br />
in the notes to the RWE Group’s con solidated financial<br />
statements.<br />
IAS 1 (2007) “Presentation of Financial Statements” contains<br />
new regulations on the presentation of financial statements.<br />
Above all, future non-owner changes in equity are to be strictly<br />
separated from owner changes in equity, and disclosure on<br />
other comprehensive income is to be extended. The application<br />
of IAS 1 (2007) resulted in changes in the presentation of the<br />
RWE Group’s consolidated financial statements and in extended<br />
disclosure in the notes.<br />
IAS 23 (2007) “Borrowing Costs”: By revising IAS 23, the<br />
IASB abolished the option for the treatment of borrowing costs<br />
directly incurred in connection with the acquisition, construction<br />
or production of qualified assets. These borrowing costs<br />
must now be capitalised as part of the asset’s cost.<br />
The following standards and interpretations, which are to be<br />
applied for the first time in the fiscal year, have no material impact<br />
on the RWE Group’s consolidated financial statements:<br />
• Amendments to IFRS 1 and IAS 27 (2008) – Cost of<br />
an Investment in a Subsidiary, Jointly Controlled Entity or<br />
Associate<br />
• Amendments to IFRS 2 (2008) – Vesting Conditions and<br />
Cancellations<br />
• Amendments to IAS 32 and IAS 1 (2008) – Puttable Financial<br />
Instruments and Obligations Arising on Liquidation<br />
• Improvements to IFRSs (2008)<br />
• Amendments to IFRIC 9 and IAS 39 (<strong>2009</strong>) – Embedded<br />
Derivatives<br />
• IFRIC 13 – Customer Loyalty Programmes
<strong>2009</strong> in brief To <strong>our</strong> investors Review of operations Our responsibility<br />
Responsibility statement Consolidated financial statements Further information<br />
Notes 159<br />
New accounting policies<br />
The IASB and International Financial Reporting Interpretations<br />
Committee (IFRIC) have adopted further standards and interpretations,<br />
which were not yet mandatory in fiscal <strong>2009</strong>. These<br />
IFRSs can only be applied if they are endorsed by the EU,<br />
which is still pending in some cases.<br />
The impact of the following standards on the RWE Group’s consolidated<br />
financial statements is currently being reviewed.<br />
“Improvements to IFRSs” (<strong>2009</strong>): The IASB issued another<br />
collection of amendments as part of its “Annual Improvement<br />
Process.” It includes a number of minor IFRS changes, seeking<br />
to specify the rules and eliminate inconsistencies. Most of the<br />
amendments become effective for fiscal years starting on or after<br />
January 1, 2010.<br />
IFRS 3 (2008) “Business Combinations” contains amended<br />
regulations on the accounting of business combinations. Compared<br />
to the original version of IFRS 3, these changes relate to<br />
the scope of application and the treatment of successive share<br />
purchases. Furthermore, IFRS 3 (2008) offers companies an option:<br />
non-controlling interests can be measured at fair value or<br />
at the proportionate share of net assets. Depending on which<br />
option a company exercises, any goodwill is recognised in full<br />
or only in proportion to the majority owner’s interest. IFRS 3<br />
(2008) becomes effective for the first time for fiscal years starting<br />
on or after July 1, <strong>2009</strong>.<br />
IFRS 9 “Financial Instruments” replaces the previous regulations<br />
of IAS 39 in respect of the classification and measurement<br />
of financial instruments. IFRS 9 (<strong>2009</strong>) becomes effective<br />
for the first time for fiscal years starting on or after January 1,<br />
2013.<br />
IAS 24 (<strong>2009</strong>) “Related Party Disclosures” essentially simplifies<br />
reporting on related parties which are controlled or significantly<br />
influenced by the state. IAS 24 (<strong>2009</strong>) becomes effective<br />
for the first time for fiscal years starting on or after January 1,<br />
2011.<br />
IAS 27 (2008) “Consolidated and Separate Financial Statements”:<br />
In particular, by revising IAS 27, the IASB changed the<br />
regulations for the treatment of transactions with non-controlling<br />
interests of a group. Transactions which result in a parent<br />
company changing its ownership interest in a subsidiary without<br />
a loss of control are to be accounted for as equity transactions<br />
without an effect on profit or loss. Regulations for treatment<br />
in the event of a loss of control over a subsidiary were<br />
also changed: The standard regulates how deconsolidation<br />
gains or losses are to be calculated and how residual ownership<br />
interest in the former subsidiary is to be measured following a<br />
partial sale. This amendment of IAS 27 becomes effective for<br />
the first time for fiscal years starting on or after July 1, <strong>2009</strong>.<br />
Amendment to IAS 32 (<strong>2009</strong>) “Classification of Rights Issues“<br />
pertains to the issuer’s accounting treatment of specific<br />
foreign-currency subscription rights, options and warrants. In<br />
the future, these instruments must be classified as equity. The<br />
new rule becomes effective for the first time for fiscal years<br />
starting on or after February 1, 2010.<br />
The following standards and interpretations, which are not yet<br />
applicable in fiscal <strong>2009</strong>, are not expected to have any material<br />
impact on the RWE Group’s consolidated financial statements:<br />
• IFRS 1 (restructured in 2008) – First-time Adoption of International<br />
Financial Reporting Standards<br />
• Amendment to IFRS 1 (<strong>2009</strong>) – Additional Exemptions for<br />
First-time Adopters<br />
• Amendment to IFRS 1 (2010) – Limited Exemption from Comparative<br />
IFRS 7 Disclosures for First-time Adopters<br />
• Amendment to IFRS 2 (<strong>2009</strong>) – Group Cash-settled Sharebased<br />
Payment Transactions<br />
• Amendment to IAS 39 (<strong>2009</strong>) – Eligible Hedged Items<br />
• IFRIC 12 – Service Concession Arrangements<br />
• Amendment to IFRIC 14 (<strong>2009</strong>) – Prepayments of a Minimum<br />
Funding Requirement<br />
• IFRIC 15 – Agreements for the Construction of Real Estate<br />
• IFRIC 16 – Hedges of a Net Investment in a <strong>For</strong>eign Operation<br />
• IFRIC 17 – Distributions of Non-cash Assets to Owners<br />
• IFRIC 18 – Transfers of Assets from Customers<br />
• IFRIC 19 – Extinguishing Financial Liabilities with Equity<br />
Instruments
160 Notes RWE Annual Report <strong>2009</strong><br />
Notes to the Income Statement<br />
(1) Revenue<br />
As a rule, revenue is recorded when the services or goods have<br />
been delivered and the risks have been transferred to the customer.<br />
To improve the presentation of business development, we report<br />
revenue generated by energy trading operations as net<br />
figures, reflecting realised gross margins. By contrast, we state<br />
electricity, gas, coal and oil transactions that are subject to<br />
physical settlement as gross figures. Energy trading revenue is<br />
mainly generated by RWE Supply & Trading and by Essent. In<br />
fiscal <strong>2009</strong>, gross revenue (including energy trading) totalled<br />
€98,013 million (previous year: €85,043 million).<br />
A breakdown of revenue by division (including natural gas tax/<br />
electricity tax) and geographical region is contained in the segment<br />
reporting on pages 195 to 198. Revenue increased by a<br />
net total of €1,558 million as a result of first-time consolidations<br />
and deconsolidations.<br />
The item natural gas tax/electricity tax comprises the taxes<br />
paid directly by Group companies.<br />
(2) Other operating income<br />
Other operating income<br />
€ million<br />
<strong>2009</strong> 2008<br />
Release of provisions 826 133<br />
Cost allocations/refunds 95 62<br />
Disposal and write-back of current assets excluding marketable securities 22 37<br />
Disposal and write-back of non-current assets including income from deconsolidation 135 231<br />
Income from derivative financial instruments 134<br />
Compensation for damage/insurance benefits 35 29<br />
Rent and lease 27 28<br />
Miscellaneous 470 279<br />
1,610 933<br />
Income from the disposal of non-current financial assets and<br />
loans is disclosed under income from investments if it relates to<br />
investments; otherwise it is recorded as part of the financial result<br />
as is the income from the disposal of current marketable<br />
securities.<br />
An increase of €131 million in other operating income is attributable<br />
to changes in the scope of consolidation.<br />
(3) Cost of materials<br />
Cost of materials<br />
<strong>2009</strong> 2008<br />
€ million<br />
Cost of raw materials and of goods<br />
for resale 26,170 28,660<br />
Cost of purchased services 3,668 4,026<br />
29,838 32,686<br />
The cost of raw materials also includes expenses for the use<br />
and disposal of spent nuclear fuel assemblies.<br />
Cost of materials in exploration activities amounted to<br />
€133 million in the reporting period (previous year:<br />
€209 million).<br />
A total of €50,272 million in energy trading revenue (previous<br />
year: €36,093 million) was netted out against cost of materials.<br />
Changes in the scope of consolidation resulted in an increase<br />
of €996 million in the cost of materials.
<strong>2009</strong> in brief To <strong>our</strong> investors Review of operations Our responsibility<br />
Responsibility statement Consolidated financial statements Further information<br />
Notes 161<br />
(4) Staff costs<br />
Staff costs<br />
<strong>2009</strong> 2008<br />
€ million<br />
Wages and salaries 3,761 3,633<br />
Cost of social security, pensions and<br />
other benefits 849 782<br />
4,610 4,415<br />
The cost of pension benefits was €107 million (previous year:<br />
€151 million), consisting of €143 million in current service<br />
cost (previous year: €164 million), and past service cost of<br />
-€36 million (previous year: -€13 million).<br />
Converted to full-time positions, the RWE Group’s average personnel<br />
headcount (excluding American Water) amounted to<br />
68,828 (previous year: 65,254). Part-time and fixed-term employment<br />
relationships are included in accordance with the ratio<br />
of the part-time work or the duration of the employment to<br />
the annual employment time. Of the total average personnel<br />
headcount, 54,107 were staff covered by collective or other<br />
agreements (previous year: 51,930) and 14,721 were staff who<br />
were not covered by collective agreements (previous year:<br />
13,324). In addition, on average the Group employed 2,756<br />
trainees (previous year: 2,688).<br />
(5) Depreciation, amortisation, and impairment losses<br />
Depreciation and impairment losses on property, plant and<br />
equipment amounted to €1,900 million (previous year:<br />
€1,796 million) and to €8 million (previous year: €7 million) on<br />
investment property. Intangible assets were written down by<br />
€449 million (previous year: €443 million), of which €272 million<br />
(previous year: €288 million) pertained to customer relationships<br />
in connection with acquisitions. Exploration activities<br />
resulted in depreciation, amortisation and impairment losses of<br />
€1 million (previous year: €1 million) on property, plant and<br />
equipment and intangible assets.<br />
Impairment losses were recognised in the reporting period.<br />
These impairment losses amounted to €14 million (previous<br />
year: €24 million) on property, plant and equipment, and to<br />
€0 million (previous year: €1 million) on investment property.<br />
Impairment losses of €5 million (previous year: €1 million)<br />
were recorded on intangible assets (without goodwill).<br />
Depreciation, amortisation and impairment losses increased by<br />
€88 million as a result of changes in the scope of consolidation.<br />
An increase of €111 million in staff costs is attributable to<br />
changes in the scope of consolidation.
162 Notes RWE Annual Report <strong>2009</strong><br />
(6) Other operating expenses<br />
Other operating expenses<br />
€ million<br />
<strong>2009</strong> 2008<br />
Maintenance and renewal obligations 829 641<br />
Additions to provisions 104 14<br />
Concessions, licenses and other contractual obligations 540 495<br />
Structural and adaptation measures 71 74<br />
Legal and other consulting and data processing services 327 261<br />
Disposal of current assets and decreases in values (excluding decreases in the value of inventories and marketable<br />
securities) 242 298<br />
Disposal of non-current assets including expenses from deconsolidation 127 147<br />
Insurance, commissions, freight and similar distribution costs 252 219<br />
General administration 192 197<br />
Advertising 236 238<br />
Expenses from derivative financial instruments 159 83<br />
Lease payments for plant and grids as well as rents 100 82<br />
Postage and monetary transactions 82 87<br />
Fees and membership dues 48 70<br />
Exchange rate losses 17 11<br />
Other taxes (primarily on property) 49 39<br />
Miscellaneous 549 447<br />
3,924 3,403<br />
Exploration activities resulted in other operating expenses of<br />
€76 million (previous year: €102 million).<br />
An increase of €213 million in other operating expenses is attributable<br />
to changes in the scope of consolidation.
<strong>2009</strong> in brief To <strong>our</strong> investors Review of operations Our responsibility<br />
Responsibility statement Consolidated financial statements Further information<br />
Notes 163<br />
(7) Income from investments<br />
Income from investments includes all income and expenses<br />
which have arisen in relation to operating investments. It is<br />
Income from investments<br />
€ million<br />
comprised of income from investments accounted for using the<br />
equity method and other income from investments.<br />
<strong>2009</strong> 2008<br />
Income from investments accounted for using the equity method 131 372<br />
of which: amortisation/impairment losses on investments accounted for using the equity method (-111) (-17)<br />
Income from non-consolidated subsidiaries 29 1<br />
of which: amortisation/impairment losses on non-consolidated subsidiaries (-2) (-6)<br />
Income from other investments 51 48<br />
of which: impairment of shares in other investments (-2)<br />
Income from the disposal of investments 97 28<br />
Expenses from the disposal of investments 64 1<br />
Income from loans to investments 53 41<br />
Expenses from loans to investments 35 35<br />
Other income from investments 131 82<br />
262 454<br />
Income from investments includes impairment losses on other<br />
financial assets in the amount of €4 million (previous year:<br />
€6 million) and impairment losses on loans to investments<br />
amounting to €16 million (previous year: €35 million).<br />
In light of the difficult conditions on the LNG market, an impairment<br />
of €105 million (previous year: €0 million) was recognised<br />
on Excelerate Energy LP, USA, an investment accounted<br />
for using the equity method. The recoverable amount of the investment<br />
in the segment Trading/gas midstream corresponds<br />
to its value in use.<br />
(8) Financial result<br />
Financial result<br />
€ million<br />
<strong>2009</strong> 2008<br />
Interest and similar income 589 807<br />
Other financial income 1,110 1,055<br />
Financial income 1,699 1,862<br />
Interest and similar expenses 1,224 965<br />
Interest accretion to<br />
Provisions for pensions and similar obligations 176 97<br />
Provisions for nuclear waste management as well as to mining provisions 567 582<br />
Other provisions 214 59<br />
Other finance costs 1,508 1,634<br />
Finance costs 3,689 3,337<br />
-1,990 -1,475<br />
The financial result breaks down into net interest, interest<br />
accretion to provisions, other financial income and other<br />
finance costs.
164 Notes RWE Annual Report <strong>2009</strong><br />
Net interest essentially includes interest income from interestbearing<br />
securities and loans, expenses and income relating to<br />
marketable securities, and interest expenses.<br />
Net interest<br />
<strong>2009</strong> 2008<br />
€ million<br />
Interest and similar income 589 807<br />
Interest and similar expenses 1,224 965<br />
-635 -158<br />
(9) Taxes on income<br />
Taxes on income<br />
<strong>2009</strong> 2008<br />
€ million<br />
Current taxes on income 1,761 655<br />
Deferred taxes 97 768<br />
1,858 1,423<br />
€5 million of the deferred taxes are related to temporary differences<br />
(previous year: €379 million).<br />
Interest accretion to provisions contains the reversal allocable<br />
to the current year of the discounting of non-current provisions<br />
from the annual update of the present value calculation. It is<br />
reduced by the projected income on plan assets for the coverage<br />
of pension obligations.<br />
Net interest stems from financial assets and liabilities, which<br />
are allocated to the following categories:<br />
Interest result by category<br />
<strong>2009</strong> 2008<br />
€ million<br />
Loans and receivables 357 465<br />
Financial assets available for sale 232 342<br />
Financial liabilities carried at<br />
(amortised) cost -1,224 -965<br />
-635 -158<br />
The financial result also contains all other financial income and<br />
finance costs which cannot be allocated to net interest or to interest<br />
accretion to provisions. Other financial income includes<br />
€292 million in gains realised from the disposal of marketable<br />
securities (previous year: €232 million).<br />
Other finance costs include €51 million (previous year:<br />
€152 million) in write-downs of marketable securities due to<br />
decreases in their fair value and €441 million (previous year:<br />
€436 million) in realised losses from the disposal of marketable<br />
securities.<br />
Current taxes on income contain €130 million in net tax expenses<br />
(previous year: income of €332 million) relating to prior<br />
periods.<br />
Due to the utilisation of tax loss carryforwards unrecognised in<br />
prior years, current taxes on income were reduced by €4 million<br />
(previous year: €24 million).<br />
During the period under review, equity increased by €251 million<br />
(previous year: €43 million) by offsetting deferred taxes<br />
with other comprehensive income, as follows:<br />
Income taxes recognised in<br />
<strong>2009</strong> 2008<br />
other comprehensive income<br />
€ million<br />
Fair valuation of financial instruments<br />
available for sale -9 -29<br />
Fair valuation of financial instruments used<br />
for hedging purposes -58 -290<br />
Actuarial gains and losses of defined benefit<br />
pension plans and similar obligations 318 362<br />
Income 251 43<br />
The income tax expense is derived from the theoretical tax<br />
expense. A tax rate of 30.9 % (previous year: 30.9 %) was<br />
applied to income from continuing operations before tax.
<strong>2009</strong> in brief To <strong>our</strong> investors Review of operations Our responsibility<br />
Responsibility statement Consolidated financial statements Further information<br />
Notes 165<br />
Tax reconciliation<br />
<strong>2009</strong> 2008<br />
€ million<br />
Income from continuing operations before tax 5,598 4,866<br />
Theoretical tax expense 1,729 1,503<br />
Differences from foreign tax rates -169 -112<br />
Tax effects on<br />
Tax-free domestic dividend income -95 -88<br />
Tax-free foreign dividend income -32 -28<br />
Other tax-free income -14 -48<br />
Expenses not deductible for tax purposes 72 137<br />
Accounting for associates using the equity method (including impairment losses on associates’ goodwill) 69 -11<br />
Unutilisable loss carryforwards and/or utilisation of unrecognised loss carryforwards and<br />
write-downs on loss carryforwards 55 77<br />
Income on the disposal of investments -36 21<br />
Other 279 -28<br />
Effective tax expense 1,858 1,423<br />
Effective tax rate in % 33.2 29.2
166 Notes RWE Annual Report <strong>2009</strong><br />
Notes to the Balance Sheet<br />
(10) Intangible assets<br />
Intangible assets<br />
€ million<br />
Development<br />
costs<br />
Concessions,<br />
patent<br />
rights,<br />
licenses and<br />
similar rights<br />
Customer<br />
relationships<br />
and similar<br />
assets<br />
Goodwill<br />
Prepayments<br />
Cost<br />
Balance at Jan 1, <strong>2009</strong> 316 1,999 2,164 9,152 4 13,635<br />
Additions/disposals due to changes in the scope of<br />
consolidation 55 1,297 470 3,871 -2 5,691<br />
Additions 104 499 1 604<br />
Currency translation adjustments 19 19 156 235 -1 428<br />
Disposals 19 80 99<br />
Balance at Dec 31, <strong>2009</strong> 475 3,734 2,790 13,258 2 20,259<br />
Accumulated amortisation/impairment losses<br />
Balance at Jan 1, <strong>2009</strong> 169 898 1,360 6 2,433<br />
Additions/disposals due to changes in the scope of<br />
consolidation -1 -22 12 -11<br />
Amortisation/impairment losses in the reporting period 48 129 272 449<br />
Currency translation adjustments 9 7 98 114<br />
Disposals 2 44 46<br />
Balance at Dec 31, <strong>2009</strong> 223 968 1,742 6 2,939<br />
Carrying amounts<br />
Balance at Dec 31, <strong>2009</strong> 252 2,766 1,048 13,252 2 17,320<br />
Total<br />
Cost<br />
Balance at Jan 1, 2008 279 1,568 2,802 9,714 5 14,368<br />
Additions/disposals due to changes in the scope of<br />
consolidation 3 343 5 332 -18 665<br />
Additions 105 264 20 389<br />
Transfers 2 -2<br />
Currency translation adjustments -68 -65 -642 -894 -1 -1,670<br />
Disposals 3 113 1 117<br />
Balance at Dec 31, 2008 316 1,999 2,164 9,152 4 13,635<br />
Accumulated amortisation/impairment losses<br />
Balance at Jan 1, 2008 158 877 1,445 6 2,486<br />
Additions/disposals due to changes in the scope of<br />
consolidation 1 1 4 6<br />
Amortisation/impairment losses in the reporting period 47 108 288 443<br />
Currency translation adjustments -35 -23 -376 -434<br />
Disposals 2 65 1 68<br />
Balance at Dec 31, 2008 169 898 1,360 6 2,433<br />
Carrying amounts<br />
Balance at Dec 31, 2008 147 1,101 804 9,146 4 11,202
<strong>2009</strong> in brief To <strong>our</strong> investors Review of operations Our responsibility<br />
Responsibility statement Consolidated financial statements Further information<br />
Notes 167<br />
Expenses for research and development totalled €110 million in<br />
the reporting period (previous year: €105 million). Development<br />
costs of €104 million were capitalised (previous year:<br />
€105 million).<br />
Of the additions/disposals due to changes in the scope of<br />
consolidation, €5,307 million was related to the Essent Group.<br />
Intangible assets in exploration activities with a carrying<br />
amount of €415 million were recorded in the reporting period<br />
(previous year: €320 million).<br />
In accordance with the new structure resulting from reorganisation,<br />
which is presented in segment reporting, goodwill breaks<br />
down as follows:<br />
Goodwill 1<br />
€ million<br />
Dec 31,<br />
<strong>2009</strong><br />
Dec 31,<br />
2008<br />
Germany 3,937 3,578<br />
Power generation 404 404<br />
Sales and distribution networks 3,533 3,174<br />
Netherlands/Belgium 3,504<br />
United Kingdom 2,877 2,636<br />
Central and Eastern Europe 1,956 1,933<br />
Renewables 441 389<br />
Upstream gas & oil 26 30<br />
Trading/gas midstream 434 434<br />
Others 77 146<br />
13,252 9,146<br />
1 Prior-year figures adjusted.<br />
In the reporting period, goodwill increased by €3,871 million<br />
(previous year: €332 million), of which €3,435 million resulted<br />
from the acquisition of Essent.<br />
Goodwill is allocated to cash-generating units at the segment<br />
level to carry out impairment tests. The impairment test involves<br />
determining the recoverable amount of the cash-generating<br />
units, which corresponds to the maximum of the fair<br />
value less costs to sell or the value in use. The fair value reflects<br />
the best estimate of the sum that an independent third party<br />
would pay to purchase the cash-generating unit as of the balance-sheet<br />
date. Value in use is the present value of the future<br />
cash flows which are expected to be generated with a cashgenerating<br />
unit. As of the balance-sheet date, both the fair<br />
value less costs to sell and the value in use of the cash-generating<br />
units were above their carrying amounts.<br />
Fair value is assessed from an external perspective and value in<br />
use from a company-internal perspective. Both variables are determined<br />
using a business valuation model, taking into account<br />
planned future cash flows. These cash flows, in turn, are based<br />
on the business plan prepared for a period of three years, as<br />
approved by the Executive Board and valid at the time of the<br />
impairment test. The cash flow plans are based on experience<br />
as well as on expected market trends in the future. If available,<br />
market transactions in the same sector or third-party valuations<br />
are taken as a basis for determining fair value.<br />
Business plans are based on country-specific assumptions regarding<br />
the development of key economic indicators such as<br />
gross domestic product, consumer prices, interest rates and<br />
nominal wages. These estimates are, amongst others, derived<br />
from macroeconomic and financial studies.<br />
The key planning assumptions for the business segments active<br />
in Europe’s electricity and gas markets are estimates relating to<br />
the development of wholesale prices for electricity, crude oil,<br />
natural gas, coal and CO 2 emission allowances, and retail prices<br />
for electricity and gas, as well as to the development of market<br />
shares and regulatory framework conditions.<br />
The discount rates used for business valuations are determined<br />
on the basis of market data and range from 6.5 to 9.0 % for<br />
cash-generating units after tax (previous year: 6.1 to 9.8 %). Before<br />
tax, the interest rates used range from 8.8 to 15.6 % (previous<br />
year: 8.1 to 17.3 %).<br />
RWE extrapolates future cash flows going beyond the detailed<br />
planning horizon based on constant growth rates of 0.0 to<br />
1.0 % (previous year: 0.0 to 0.5 %). These figures are derived<br />
from experience and future expectations for the individual divisions<br />
and do not exceed the long-term average growth rates in<br />
the markets in which the companies are active. In calculating<br />
cash flow growth rates, the capital expenditures required to<br />
achieve the assumed cash flow growth are subtracted.
168 Notes RWE Annual Report <strong>2009</strong><br />
(11) Property, plant and equipment<br />
Property, plant and equipment<br />
€ million<br />
Land, land<br />
rights and<br />
buildings<br />
incl.<br />
buildings on<br />
third-party<br />
land<br />
Technical<br />
plant and<br />
machinery<br />
Other<br />
equipment,<br />
factory<br />
and office<br />
equipment<br />
Prepayments<br />
Plants<br />
under<br />
con struction<br />
Cost<br />
Balance at Jan 1, <strong>2009</strong> 6,612 58,519 1,942 1,024 2,953 71,050<br />
Additions/disposals due to changes in the scope of consolidation 89 2,291 36 -1 789 3,204<br />
Additions 164 1,951 161 859 2,317 5,452<br />
Transfers 129 1,360 28 -13 -1,535 -31<br />
Currency translation adjustments 26 376 22 93 517<br />
Disposals 61 493 110 24 688<br />
Balance at Dec 31, <strong>2009</strong> 6,959 64,004 2,079 1,869 4,593 79,504<br />
Accumulated depreciation/impairment losses<br />
Balance at Jan 1, <strong>2009</strong> 3,441 44,342 1,501 1 3 49,288<br />
Additions/disposals due to changes in the scope of consolidation 10 14 -1 -1 22<br />
Depreciation/impairment losses in the reporting period 167 1,582 149 2 1,900<br />
Transfers -14 -14<br />
Currency translation adjustments 8 209 16 233<br />
Disposals 35 400 106 541<br />
Write-backs 11 11<br />
Balance at Dec 31, <strong>2009</strong> 3,566 45,747 1,559 5 50,877<br />
Carrying amounts<br />
Balance at Dec 31, <strong>2009</strong> 3,393 18,257 520 1,869 4,588 28,627<br />
Total<br />
Cost<br />
Balance at Jan 1, 2008 6,680 57,701 1,955 837 1,715 68,888<br />
Additions/disposals due to changes in the scope of consolidation 48 87 30 17 -14 168<br />
Additions 137 1,454 149 178 2,286 4,204<br />
Transfers 14 674 25 -8 -767 -62<br />
Currency translation adjustments -153 -911 -81 -255 -1,400<br />
Disposals 114 486 136 12 748<br />
Balance at Dec 31, 2008 6,612 58,519 1,942 1,024 2,953 71,050<br />
Accumulated depreciation/impairment losses<br />
Balance at Jan 1, 2008 3,397 43,862 1,560 1 30 48,850<br />
Additions/disposals due to changes in the scope of consolidation 6 -166 -4 3 -161<br />
Depreciation/impairment losses in the reporting period 164 1,503 129 1,796<br />
Transfers -6 1 2 -3<br />
Currency translation adjustments -54 -453 -57 -1 -565<br />
Disposals 62 399 129 590<br />
Write-backs 4 6 29 39<br />
Balance at Dec 31, 2008 3,441 44,342 1,501 1 3 49,288<br />
Carrying amounts<br />
Balance at Dec 31, 2008 3,171 14,177 441 1,023 2,950 21,762
<strong>2009</strong> in brief To <strong>our</strong> investors Review of operations Our responsibility<br />
Responsibility statement Consolidated financial statements Further information<br />
Notes 169<br />
Of the additions/disposals due to changes in the scope of<br />
consolidation, €2,947 million was related to the Essent Group.<br />
The carrying amount of property, plant, and equipment<br />
for exploration activities was €354 million (previous year:<br />
€292 million).<br />
Property, plant and equipment were subject to restrictions in<br />
the amount of €367 million (previous year: €99 million) in the<br />
form of land charges and chattel mortgages. Of the carrying<br />
amount of property, plant and equipment, €74 million (previous<br />
year: €76 million) was attributable to assets leased under<br />
finance leases. These assets were principally comprised of<br />
technical plant and equipment with a total value of €64 million<br />
(previous year: €66 million). Disposal of property, plant and<br />
equipment resulted from the sale and decommissioning of<br />
plants.<br />
(12) Investment property<br />
Investment property<br />
€ million<br />
Cost<br />
Balance at Jan 1, <strong>2009</strong> 366<br />
Additions/disposals due to changes<br />
in the scope of consolidation -1<br />
Additions<br />
Transfers 31<br />
Currency adjustments 1<br />
Disposals 19<br />
Balance at Dec 31, <strong>2009</strong> 378<br />
Accumulated depreciation/impairment losses<br />
Balance at Jan 1, <strong>2009</strong> 186<br />
Depreciation/impairment losses in the reporting period 8<br />
Transfers 14<br />
Disposals 12<br />
Balance at Dec 31, <strong>2009</strong> 196<br />
Carrying amounts<br />
Balance at Dec 31, <strong>2009</strong> 182<br />
Investment property<br />
€ million<br />
Cost<br />
Balance at Jan 1, 2008 333<br />
Additions/disposals due to changes<br />
in the scope of consolidation<br />
Additions 4<br />
Transfers 35<br />
Currency adjustments<br />
Disposals 6<br />
Balance at Dec 31, 2008 366<br />
Accumulated depreciation/impairment losses<br />
Balance at Jan 1, 2008 180<br />
Depreciation/impairment losses in the reporting period 7<br />
Transfers 3<br />
Disposals 4<br />
Balance at Dec 31, 2008 186<br />
Carrying amounts<br />
Balance at Dec 31, 2008 180<br />
As of December 31, <strong>2009</strong>, the fair value of investment property<br />
amounted to €254 million (previous year: €285 million). The<br />
fair value of investment property is derived from the current<br />
market prices of comparable real estate or determined using<br />
internationally accepted valuation methods such as the<br />
discounted cash flow method. €80 million of the fair value<br />
(previous year: €81 million) is based on valuations by independent<br />
appraisers. Rental income in the reporting period<br />
amounted to €23 million (previous year: €22 million). Direct<br />
operating expenses totalled €11 million (previous year:<br />
€9 million).
170 Notes RWE Annual Report <strong>2009</strong><br />
(13) Investments accounted for using the equity method<br />
The following summaries present the key items from the<br />
balance sheets and income statements of companies accounted<br />
for using the equity method:<br />
Investments accounted for using the equity method<br />
€ million<br />
Equity<br />
Dec 31, <strong>2009</strong> Dec 31, 2008<br />
Total<br />
Of which:<br />
joint<br />
ventures<br />
Total<br />
Of which:<br />
joint<br />
ventures<br />
Assets 24,312 3,739 19,637 2,954<br />
Liabilities 13,997 2,573 11,613 1,610<br />
10,315 1,166 8,024 1,344<br />
Adjustment to RWE interest and equity method -6,579 -583 -4,756 -672<br />
3,736 583 3,268 672<br />
Income from investments accounted for using the equity method<br />
€ million<br />
Total<br />
<strong>2009</strong> 2008<br />
Of which:<br />
joint<br />
ventures<br />
Total<br />
Of which:<br />
joint<br />
ventures<br />
Revenue 18,882 253 14,525 115<br />
Income 1,277 -185 1,665 -104<br />
Adjustment to RWE interest and equity method -1,146 23 -1,293 52<br />
131 -162 372 -52<br />
As of December 31, <strong>2009</strong>, the fair value of investments accounted<br />
for using the equity method for which quoted market<br />
prices exist amounted to €2 million (previous year: €2 million).<br />
€3,457 million (previous year: €2,802 million) of the assets and<br />
€1,569 million (previous year: €1,019 million) of the liabilities<br />
of joint ventures were non-current.<br />
(14) Other non-current financial assets<br />
Other non-current financial assets<br />
€ million<br />
Dec 31,<br />
<strong>2009</strong><br />
Dec 31,<br />
2008<br />
Non-consolidated subsidiaries 170 57<br />
Other investments 386 307<br />
Non-current securities 153 317<br />
709 681<br />
Non-current securities primarily consist of fixed-interest marketable<br />
securities and shares of public companies. Long-term<br />
securities amounting to €95 million (previous year: €75 million)<br />
were deposited in a trust account for RWE AG and it subsidiaries<br />
to cover credit balances stemming from the block model<br />
for pre-retirement part-time work, pursuant to sec. 8a of the<br />
Pre-Retirement Part-Time Work Act (AltTZG).
<strong>2009</strong> in brief To <strong>our</strong> investors Review of operations Our responsibility<br />
Responsibility statement Consolidated financial statements Further information<br />
Notes 171<br />
(15) Financial receivables<br />
Financial receivables<br />
Dec 31, <strong>2009</strong> Dec 31, 2008<br />
€ million<br />
Non-current Current Non-current Current<br />
Loans to non-consolidated subsidiaries and investments 806 487 643 258<br />
Collateral for trading activities 2,022 3,562<br />
Other financial receivables<br />
Accrued interest 127 131<br />
Miscellaneous other financial receivables 312 786 671 468<br />
1,118 3,422 1,314 4,419<br />
As of the balance-sheet date, financial receivables from<br />
associates amounted to €1,470 million (previous year:<br />
€1,107 million).<br />
over-the-counter (OTC) transactions. These guarantees are designed<br />
to ensure that the obligations from the transactions are<br />
discharged even if the development of prices is not fav<strong>our</strong>able.<br />
RWE Group companies were required to deposit collateral for<br />
the trading activities stated above for exchange-based and<br />
(16) Other receivables and other assets<br />
Other receivables and other assets<br />
Dec 31, <strong>2009</strong> Dec 31, 2008<br />
€ million<br />
Non-current Current Non-current Current<br />
Derivatives 1,769 10,433 911 13,569<br />
Surplus of plan assets over benefit obligations 79<br />
Prepayments for items other than inventories 714 297<br />
CO 2 emission allowances 1,117 1,216<br />
Prepaid expenses 162 128<br />
Miscellaneous other assets 640 1,358 281 896<br />
2,488 13,784 1,192 16,106<br />
With the exception of derivatives, the financial instruments reported<br />
under other receivables and other assets are measured<br />
at amortised cost. Derivative financial instruments are stated at<br />
fair value.<br />
The carrying values of exchange-traded derivatives with netting<br />
agreements are offset.<br />
Changes in the scope of consolidation increased other receivables<br />
and other assets by €3,836 million.
172 Notes RWE Annual Report <strong>2009</strong><br />
(17) Income tax assets<br />
Based on the act on fiscal measures accompanying the introduction<br />
of the European Company and the amendment of other<br />
fiscal regulations (SEStEG), a legally unconditional claim for the<br />
refund of corporate tax credits stemming from the previous tax<br />
credit system (cf. Sec. 37 of the German Corporate Income Tax<br />
Act, as amended, KStG) was created as of December 31, 2006.<br />
Distribution-dependent realisation of the credit was replaced<br />
by a procedure by which payments are made in instalments<br />
over a period of 10 years (2008 to 2017). As a rule, payments<br />
are effective September 30. Since this receivable is non-interest<br />
bearing, it is stated at present value.<br />
(18) Deferred taxes<br />
Deferred tax assets and liabilities principally relate to measurements<br />
deviating from the tax bases. €2,473 million and<br />
€2,603 million of the gross deferred tax assets and liabilities,<br />
respectively, will be realised within twelve months (previous<br />
year: €3,159 million and €3,141 million).<br />
The following is a breakdown of deferred tax assets and liabilities<br />
by item:<br />
Deferred taxes<br />
Dec 31, <strong>2009</strong> Dec 31, 2008<br />
€ million<br />
Assets Liabilities Assets Liabilities<br />
Non-current assets 517 2,678 345 1,880<br />
Current assets 381 2,009 459 2,288<br />
Exceptional tax items 267 284<br />
Non-current liabilities<br />
Provisions for pensions 581 114 290 53<br />
Other non-current provisions 1,752 168 1,603 161<br />
Current liabilities 2,092 594 2,700 853<br />
5,323 5,830 5,397 5,519<br />
Tax loss carryforwards 56 148<br />
Gross total 5,379 5,830 5,545 5,519<br />
Netting -3,503 -3,503 -3,936 -3,936<br />
Net total 1,876 2,327 1,609 1,583<br />
Deferred tax assets and deferred tax liabilities are netted out<br />
for each company and/or tax group.<br />
Total deferred tax assets include the following capitalised tax<br />
reduction claims which result from the expected utilisation of<br />
previously unused tax loss carryforwards in subsequent years:<br />
Tax reduction claims from loss<br />
carryforwards<br />
€ million<br />
Dec 31,<br />
<strong>2009</strong><br />
Dec 31,<br />
2008<br />
Corporate income tax (or comparable<br />
foreign income tax) 47 41<br />
Trade tax 9 107<br />
56 148<br />
Realisation of these tax carryforwards is guaranteed with sufficient<br />
certainty. At the end of the reporting period, corporate<br />
income tax loss carryforwards and trade tax loss carryforwards<br />
for which no deferred tax claims have been recognised amounted<br />
to €372 million and €187 million, respectively (previous<br />
year: €399 million and €424 million). €79 million of these income<br />
tax loss carryforwards apply to the next two years.<br />
The other loss carryforwards can essentially be used for an unlimited<br />
period.<br />
In the year under review, deferred tax expenses of €63 million<br />
(previous year: deferred tax income of €180 million) arising<br />
from the translation of foreign financial statements were offset<br />
against equity.
<strong>2009</strong> in brief To <strong>our</strong> investors Review of operations Our responsibility<br />
Responsibility statement Consolidated financial statements Further information<br />
Notes 173<br />
(19) Inventories<br />
Inventories<br />
€ million<br />
Dec 31,<br />
<strong>2009</strong><br />
Dec 31,<br />
2008<br />
Raw materials, incl. nuclear fuel assemblies and earth excavated for lignite mining 2,125 1,613<br />
Work in progress-goods 27 23<br />
Work in progress-services 82 47<br />
Finished goods and goods for resale 857 839<br />
Prepayments 24 18<br />
3,115 2,540<br />
Inventories were not subject to any restrictions on disposal<br />
and there were no further obligations.<br />
The carrying amount of inventories acquired for resale purposes<br />
amounted to €245 million (previous year: €99 million).<br />
ketable securities are stated at fair value. As of December 31,<br />
<strong>2009</strong>, the average return on fixed-interest securities was 2.1 %<br />
(previous year: 3.9 %). Securities in the amount of €649 million<br />
(previous year: €714 million) were deposited with a clearing<br />
bank as collateral.<br />
Changes in the scope of consolidation resulted in an increase<br />
of €231 million in inventories.<br />
(20) Trade accounts receivable<br />
As of the balance-sheet date, trade accounts receivable from<br />
associates amounted to €292 million (previous year: €222 million).<br />
Trade accounts receivable increased by €1,040 million due to<br />
changes in the scope of consolidation.<br />
(21) Marketable securities<br />
The total value of current marketable securities was €3,290 million<br />
(previous year: €7,735 million), consisting of fixed-interest<br />
marketable securities of €2,642 million (previous year:<br />
€7,147 million) with a maturity of more than three months from<br />
the date of acquisition, and stocks and profit-participation<br />
certificates of €648 million (previous year: €588 million). Mar-<br />
(22) Cash and cash equivalents<br />
Cash and cash equivalents<br />
€ million<br />
Demand deposits are only kept for short-term cash positions at<br />
banks with a minimum rating of A-/A3 by one of the renowned<br />
rating agencies, Moody’s or Standard & Poor’s. As in the previous<br />
year, interest rates are maintained at market levels.<br />
(23) Equity<br />
A breakdown of equity is shown on page 144.<br />
Subscribed capital is structured as follows:<br />
Dec 31,<br />
<strong>2009</strong><br />
Dec 31,<br />
2008<br />
Cash 2,113 994<br />
Marketable securities and other cash<br />
investments (maturity less than three<br />
months from the date of acquisition) 961 255<br />
3,074 1,249<br />
Subscribed capital Dec 31, <strong>2009</strong><br />
Number of shares<br />
Dec 31, 2008<br />
Number of shares<br />
Dec 31, <strong>2009</strong><br />
Carrying amount<br />
Dec 31, 2008<br />
Carrying amount<br />
in ’000 in % in ’000 in % € million € million<br />
Common shares 523,405 93.1 523,405 93.1 1,340 1,340<br />
Preferred shares 39,000 6.9 39,000 6.9 100 100<br />
562,405 100.0 562,405 100.0 1,440 1,440
174 Notes RWE Annual Report <strong>2009</strong><br />
Common and preferred shares are no-par-value bearer share<br />
certificates. Preferred shares have no voting rights. Under certain<br />
conditions, preferred shares are entitled to payment of a<br />
preference dividend of €0.13 per preferred share, upon allocation<br />
of the company’s profits.<br />
Accumulated other comprehensive income reflects changes in<br />
the fair values of financial instruments available for sale, cash<br />
flow hedges and hedges of the net investment in foreign<br />
entities, as well as changes stemming from foreign currency<br />
translation adjustments from foreign financial statements.<br />
Pursuant to a resolution passed by the Annual General Meeting<br />
on April 17, 2008, the Executive Board was authorised to increase<br />
the company’s capital stock, subject to the Super visory<br />
Board’s approval, by up to €287,951,360.00 until April 16,<br />
2013, through the issuance of new, bearer common shares in<br />
return for contributions in cash or in kind (authorised capital).<br />
In certain cases, the subscription rights of shareholders can be<br />
waived, with the approval of the Supervisory Board.<br />
Pursuant to a resolution passed by the Annual General Meeting<br />
on April 22, <strong>2009</strong>, the Company was authorised to purchase<br />
shares of any class in RWE totalling up to 10 % of the Company’s<br />
share capital until October 21, 2010. Share buybacks may<br />
also be conducted by exercising put or call options.<br />
Pursuant to a resolution passed by the Annual General Meeting<br />
on April 22, <strong>2009</strong>, the Executive Board was authorised to<br />
withdraw the Company’s shares without requiring an additional<br />
resolution by the Annual General Meeting or – under certain<br />
conditions and waiver of shareholders’ subscription rights – to<br />
sell them to third parties.<br />
Pursuant to a resolution passed by the Annual General Meeting<br />
on April 22, <strong>2009</strong>, the Executive Board was further authorised<br />
to issue option or convertible bonds until April 21, 2014. The<br />
total nominal value of the bonds is limited to €6,000 million.<br />
Shareholders’ subscription rights may be waived under certain<br />
conditions. The Annual General Meeting decided to establish<br />
€144 million in conditional capital divided into 56 million bearer<br />
common shares, in order to redeem the bonds. Shares from<br />
the authorised capital are to be deducted from the shares from<br />
the conditional capital, insofar as they are both issued with a<br />
waiver of shareholders’ subscription rights. Accordingly, the<br />
share capital may not be increased by more than 20 % by the<br />
issue of new shares.<br />
Dividend proposal<br />
We propose to the Annual General Meeting that RWE AG’s<br />
distributable profit for fiscal <strong>2009</strong> be appropriated as follows:<br />
Distribution of a dividend of €3.50 per individual, dividendbearing<br />
share:<br />
Dividend €1,867,454,844.50<br />
Profit carryforward €52,782.63<br />
Distributable profit €1,867,507,627.13<br />
The dividend proposal takes into account the non-dividendbearing<br />
shares held by the company as of December 31, <strong>2009</strong>.<br />
The number of dividend-bearing shares may decline before<br />
the Annual General Meeting if further shares are purchased.<br />
Conversely, the number of dividend-bearing shares may rise if<br />
own shares are sold before the Annual General Meeting. In<br />
either of these cases, based on an unchanged dividend per dividend-bearing<br />
share, an adjusted proposal for the appropriation<br />
of the distributable profit will be made to the Annual<br />
General Meeting, according to which the total amount payable<br />
to the shareholders will be reduced by the partial amount that<br />
would be payable for the own shares additionally purchased<br />
between January 1, 2010 and the date of the proposal for the<br />
appropriation of distributable profit, and will be increased<br />
by the partial amount that would be payable for the own shares<br />
sold between January 1, 2010 and the date of the proposal for<br />
the appropriation of distributable profit. The profit carryforward<br />
will rise or fall by these partial amounts.<br />
Based on a resolution of RWE AG’s Annual General Meeting<br />
on April 22, <strong>2009</strong>, the dividend for fiscal 2008 amounted<br />
to €4.50 per dividend-bearing common and preferred share.<br />
The dividend payment to shareholders of RWE AG totalled<br />
€2,401 million.<br />
On December 31, <strong>2009</strong>, RWE AG held 28,846,473 no-par-value<br />
common shares in RWE AG. The acquisition costs of own shares<br />
amounting to €2,272 million were deducted from the carrying<br />
amount of equity. They account for €73,846,970.88 of the<br />
company’s share capital (5.13 % of subscribed capital).<br />
Minority interest<br />
The share ownership of third parties in Group entities is<br />
presented in this item.
<strong>2009</strong> in brief To <strong>our</strong> investors Review of operations Our responsibility<br />
Responsibility statement Consolidated financial statements Further information<br />
Notes 175<br />
In particular, there are significant minority interests in the<br />
Hungarian energy utilities and in the Czech gas companies.<br />
Additionally, the carrying amount of assets and liabilities allocable<br />
to the American Water shares sold in 2008 is stated as<br />
part of the minority interest in the previous year. These shares<br />
were derecognised due to the deconsolidation of<br />
American Water during the period under review.<br />
(24) Share-based payment<br />
In the year under review, the groupwide share-based payment<br />
systems for executives of RWE AG and subordinate affiliates<br />
consisted of the following: the Long-Term Incentive Plan (LTIP)<br />
and Beat. If the persons holding stock options are not employed<br />
by RWE AG, the expenses associated with the exercise<br />
of the options are borne by the respective Group company.<br />
LTIP 1<br />
2004 tranche<br />
Grant date May 25, 2004<br />
Number of options granted 9,192,800<br />
Term<br />
5 years<br />
Vesting conditions<br />
Two-year waiting period; the common share price must have risen by at least 10 % prior to the exercise<br />
date and must have outperformed the Dow Jones STOXX Utilities Price Index on ten consecutive days in<br />
the same period (this last condition does not apply if the common share price increases by at least 20 %).<br />
Upon achievement of the above performance targets, the options can be exercised on a daily basis following<br />
expiration of the waiting period, with the exception of short blocking periods prior to the publication<br />
of corporate data. The number of options which may be exercised depends on the increase in the price of<br />
the common share compared to the exercise price determined when the options are granted. In the event<br />
of a 20 % price increase all of the options can be exercised; for a 15 or 10 % increase, 60 or 25 % of the<br />
options can be exercised, respectively.<br />
Exercise price 35.45 €<br />
<strong>For</strong>m of settlement<br />
Cash settlement amounting to the difference between the share price upon exercise and the exercise price<br />
or provision of common shares (at the discretion of RWE AG). Settlement is limited to 50 % of the exercise<br />
price.<br />
1 Long-Term Incentive Plan.
176 Notes RWE Annual Report <strong>2009</strong><br />
Beat<br />
2006 tranche 2007 tranche 2008 tranche <strong>2009</strong> tranche<br />
Grant date Jan 1, 2006 Jan 1, 2007 Jan 1, 2008 Jan 1, <strong>2009</strong><br />
Number of conditionally<br />
granted performance shares 2,444,191 1,468,132 1,668,836 3,251,625<br />
Term 3 years 3 years 3 years 3 years<br />
Pay-out conditions Automatic pay-out if following a waiting period of three years an outperformance of at least 25 %<br />
compared to the Dow Jones STOXX Utilities Index peer group has been achieved, measured in<br />
terms of their index weighting as of the inception of the programme. Measurement of outperformance<br />
is carried out using Total Shareholder Return (TSR), which takes into account both the<br />
development of the share price and reinvested dividends.<br />
Determination of payment<br />
Change in corporate<br />
control/merger<br />
<strong>For</strong>m of settlement<br />
1. Determination of the index weighting of the peer group companies which exhibit a lower TSR<br />
than RWE at the end of the term.<br />
2. Performance factor is calculated by squaring this percentage rate and multiplying it by 1.25.<br />
3. Total number of performance shares which can be paid out is calculated by multiplying the<br />
performance shares conditionally granted by the performance factor.<br />
4. Payment corresponds to the final number of performance shares valued at the average RWE<br />
share price during the last 20 trading days prior to expiration of the programme (with a ceiling<br />
of two times the value of the performance shares as of the grant date).<br />
• If during the waiting period there is a change in corporate control, a compensation payment is<br />
made. This is calculated by multiplying the price paid in the acquisition of the RWE shares by<br />
the final number of performance shares. The latter shall be determined as per the regulations of<br />
the compensation plan with regard to the time when the bid for corporate control is submitted.<br />
• In the event of merger with another company, compensation shall be calculated on the basis<br />
of the expected value of the performance shares at the time of the merger multiplied by the<br />
prorated number of performance shares corresponding to the ratio between the total waiting<br />
period and the waiting period until the merger takes place.<br />
Cash settlement<br />
Long-Term Incentive Plan. The following changes in the<br />
number of outstanding LTIP options occurred in the year<br />
under review:<br />
LTIP<br />
2004 tranche<br />
Outstanding at the start of the fiscal year 12,000<br />
Exercised -12,000<br />
Outstanding at the end of the fiscal year 0<br />
Exercisable at the end of the fiscal year 0<br />
The average weighted share price as of the exercise date<br />
amounted to €59.71 for the options from LTIP exercised in the<br />
previous fiscal year.
<strong>2009</strong> in brief To <strong>our</strong> investors Review of operations Our responsibility<br />
Responsibility statement Consolidated financial statements Further information<br />
Notes 177<br />
Beat. The fair value of the performance shares conditionally<br />
granted in the Beat programme amounted to €11.93 per share<br />
as of the grant date for the <strong>2009</strong> tranche, €22.25 per share for<br />
the 2008 tranche, and €24.99 per share for the 2007 tranche.<br />
These values were calculated externally using a standard multivariate<br />
Black-Scholes model via Monte Carlo simulations on the<br />
basis of one million scenarios each. In the calculations, due<br />
consideration was taken of the maximum payment stipulated in<br />
the programme’s conditions for each conditionally granted<br />
performance share, the discount rates for the remaining term,<br />
the volatilities and the expected dividends of RWE AG and of<br />
peer companies.<br />
In the year under review, the number of performance shares<br />
issued in the Beat programme developed as follows:<br />
Beat 2006 tranche 2007 tranche 2008 tranche <strong>2009</strong> tranche<br />
Outstanding at the start of the fiscal year 2,373,355 1,451,304 1,664,239 0<br />
Granted 3,251,625<br />
Change in grant / expired -4,201 -2,203 -7,984<br />
Paid out -2,373,355<br />
Outstanding at the end of the fiscal year 0 1,447,103 1,662,036 3,243,641<br />
Payable at the end of the fiscal year 0 1,447,103 0 0<br />
The remaining contractual term amounted to one year for the<br />
2008 tranche and two years for the <strong>2009</strong> tranche. The contractual<br />
term for the 2007 tranche ended upon completion of the<br />
year under review. In accordance with the plan regulations, the<br />
payment amount is €19.64 per performance share.<br />
RWE Npower plc/RWE Supply & Trading GmbH/<br />
RWE IT UK Ltd./RWE Npower Renewables Ltd.<br />
In addition to the above, the following share-based payment<br />
systems with equity settlement for executives and employees<br />
exist at the level of the divisions:<br />
Sharesave Scheme<br />
Awards/tranches 2005 – <strong>2009</strong><br />
Number of options granted per tranche 247,119 – 390,756<br />
Term<br />
3 years<br />
Vesting conditions<br />
Waiting period: 3 years<br />
Exercise price £ 27.33 – 50.24<br />
<strong>For</strong>m of settlement<br />
Existing shares<br />
In the year under review, the number of outstanding Sharesave<br />
Scheme options developed as follows:<br />
RWE Npower plc/RWE Supply & Trading GmbH/<br />
RWE IT UK Ltd./RWE Npower Renewables Ltd.<br />
Sharesave<br />
Scheme<br />
Outstanding at the start of the fiscal year 888,232<br />
Granted 268,619<br />
Exercised -351,221<br />
Expired -59,958<br />
Outstanding at the end of the fiscal year 745,672<br />
Exercisable at the end of the fiscal year 36,098
178 Notes RWE Annual Report <strong>2009</strong><br />
The total expense for the groupwide share-based payment<br />
systems amounted to €46 million (previous year: €71 million) in<br />
fiscal <strong>2009</strong>. Of this amount, €0 million was attributable to<br />
equity-settled share-based payment transactions of RWE AG, as<br />
in the previous year. As of the balance-sheet date, provisions in<br />
the amount of €79 million have been recognised for cash-<br />
settled share-based payment programmes (previous year:<br />
€110 million). The intrinsic value of the cash-settled sharebased<br />
payment transactions exercisable or payable as of the<br />
balance-sheet date amounted to €28 million (previous year:<br />
€77 million).<br />
(25) Provisions<br />
Provisions<br />
Dec 31, <strong>2009</strong> Dec 31, 2008<br />
€ million<br />
Non-current Current Total Non-current Current Total<br />
Provisions for pensions and similar obligations 3,281 3,281 2,738 2,738<br />
Provisions for taxes 2,796 316 3,112 2,684 281 2,965<br />
Provisions for nuclear waste management 9,250 241 9,491 9,262 203 9,465<br />
Provisions for mining damage 2,618 94 2,712 2,759 107 2,866<br />
17,945 651 18,596 17,443 591 18,034<br />
Other provisions<br />
Staff-related obligations (excluding restructuring) 793 850 1,643 725 850 1,575<br />
Restructuring obligations 386 142 528 381 134 515<br />
Purchase and sales obligations 1,210 887 2,097 867 869 1,736<br />
Uncertain obligations in the electricity business 449 389 838 304 453 757<br />
Environmental protection obligations 127 26 153 94 29 123<br />
Interest payment obligations 564 24 588 548 16 564<br />
Obligations to deliver CO 2 emission allowances/<br />
certificates for renewable energies 1,242 1,242 1,396 1,396<br />
Miscellaneous other provisions 841 1,618 2,459 710 1,347 2,057<br />
4,370 5,178 9,548 3,629 5,094 8,723<br />
22,315 5,829 28,144 21,072 5,685 26,757<br />
Provisions for pensions and similar obligations. The company<br />
pension plan consists of defined contribution and defined benefit<br />
plans. In the Netherlands, RWE participates in a benefit<br />
plan, with payments for this plan made to a Dutch pension<br />
fund. This benefit plan is composed of commitments by various<br />
employers. This fund does not provide the individual employers<br />
information allowing for the pro-rata allocation of commitments,<br />
plan assets and service cost. In RWE’s consolidated<br />
financial statements, the contributions are recognised analogously<br />
to a defined contribution plan. In the reporting period,<br />
€24 million (previous year: €10 million) was paid into defined<br />
contribution plans.<br />
In <strong>2009</strong>, €470 million (previous year: €1,398 million) in assets<br />
was transferred to the trust RWE Pensionstreuhand e.V. to externally<br />
finance further parts of the corporate pension plan via<br />
contractual trust arrangements (CTA). Since the transferred assets<br />
are classified as plan assets as defined by IAS 19, provisions<br />
for pensions and similar obligations were netted out<br />
against the transferred assets as of December 31, <strong>2009</strong>. As a<br />
result, provisions for pensions and similar obligations declined<br />
accordingly.
<strong>2009</strong> in brief To <strong>our</strong> investors Review of operations Our responsibility<br />
Responsibility statement Consolidated financial statements Further information<br />
Notes 179<br />
Provisions for defined benefit plans are determined using actuarial<br />
methods. The following assumptions are applied:<br />
Calculation assumptions<br />
Dec 31, <strong>2009</strong> Dec 31, 2008<br />
in %<br />
Germany <strong>For</strong>eign 1 Germany <strong>For</strong>eign 1<br />
Discount rate 5.25 5.70 6.00 6.50<br />
Compensation increase 2.75 5.20 2.75 4.20<br />
Pension increase 1.00 – 1.50 3.50 1.00 – 1.50 2.70<br />
Expected return on the plan assets 5.75 5.25 6.00 5.70<br />
1 Pertains to benefit commitments to employees of the RWE Group in the UK.<br />
The expected return on plan assets was determined depending<br />
on the specific asset categories. The expected return on equity<br />
investments reflects the long-term average performance observed<br />
for the industries and geographical markets involved,<br />
taking into account the current composition of the equity portfolio.<br />
<strong>For</strong> fixed-interest securities, the expected return was derived<br />
from appropriately selected trading prices and indices, in<br />
accordance with accepted methods. The expected return on<br />
real estate was calculated on the basis of marketing possibilities<br />
determined by contractual obligations and local market<br />
conditions.<br />
Provisions for pensions are broken down as follows:<br />
Provisions for pensions and similar obligations (funded and unfunded plans)<br />
€ million<br />
Dec 31, <strong>2009</strong> Dec 31, 2008<br />
Present value of funded benefit obligations 14,588 11,872<br />
Fair value of plan assets 13,139 11,030<br />
Net balance for funded plans 1,449 842<br />
Capitalised surplus of plan assets over benefit obligations 79<br />
Provision recognised for funded plans 1,528 842<br />
Provision recognised for unfunded plans 1,753 1,896<br />
3,281 2,738<br />
Disregarding taxes, as of December 31, <strong>2009</strong>, cumulative<br />
actuarial gains and losses amounted to –€6,287 million<br />
(Dec 31, 2008: –€5,181 million).<br />
Development of plan assets<br />
Fair value<br />
€ million<br />
<strong>2009</strong> 2008<br />
Balance at Jan 1 11,030 12,675<br />
Expected return on plan assets 660 735<br />
Employer contributions to funded plans 826 1,455<br />
Employee contributions to funded plans 13 19<br />
Benefits paid by funded plans -786 -716<br />
Actuarial gains (losses) of funded plans 1,162 -2,107<br />
Currency translation adjustments 234 -1,032<br />
Changes in the scope of consolidation 1<br />
Balance at Dec 31 13,139 11,030
180 Notes RWE Annual Report <strong>2009</strong><br />
The actual return on plan assets amounted to €1,822 million<br />
(previous year: -€1,372 million).<br />
Composition of plan assets (fair value)<br />
Dec 31, <strong>2009</strong> Dec 31, 2008<br />
€ million<br />
Germany 1 <strong>For</strong>eign 2 Total Germany 1 <strong>For</strong>eign 2 Total<br />
Equity capital instruments 3,042 270 3,312 1,605 318 1,923<br />
Interest-bearing instruments 5,208 3,052 8,260 5,417 2,278 7,695<br />
Real estate 78 80 158 97 127 224<br />
Alternative investments 742 360 1,102 568 458 1,026<br />
Other 3 135 172 307 106 56 162<br />
9,205 3,934 13,139 7,793 3,237 11,030<br />
1 Plan assets in Germany primarily pertain to assets of RWE AG and of various Group companies which are managed by RWE Pensionstreuhand e.V. as a trust,<br />
as well as to assets of RWE Pensionsfonds AG.<br />
2 <strong>For</strong>eign plan assets pertain to the assets of a UK pension fund for covering benefit commitments to employees of the RWE Group in the UK.<br />
3 Includes reinsurance claims against insurance companies and other fund assets of provident funds.<br />
Composition of plan assets (targeted investment structure)<br />
Dec 31, <strong>2009</strong> Dec 31, 2008<br />
in %<br />
Germany 1 <strong>For</strong>eign 2 Germany 1 <strong>For</strong>eign 2<br />
Equity capital instruments 28.4 6.9 28.6 9.8<br />
Interest-bearing instruments 59.3 77.6 58.9 70.3<br />
Real estate 2.3 2.0 2.5 3.9<br />
Alternative investments 10.0 9.1 10.0 14.1<br />
Other 3 4.4 1.9<br />
100.0 100.0 100.0 100.0<br />
1 Plan assets in Germany primarily pertain to assets of RWE AG and of various Group companies which are managed by RWE Pensionstreuhand e.V. as a trust,<br />
as well as to assets of RWE Pensionsfonds AG.<br />
2 <strong>For</strong>eign plan assets pertain to the assets of a UK pension fund for covering benefit commitments to employees of the RWE Group in the UK.<br />
3 Does not include reinsurance claims against insurance companies and other fund assets of provident funds, as such do not fall under the scope of<br />
portfolio management as a whole.<br />
Development of pension claims<br />
€ million<br />
Present value<br />
<strong>2009</strong> 2008<br />
Balance at Jan 1 13,768 15,733<br />
Current service cost 143 164<br />
Interest cost 836 832<br />
Contributions by employees 13 19<br />
Actuarial gains (losses) 2,268 -1,022<br />
Benefits paid -908 -911<br />
Past service cost -36 -13<br />
Currency translation adjustments 252 -1,039<br />
Changes in the scope of consolidation 5 5<br />
Balance at Dec 31 16,341 13,768
<strong>2009</strong> in brief To <strong>our</strong> investors Review of operations Our responsibility<br />
Responsibility statement Consolidated financial statements Further information<br />
Notes 181<br />
Past service costs in fiscal 2008 and <strong>2009</strong> mainly resulted<br />
from plan curtailments.<br />
Expenses for pension provisions<br />
€ million<br />
<strong>2009</strong> 2008<br />
Service cost 143 164<br />
Interest cost 836 832<br />
Expected return on plan assets -660 -735<br />
Amortisation of past service cost -36 -13<br />
283 248<br />
Since 2005, the present value of pension claims, the fair value<br />
of plan assets and the net amount of funded and unfunded<br />
pension plans have developed as follows:<br />
€ million <strong>2009</strong> 2008 2007 2006 2005<br />
Present value of pension claims 16,341 13,768 15,733 17,955 20,642<br />
Fair value of plan assets 13,139 11,030 12,675 6,119 7,692<br />
Net amount of funded and unfunded pension plans (balance) 3,202 2,738 3,058 11,836 12,950<br />
<strong>For</strong> the reporting period and the previous years, the following<br />
experience adjustments were made to the present values of the<br />
pension claims and the fair values of the plan assets:<br />
Experience adjustments<br />
€ million<br />
<strong>2009</strong> 2008 2007 2006 2005<br />
Present value of pension claims -451 -40 367 38 -61<br />
Fair value of plan assets 1,162 -2,107 -494 -69 550<br />
Experience adjustments to the present values of pension claims<br />
are part of the actuarial gains or losses on the pension claims<br />
for the year in question. Experience adjustments to the fair values<br />
of plan assets are to be equated with the actuarial gains or<br />
losses arising on the plan assets for the year in question.<br />
Payments for defined benefit plans are expected to amount to<br />
€247 million in fiscal 2010.
182 Notes RWE Annual Report <strong>2009</strong><br />
Roll-forward of provisions<br />
€ million<br />
Balance at<br />
Jan 1,<br />
<strong>2009</strong><br />
Additions<br />
Unused<br />
amounts<br />
released<br />
Interest<br />
accretion/<br />
change in<br />
discount<br />
rate<br />
Changes in<br />
the scope<br />
of consolidation,<br />
currency<br />
adjustments,<br />
transfers<br />
Amounts<br />
used<br />
Balance at<br />
Dec 31,<br />
<strong>2009</strong><br />
Provisions for pensions 2,738 107 176 1,208 1 -948 3,281<br />
Provisions for taxes 2,965 767 -33 -278 -309 3,112<br />
Provisions for nuclear waste management 9,465 122 -388 446 -154 9,491<br />
Provisions for mining damage 2,866 165 -394 121 12 -58 2,712<br />
Other provisions<br />
18,034 1,161 -815 743 942 -1,469 18,596<br />
Staff-related obligations<br />
(excluding restructuring) 1,575 720 -54 29 43 -670 1,643<br />
Restructuring obligations 515 83 -35 51 38 -124 528<br />
Purchase and sales obligations 1,736 1,000 -309 56 8 -394 2,097<br />
Uncertain obligations in the<br />
electricity business 757 94 -41 18 92 -82 838<br />
Environmental protection obligations 123 6 -7 3 40 -12 153<br />
Interest payment obligations 564 169 -1 -105 -39 588<br />
Obligations to deliver CO 2 emission allowances/certificates<br />
for renewable energies 1,396 1,244 -1 25 -1,422 1,242<br />
Miscellaneous other provisions 2,057 593 -294 57 306 -260 2,459<br />
8,723 3,909 -742 214 447 -3,003 9,548<br />
Provisions 26,757 5,070 -1,557 957 1,389 -4,472 28,144<br />
of which: changes in the scope<br />
of consolidation (645)<br />
1 Incl. treatment of actuarial gains and losses as per IAS 19.93A.
<strong>2009</strong> in brief To <strong>our</strong> investors Review of operations Our responsibility<br />
Responsibility statement Consolidated financial statements Further information<br />
Notes 183<br />
The vast majority of provisions for nuclear waste management<br />
are recognised as non-current provisions, and their settlement<br />
amount is discounted to the balance-sheet date. From the<br />
current perspective, the majority of utilisation is anticipated to<br />
occur in the years 2020 to 2050. As in the previous year, an<br />
interest rate of 5.0 % was used as the discount rate. Volumebased<br />
increases in the provisions are measured at their present<br />
value. In the reporting period, they amounted to €122 million<br />
(previous year: €80 million). By releasing €388 million from<br />
provisions (previous year: additions of €71 million), we have<br />
taken into account that waste disposal costs are expected to be<br />
lower, according to current estimates. Additions to provisions<br />
for nuclear waste management primarily consist of an interest<br />
accretion of €446 million (previous year: €447 million).<br />
€796 million in prepayments, primarily to foreign reprocessing<br />
companies and to the German Federal Office for Radiation Protection<br />
(BfS) for the construction of final storage facilities, were<br />
deducted from these provisions (previous year: €737 million).<br />
In terms of their contractual definition, provisions for nuclear<br />
waste management break down as follows:<br />
Provisions for nuclear waste<br />
management<br />
€ million<br />
Dec 31,<br />
<strong>2009</strong><br />
In respect of the disposal of spent nuclear fuel assemblies,<br />
the provisions for obligations which are not yet contractually<br />
defined cover the estimated long-term costs of direct final<br />
storage of fuel assemblies, which is currently the only possible<br />
disposal method in Germany, as well as the costs for the disposal<br />
of radioactive waste from reprocessing. The latter essentially<br />
consist of costs for transport from centralised storage<br />
facilities and the plants’ intermediate storage facilities to<br />
reprocessing plants and final storage as well as conditioning<br />
for final storage and containers. These estimates are mainly<br />
Dec 31,<br />
2008<br />
Provisions for nuclear obligations,<br />
not yet contractually defined 7,557 7,574<br />
Provisions for nuclear obligations,<br />
contractually defined 1,934 1,891<br />
9,491 9,465<br />
based on studies by internal and external experts, in particular<br />
by GNS Gesellschaft für Nuklear-Service mbH in Essen, Germany.<br />
With regard to the decommissioning of nuclear power<br />
plants, the costs for the post-operational phase and dismantling<br />
are taken into consideration, on the basis of data<br />
from external expert opinions prepared by NIS Ingenieurgesellschaft<br />
mbH, Alzenau, Germany, which are generally accepted<br />
throughout the industry and are updated continuously. Finally,<br />
this item also covers all of the costs of final storage for all<br />
radio active waste, based on data provided by BfS.<br />
Provisions for contractually defined nuclear obligations are<br />
related to all nuclear obligations for the disposal of fuel assemblies<br />
and radioactive waste as well as for the decommissioning<br />
of nuclear power plants, insofar as the value of said obligations<br />
is specified in contracts under civil law. They include the anti -<br />
cipated residual costs of reprocessing, return (transport, containers)<br />
and intermediate storage of the resulting radio active<br />
waste, as well as the additional costs of the utilisation of uranium<br />
and plutonium from reprocessing activities. These costs are<br />
based on existing contracts with foreign reprocessing companies<br />
and with GNS. Moreover, these provisions also take into<br />
account the costs for transport and intermediate storage of<br />
spent fuel assemblies within the framework of final direct storage.<br />
The power plants’ intermediate storage facilities are<br />
licensed for an operational period of 40 years. These facilities<br />
commenced operations between 2002 and 2006. Furthermore,<br />
the amounts are also stated for the conditioning and intermediate<br />
storage of radioactive operational waste, which is primarily<br />
performed by GNS.<br />
With due consideration of the German Atomic Energy Act<br />
(AtG), in particular to Sec. 9a of AtG, the provision for nuclear<br />
waste management breaks down as follows:<br />
Provisions for nuclear waste<br />
management<br />
€ million<br />
Dec 31,<br />
<strong>2009</strong><br />
Provisions for mining damage also consist primarily of noncurrent<br />
provisions. They are recognised at the settlement<br />
amount discounted to the balance-sheet date. As in the previous<br />
year, we use a discount rate of 5.0 %. In the reporting<br />
period, additions to provisions for mining damage amounted<br />
to €165 million (previous year: €104 million). Of this, an increase<br />
of €84 million (previous year: €42 million) was capitalised<br />
under property, plant and equipment. The interest<br />
accretion of the additions to provisions for mining damage<br />
amounted to €121 million (previous year: €135 million).<br />
Provisions for restructuring pertain mainly to measures for<br />
socially acceptable payroll downsizing from previous years.<br />
Dec 31,<br />
2008<br />
Decommissioning of nuclear facilities 4,626 4,585<br />
Disposal of nuclear fuel assemblies 4,303 4,351<br />
Disposal of radioactive operational waste 562 529<br />
9,491 9,465
184 Notes RWE Annual Report <strong>2009</strong><br />
(26) Financial liabilities<br />
Financial liabilities<br />
Dec 31, <strong>2009</strong> Dec 31, 2008<br />
€ million<br />
Non-current Current Non-current Current<br />
Bonds payable (incl. other notes payable) 15,904 640 10,041 165<br />
Commercial paper 238 846<br />
Bank debt 411 514 481 306<br />
Other financial liabilities<br />
Collateral for trading activities 945 541<br />
Miscellaneous other liabilities 704 790 632 471<br />
17,019 3,127 11,154 2,329<br />
Financial liabilities to associates totalled €186 million (previous<br />
year: €137 million).<br />
Changes in the scope of consolidation caused financial liabilities<br />
to increase by €5,349 million.<br />
€16,802 million of the non-current financial liabilities were interest-bearing<br />
liabilities (previous year: €10,983 million). Bank<br />
debt mainly stemmed from the former activities of acquired<br />
companies. Depending on the currency, term and conditions of<br />
the agreement, nominal interest ranged between 0.1 and<br />
10.5 % (previous year: 1.5 and 11.8 %).<br />
The outstanding bonds payable were issued by RWE AG or<br />
RWE Finance B.V. Depending on currency, term and time of<br />
issue, nominal interest is between 2.5 and 6.6 % (previous year:<br />
4.6 and 6.6 %) for public bonds, and between 2.3 and 5.8 %<br />
(previous year: 2.3 and 7.0 %) for private placements.<br />
The following overview shows the structure of the major bonds<br />
payable as of December 31, <strong>2009</strong>:<br />
Bonds payable<br />
Issuer<br />
Outstanding amount Carrying amount Coupon in % Maturity<br />
RWE Finance B.V. £500 million €563 million 4.625 August 2010<br />
RWE Finance B.V. €1,500 million €1,492 million 2.5 September 2011<br />
RWE Finance B.V. €1,808 million €1,831 million 6.125 October 2012<br />
RWE Finance B.V. £630 million €708 million 6.375 June 2013<br />
RWE Finance B.V. €1,000 million €994 million 5.75 November 2013<br />
RWE Finance B.V. €530 million €528 million 4.625 July 2014<br />
RWE Finance B.V. €2,000 million €1,983 million 5.0 February 2015<br />
RWE Finance B.V. €850 million €854 million 6.25 April 2016<br />
RWE AG €100 million €100 million Variable 1 November 2017<br />
RWE Finance B.V. €980 million €978 million 5.125 July 2018<br />
RWE Finance B.V. €1,000 million €990 million 6.625 January 2019<br />
RWE Finance B.V. £570 million €645 million 6.5 April 2021<br />
RWE Finance B.V. €1,000 million €996 million 6.5 August 2021<br />
RWE Finance B.V. £500 million €557 million 5.5 July 2022<br />
RWE Finance B.V. £488 million €546 million 5.625 December 2023<br />
RWE Finance B.V. £760 million €858 million 6.25 June 2030<br />
RWE AG €600 million €594 million 5.75 February 2033<br />
RWE Finance B.V. £1,000 million €1,108 million 6.125 July 2039<br />
Other (incl. other notes payable) Various €219 million Various Various<br />
Bonds payable (incl. other notes payable)<br />
€16,544 million<br />
1 Interest payment dates: May 15/Nov 15.
<strong>2009</strong> in brief To <strong>our</strong> investors Review of operations Our responsibility<br />
Responsibility statement Consolidated financial statements Further information<br />
Notes 185<br />
During the reporting period, commercial paper was occasionally<br />
issued on the European capital market. Up to €2.1 billion<br />
was raised within the framework of this programme (previous<br />
year: €0.8 billion). The interest rates on the instruments ranged<br />
between 0.8 and 3.1 % (previous year: 3.1 and 4.9 %).<br />
Other financial liabilities primarily consist of finance lease<br />
l iabilities. Lease agreements principally relate to capital goods<br />
in the electricity business.<br />
Liabilities arising from finance lease agreements have the<br />
following maturities:<br />
Liabilities from finance<br />
lease agreements<br />
€ million<br />
Nominal<br />
value<br />
Maturities of minimum lease payments<br />
Dec 31, <strong>2009</strong> Dec 31, 2008<br />
Discount Present value Nominal<br />
value<br />
Discount<br />
Present value<br />
Due within 1 year 9 9 8 8<br />
Due within 1 to 5 years 30 1 29 29 1 28<br />
Due after 5 years 43 2 41 46 3 43<br />
82 3 79 83 4 79<br />
Above and beyond this, other financial liabilities include<br />
collateral for trading activities.<br />
€199 million (previous year: €82 million) of the financial liabilities<br />
are secured by mortgages, and €19 million (previous<br />
year: €69 million) by similar rights.<br />
(27) Trade accounts payable<br />
Accounts payable to associates amounted to €55 million<br />
(previous year: €108 million).<br />
Exploration activities resulted in liabilities of €84 million<br />
(previous year: €116 million).<br />
Changes in the scope of consolidation resulted in a €1,548 million<br />
increase in trade accounts payable.<br />
(28) Other liabilities<br />
Other liabilities<br />
Dec 31, <strong>2009</strong> Dec 31, 2008<br />
€ million<br />
Non-current Current Non-current Current<br />
Tax liabilities 988 697<br />
Social security liabilities 55 56 33 56<br />
Restructuring liabilities 129 61 169 82<br />
Derivatives 1,360 9,852 663 13,114<br />
Deferred income 1,911 268 2,012 308<br />
Miscellaneous other liabilities 517 3,992 107 3,369<br />
3,972 15,217 2,984 17,626<br />
The principal component of social security liabilities are the<br />
amounts payable to social security institutions.<br />
Changes in the scope of consolidation increased other liabilities<br />
by €3,876 million.
186 Notes RWE Annual Report <strong>2009</strong><br />
Deferred income<br />
Dec 31, <strong>2009</strong> Dec 31, 2008<br />
€ million<br />
Non-current Current Non-current Current<br />
Advances and contributions in aid of construction and building connection 1,709 168 1,811 166<br />
Government grants for non-current assets<br />
Taxable 12 1 13 1<br />
Non-taxable 1 1<br />
Other 189 99 187 141<br />
1,911 268 2,012 308<br />
Miscellaneous other liabilities included €1,562 million<br />
(previous year: €1,294 million) in current redemption liabilities<br />
from put options on minority interests, which were recognised<br />
in accordance with IAS 32.<br />
Other information<br />
(29) Earnings per share<br />
Basic and diluted earnings per share are calculated by dividing<br />
the net income attributable to the shares by the average<br />
number of shares outstanding; own shares are not taken into<br />
account in this calculation. The earnings per share are the same<br />
for both common and preferred shares.<br />
Earnings per share <strong>2009</strong> 2008<br />
Net income € million 3,571 2,558<br />
Number of<br />
shares outstanding<br />
(weighted average) thousands 533,132 538,364<br />
Basic and diluted<br />
earnings per common<br />
and preferred share € 6.70 4.75<br />
Dividend per share € 3.50 1 4.50<br />
1 Proposal for fiscal <strong>2009</strong>.<br />
(30) Reporting on financial instruments<br />
Financial instruments are divided into non-derivative and derivative.<br />
Non-derivative financial assets essentially include other noncurrent<br />
financial assets, accounts receivable, marketable securities<br />
and cash and cash equivalents. Financial instruments in the<br />
category “Available for sale” are recognised at fair value, and<br />
other non-derivative financial assets at amortised cost. On the<br />
liabilities side, non-derivative financial instruments principally<br />
include liabilities recorded at amortised cost. The balance of<br />
non-derivative financial instruments is disclosed in the balance<br />
sheet. The maximum default risk corresponds to the carrying<br />
amount of the financial assets. If default risks associated with<br />
financial assets are identified, they are recognised through impairment.<br />
Fair values are derived from the relevant stock market quotations<br />
or are measured using generally accepted valuation methods.<br />
Derivatives: Prices on active markets (e.g. exchange prices) are<br />
drawn upon for the measurement of commodity derivatives. If<br />
no prices are available, for example because the market is not<br />
sufficiently liquid, the fair values are determined on the basis<br />
of generally accepted valuation methods. In doing so, prices<br />
on active markets are drawn upon as input parameters as much<br />
as possible. If such are not available, company-specific planning<br />
estimates are used in the measurement process. These estimates<br />
contain all of the market factors which other market<br />
participants would take into account in the c<strong>our</strong>se of price determination.<br />
<strong>For</strong>wards, futures, options and swaps involving commodities<br />
are generally recognised at their fair values as of the balancesheet<br />
date, insofar as they fall under the scope of IAS 39.<br />
Exchange-traded products are measured using the published<br />
closing prices of the relevant exchange. Non-exchange traded<br />
products are measured using the broker quotations available<br />
to market participants or, if such quotations are not available,<br />
using generally accepted valuation methods. The fair value of<br />
certain long-term procurement or sales contracts is determined<br />
using recognised valuation models, on the basis of internal<br />
data if no market data are available.
<strong>2009</strong> in brief To <strong>our</strong> investors Review of operations Our responsibility<br />
Responsibility statement Consolidated financial statements Further information<br />
Notes 187<br />
<strong>For</strong>ward share purchases and sales are measured on the basis<br />
of the spot prices of the underlying shares; in order to do so,<br />
the spot prices are adjusted for the relevant time component.<br />
Future payment flows from financial instruments used to hedge<br />
interest risks are discounted using the current market interest<br />
rates corresponding to the remaining maturity, in order to determine<br />
their fair value as of the balance-sheet date.<br />
Other financial assets and securities: The fair value of financial<br />
instruments traded on active markets is the published exchange<br />
price. The fair value of non-traded debt and equity instruments<br />
is determined on the basis of discounting the expected<br />
payment flows. Current market interest rates<br />
corresponding to the remaining maturity are used for discounting.<br />
The following overview presents the main parameters for the<br />
measurement of financial instruments recognised at fair value.<br />
In accordance with IFRS 7, the individual levels are defined as<br />
follows:<br />
Level 1: Measurement using (unadjusted) prices of identical financial<br />
instruments quoted on active markets;<br />
Level 2: Measurement on the basis of input parameters which<br />
are not the quoted prices from Level 1, but which can be observed<br />
directly or indirectly;<br />
Level 3: Measurement on the basis of models using input parameters<br />
which cannot be observed on the market.<br />
Fair value hierarchy Total Level 1 Level 2 Level 3<br />
€ million<br />
Other financial assets 709 42 145 522<br />
Derivatives (assets) 12,202 11,744 458<br />
Securities 3,290 1,102 2,188<br />
Derivatives (liabilities) 11,212 10,941 271<br />
Redemption liabilities on<br />
put options 1,562 1,562<br />
The development of the fair values of Level 3 financial<br />
instruments is presented in the following table:<br />
Development of Level 3<br />
financial instruments<br />
Balance at<br />
Jan 1, <strong>2009</strong><br />
Changes in the<br />
scope of<br />
Changes<br />
Balance at<br />
Dec 31, <strong>2009</strong><br />
consolidation,<br />
Recognised in Not recognised With a<br />
currency<br />
profit or loss in profit or<br />
cash<br />
adjustments,<br />
loss (OCI) effect<br />
€ million<br />
and other<br />
Other financial assets 345 -1 178 522<br />
Derivatives (assets) 363 456 -177 -35 -149 458<br />
Derivatives (liabilities) 67 278 -18 -9 -47 271<br />
Redemption liabilities on put options 1,294 268 1,562<br />
Level 3 financial instruments<br />
recognised in profit or loss<br />
€ million<br />
Total<br />
Of which:<br />
attributable to<br />
financial instruments<br />
held at the<br />
balance-sheet date<br />
Revenue -115 -115<br />
Cost of materials -80 -80<br />
Income from investments -1<br />
-196 -195
188 Notes RWE Annual Report <strong>2009</strong><br />
Impairments on financial assets which fall under the scope<br />
of IFRS 7 and are reported under the following balance-sheet<br />
items developed as follows:<br />
Impairments on receivables<br />
<strong>2009</strong><br />
€ million<br />
Other non-current<br />
financial assets<br />
Financial<br />
receivables<br />
Trade accounts<br />
receivable<br />
Other receivables<br />
and other assets<br />
Total<br />
Balance at Jan 1, <strong>2009</strong> 257 178 510 2 947<br />
Impairments in the<br />
reporting period 19 27 143 2 191<br />
Transfers -149 157 -8<br />
Currency translation adjustments 19 19<br />
Disposals 4 18 133 155<br />
Balance at Dec 31, <strong>2009</strong> 123 344 531 4 1,002<br />
Impairments on receivables<br />
2008<br />
€ million<br />
Other non-current<br />
financial assets<br />
Financial<br />
receivables<br />
Trade accounts<br />
receivable<br />
Other receivables<br />
and other assets<br />
Total<br />
Balance at Jan 1, 2008 114 265 448 3 830<br />
Impairments in the<br />
reporting period 159 33 230 422<br />
Transfers -9 -9<br />
Currency translation adjustments -1 -69 -70<br />
Disposals 6 120 99 1 226<br />
Balance at Dec 31, 2008 257 178 510 2 947
<strong>2009</strong> in brief To <strong>our</strong> investors Review of operations Our responsibility<br />
Responsibility statement Consolidated financial statements Further information<br />
Notes 189<br />
As of the cut-off date, there were unimpaired, past due<br />
receivables falling under the scope of IFRS 7 in the following<br />
amounts:<br />
Receivables, past due and not<br />
Gross Receivables,<br />
Receivables not impaired, past due by:<br />
impaired<br />
amount as past due,<br />
up to 31 to 60 61 to 90 91 to 120 over 120<br />
of Dec 31, impaired<br />
30 days days days days days<br />
€ million<br />
<strong>2009</strong><br />
Financial receivables 4,883 48 11 5<br />
Trade accounts receivable 10,060 921 724 77 49 40 154<br />
Other receivables and other assets 13,215 5 1 1 1<br />
28,158 974 736 78 49 40 160<br />
Receivables, past due and not<br />
Gross Receivables,<br />
Receivables not impaired, past due by:<br />
impaired<br />
amount as past due,<br />
up to 31 to 60 61 to 90 91 to 120 over 120<br />
of Dec 31, impaired<br />
30 days days days days days<br />
€ million<br />
2008<br />
Financial receivables 5,911 41<br />
Trade accounts receivable 10,925 696 847 86 48 42 229<br />
Other receivables and other assets 14,775 4 1 1<br />
31,611 741 848 86 48 42 230<br />
Financial assets and liabilities can be broken down into<br />
categories with the following carrying amounts:<br />
Carrying amounts by category<br />
€ million<br />
Dec 31,<br />
<strong>2009</strong><br />
Dec 31,<br />
2008<br />
Financial assets recognised at fair value through profit or loss 9,502 12,889<br />
of which: held for trading (9,502) (12,889)<br />
Financial assets available for sale 3,998 8,416<br />
Loans and receivables 18,150 17,687<br />
Financial liabilities recognised at fair value through profit or loss 8,574 12,148<br />
of which: held for trading (8,574) (12,148)<br />
Financial liabilities carried at (amortised) cost 29,380 24,056
190 Notes RWE Annual Report <strong>2009</strong><br />
The carrying amounts of financial assets and liabilities within<br />
the scope of IFRS 7 basically correspond to their fair values.<br />
The only deviation is for bonds, commercial paper and other<br />
financial liabilities, where the carrying amount of €20,146<br />
Net gain/loss on financial instruments as per IFRS 7<br />
€ million<br />
million (previous year: €11,503 million) deviates from the fair<br />
value of €21,605 million (previous year: €11,923 million).<br />
The following net results from financial instruments as per<br />
IFRS 7 were recognised in the income statement:<br />
<strong>2009</strong> 2008<br />
Financial assets and liabilities recognised at fair value through profit or loss -17 1,188<br />
of which: held for trading (-17) (1,188)<br />
Financial assets available for sale 169 91<br />
Loans and receivables 423 -575<br />
Financial liabilities carried at (amortised) cost -1,327 -837<br />
The net result as per IFRS 7 essentially includes interest, dividends<br />
and results from the measurement of financial instruments<br />
at fair value.<br />
In fiscal <strong>2009</strong>, €193 million in changes in the value of financial<br />
assets available for sale were recognised in accumulated other<br />
comprehensive income without an effect on income (previous<br />
year: -€447 million). Above and beyond this, €190 million in<br />
changes in the value of financial instruments available for sale<br />
which had originally been recognised without an effect on income<br />
were realised as an expense (previous year: €217 million).<br />
Detailed information on the risks of the RWE Group and on the<br />
objectives and procedures of the risk management is presented<br />
in the chapter “Development of risks and opportunities” in the<br />
review of operations.<br />
Hedge accounting pursuant to IAS 39 is applied primarily for<br />
hedges of currency risks from net investments in foreign entities<br />
with foreign functional currencies, for hedges of foreigncurrency<br />
items and interest rate risks from non-current liabilities,<br />
as well as for hedging price risks from sales and purchase<br />
transactions.<br />
As a utility enterprise with international operations, the RWE<br />
Group is exposed to credit, liquidity and market risks in its ordinary<br />
business activity. In particular, market risks stem from<br />
changes in commodity prices, exchange rates, interest rates<br />
and share prices.<br />
These risks are limited via systematic risk management. Among<br />
other things, risks are mitigated through hedges. RWE Group<br />
companies are also subjected to strict risk management. Binding<br />
internal directives define the range of action, responsibilities<br />
and controls.<br />
Derivative financial instruments are used to hedge currency,<br />
commodity and interest rate risks from operations as well as<br />
risks from cash investments and financing transactions. The instruments<br />
most commonly used are foreign exchange forwards<br />
and options, interest rate swaps, interest rate currency swaps,<br />
and commodity forwards, options, futures and swaps. Additionally,<br />
derivatives may be used for proprietary trading purposes<br />
within defined limits.<br />
Fair value hedges are mainly used to hedge fixed-interest loans<br />
and liabilities against market price risks. The objective of the<br />
hedge is to transform fixed-interest instruments into variablerate<br />
instruments, thereby hedging their fair value. Instruments<br />
used are interest rate swaps and interest rate currency swaps.<br />
In the case of fair value hedges, both the derivative as well as<br />
the underlying transaction regarding the hedged risk are measured<br />
at fair value with an effect on income. As of the reporting<br />
date, the fair value of instruments used as fair value hedges<br />
amounted to €74 million (previous year: €50 million).<br />
In the year under review, a loss of €27 million (previous year:<br />
€67 million) was recognised from adjustment of the carrying<br />
amounts of the underlying transactions, while a gain of<br />
€24 million (previous year: €65 million) stemming from changes<br />
in the fair value of the hedges was recognised. Both of these<br />
are reported in the financial result.<br />
Cash flow hedges are primarily used to hedge against foreign<br />
currency and price risks from future sales and purchase transactions.<br />
Hedging instruments consist of foreign exchange for-
<strong>2009</strong> in brief To <strong>our</strong> investors Review of operations Our responsibility<br />
Responsibility statement Consolidated financial statements Further information<br />
Notes 191<br />
wards and options, and commodity forwards, options, futures<br />
and swaps. The effective portions of changes in the fair value<br />
of the hedge instruments are disclosed under other comprehensive<br />
income until the underlying transaction is realised. Ineffective<br />
changes in value are recognised in profit or loss. The<br />
hedge’s contribution to income is transferred from other comprehensive<br />
income to the income statement when the underlying<br />
transaction is realised. As of the reporting date, the recognised<br />
fair value of instruments used as cash flow hedges<br />
amounted to -€269 million (previous year: -€409 million).<br />
The future sales and purchase transactions hedged by cash<br />
flow hedges are expected to be realised in the following five<br />
years and recognised in profit or loss.<br />
In the year under review, €1,214 million in changes in the fair<br />
values of instruments used for cash flow hedges (previous year:<br />
€1,794 million) were disclosed under accumulated other comprehensive<br />
income without an effect on income. These changes<br />
in value reflect the effective portion of the hedges.<br />
An expense of €15 million was recognised with an effect on income<br />
in relation to the ineffective portions of cash flow hedges<br />
(previous year: €1 million).<br />
Above and beyond this, €1,111 million in changes in the value<br />
of cash flow hedges which had originally been recognised without<br />
an effect on income were realised as income (previous year:<br />
€1,244 million) during the reporting period.<br />
Furthermore, in the period under review the cost of non-financial<br />
assets was increased by €128 million (previous year: decreased<br />
by €270 million) by changes in the value of cash flow<br />
hedges reported in other comprehensive income and not recognised<br />
in profit or loss.<br />
Hedges of net investment in a foreign entity are used to<br />
hedge the foreign currency risks of net investment in foreign<br />
entities with foreign functional currencies. We use bonds with<br />
various terms in the appropriate currencies and interest rate<br />
currency swaps as hedging instruments. Exchange rate changes<br />
on bonds used for hedging purposes and changes in the fair<br />
value of interest rate currency swaps are recognised under foreign<br />
currency translation adjustments in other comprehensive<br />
income. As of the reporting date, the negative fair value of the<br />
bonds amounted to €2,038 million (previous year: €1,900 million)<br />
and the positive fair value of the swaps amounted to<br />
€226 million (previous year: €313 million).<br />
During the year under review, an expense of €4 million (previous<br />
year: €4 million) was recognised with an effect on income<br />
in relation to the ineffective portions of hedges of net investment<br />
in foreign entities.<br />
Market risks stem from fluctuations in prices on financial markets.<br />
Changes in exchange rates, interest rates and share prices<br />
can have an influence on the Group’s results. Due to the RWE<br />
Group’s international profile, exchange rate management is a<br />
key issue. Sterling and US dollar are two important currencies<br />
for the RWE Group, as the company does business in the UK<br />
currency area and fuels are traded in these two currencies.<br />
Group companies are generally required to hedge all currency<br />
risks via RWE AG, which determines the net financial position<br />
for each currency and hedges it with external market partners if<br />
necessary.<br />
Interest rate risks stem primarily from financial debt and the<br />
Group’s interest-bearing investments. Negative changes in value<br />
caused by unexpected interest-rate movements are hedged<br />
with non-derivative and derivative financial instruments.<br />
Opportunities and risks from changes in the values of securities<br />
are controlled by a professional fund management system. The<br />
Group’s financial transactions are recorded using centralised<br />
risk management software and monitored by RWE AG. This enables<br />
the balancing of risks across the individual companies.<br />
Group risk management has established directives for commodity<br />
operations. These regulations stipulate that derivatives may<br />
be used to hedge price risks, optimise power plant schedules<br />
and increase margins. Furthermore, commodity derivatives may<br />
be traded, subject to limits. These limits are defined by independent<br />
organisational units and monitored daily.<br />
All derivative financial instruments are recognised as assets or<br />
liabilities and are measured at fair value. When interpreting<br />
their positive and negative fair values, it should be taken into<br />
account that, with the exception of proprietary trading in commodities,<br />
these financial instruments are generally matched<br />
with underlying transactions that carry offsetting risks.
192 Notes RWE Annual Report <strong>2009</strong><br />
Maturities of derivatives related to interest rates, currencies,<br />
equities, indices and commodities are based on the maturities<br />
of the underlying transactions and are thus primarily shortterm<br />
and medium-term in nature. Maturities of up to 30 years<br />
have been agreed upon to hedge foreign currency risks of foreign<br />
investments.<br />
The Value-at-Risk method is used to quantify the interest rate,<br />
foreign currency and share-price risks of financial instruments<br />
as well as commodity price risks, in line with the international<br />
banking standard. The maximum expected loss arising from<br />
changes in market prices is calculated on the basis of historical<br />
market volatility and is monitored continuously.<br />
The following Value-at-Risk information relates exclusively to<br />
recognised financial instruments, in line with the rules of<br />
IFRS 7. Off-balance-sheet plan positions which are hedged and<br />
so-called own-use contracts in commodities may not be taken<br />
into account. As a result, an incomplete picture of the risk<br />
situation of the RWE Group is presented. Aggregation of the<br />
individual Value-at-Risk items into a single Value-at-Risk indicator<br />
is not expedient, primarily due to the lack of mutual<br />
dependencies.<br />
Value at Risk for financial derivatives<br />
€ million<br />
All Value-at-Risk figures are based on a confidence interval of<br />
95 % and a holding period of one day.<br />
Value at Risk<br />
Dec 31,<br />
<strong>2009</strong><br />
Dec 31,<br />
2008<br />
<strong>For</strong>eign currency derivatives 38.0 85.7<br />
<strong>For</strong>wards 9.9 23.5<br />
Interest rate/currency derivatives 36.1 81.7<br />
Interest rate derivatives 5.8 14.9<br />
As of December 31, <strong>2009</strong>, the Value at Risk for all foreign currency<br />
items to be taken into account pursuant to IFRS 7<br />
amounted to €38.1 million (previous year: €80.4 million). In accordance<br />
with IFRS 7, underlying transactions which are the<br />
subject of a cash flow hedge were not taken into consideration<br />
in determining this position.<br />
As of December 31, <strong>2009</strong>, the interest rate Value at Risk from<br />
financial debts and related hedging transactions amounted to<br />
€164.5 million (previous year: €147.4 million). Taking into account<br />
the hedges, the Value at Risk from interest-bearing assets<br />
amounted to €9.3 million (previous year: €46.1 million).<br />
As of December 31, <strong>2009</strong>, commodity price Value at Risk pursuant<br />
to IFRS 7 in the segment Trading / gas midstream amounted<br />
to €46.5 million (previous year: €80.4 million) and €31.3 million<br />
in the segment Netherlands/Belgium.<br />
Credit risks. In <strong>our</strong> financial and trading operations, credit relationships<br />
mainly exist with banks and other trading partners<br />
with good creditworthiness. Credit risks associated with contractual<br />
partners are reviewed upon conclusion of the contract<br />
and constantly monitored. We also limit credit risk by the definition<br />
of limits for trading with contractual partners and by<br />
requiring cash collateral. Credit insurance and bank guarantees<br />
are also employed. Credit risk in trading operations is monitored<br />
on a daily basis, and on a weekly basis for financial operations.<br />
We are exposed to credit risks in <strong>our</strong> retail business, because it<br />
is possible that <strong>customers</strong> will fail to meet their financial obligations.<br />
This risk is mitigated by regular analysis of the creditworthiness<br />
of <strong>our</strong> customer portfolio based on the RWE Group’s<br />
credit risk directive. Moreover, collateral and bank guarantees<br />
are also used at times.<br />
The maximum default risk is expressed by the carrying value of<br />
the receivables stated in the balance sheet. The default risks<br />
for derivatives correspond to their positive fair values. Additional<br />
credit risks can stem from financial guarantees for external<br />
creditors, with which the RWE Group secures the liabilities<br />
of third parties in the amount of €804 million (previous year:<br />
€482 million). Defaults in the year under review and the previous<br />
year were negligible.<br />
Liquidity risks. As a rule, RWE AG centrally handles refinancing<br />
for RWE Group companies. In this regard, there is a risk that liquidity<br />
reserves will prove to be insufficient to meet financial<br />
obligations in a timely manner. In 2010, capital market debt<br />
with a nominal volume of approximately €0.6 billion and bank<br />
debt of €0.5 billion are due; additionally, short-term debt is<br />
also due.<br />
As of December 31, <strong>2009</strong>, liquidity needs are covered with cash<br />
and cash equivalents, and current marketable securities totalling<br />
€6,364 million. Above and beyond this, as of the balancesheet<br />
date, RWE AG had a fully committed, unused syndicated<br />
credit line of €4 billion at its disposal. There are also unused<br />
reserves of €13.6 billion from the €30 billion debt issuance programme.<br />
Accordingly, liquidity risk is extremely low.<br />
Share price Value at Risk was €11.7 million as of December 31,<br />
<strong>2009</strong> (previous year: €27.3 million).
<strong>2009</strong> in brief To <strong>our</strong> investors Review of operations Our responsibility<br />
Responsibility statement Consolidated financial statements Further information<br />
Notes 193<br />
Financial liabilities falling under the scope of IFRS 7 are<br />
expected to result in the following (undiscounted) payments in<br />
the coming years:<br />
Redemption and interest payments on Carrying Redemption payments<br />
Interest payments<br />
financial liabilities<br />
amount<br />
2010 2011 from 2015 2010 2011 from 2015<br />
Dec 31,<br />
to 2014<br />
to 2014<br />
€ million<br />
<strong>2009</strong><br />
Bonds payable (incl. other notes payable) 16,544 640 5,599 10,376 919 3,072 5,271<br />
Commercial paper 238 238<br />
Bank debt 925 596 177 156 12 42 21<br />
Liabilities arising from finance lease<br />
agreements 79 9 30 43<br />
Other financial liabilities 1,415 893 236 332 18 58 50<br />
Derivative financial liabilities 11,212 10,116 1,005 37 -18 -28 70<br />
Collateral for trading activities 945 945<br />
Redemption liabilities on put options 1,562 1,562<br />
Miscellaneous other financial liabilities 11,351 10,444 873 89<br />
Redemption and interest payments on Carrying Redemption payments<br />
Interest payments<br />
financial liabilities<br />
amount<br />
<strong>2009</strong> 2010 from 2014 <strong>2009</strong> 2010 from 2014<br />
Dec 31,<br />
to 2013<br />
to 2013<br />
€ million<br />
2008<br />
Bonds payable (incl. other notes payable) 10,206 175 4,051 5,968 529 2,172 2,989<br />
Commercial paper 846 846<br />
Bank debt 787 477 211 99 18 38 13<br />
Liabilities arising from finance lease<br />
agreements 79 8 29 46<br />
Other financial liabilities 1,024 645 208 230 8 21 10<br />
Derivative financial liabilities 13,777 19,599 6,311 11 13 -36 427<br />
Collateral for trading activities 541 541<br />
Redemption liabilities on put options 1,294 1,294<br />
Miscellaneous other financial liabilities 12,553 12,615 42 63<br />
Above and beyond this, as of December 31, <strong>2009</strong>, there<br />
were financial guarantees for external creditors amounting to<br />
€804 million (previous year: €482 million). In terms of their<br />
maturity, the total amounts were each allocated to the first<br />
following year.
194 Notes RWE Annual Report <strong>2009</strong><br />
(31) Contingent liabilities and financial commitments<br />
As of December 31, <strong>2009</strong>, the Group had €5,192 million in<br />
capital commitments (previous year: €4,176 million). Moreover,<br />
commitments regarding acquisitions of investments existed in<br />
the amount of €2 million (previous year: €127 million).<br />
Under its CBLs and the CBL-related guarantees, Essent is liable<br />
for any payment obligations exceeding the proceeds from the<br />
pledged financial instruments and/or other relevant arrangements—if<br />
any, including the above mentioned CBL-obligations<br />
of ENEXIS.<br />
Within the framework of the Essent acquisition, we undertook<br />
to acquire the shares in Energy Res<strong>our</strong>ces Holding B.V., Netherlands<br />
(formerly Essent Business Development B.V.) from the<br />
previous owners (put option), pending a positive decision by<br />
the c<strong>our</strong>ts.<br />
Commitments from operating leases refer largely to long-term<br />
rental arrangements for power generation and supply plants as<br />
well as rent and lease contracts for storage and administration<br />
buildings. Minimum lease payments have the following maturity<br />
structure:<br />
Operating Leasing<br />
€ million<br />
Nominal value<br />
Dec 31,<br />
<strong>2009</strong><br />
Dec 31,<br />
2008<br />
Due within 1 year 101 58<br />
Due within 1 to 5 years 256 167<br />
Due after 5 years 185 162<br />
542 387<br />
Essent group entities (and/or their predecessors) have transferred<br />
rights of use or similar rights with respect to generating<br />
assets to foreign investors and subsequently leased them back<br />
until January 2017. These transactions are referred to as crossborder<br />
leases (CBL). These CBLs are formally guaranteed by<br />
Essent. The contracts were concluded prior to Essent’s acquisition<br />
by RWE and concern generating capacities with a book<br />
value of €139 million. The CBLs on these assets provide Essent<br />
with the option (in January 2017, subject to certain conditions)<br />
to buy back the transferred rights for a fixed price in the<br />
amount of approximately US$920 million. Lease payments to<br />
the end of the term (totalling US$413 million) and amounts<br />
payable upon any exercise of a purchase option are funded by<br />
any proceeds from financial instruments pledged to the respective<br />
CBL counterparties and/or other arrangements made by<br />
Essent group entities.<br />
Furthermore, prior to its acquisition by RWE, Essent has issued<br />
guarantees which relate to payment and performance obligations<br />
from CBL-transactions of various former subsidiaries,<br />
which today are controlled by ENEXIS B.V., Netherlands (formerly<br />
Essent Netwerk B.V.,) (“ENEXIS”).<br />
In case of mandatory early terminations, the CBLs contain<br />
clauses which might result in payment obligations including<br />
indemnity and financing costs. In certain cases the CBL<br />
counterparties may also take possession of the asset. Assuming<br />
a mandatory early termination of all CBLs and claim of all<br />
financial damages attached, the estimated aggregate cost<br />
would amount to approximately US$200 million as at December<br />
31, <strong>2009</strong>. Of this US$150 million relate to generating<br />
facilities of Essent and US$50 million to energy networks of<br />
ENEXIS. This amount is calculated by the difference between<br />
the aggregate termination value of US$1,142 million under all<br />
CBLs and the value of the financial instruments and/or other<br />
relevant arrangements, plus various costs, particularly<br />
indemnities.<br />
Upon conclusion of the Essent acquisition, the CBL-related<br />
liabilities were covered by the joint implementation of another<br />
fund by RWE and the vendors.<br />
We bear legal and contractual liability from <strong>our</strong> membership in<br />
various associations which exist in connection with power plant<br />
projects, profit- and loss-pooling agreements and for the provision<br />
of liability cover for nuclear risks, amongst others.<br />
By signing a mutual benefit agreement, RWE AG and other parent<br />
companies of German nuclear power plant operators undertook<br />
to provide approximately €2,244 million in funding to liable<br />
nuclear power plant operators to ensure that they are able<br />
to meet their payment obligations in the event of nuclear damages.<br />
RWE AG has a 25.851 % contractual share in the liability,<br />
plus 5 % for damage settlement costs.<br />
RWE AG and its subsidiaries are involved in regulatory and antitrust<br />
proceedings, litigation and arbitration proceedings related<br />
to their operations. However, we do not expect any material<br />
negative repercussions from these proceedings on the RWE<br />
Group’s economic or financial position. Additionally, companies<br />
belonging to the RWE Group are directly involved in various<br />
administrative and regulatory proceedings (including<br />
approval procedures) or are directly affected by their results.
<strong>2009</strong> in brief To <strong>our</strong> investors Review of operations Our responsibility<br />
Responsibility statement Consolidated financial statements Further information<br />
Notes 195<br />
Outside shareholders initiated several legal proceedings to<br />
examine the appropriateness of the conversion ratios and the<br />
amount of cash paid in compensation in connection with company<br />
restructurings pursuant to German company law. We are<br />
convinced that the conversion ratios and cash compensation<br />
calculated on the basis of expert opinions and verified by auditors<br />
are adequate. If a different legally enforceable conclusion<br />
is reached, the affected shareholders will be compensated,<br />
even if they are not involved in the conciliation proceedings.<br />
The EU Commission conducted follow-up inquiries at several<br />
European power utilities in May and December of 2006. This<br />
also affected RWE Group companies in Germany. Afterwards,<br />
the EU Commission filed a request with companies including<br />
RWE for information on individual energy market issues, which<br />
it will process further.<br />
In early May 2007, the EU Commission initiated an abuse procedure<br />
against RWE, based on the suspicion that RWE and affiliated<br />
companies hindered access to the natural gas transmission<br />
system in Germany in order to attain a purportedly<br />
market-dominating position in the gas supply business. Following<br />
an agreement between RWE AG and the EU Commission in<br />
May 2008, in February <strong>2009</strong> RWE AG submitted a formal statement<br />
of commitment to sell its German gas transmission network<br />
to a third party independent of RWE. This commitment<br />
does not constitute admission that anti-trust regulations were<br />
violated. The EU Commission approved this statement in March<br />
<strong>2009</strong> and in turn ended the abuse proceedings against RWE.<br />
The divestment process is currently underway.<br />
The EU Commission also ended its investigations of RWE in the<br />
field of electricity in October <strong>2009</strong>.<br />
(32) Segment reporting<br />
Effective as of fiscal <strong>2009</strong>, we made changes to the Group’s<br />
structure, with the result that activities are now managed and<br />
segmented more strongly by regional markets. The segmentation<br />
of divisions and geographical regions is based on the<br />
changed system of internal reporting. Following implementation<br />
of the new Group structure, the segments break down as<br />
follows:<br />
The segment “Power generation“ essentially consists of the<br />
power generation business and lignite production in Germany.<br />
The segment “Sales and distribution networks” essentially covers<br />
sales and distribution networks in Germany.<br />
The segment “Netherlands/Belgium“ comprises the activities<br />
of the Essent Group, which was acquired during the business<br />
year, as well as the Group’s other electricity and gas business<br />
in this region.<br />
The segment “United Kingdom” consists of almost all of the<br />
electricity and gas business in this region.<br />
Eastern European power generation and the supply and the<br />
distribution activities in this region are included in the segment<br />
“Central and Eastern Europe”.<br />
Since <strong>2009</strong>, the groupwide activities in renewable energy generation<br />
which are bundled in RWE Innogy have been presented<br />
in the independent segment “Renewables”.<br />
The segment “Upstream gas & oil“ covers all of the Group’s gas<br />
and oil production activities.<br />
The segment “Trading/gas midstream” is comprised of trading<br />
in electricity, gas, coal, oil and emission allowances, as well as<br />
the commercial optimisation of non-regulated gas activities, including<br />
procurement, transport and storage contracts in Germany,<br />
the UK and the Czech Republic, and the liquefied natural<br />
gas (LNG) business. This segment is also responsible for major<br />
German industrial and commercial <strong>customers</strong>.<br />
The segment “Other/consolidation“ covers consolidation<br />
effects, the Group Centre and the activities of other Group<br />
areas which are not presented separately. Such activities<br />
consist primarily of the cross-segment services provided by<br />
RWE Service GmbH, RWE IT GmbH, and RWE Consulting GmbH.<br />
Furthermore, transmission grid activities in the electricity and<br />
gas business in Germany are also presented in this segment.<br />
Within this segment, a distinction is made between Operating<br />
companies and Other.<br />
In order to ensure comparability with the previous year despite<br />
the changes to Group structure, the figures for fiscal 2008 are<br />
also stated in line with the Group’s new structure.
196 Notes RWE Annual Report <strong>2009</strong><br />
Segment<br />
reporting<br />
Divisions <strong>2009</strong><br />
€ million<br />
Power<br />
generation<br />
Germany<br />
Sales and<br />
distribution<br />
networks<br />
Netherlands/<br />
Belgium<br />
United<br />
Kingdom<br />
Central<br />
and<br />
Eastern<br />
Europe<br />
Renewables<br />
Upstream<br />
gas & oil<br />
Other/<br />
consolidation<br />
Operating<br />
companies<br />
External<br />
revenue (incl.<br />
natural gas tax/<br />
electricity tax) 1,056 18,330 1,799 7,843 5,254 245 1,208 6,937 4,946 123 47,741<br />
Intra-group<br />
revenue 9,804 4,783 158 11 465 138 262 19,308 2,561 -37,490<br />
Total revenue 10,860 23,113 1,957 7,854 5,719 383 1,470 26,245 7,507 -37,367 47,741<br />
Operating<br />
result 3,428 1,352 180 247 1,055 56 203 985 129 -545 7,090<br />
Operating<br />
income from<br />
investments 47 343 8 -6 57 4 1 -93 9 -49 321<br />
Operating<br />
income from<br />
investments<br />
accounted for<br />
using the equity<br />
method 30 277 19 -6 55 4 -89 9 -1 298<br />
Operating<br />
depreciation and<br />
amortisation 461 570 97 198 230 70 234 1 132 82 2,075<br />
Total impairment<br />
losses 10 1 5 4 112 3 135<br />
EBITDA 3,889 1,922 277 445 1,285 126 437 986 261 -463 9,165<br />
Cash flows<br />
from operating<br />
activities 2,288 1,457 -15 387 888 27 319 580 338 -970 5,299<br />
Carrying amount<br />
of investments<br />
accounted for<br />
using the equity<br />
method 166 2,294 222 28 375 477 190 20 -36 3,736<br />
Capital expenditure<br />
on<br />
intangible assets,<br />
property, plant<br />
and equipment<br />
and investment<br />
property 1,791 1,022 156 853 368 447 855 2 336 83 5,913<br />
Other<br />
Trading/<br />
gas<br />
midstream<br />
RWE-<br />
Group<br />
Regions <strong>2009</strong><br />
EU<br />
Rest of Other RWE<br />
€ million<br />
Germany UK Other EU Europe<br />
Group<br />
External revenue 1,2 28,442 8,622 7,640 1,340 147 46,191<br />
Intangible assets, property, plant and<br />
equipment and investment property 23,103 7,911 14,124 741 250 46,129<br />
1 Excluding natural gas tax /electricity tax.<br />
2 Broken down by the region in which the service was provided.
<strong>2009</strong> in brief To <strong>our</strong> investors Review of operations Our responsibility<br />
Responsibility statement Consolidated financial statements Further information<br />
Notes 197<br />
Segment<br />
reporting<br />
Divisions 2008 1<br />
€ million<br />
Power<br />
generation<br />
Germany<br />
Sales and<br />
distribution<br />
networks<br />
Netherlands/<br />
Belgium<br />
United<br />
Kingdom<br />
Central<br />
and<br />
Eastern<br />
Europe<br />
Renewables<br />
Upstream<br />
gas & oil<br />
Other/<br />
consolidation<br />
Operating<br />
Other<br />
companies<br />
External<br />
revenue (incl.<br />
natural gas tax/<br />
electricity tax) 1,093 17,513 8,618 5,776 269 1,765 8,663 5,120 133 48,950<br />
Intra-group<br />
revenue 9,979 4,145 10 427 122 211 20,571 3,031 -38,496<br />
Total revenue 11,072 21,658 8,628 6,203 391 1,976 29,234 8,151 -38,363 48,950<br />
Operating<br />
result 3,072 1,488 534 908 55 494 486 169 -380 6,826<br />
Operating<br />
income from<br />
investments 77 374 66 4 1 -51 13 -25 459<br />
Operating<br />
income from<br />
investments<br />
accounted for<br />
using the equity<br />
method 57 301 64 6 -49 10 389<br />
Operating<br />
depreciation and<br />
amortisation 428 557 180 234 48 254 1 167 78 1,947<br />
Total impairment<br />
losses 14 5 6 1 26<br />
EBITDA 3,500 2,045 714 1,142 103 748 487 336 -302 8,773<br />
Cash flows<br />
from operating<br />
activities 3,841 783 149 1,111 10 656 1,702 353 248 8,853<br />
Carrying amount<br />
of investments<br />
accounted for<br />
using the equity<br />
method 179 1,956 372 418 316 27 3,268<br />
Capital expenditure<br />
on<br />
intangible assets,<br />
property, plant<br />
and equipment<br />
and investment<br />
property 1,420 760 610 355 290 606 279 134 4,454<br />
1 Adjusted on the basis of the new Group structure.<br />
Trading/<br />
gas<br />
midstream<br />
RWE-<br />
Group<br />
Regions 2008<br />
EU<br />
Rest of Other RWE<br />
€ million<br />
Germany UK Other EU Europe<br />
Group<br />
External revenue 1,2 29,261 9,913 7,480 568 278 47,500<br />
Intangible assets, property, plant<br />
and equipment and investment property 19,493 6,541 6,351 508 251 33,144<br />
1 Excluding natural gas tax/electricity tax.<br />
2 Broken down by the region in which the service was provided.
198 Notes RWE Annual Report <strong>2009</strong><br />
Products<br />
€ million<br />
RWE Group<br />
<strong>2009</strong> 2008<br />
External revenue 1 46,191 47,500<br />
of which: electricity (30,184) (30,396)<br />
of which: gas (11,934) (13,282)<br />
of which: crude oil (1,024) (1,164)<br />
1 Excluding natural gas tax/electricity tax.<br />
Notes on segment data. RWE intra-group revenue reflects the<br />
level of revenue between segments. Internal supply of goods<br />
and services is settled at arm’s length conditions.<br />
The definition of the operating result is derived from the value<br />
management concept. This indicator is used for control purposes<br />
within the Group (cf. pages 207 to 208). The following table<br />
presents the reconciliation of EBITDA to the operating result<br />
and to income from continuing operations before tax:<br />
Reconciliation of income items 1<br />
€ million<br />
<strong>2009</strong> 2008<br />
EBITDA 9,165 8,773<br />
– Operating depreciation and amortisation -2,075 -1,947<br />
Operating result 7,090 6,826<br />
+ Non-operating result 498 -485<br />
+ Financial result -1,990 -1,475<br />
Income from continuing operations before tax 5,598 4,866<br />
1 Prior-year figures adjusted.<br />
Income and expenses that are unusual from an economic perspective,<br />
or are the result of exceptional events, prejudice the<br />
assessment of operating activities. They are reclassified to the<br />
non-operating result. In the event that impairment losses are<br />
recognised on the goodwill of fully consolidated companies,<br />
such losses are contained in the non-operating result.<br />
More detailed information is presented on page 72 and page<br />
73 in the review of operations.<br />
RWE did not generate more than 10 % of sales revenues with<br />
any single customer in the year under review and the previous<br />
year.<br />
(33) Notes to the cash flow statement<br />
The cash flow statement classifies cash flows according to operating,<br />
investing and financing activities. Cash and cash<br />
equivalents in the cash flow statement correspond to the<br />
amount stated in the balance sheet. Cash and cash equivalents<br />
consist of cash on hand, demand deposits and fixed-interest<br />
marketable securities with a maturity of three months or less<br />
from the date of acquisition.<br />
Among other things, cash flows from operating activities include:<br />
• cash flows from interest income of €593 million (previous<br />
year: €807 million) and cash flows used for interest expenses<br />
of €1,231 million (previous year: €965 million)<br />
• €1,949 million (previous year: €1,034 million) in taxes on income<br />
paid (less income tax refunds)<br />
• income from investments, corrected for items without an effect<br />
on cash flows, in particular from accounting using the<br />
equity method, amounted to €460 million (previous year:<br />
€397 million)<br />
Flows of funds from the acquisition and sale of consolidated<br />
companies are included in cash flows from investing activities.<br />
Effects of foreign exchange rate changes are stated separately.<br />
Cash flows from financing activities include €2,401 million (previous<br />
year: €1,689 million) which was paid out to RWE shareholders<br />
and €191 million (previous year: €316 million) which<br />
was distributed to minority shareholders. New issuance of<br />
financial debt totalled €11,592 million (previous year:<br />
€6,641 million) and was contrasted by repayments of<br />
€4,347 million (previous year: €8,046 million).
<strong>2009</strong> in brief To <strong>our</strong> investors Review of operations Our responsibility<br />
Responsibility statement Consolidated financial statements Further information<br />
Notes 199<br />
Changes in the scope of consolidation increased cash and cash<br />
equivalents by a net amount of €589 million (previous year:<br />
€78 million). Additions of €703 million (previous year: €83 million)<br />
were offset against capital expenditure on financial assets,<br />
whilst disposals of €114 million (previous year: €5 million)<br />
were deducted from proceeds from divestitures.<br />
Exploration activities reduced cash flows from operating activities<br />
by €188 million (previous year: €174 million) and cash<br />
flows from investing activities by €199 million (previous year:<br />
€255 million).<br />
First-time consolidations and deconsolidations resulted in a<br />
decrease of €3,496 million in net financial debt.<br />
There are no restrictions on the disposal of cash and cash<br />
equivalents.<br />
Net debt of the RWE Group<br />
€ million<br />
Dec 31,<br />
<strong>2009</strong><br />
Dec 31,<br />
2008<br />
Cash and cash equivalents 3,074 1,249<br />
Marketable securities 3,290 7,735<br />
Non-current marketable securities 153 317<br />
Collateral for trading activities 2,022 3,562<br />
Other financial receivables 1,225 1,270<br />
Financial assets 9,764 14,133<br />
Bonds, other notes payable,<br />
bank debt, commercial paper 17,707 11,839<br />
Collateral for trading activities 945 541<br />
Other financial liabilities 1,494 1,103<br />
Financial liabilities 20,146 13,483<br />
Net financial debt from<br />
continuing operations 10,382 -650<br />
Provisions for pensions and similar<br />
obligations 3,281 2,738<br />
Surplus of plan assets over benefit<br />
obligations -79<br />
Provisions for nuclear waste management 9,491 9,465<br />
Provisions for mining damage 2,712 2,866<br />
Net debt from continuing operations 25,787 14,419<br />
Net debt from discontinued operations 4,240<br />
Net debt of the RWE Group 25,787 18,659<br />
Other financial receivables essentially consist of other loans,<br />
accrued interest, and financial receivables from non-consolidated<br />
subsidiaries and investments. Other financial debt essentially<br />
includes financial liabilities to non-consolidated subsidiaries<br />
and investments, as well as miscellaneous other financial liabilities.<br />
Net financial debt is the difference between financial assets<br />
and financial liabilities.<br />
(34) Information on concessions<br />
In the fields of electricity, gas and water supply, there are a<br />
number of easement agreements and concession contracts between<br />
RWE Group companies and governmental authorities in<br />
the areas supplied by RWE.<br />
Easement agreements are used in the electricity and gas business<br />
to regulate the use of public rights of way for laying and<br />
using lines for public energy supply. These agreements are generally<br />
limited to a term of 20 years. After expiry, there is a legal<br />
obligation to transfer ownership of the local distribution facilities<br />
to the new operator, for appropriate compensation.<br />
Water concession agreements contain provisions for the right<br />
and obligation to provide water and wastewater services, operate<br />
the associated infrastructure, such as water utility plants, as<br />
well as to implement capital expenditure. Concessions in the<br />
water business generally have terms of up to 25 years.<br />
(35) Related party disclosures<br />
Within the framework of their ordinary business activities,<br />
RWE AG and its subsidiaries have business relationships with<br />
numerous companies. These include associated companies<br />
which are classified as related parties. In particular, this category<br />
includes investments in municipal enterprises accounted<br />
for using the equity method in the segment Sales and distribution<br />
networks.<br />
Business transactions were concluded with major associates, resulting<br />
in following items in RWE’s consolidated financial statements:<br />
Key items from transactions<br />
<strong>2009</strong> 2008<br />
with associates<br />
€ million<br />
Revenue 861 714<br />
Expenses 169 139<br />
Receivables 708 684<br />
Liabilities 10 13
200 Notes RWE Annual Report <strong>2009</strong><br />
All business transactions are completed at arm’s length conditions<br />
and on principle do not differ from the conditions for<br />
supply and services provided to other enterprises. €113 million<br />
of the receivables (previous year: €114 million) and €4 million<br />
of the liabilities (previous year: €5 million) fall due within one<br />
year. In respect of the receivables there were guarantees of<br />
€0 million, as in the previous year, and other collateral amounting<br />
to €5 million (previous year: €1 million). The receivables included<br />
€595 million in interest-bearing loans to the RWE-Veolia<br />
Berlinwasser Beteiligungs GmbH (previous year: €570 million).<br />
Above and beyond this, as of December 31, <strong>2009</strong>, there was an<br />
unused €24 million line of credit for the RWE-Veolia Berlinwasser<br />
Beteiligungs GmbH (previous year: €19 million).<br />
As the CEO of RWE AG, Dr. Jürgen Großmann, is a partner in<br />
Georgsmarienhütte Holding GmbH and RGM Gebäudemanagement<br />
GmbH, the companies of the Georgsmarienhütte Group<br />
and RGM Gebäudemanagement GmbH are classified as related<br />
parties. RWE Group companies provided services and deliveries<br />
amounting to €7.7 million to these companies (previous year:<br />
€6.8 million). Conversely, the aforementioned companies provided<br />
services and deliveries amounting to €2.5 million to RWE<br />
Group companies (previous year: €1.9 million). As of December<br />
31, <strong>2009</strong>, there were receivables of €0.2 million (previous year:<br />
€0.1 million) and liabilities of €2.0 million to RWE Group companies<br />
(previous year: €0.4 million). All transactions are completed<br />
at arm’s length prices and on principle the business<br />
relations do not differ from those maintained with other enterprises.<br />
Above and beyond this, the RWE Group did not conclude or carry<br />
out any material transactions with related companies or persons.<br />
The compensation model and compensation of the Executive<br />
and Supervisory Boards is presented in the compensation report,<br />
which is included in the review of operations.<br />
In total, the compensation of the Executive Board amounted to<br />
€22,520,000 (previous year: €20,260,000), plus pension service<br />
costs of €439,000 (previous year: €436,000). The Executive<br />
Board received short-term compensation components amounting<br />
to €18,770,000 for fiscal <strong>2009</strong> (previous year: €17,510,000).<br />
In addition to this, long-term compensation components from<br />
the <strong>2009</strong> tranche of the Beat programme in the amount of<br />
€3,750,000 were allocated (€2,750,000 from the 2008 Beat<br />
tranche in the previous year).<br />
The Supervisory Board received total compensation of<br />
€3,446,000 (previous year: €4,173,000) in fiscal <strong>2009</strong>. Supervisory<br />
Board members also received €296,000 in compensation<br />
from subsidiaries for the exercise of mandates (previous year:<br />
€256,000).<br />
During the period under review, no loans or advances were<br />
granted to members of the Executive or Supervisory Boards.<br />
One employee representative on the Supervisory Board has an<br />
outstanding loan of €12,000 from the period before his membership<br />
of the Board.<br />
<strong>For</strong>mer members of the Executive Board and their surviving dependents<br />
received €18,074,000 (previous year: €26,783,000),<br />
of which €1,831,000 came from subsidiaries (previous year:<br />
€1,823,000). Of this, €7,000,000 was related to long-term<br />
incentive remuneration components (previous year:<br />
€16,501,000). As of the balance-sheet date, €124,558,000<br />
(previous year: €114,868,000) has been accrued for defined<br />
benefit obligations to former members of the Executive Board<br />
and their surviving dependents, of which €19,737,000 was set<br />
aside at subsidiaries (previous year: €18,820,000).<br />
The Economic Advisory Board was paid total compensation of<br />
€240,000 (previous year: €250,000).<br />
Declarations on the members of the Executive and Supervisory<br />
Boards in accordance with Sec. 285 No. 10 of the German Commercial<br />
Code (HGB) are presented on pages 209 to 213.<br />
(36) Auditor’s fees<br />
The following fees were recognised as expenses for the services<br />
rendered in fiscal <strong>2009</strong> and in the prior year by the auditors of<br />
the consolidated financial statements, PricewaterhouseCoopers<br />
Aktiengesellschaft Wirtschaftsprüfungsgesellschaft (PwC) and<br />
companies belonging to PwC’s international network:
<strong>2009</strong> in brief To <strong>our</strong> investors Review of operations Our responsibility<br />
Responsibility statement Consolidated financial statements Further information<br />
Notes 201<br />
Auditor’s fees 1<br />
<strong>2009</strong> 2008<br />
Total Of which:<br />
Total Of which:<br />
€ million<br />
Germany<br />
Germany<br />
Audit services 18.2 8.9 17.1 8.4<br />
Other assurance services 6.4 6.1 5.4 5.0<br />
Tax services 0.2 0.1 0.3 0.1<br />
Other services 0.4 0.4 0.4 0.4<br />
25.2 15.5 23.2 13.9<br />
1 Prior-year figures adjusted.<br />
The total expenses include fees related to discontinued operations<br />
of consolidated subsidiaries amounting to €1.2 million<br />
(previous year: €3.5 million). Fees amounting to €0.1 million<br />
were recognised for Amprion GmbH, in relation to services<br />
rendered by the auditor BDO Deutsche Warentreuhand AG for<br />
fiscal <strong>2009</strong>.<br />
The fees for audit services primarily contain the fees for the audit<br />
of the consolidated financial statements and for the audit of<br />
the financial statements of RWE AG and its subsidiaries. In line<br />
with new professional agreements, the fees for review of the interim<br />
reports, which were reported under this item in the previous<br />
year, are now shown under Other assurance services, which<br />
also include fees for review of the internal controlling system,<br />
in particular the IT systems and expenses related to statutory<br />
or c<strong>our</strong>t ordered requirements. Fees for tax services mainly include<br />
compensation for consultation in relation to the preparation<br />
of tax returns and review of resolutions of the tax authorities<br />
as well as other national and international tax-related<br />
matters.<br />
(37) Application of Sec. 264, Para. 3 and Sec. 264 b<br />
of the German Commercial Code<br />
In fiscal <strong>2009</strong>, the following German subsidiaries made use<br />
of the exemption clause included in Sec. 264, Para. 3 and<br />
Sec. 264 b of the German Commercial Code:<br />
• Amprion GmbH, Dortmund<br />
• BGE Beteiligungs-Gesellschaft für Energieunternehmen mbH,<br />
Essen<br />
• eprimo GmbH, Neu-Isenburg<br />
• GBV Dreizehnte Gesellschaft für Beteiligungsverwaltung mbH<br />
& Co. KG, Essen<br />
• GBV Fünfte Gesellschaft für Beteiligungsverwaltung mbH,<br />
Essen<br />
• GBV Siebte Gesellschaft für Beteiligungsverwaltung mbH,<br />
Essen<br />
• GBV Zwanzigste Gesellschaft für Beteiligungsverwaltung<br />
mbH, Essen<br />
• Kavernenspeicher Staßfurt GmbH, Staßfurt<br />
• OIE Aktiengesellschaft, Idar-Oberstein<br />
• Rheinische Baustoffwerke GmbH, Bergheim<br />
• rhenag Beteiligungs GmbH, Cologne<br />
• RWE Aqua GmbH, Berlin<br />
• RWE Aqua Holdings GmbH, Essen<br />
• RWE Aqua International GmbH, Essen<br />
• RWE Beteiligungsgesellschaft mbH, Essen<br />
• RWE Beteiligungsverwaltung Ausland GmbH, Essen<br />
• RWE Consulting GmbH, Essen<br />
• RWE Dea AG, Hamburg<br />
• RWE Dea North Africa/Middle East GmbH, Hamburg<br />
• RWE Dea Suez GmbH, Hamburg<br />
• RWE E zienz ffi GmbH, Dortmund<br />
• RWE Gasspeichergesellschaft mbH, Dortmund<br />
• RWE Innogy Cogen GmbH, Dortmund<br />
• RWE Innogy GmbH, Essen<br />
• RWE IT GmbH, Essen<br />
• RWE KAC Dezentrale Energien GmbH & Co. KG, Dortmund<br />
• RWE Kundenservice GmbH, Bochum<br />
• RWE Power Aktiengesellschaft, Cologne and Essen<br />
• RWE Power Erste Gesellschaft für Beteiligungsverwaltung<br />
mbH, Essen<br />
• RWE Rheinhessen Beteiligungs GmbH, Dortmund<br />
• RWE Rheinland Westfalen Netz Aktiengesellschaft, Essen<br />
• RWE Rhein-Ruhr Netzservice GmbH, Siegen<br />
• RWE Rhein-Ruhr Verteilnetz GmbH, Wesel<br />
• RWE RWN Beteiligungsgesellschaft Mitte mbH, Essen<br />
• RWE Service GmbH, Dortmund<br />
• RWE Solutions Aktiengesellschaft, Alzenau<br />
• RWE Supply & Trading GmbH, Essen<br />
• RWE Systems Development GmbH & Co. KG, Dortmund<br />
• RWE Vertrieb Aktiengesellschaft, Dortmund<br />
• RWE Westfalen-Weser-Ems Netzservice GmbH, Dortmund<br />
• RWE Westfalen-Weser-Ems Verteilnetz GmbH, Recklinghausen<br />
• Saarwasserkraftwerke GmbH, Essen<br />
• Thyssengas GmbH, Dortmund<br />
(38) Events after the balance-sheet date<br />
Information on events after the balance-sheet date is presented<br />
in the review of operations.
202 Notes RWE Annual Report <strong>2009</strong><br />
(39) Declaration according to Sec. 161 of the German<br />
Stock Corporation Act<br />
The declarations on the German Corporate Governance Code<br />
prescribed by Sec. 161 of the German Stock Corporation Act<br />
(AktG) have been submitted for RWE AG and its publicly traded<br />
German subsidiaries and have been made accessible to the<br />
shareholders on the Internet pages of RWE AG.<br />
Essen, 12 February 2010<br />
The Executive Board<br />
Großmann Birnbaum Fitting Jobs Pohlig Schmitz
<strong>2009</strong> in brief To <strong>our</strong> investors Review of operations Our responsibility<br />
Responsibility statement Consolidated financial statements Further information<br />
Auditor’s Report 203<br />
4.7 AUDITOR’S REPORT<br />
We have audited the consolidated financial statements prepared<br />
by the RWE Aktiengesellschaft, Essen, comprising the income<br />
statement and statement of recognised income and expenses,<br />
balance sheet, cash flow statement, statement of<br />
changes in equity and the notes to the consolidated financial<br />
statements, together with the group management report,<br />
which is combined with the management report of the RWE Aktiengesellschaft,<br />
Essen, for the business year from January 1 to<br />
December 31, <strong>2009</strong>. The preparation of the consolidated financial<br />
statements and the combined management report in accordance<br />
with the IFRSs, as adopted by the EU, and the additional<br />
requirements of German commercial law pursuant to<br />
§ (Article) 315a Abs. (paragraph) 1 HGB (“Handelsgesetzbuch”:<br />
German Commercial Code) are the responsibility of the parent<br />
Company’s Executive Board. Our responsibility is to express an<br />
opinion on the consolidated financial statements and the combined<br />
management report based on <strong>our</strong> audit.<br />
We conducted <strong>our</strong> audit of the consolidated financial statements<br />
in accordance with § 317 HGB and German generally accepted<br />
standards for the audit of financial statements promulgated<br />
by the Institut der Wirtschaftsprüfer (Institute of Public<br />
Auditors in Germany) (IDW) and additionally observed the International<br />
Standards on Auditing (ISA). Those standards require<br />
that we plan and perform the audit such that misstatements<br />
materially affecting the presentation of the net assets,<br />
financial position and results of operations in the consolidated<br />
financial statements in accordance with the applicable financial<br />
reporting framework and in the combined management report<br />
are detected with reasonable assurance. Knowledge of the<br />
business activities and the economic and legal environment of<br />
the Group and expectations as to possible misstatements are<br />
taken into account in the determination of audit procedures.<br />
The effectiveness of the accounting-related internal control system<br />
and the evidence supporting the disclosures in the consolidated<br />
financial statements and the combined management<br />
report are examined primarily on a test basis within the framework<br />
of the audit. The audit includes assessing the annual financial<br />
statements of those entities included in consolidation,<br />
the determination of the entities to be included in consolidation,<br />
the accounting and consolidation principles used and significant<br />
estimates made by the Company’s Executive Board, as<br />
well as evaluating the overall presentation of the consolidated<br />
financial statements and the combined management report.<br />
We believe that <strong>our</strong> audit provides a reasonable basis for <strong>our</strong><br />
opinion.<br />
Our audit has not led to any reservations.<br />
In <strong>our</strong> opinion based on the findings of <strong>our</strong> audit the consolidated<br />
financial statements comply with the IFRSs as adopted<br />
by the EU, and the additional requirements of German commercial<br />
law pursuant to § 315 a Abs. 1 HGB and give a true and fair<br />
view of the net assets, financial position and results of operations<br />
of the Group in accordance with these provisions. The<br />
combined management report is consistent with the consolidated<br />
financial statements and as a whole provides a suitable<br />
view of the Group’s position and suitably presents the opportunities<br />
and risks of future development.<br />
Essen, 15 February 2010<br />
PricewaterhouseCoopers<br />
Aktiengesellschaft<br />
Wirtschaftsprüfungsgesellschaft<br />
Manfred Wiegand<br />
Markus Dittmann<br />
Wirtschaftsprüfer<br />
Wirtschaftsprüfer<br />
(German Public Auditor)<br />
(German Public Auditor)
204 Material investments<br />
RWE Annual Report <strong>2009</strong><br />
MATERIAL INVESTMENTS<br />
As of December 31, <strong>2009</strong><br />
I. Affiliates Investment in acc.<br />
with Sec. 16 of the<br />
German Stock<br />
Corporation Act<br />
%<br />
Equity<br />
of the last<br />
fiscal year<br />
€‘000<br />
Net income/<br />
loss of the<br />
last<br />
fiscal year<br />
€‘000<br />
Revenue<br />
<strong>2009</strong><br />
€ million<br />
Employees 2<br />
<strong>2009</strong><br />
average<br />
RWE Aktiengesellschaft, Essen 9,453,274 2,438,413 – 661<br />
Power generation, Germany<br />
RWE Power Aktiengesellschaft, Cologne and Essen 100 2,037,209 – 1 10,300 13,524<br />
Kernkraftwerke Lippe-Ems GmbH, Lingen (Ems) 99 165,545 – 1 243 321<br />
Kernkraftwerk Gundremmingen GmbH, Gundremmingen 75 84,184 8,343 294 719<br />
Rheinbraun Brennstoff GmbH, Cologne 100 63,294 – 1 587 171<br />
Sales and distribution networks, Germany<br />
Emscher Lippe Energie GmbH, Gelsenkirchen 79 76,386 26,727 508 634<br />
Energis GmbH, Saarbrücken 64 136,760 22,729 403 300<br />
envia Mitteldeutsche Energie AG, Chemnitz 59 1,085,502 296,018 3,039 2,068<br />
envia Netzservice GmbH, Kabelsketal 100 4,045 – 1 374 12<br />
envia Verteilnetz GmbH, Halle (Saale) 100 24 – 1 1,835 5<br />
eprimo GmbH, Neu-Isenburg 100 4,600 – 1 342 74<br />
EWV Energie- und Wasser-Versorgung GmbH, Stolberg 54 39,539 13,586 341 372<br />
Koblenzer Elektrizitätswerk und Verkehrs-Aktiengesellschaft, Koblenz 58 73,236 10,035 446 508<br />
Lechwerke AG, Augsburg 90 237,402 63,794 1,220 1,191<br />
LEW Verteilnetz GmbH, Augsburg 100 25 – 1 643 4<br />
MITGAS Mitteldeutsche Gasversorgung GmbH, Halle (Saale) 75 132,592 38,805 713 319<br />
rhenag Rheinische Energie Aktiengesellschaft, Cologne 67 142,577 28,402 270 327<br />
RWE Beteiligungsgesellschaft mbH, Essen 100 7,820,490 – 1 – –<br />
RWE Effizienz GmbH, Dortmund 100 25 – 1 – 19<br />
RWE Gasspeichergesellschaft mbH, Dortmund 100 115,426 – 1 103 19<br />
RWE Kundenservice GmbH, Bochum 100 25 – 1 263 14<br />
RWE Rheinland Westfalen Netz Aktiengesellschaft, Essen 100 497,854 – 1 1,656 5,006<br />
RWE Rhein-Ruhr Netzservice GmbH, Siegen 100 25 – 1 767 28<br />
RWE Rhein-Ruhr Verteilnetz GmbH, Wesel 100 25 – 1 2,258 7<br />
RWE Vertrieb Aktiengesellschaft, Dortmund 100 11,002 – 1 13,237 1,020<br />
RWE Westfalen-Weser-Ems Netzservice GmbH, Dortmund 100 25 – 1 978 18<br />
RWE Westfalen-Weser-Ems Verteilnetz GmbH, Recklinghausen 100 25 – 1 1,853 3<br />
RWW Rheinisch-Westfälische Wasserwerksgesellschaft mbH,<br />
Mülheim an der Ruhr 80 75,463 10,306 102 406<br />
Stadtwerke Düren GmbH, Düren 75 23,345 2,614 152 211<br />
Süwag Energie AG, Frankfurt am Main 78 296,109 80,800 1,698 1,401<br />
Süwag Netz GmbH, Frankfurt am Main 100 25 – 1 526 26<br />
VSE Aktiengesellschaft, Saarbrücken 69 133,335 14,341 460 319<br />
Netherlands/Belgium<br />
RWE Benelux Holding B.V., Hoofddorp/Netherlands 100 3,709,689 -112,679 – –<br />
Essent Energie Productie B.V., ’s-Hertogenbosch/Netherlands 100 1,400,806 -8,873 – 509<br />
Essent Energie Verkoop Nederland B.V., ’s-Hertogenbosch/Netherlands 100 108,797 7,373 259 142<br />
Essent Energy Trading B.V., Eindhoven/Netherlands 100 1,817,424 168,169 2,282 62<br />
Essent Retail Energie B.V., ’s-Hertogenbosch/Netherlands 100 309,570 3,883 563 828<br />
1 Profit- and loss-pooling agreement.<br />
2 Converted to full-time positions.
<strong>2009</strong> in brief To <strong>our</strong> investors Review of operations Our responsibility<br />
Responsibility statement Consolidated financial statements Further information<br />
Material investments 205<br />
I. Affiliates Investment in acc.<br />
with Sec. 16 of<br />
the German Stock<br />
Corporation Act<br />
%<br />
Netherlands/Belgium<br />
Equity<br />
of the last<br />
fiscal year<br />
€’000<br />
Net income/<br />
loss of the<br />
last<br />
fiscal year<br />
€’000<br />
Revenue<br />
<strong>2009</strong><br />
€ million<br />
Employees 1<br />
<strong>2009</strong><br />
average<br />
Essent Trading International SA, Geneva/Switzerland 100 -83,469 30,770 1,224 334<br />
RWE Energy Nederland N.V., Hoofddorp/Netherlands 100 43,071 34,483 1,968 384<br />
United Kingdom<br />
RWE Npower Holdings plc, Swindon/UK 2 100 565,208 -178,007 8,214 12,733<br />
Central and Eastern Europe<br />
Budapesti Elektromos Müvek Nyrt. (ELMÜ), Budapest/Hungary 55 980,067 31,014 911 341<br />
ELMÜ Hálózati Elosztó Kft., Budapest/Hungary 100 996,987 28,978 349 217<br />
ÉMÁSZ Hálózati Kft., Budapest/Hungary 100 319,990 6,273 142 132<br />
Észak-magyarországi Áramszolgáltató Nyrt. (ÉMÁSZ), Miskolc/Hungary 54 334,971 3,057 327 120<br />
Jihomoravská plynárenská, a.s., Brno/Czech Republic 50 280,567 60,837 708 715<br />
JMP Net, s.r.o., Brno/Czech Republic 100 399,326 38,736 119 44<br />
Mátrai Erömü Zártkörüen Müködö Részvénytársaság (MÁTRA),<br />
Visonta/Hungary 51 281,318 76,468 340 2,437<br />
RWE Energie, a.s., Ústí nad Labem/Czech Republic 100 313,888 67,591 814 42<br />
RWE Gas International B.V., Hoofddorp/Netherlands 100 4,389,762 429,771 – –<br />
RWE GasNet, s.r.o., Ústí nad Labem/Czech Republic 100 517,674 82,220 159 154<br />
RWE Gas Storage, s.r.o., Prague/Czech Republic 100 582,859 68,503 138 212<br />
RWE Polska S.A., Warsaw/Poland 100 499,731 35,008 687 592<br />
RWE Stoen Operator Sp z o.o., Warsaw/Poland 100 655,243 13,907 197 612<br />
RWE Transgas, a.s., Prague/Czech Republic 100 3,652,076 599,730 2,154 263<br />
RWE Transgas Net, s.r.o., Prague/Czech Republic 100 1,983,309 175,370 372 502<br />
Severomoravská plynárenská, a.s., Ostrava/Czech Republic 68 206,211 51,231 469 21<br />
SMP Net, s.r.o., Ostrava/Czech Republic 100 270,207 74,736 95 15<br />
VCP Net, s.r.o., Hradec Králové/Czech Republic 100 201,487 75,673 52 13<br />
Východočceská plynárenská, a.s., Hradec Králové/Czech Republic 67 132,988 28,010 303 50<br />
Renewables<br />
RWE Innogy GmbH, Essen 100 183,850 – 3 111 181<br />
Agrupació Energías Renovables, S.A.U., Barcelona/Spain<br />
AERSA Group 2 with 9 subsidiaries in Spain 100 174,103 11,382 63 29<br />
RWE Npower Renewables Ltd., Swindon/UK 100 462,381 -6,188 19 268<br />
RWE Innogy Cogen GmbH, Dortmund 100 53,982 – 3 75 154<br />
Upstream gas & oil<br />
RWE Dea AG, Hamburg 100 1,323,905 – 3 891 931<br />
RWE Dea Norge AS, Oslo/Norway 100 115,512 -13,444 259 58<br />
RWE Dea Suez GmbH, Hamburg 100 87,226 – 3 135 128<br />
Trading/gas midstream<br />
RWE Supply & Trading GmbH, Essen 100 370,408 – 3 25,465 928<br />
Other subsidiaries<br />
Amprion GmbH, Dortmund 100 613,025 – 3 5,742 535<br />
RWE Finance B.V., Hoofddorp/Netherlands 100 9,749 2,442 – –<br />
RWE Service GmbH, Dortmund 100 247,901 – 3 2,234 1,426<br />
Thyssengas GmbH, Dortmund 100 123,029 – 3 215 127<br />
1 Converted to full-time positions.<br />
2 Figures from the company’s financial statements.<br />
3 Profit- and loss-pooling agreement.
206 Material investments<br />
RWE Annual Report <strong>2009</strong><br />
II. Companies accounted for using the equity method<br />
Power generation, Germany<br />
Investment<br />
in acc. with<br />
Sec. 16 of the<br />
German Stock<br />
Corporation Act<br />
%<br />
Equity<br />
of the last<br />
fiscal year<br />
€’000<br />
Net income/<br />
loss of the last<br />
fiscal year<br />
Grosskraftwerk Mannheim Aktiengesellschaft, Mannheim 40 114,141 6,647<br />
Sales and distribution networks, Germany<br />
AVU Aktiengesellschaft für Versorgungs-Unternehmen, Gevelsberg 50 100,865 13,680<br />
Dortmunder Energie- und Wasserversorgung GmbH (DEW 21), Dortmund 47 150,437 23,846<br />
Enovos International S.A., Luxemb<strong>our</strong>g/Luxemb<strong>our</strong>g 20 469,083 140,541<br />
EVH GmbH, Halle (Saale) 30 76,736 8,705<br />
Kärntner Energieholding Beteiligungs GmbH, Klagenfurt/Austria 1 49 390,224 73,034<br />
KEW Kommunale Energie- und Wasserversorgung AG, Neunkirchen 29 70,468 7,830<br />
Niederrheinische Versorgung und Verkehr Aktiengesellschaft, Mönchengladbach 1 50 435,816 23,184<br />
Pfalzwerke Aktiengesellschaft, Ludwigshafen 27 193,537 18,069<br />
Regionalgas Euskirchen GmbH & Co. KG, Euskirchen 43 48,501 6,408<br />
RheinEnergie AG, Cologne 20 564,045 189,719<br />
RWE-Veolia Berlinwasser Beteiligungs GmbH, Berlin 50 293,392 65,513<br />
Stadtwerke Duisburg Aktiengesellschaft, Duisburg 20 153,223 34,640<br />
Stadtwerke Essen Aktiengesellschaft, Essen 29 117,257 24,886<br />
Stadtwerke Remscheid GmbH, Remscheid 25 111,736 6,620<br />
Stadtwerke Velbert GmbH, Velbert 50 76,046 11,547<br />
Südwestfalen Energie und Wasser AG, Hagen 19 267,011 407<br />
Zagrebačke Otpadne Vode d.o.o., Zagreb/Croatia 49 113,247 10,629<br />
Central and Eastern Europe<br />
Fövárosi Gázmüvek Zrt., Budapest/Hungary 50 153,954 21,373<br />
TIGÁZ Tiszántúli Gázszolgáltató Zrt., Hajdúszoboszló/Hungary 44 536,966 -40,570<br />
Východoslovenská energetika, a.s., Košice/Slovakia 49 704,922 80,229<br />
Renewables<br />
Fri-El S.p.A., Bolzano/Italy 1 50 18,842 755<br />
Greater Gabbard Offshore Winds Limited, Reading/UK 50 -47 16<br />
Zephyr Investments Ltd., Swindon/UK 1 33 -8,412 -665<br />
Trading/gas midstream<br />
Excelerate Energy LP, The Woodlands/Texas/USA 1 50 310,220 -183,626<br />
1 Figures from the company’s financial statements.<br />
€’000<br />
III. Other Investments<br />
Sales and distribution networks, Germany<br />
Investment<br />
in acc. with<br />
Sec. 16 of the<br />
German Stock<br />
Corporation Act<br />
%<br />
Equity<br />
of the last<br />
fiscal year<br />
€’000<br />
Net income/<br />
loss of the last<br />
fiscal year<br />
Stadtwerke Chemnitz Aktiengesellschaft, Chemnitz 19 255,387 11,244<br />
€’000
<strong>2009</strong> in brief To <strong>our</strong> investors Review of operations Our responsibility<br />
Responsibility statement Consolidated financial statements Further information<br />
The RWE Group’s value management 207<br />
THE RWE GROUP’S VALUE MANAGEMENT<br />
Return-oriented control of the company. Increasing shareholder<br />
value lies at the heart of <strong>our</strong> strategy. Additional<br />
value is created when the return on capital employed (ROCE)<br />
exceeds the cost of capital. ROCE reflects the pure operating<br />
return. It is calculated by dividing the operating result by<br />
capital employed.<br />
The table at the top of page 208 shows the parameters used to<br />
calculate the cost of capital. We calculate them as a weighted<br />
average cost of equity and debt.<br />
The cost of equity capital covers the capital market’s expectation<br />
of company-specific returns when investing in an RWE<br />
share over and above that of a risk-free investment. The cost<br />
of debt is linked to long-term financing conditions for the RWE<br />
Group and allows interest on debt to be classified as tax deductible<br />
(tax shield).<br />
We used new figures as a basis for determining the cost of<br />
capital in <strong>2009</strong>: We calculate the cost of debt by applying<br />
a pre-tax cost rate of 6.25 % (previous year: 5.25 %). The cost<br />
of equity is derived on the basis of an interest rate of 4.50 %<br />
(previous year: 4.75 %), which is customary for a risk-free<br />
investment, plus risk charges specific to the Group and the<br />
Group’s divisions. In the period under review, the beta factor<br />
for the RWE Group was 0.78 (previous year: 0.67).<br />
The ratio of equity to debt is 50:50. We do not derive this<br />
parameter from the amounts carried on the balance sheet, but,<br />
among other things, from the marked-to-market valuation of<br />
equity and assumptions concerning the long-term development<br />
of <strong>our</strong> net financial position and provisions. The RWE Group’s<br />
total cost of capital for <strong>2009</strong> was 9.0 % before tax (previous<br />
year: 8 .5%).<br />
When determining operating assets, depreciable non-current<br />
assets are not stated at carrying amounts. Instead, we recognise<br />
half of their historic costs. The advantage of this procedure<br />
is that the determination of ROCE is not in fluenced by<br />
the depreciation period. This reduces the fluctuation in return<br />
caused by the investment cycle. However, we fully account for<br />
the goodwill included in the purchase price of financial assets.<br />
Relative value added is the difference between ROCE and the<br />
cost of capital. Multiplying this figure by the capital employed<br />
results in the absolute value added, which we employ as a<br />
central management benchmark. The higher the value added,<br />
the more attractive a particular activity is for <strong>our</strong> portfolio. It is<br />
another important criterion for evaluating capital expenditure<br />
and for determining the performance-linked compensation of<br />
RWE Group executives.<br />
Slight adjustment in determining capital costs for 2010. In<br />
light of the recent decline in interest rates and the more volatile<br />
market environment, we are making further adjustments<br />
in calculating the cost of capital for the current fiscal year. We<br />
are reducing the cost of debt before taxes to 5.75 % and are<br />
increasing the beta factor to 0.95. This reduces the cost of<br />
debt, but increases the cost of equity. In sum, this does not<br />
result in a change in the cost of capital. It is still 9.0 %.
208 The RWE Group’s value management<br />
RWE Annual Report <strong>2009</strong><br />
RWE Group – capital costs 2008 <strong>2009</strong> 2010<br />
Risk-free interest rate % 4.75 4.5 4.25<br />
Market premium % 5.0 5.0 5.0<br />
Beta factor 0.67 0.78 0.95<br />
Cost of equity after tax % 8.1 8.4 9.0<br />
Cost of debt before tax % 5.25 6.25 5.75<br />
Tax rate for debt % 27.0 27.1 27.1<br />
Tax shield % -1.4 -1.7 -1.6<br />
Cost of debt after tax % 3.8 4.6 4.2<br />
Proportion of equity % 50 50 50<br />
Proportion of debt % 50 50 50<br />
Capital costs after tax % 6.0 6.5 6.5<br />
Tax rate for blanket conversion % 30 30 30<br />
Weighted average cost of capital (WACC) before tax % 8.5 9.0 9.0<br />
RWE Group – determining capital employed Dec 31, 08 Dec 31, 09<br />
Intangible assets/property, plant and equipment 1 € million 46,819 56,150<br />
+ Investments including loans 2 € million 4,533 5,585<br />
+ Inventories € million 2,540 3,115<br />
+ Trade accounts receivable € million 10,412 9,527<br />
+ Other accounts receivable and other assets 3 € million 16,452 16,627<br />
– Non-interest-bearing provisions 4 € million 11,218 12,214<br />
– Non-interest-bearing liabilities 5 € million 29,727 27,043<br />
– Adjustments 6 € million 887 858<br />
Capital employed € million 38,924 50,889<br />
RWE Group – determining value added <strong>2009</strong><br />
Capital employed before adjustments (averaged for the year) € million 44,907<br />
+ Adjustments 7 € million -1,310<br />
Capital employed after adjustments (averaged for the year) € million 43,597<br />
Operating result € million 7,090<br />
+ Interest income from lease receivables € million 11<br />
Operating result for calculating ROCE € million 7,101<br />
ROCE % 16,3<br />
Relative value added % 7,3<br />
Absolute value added € million 3,177<br />
1 Intangible assets; property, plant and equipment; and investment property were stated at half of their cost (see the statement on changes in assets);<br />
goodwill and the customer base were recognised at carrying amounts.<br />
2 Investments accounted for using the equity method and other financial assets (excluding non-current securities).<br />
3 Including tax refund claims; excluding the net present value of defined contribution pension benefit obligations as well as derivative financial instruments<br />
in the amount of €733 million (previous year: €1,893 million).<br />
4 Including tax provisions and other provisions; excluding non-current provisions in the amount of €446 million (previous year: €470 million).<br />
5 Including trade liabilities, income tax liabilities and other liabilities; excluding derivative financial instruments in the amount of €485 million<br />
(previous year €732 million) and purchase price liabilities of €1,562 million (previous year: €1,294 million) from put options.<br />
6 Assets capitalised in accordance with IAS 16.15 in the amount of €488 million (previous year: €458 million) are not taken into account since these<br />
assets do not employ capital. Deferred tax liabilities relating to RWE npower’s capitalised customer base are not taken into account, either.<br />
7 Corrected to account for first-time consolidation of Essent, among other things.
<strong>2009</strong> in brief To <strong>our</strong> investors Review of operations Our responsibility<br />
Responsibility statement Consolidated financial statements Further information<br />
Boards 209<br />
BOARDS<br />
As of February 12, 2010<br />
Supervisory Board<br />
Dr. Manfred Schneider<br />
Leverkusen<br />
Chairman - since May 1, <strong>2009</strong> -<br />
• Bayer AG (Chairman)<br />
• Daimler AG<br />
• Linde AG (Chairman)<br />
• TUI AG<br />
Dr. Thomas R. Fischer 2<br />
Berlin<br />
- until January 31, 2010,<br />
Chairman until April 30, <strong>2009</strong> -<br />
Business executive<br />
Frank Bsirske 1<br />
Berlin<br />
Deputy Chairman<br />
Chairman of ver.di Vereinte Dienstleistungsgewerkschaft<br />
• Deutsche Lufthansa AG<br />
• IBM Central Holding GmbH<br />
- KfW Bankengruppe<br />
Carl-Ludwig von Boehm-Bezing<br />
Bad Soden<br />
<strong>For</strong>mer member of the Board of Management<br />
of Deutsche Bank AG<br />
Heinz Büchel 1<br />
Trier<br />
Chairman of the General Works Council of<br />
RWE Rheinland Westfalen Netz AG<br />
Dieter Faust 1<br />
Eschweiler<br />
Deputy Chairman of the General Works Council of<br />
RWE Power AG<br />
• RWE Power AG<br />
Andreas Henrich 1<br />
Siegen<br />
Head of HR Management at RWE Rheinland Westfalen Netz AG<br />
• ELE Emscher Lippe Energie GmbH<br />
• RWE Rheinland Westfalen Netz AG<br />
Dr. Paul Achleitner<br />
Munich<br />
Member of the Board of Management of Allianz SE<br />
• Allianz Deutschland AG<br />
• Allianz Europe B. V. (Chairman)<br />
• Allianz Global Investors AG<br />
• Allianz Lebensversicherungs-AG<br />
• Bayer AG<br />
Werner Bischoff 1<br />
Monheim am Rhein<br />
<strong>For</strong>mer member of the Main Executive Board of IG Bergbau,<br />
Chemie, Energie<br />
• Continental AG<br />
• Evonik-Degussa GmbH<br />
• Evonik Industries AG<br />
• RWE Dea AG<br />
• RWE Power AG<br />
- BGAG Beteiligungsgesellschaft der Gewerkschaften GmbH<br />
- THS TreuHandStelle für Bergmannswohnstätten<br />
im rheinisch-westfälischen Steinkohlenbezirk GmbH<br />
(Chairman)<br />
Heinz-Eberhard Holl 2<br />
Osnabrück<br />
- until January 31, 2010 -<br />
<strong>For</strong>mer Chief Administrative Officer,<br />
Osnabrück Rural District<br />
• Georgsmarienhütte GmbH<br />
• Georgsmarienhütte Holding GmbH<br />
Frithjof Kühn<br />
Siegburg<br />
- since February 1, 2010 -<br />
Chief Administrative Officer, Rhein Sieg Rural District<br />
• RW Holding AG (Chairman)<br />
- Board of Directors of Kreissparkasse Köln<br />
Hans Peter Lafos 1<br />
Bergheim<br />
- since October 28, <strong>2009</strong> -<br />
Regional District Sector Head, Utilities and Disposal (Sector 2),<br />
ver.di Vereinte Dienstleistungsgewerkschaft, District of NRW<br />
• RWE Power AG<br />
• RWE Vertrieb AG<br />
• GEW Köln AG<br />
• Member of other mandatory supervisory boards.<br />
- Member of comparable domestic and foreign supervisory bodies of<br />
commercial enterprises.<br />
1 Employee representative.<br />
2 Information valid as of the date of retirement from the Supervisory Board.
210 Boards<br />
RWE Annual Report <strong>2009</strong><br />
Dr. Gerhard Langemeyer<br />
Dortmund<br />
<strong>For</strong>mer Mayor of the City of Dortmund<br />
• Gesellschaft für Vermögensverwaltung AG<br />
• KEB Holding AG (Chairman)<br />
• WestLB AG<br />
Dagmar Mühlenfeld<br />
Mülheim an der Ruhr<br />
Mayor of the City of Mülheim an der Ruhr<br />
• Mülheimer Wohnungsbau e.G. (Chairman)<br />
- Beteiligungsholding Mülheim an der Ruhr GmbH<br />
- Flughafen Essen/Mülheim GmbH (Chairman)<br />
- medl GmbH (Chairman)<br />
- Mülheim & Business GmbH (Chairman)<br />
- Ruhrbania Projektentwicklungsgesellschaft mbH (Chairman)<br />
Dr. Wolfgang Reiniger<br />
Essen<br />
Lawyer<br />
Günter Reppien 1<br />
Lingen<br />
Chairman of the General Works Council of RWE Power AG<br />
• RWE Power AG<br />
- Stadtwerke Lingen GmbH<br />
Karl-Heinz Römer 1,2<br />
Mülheim an der Ruhr<br />
- until September 30, <strong>2009</strong> -<br />
District General Manager of<br />
ver.di Vereinte Dienstleistungsgewerkschaft<br />
Dr.-Ing. Ekkehard D. Schulz<br />
Krefeld<br />
Chairman of the Executive Board of ThyssenKrupp AG<br />
• AXA Konzern AG<br />
• Bayer AG<br />
• MAN SE<br />
• ThyssenKrupp Elevator AG (Chairman)<br />
• ThyssenKrupp Steel Europe AG (Chairman)<br />
Uwe Tigges 1<br />
Bochum<br />
Chairman of the General Works Council of<br />
RWE Vertrieb AG<br />
• RWE Vertrieb AG<br />
Prof. Karel Van Miert<br />
Beersel<br />
- deceased on June 22, <strong>2009</strong> -<br />
Professor, Nyenrode University<br />
Manfred Weber 1<br />
Wietze<br />
Chairman of the General Works Council of RWE Dea AG<br />
• RWE Dea AG<br />
Dr. Dieter Zetsche<br />
Stuttgart<br />
- since July 16, <strong>2009</strong> -<br />
Chairman of the Executive Board of Daimler AG<br />
Dagmar Schmeer 1<br />
Saarbrücken<br />
Chairman of the Works Council of VSE AG<br />
• VSE AG<br />
• Member of other mandatory supervisory boards.<br />
- Member of comparable domestic and foreign supervisory bodies of<br />
commercial enterprises.<br />
1 Employee representative.<br />
2 Information valid as of the date of retirement from the Supervisory Board.
<strong>2009</strong> in brief To <strong>our</strong> investors Review of operations Our responsibility<br />
Responsibility statement Consolidated financial statements Further information<br />
Boards 211<br />
Supervisory Board Committees<br />
Executive Committee of the Supervisory Board<br />
Dr. Manfred Schneider (Chairman since May 1, <strong>2009</strong>)<br />
Dr. Thomas R. Fischer (Chairman until April 30, <strong>2009</strong>)<br />
Frank Bsirske<br />
Dr. Paul Achleitner<br />
Heinz Büchel<br />
Dieter Faust<br />
Dagmar Mühlenfeld<br />
Dagmar Schmeer<br />
Dr.-Ing. Ekkehard D. Schulz – since May 1, <strong>2009</strong> –<br />
Mediation Committee in accordance with Sec. 27,<br />
Para. 3 of the German Co-Determination Act (MitbestG)<br />
Dr. Manfred Schneider (Chairman since May 1, <strong>2009</strong>)<br />
Dr. Thomas R. Fischer (Chairman until April 30, <strong>2009</strong>)<br />
Frank Bsirske<br />
Werner Bischoff<br />
Dr.-Ing. Ekkehard D. Schulz – since May 1, <strong>2009</strong> –<br />
Personnel Affairs Committee<br />
Dr. Manfred Schneider (Chairman since May 1, <strong>2009</strong>)<br />
Dr. Thomas R. Fischer (Chairman until April 30, <strong>2009</strong>)<br />
Frank Bsirske<br />
Dr. Paul Achleitner<br />
Heinz-Eberhard Holl – until January 31, 2010 –<br />
Frithjof Kühn – since February 1, 2010 –<br />
Günter Reppien<br />
Uwe Tigges<br />
Audit Committee<br />
Carl-Ludwig von Boehm-Bezing (Chairman)<br />
Werner Bischoff<br />
Dr. Gerhard Langemeyer<br />
Günter Reppien<br />
Dr.-Ing. Ekkehard D. Schulz<br />
Uwe Tigges<br />
Nomination Committee<br />
Dr. Manfred Schneider (Chairman since May 1, <strong>2009</strong>)<br />
Dr. Thomas R. Fischer (Chairman until April 30, <strong>2009</strong>)<br />
Dr. Paul Achleitner<br />
Heinz-Eberhard Holl – until January 31, 2010 –<br />
Frithjof Kühn – since February 1, 2010 –
212 Boards<br />
RWE Annual Report <strong>2009</strong><br />
Executive Board<br />
Dr. Jürgen Großmann<br />
President and CEO of RWE AG,<br />
appointed until September 30, 2012<br />
Alwin Fitting<br />
Executive Vice-President of RWE AG,<br />
appointed until March 31, 2013<br />
Born in 1952 in Mülheim an der Ruhr; studied ferrous metallurgy<br />
and economics, doctorate in ferrous metallurgy; active<br />
within the Klöckner Group from 1980 to 1993, exiting as<br />
mem ber of the Executive Board of Klöckner-Werke AG; acquired<br />
Georgsmarienhütte in 1993; Owner and Managing Director<br />
of Georgsmarienhütte Holding GmbH from 1993 to 2006;<br />
joined RWE AG as President and CEO with effect from<br />
October 1, 2007.<br />
Group-level responsibilities: Energy Policy, Compliance,<br />
Investor Relations, Communications, Executive Management,<br />
Executive Office and Auditing.<br />
Other appointments:<br />
• Amprion GmbH (Chairman)<br />
• BATIG Gesellschaft für Beteiligungen mbH<br />
• British American Tobacco (Industrie) GmbH<br />
• British American Tobacco (Germany) GmbH<br />
• Deutsche Bahn AG<br />
• SURTECO SE (Chairman)<br />
• Volkswagen AG<br />
- Hanover Acceptances Limited<br />
Dr. Leonhard Birnbaum<br />
Executive Vice-President of RWE AG,<br />
appointed until September 30, 2013<br />
Born in 1967 in Ludwigshafen am Rhein; graduated chemical<br />
engineer; consultant at McKinsey & Company Inc. from 1996<br />
to 2008; promoted to partner (principal) in 2000 and to senior<br />
partner (director) at McKinsey in 2006, exiting as member of<br />
McKinsey’s global management team for the energy sector;<br />
joined RWE AG as Head of Corporate Strategy and Business<br />
Development with effect from April 7, 2008; member of the<br />
Executive Board since October 1, 2008; Chief Strategy Officer<br />
of RWE AG since January 1, <strong>2009</strong>.<br />
Group-level responsibilities: Business Development, Strategy,<br />
Mergers & Acquisitions, Research & Development and Special<br />
Projects.<br />
Other appointments:<br />
- RWE Npower Holdings plc<br />
Born in 1953 in Westhofen (Rhine-Hesse); joined the<br />
RWE Group in 1974; trained master electrician; Executive Vice-<br />
President and Lab<strong>our</strong> Director of RWE Power AG from October<br />
2000 to July 2005; Executive Vice-President and Lab<strong>our</strong> Director<br />
of RWE AG since August 2005.<br />
Group-level responsibilities: Citizenship, Security,<br />
HR Management, Strategic HR Projects, Lab<strong>our</strong> Law, Diversity<br />
Office and Corporate Responsibility/Environmental Protection.<br />
Other appointments:<br />
• RWE IT GmbH (Chairman)<br />
• RWE Pensionsfonds AG<br />
• RWE Service GmbH (Chairman)<br />
- European School of Management and Technology GmbH<br />
Dr. Ulrich Jobs<br />
Executive Vice-President of RWE AG,<br />
appointed until March 31, 2012<br />
Born in 1953 in Herne; holds a diploma in engineering and a<br />
doctorate in mining/mine engineering; joined the RWE Group<br />
in 1977; Executive Vice-President of RWE AG since April 2007;<br />
concurrently CEO of RWE Power AG from May 2007 to February<br />
2008; Chief Operating Officer of RWE AG from April 2008 to<br />
April <strong>2009</strong>; Chief Operating Officer International of RWE AG<br />
since May <strong>2009</strong>.<br />
Group-level responsibilities: Performance Improvement/Investment<br />
Management International, Value Chain Management<br />
and Organisation.<br />
Other appointments:<br />
• Deutsche Steinkohle Aktiengesellschaft<br />
• RAG AG<br />
• RWE Dea AG (Chairman)<br />
- ELMÜ Nyrt. (Chairman)<br />
- EMASZ Nyrt. (Chairman)<br />
- Essent N.V.<br />
- RWE Npower Holdings plc (Chairman)<br />
- RWE Polska Spólka Akcyina (Chairman)<br />
• Member of other mandatory supervisory boards.<br />
- Member of comparable domestic and foreign supervisory bodies of<br />
commercial enterprises.
<strong>2009</strong> in brief To <strong>our</strong> investors Review of operations Our responsibility<br />
Responsibility statement Consolidated financial statements Further information<br />
Boards 213<br />
- RWE Supply & Trading GmbH (Chairman)<br />
- RWE Transgas, a.s. (Chairman)<br />
- RWE Transgas Net, s.r.o.<br />
- Východoslovenská energetika, a.s.<br />
- Mátrai Kraftwerk G.AG<br />
Dr. Rolf Pohlig<br />
Executive Vice-President of RWE AG,<br />
appointed until December 31, 2011<br />
Born in 1952 in Solingen; doctorate in economics; Executive<br />
Vice-President Finance and Accounting of VEBA AG from 1993<br />
to 2000; Executive Vice-President Mergers & Acquisitions of<br />
E.ON AG from 2000 to 2006; joined the RWE Group in January<br />
2007 as Executive Vice-President; Chief Financial Officer of<br />
RWE AG since May 2007.<br />
Group-level responsibilities: Controlling, Finance, Risk Management,<br />
Legal/Board Affairs, Accounting, Tax and Insurance.<br />
Dr. Rolf Martin Schmitz<br />
Executive Vice-President of RWE AG,<br />
appointed until April 30, 2014<br />
Born in 1957 in Mönchengladbach; doctorate in engineering;<br />
i.a. in charge of corporate development and economic policy at<br />
VEBA AG from 1988 to 1998; Member of the Executive Board<br />
of rhenag Rheinische Energie AG, Cologne, from 1998 to 2001;<br />
Member of the Board of Management of Thüga AG, Munich,<br />
from 2000 to 2004; Chairman of the Board of Directors of E.ON<br />
Kraftwerke GmbH, Hanover, from 2004 to 2005; Chairman of<br />
the Board of Management of RheinEnergie AG, Cologne, and<br />
Managing Director of Stadtwerke Köln from 2006 to <strong>2009</strong>;<br />
joined RWE AG as Executive Vice-President and Chief Operating<br />
Officer National with effect from May 1, <strong>2009</strong>.<br />
Group-level responsibilities: Investment Management<br />
National, Concessions, Municipalities and Management of<br />
Generation, Networks and Sales.<br />
Other appointments:<br />
• RWE Pensionsfonds AG (Chairman)<br />
• RWE Power AG<br />
• RWE Rheinland Westfalen Netz AG<br />
• RWE Stiftung gemeinnützige GmbH (Chairman)<br />
• RWE Vertrieb AG<br />
- Essent N.V.<br />
- RWE Npower Holdings plc<br />
- RWE Transgas, a.s.<br />
Other appointments:<br />
• envia Mitteldeutsche Energie AG (Chairman)<br />
• Lechwerke AG (Chairman)<br />
• RWE Power AG (Chairman)<br />
• RWE Rheinland Westfalen Netz AG (Chairman)<br />
• RWE Vertrieb AG (Chairman)<br />
• Süwag Energie AG (Chairman)<br />
• VSE AG (Chairman)<br />
• Member of other mandatory supervisory boards.<br />
- Member of comparable domestic and foreign supervisory bodies of<br />
commercial enterprises.
214 Organisation chart of the RWE Group<br />
RWE Annual Report <strong>2009</strong><br />
ORGANISATION CHART OF THE RWE GROUP<br />
As of February 12, 2010<br />
RWE AG<br />
Chief Operating Officer National<br />
Dr. Rolf Martin Schmitz<br />
Germany Netherlands/Belgium United Kingdom<br />
Power generation<br />
Sales and distribution networks<br />
RWE Power AG<br />
• Dr. Johannes F. Lambertz<br />
• Prof. Dr. Gerd Jäger<br />
• Antonius Voß<br />
• Erwin Winkel<br />
RWE Vertrieb AG<br />
• Dr. Knut Zschiedrich<br />
• Achim Südmeier<br />
• Dr. Bernd Widera<br />
• Ralf Zimmermann<br />
RWE Effizienz GmbH<br />
• Dr. Hanns-<br />
Ferdinand Müller<br />
• Dr. Norbert Verweyen<br />
RWE Rheinland<br />
Westfalen Netz AG<br />
• Dr. Arndt Neuhaus<br />
• Bernd Böddeling<br />
• Dr. Heinz-Willi Mölders<br />
• Dr. Joachim Schneider<br />
envia Mitteldeutsche<br />
Energie AG / MITGAS<br />
Mitteldeutsche<br />
Gasversorgung GmbH<br />
• Carl-Ernst Giesting<br />
• Dr. Andreas Auerbach<br />
• Ralf Hiltenkamp<br />
KEVAG AG<br />
• Dr. Karlheinz Sonnenberg<br />
• Bernd Wieczorek<br />
Lechwerke AG<br />
• Dr. Markus Litpher<br />
• Paul Waning<br />
Süwag Energie AG<br />
• Dr. Klaus-Peter Balthasar<br />
• Jost Geweke<br />
• Dr. Klaus Kaiser<br />
VSE AG<br />
• Tim Hartmann<br />
• Prof. Leo Petry<br />
KELAG AG<br />
• Dr. Hermann Egger<br />
• Harald Kogler<br />
• Armin Wiersma<br />
Essent N.V.<br />
• Peter Terium<br />
• Rinse de Jong<br />
• Huib Morelisse<br />
• Erwin van Laethem<br />
RWE Npower plc<br />
• Volker Beckers<br />
• Kevin McCullough<br />
• Kevin Miles<br />
• Dr. Frank Weigand
<strong>2009</strong> in brief To <strong>our</strong> investors Review of operations Our responsibility<br />
Responsibility statement Consolidated financial statements Further information<br />
Organisation chart of the RWE Group 215<br />
RWE AG<br />
Chief Operating Officer International<br />
Dr. Ulrich Jobs<br />
Chief Strategy Officer<br />
Dr. Leonhard Birnbaum<br />
Central and Eastern Europe Renewables Upstream gas & oil Trading/gas midstream<br />
RWE Hungária Kft.<br />
(Hungary)<br />
• Emmerich Endresz<br />
• László Koncz<br />
• Dr. Marie-Theres Thiell<br />
• József Valaska<br />
RWE Polska s.a.<br />
(Poland)<br />
• Dr. Filip Thon<br />
• Sławomir Jacek Koczywąs<br />
• Janusz Moroz<br />
• Dr. Werner Wetekamp<br />
Východoslovenská<br />
energetika, a.s.<br />
(Slovakia)<br />
• Norbert Schürmann<br />
• Radoslav Haluška<br />
• Martin Miklás<br />
RWE Transgas, a.s.<br />
(Czech Republic)<br />
• Martin Herrmann<br />
• Dr. Wolfgang Peters<br />
• Dirk Simons<br />
• Tomáš Varcop<br />
RWE Transgas Net, s.r.o.<br />
(Czech Republic)<br />
• Thomas Kleefuß<br />
• Jan Nehoda<br />
RWE Holding A.S.<br />
(Turkey)<br />
– report to<br />
Dr. Leonhard Birnbaum –<br />
• Dr. Andreas Radmacher<br />
• Helmut Kempf<br />
RWE Innogy GmbH<br />
• Prof. Dr. Fritz Vahrenholt<br />
• Dr. Hans Friedrich Bünting<br />
• Paul Coffey<br />
RWE Dea AG<br />
• Thomas Rappuhn<br />
• Lutz-Michael Liebau<br />
• Ralf to Baben<br />
RWE Supply & Trading<br />
GmbH<br />
• Stefan Judisch<br />
• Dr. Bernhard Günther<br />
• Dr. Peter Kreuzberg<br />
• Richard Lewis<br />
• Alan Robinson<br />
RWE AG<br />
Amprion GmbH<br />
Transmission System<br />
Operator<br />
(unbundled)<br />
• Dr. Hans-Jürgen Brick<br />
• Dr. Klaus Kleinekorte<br />
RWE Technology GmbH<br />
• Matthias Hartung<br />
• Dr. Michael Fübi<br />
• Dr. Ralf Nowack<br />
RWE Consulting GmbH<br />
• Dr. Klaus Grellmann<br />
• Eckhard Frischbier<br />
RWE IT GmbH<br />
• Chittur Ramakrishnan<br />
• Stefan Niehusmann<br />
RWE Service GmbH<br />
• Georg Petrich<br />
• Dr. Ulrich Piepel
216 Organisation chart of RWE AG<br />
RWE Annual Report <strong>2009</strong><br />
ORGANISATION CHART OF RWE AG<br />
As of February 12, 2010<br />
RWE AG<br />
President and Chief Executive Officer<br />
Dr. Jürgen Großmann<br />
Public Affairs/Energy Policy<br />
Dr. Peter Heinacher<br />
Compliance<br />
Dr. Jens Hüffer<br />
Investor Relations<br />
Ingo Alphéus<br />
Corporate Communications<br />
Volker Heck<br />
Group Executive Management<br />
Dr. Johannes Karlisch<br />
Executive Office<br />
Sabine Jeschke<br />
Group Audit<br />
Harry Schur<br />
Chief Financial Officer<br />
Dr. Rolf Pohlig<br />
Group Controlling<br />
Dominik Asam (as of March 15, 2010)<br />
Group Finance<br />
Dr. Markus Coenen<br />
Group Risk Management<br />
Dr. Michael Herrmann<br />
Legal/Board Affairs<br />
Dr. Manfred Döss<br />
Group Accounting<br />
Fred Riedel<br />
Group Tax<br />
Dr. Berend Holst<br />
Group Insurance<br />
Dr. Joachim Haaf<br />
Lab<strong>our</strong> Director<br />
Alwin Fitting<br />
Corporate Citizenship<br />
Dr. Stephan Muschick<br />
Group Security<br />
Michael Schmidt<br />
Group HR Management<br />
Dr. Hans-Dieter Rüter<br />
Strategic HR Projects/Lab<strong>our</strong> Law<br />
Dr. Peter Gentges<br />
Diversity Office<br />
Dr. Claudia Mayfeld<br />
Corporate Responsibility/Environmental<br />
Protection<br />
Joachim Löchte<br />
Chief Operating Officer National<br />
Dr. Rolf Martin Schmitz<br />
Investment Management National<br />
Dr. Arndt Neuhaus<br />
Generation Management<br />
Dr. Johannes F. Lambertz<br />
Concessions/Municipalities<br />
Dr. Hanns-Ferdinand Müller<br />
Network Management<br />
Dr. Joachim Schneider<br />
Retail Management<br />
Dr. Knut Zschiedrich<br />
Chief Operating Officer International<br />
Dr. Ulrich Jobs<br />
Performance Improvement/Investment<br />
Management International<br />
Dr. Nina Skorupska<br />
Value Chain Management<br />
Andy Butterworth<br />
Group Organisation<br />
Uwe Bargmann<br />
Chief Strategy Officer<br />
Dr. Leonhard Birnbaum<br />
Business Development<br />
Karl Kraus<br />
Group Strategy<br />
Thomas Birr<br />
Mergers & Acquisitions<br />
Andreas Zetzsche<br />
Research & Development<br />
Dr. Frank-Detlef Drake<br />
Special Projects<br />
Prof. Dr. Wolfgang Straßburg
<strong>2009</strong> in brief To <strong>our</strong> investors Review of operations Our responsibility<br />
Responsibility statement Consolidated financial statements Further information<br />
Glossary 217<br />
GLOSSARY<br />
Asset coverage. Ratio of long-term capital (shareholders’<br />
equity and non-current liabilities) to long-term assets.<br />
Current asset intensity of investment. Ratio of current assets<br />
to total assets.<br />
Barrel. International unit of measurement for trading oil.<br />
A US barrel corresponds to 158.987 litres.<br />
Base load. Constant minimum demand for electricity irrespective<br />
of load fluctuation. This electricity is used by household<br />
appliances running 24 h<strong>our</strong>s a day, industrial facilities that<br />
operate around the clock, etc. Base-load power is primarily<br />
generated by nuclear and lignite power stations. These facilities<br />
are usually in operation more than 6,000 h<strong>our</strong>s a year.<br />
Run-of-river power stations and biomass plants also supply<br />
base-load power.<br />
CO 2 . Chemical formula for carbon dioxide. CO 2 is a chemical<br />
compound made of carbon and oxygen.<br />
Clean Development Mechanism. In accordance with the Kyoto<br />
Protocol, companies and countries can obtain emissions certificates<br />
by participating in projects to reduce emissions in newly<br />
industrialising and developing countries, which are not obliged<br />
to reduce emissions themselves. They can use these certificates<br />
to meet their own requirements.<br />
Commercial paper. Tradable, unsecured bearer bond issued<br />
only for short-term debt financing. Commercial paper is a<br />
revolving credit facility, with terms typically ranging from one<br />
day to 24 months.<br />
Commodity. Term for standardised, tradable goods such as<br />
electricity, oil or gas.<br />
Confidence level. Probability of a value lying within a certain<br />
interval.<br />
Credit default swap (CDS). Financial derivative for trading<br />
default risks associated with debt financing. The party seeking<br />
to hedge such risks generally pays an annual fee to the principal.<br />
In the event that the underlying credit is not repaid, the<br />
hedge-seeking party receives a contractually agreed sum from<br />
the principal.<br />
Debt issuance programme. Contractual master and model<br />
documents for the issuance of bonds. It can be used as a flexible<br />
financing vehicle to issue long-term debt.<br />
Defined benefit obligation. Net present value of an employee’s<br />
benefit entitlements as of the balance-sheet date.<br />
Degree of asset depreciation. Cumulative property, plant and<br />
equipment depreciation-to-cost ratio.<br />
Diluted earnings per share. If a company places new shares on<br />
the financial market as part of a capital increase, the portion of<br />
the company represented by each share decreases. In addition,<br />
the rise in the total number of shares causes earnings per share<br />
to decline. This drop in value is referred to as a dilution.<br />
EBITDA. Earnings before interest, taxes, depreciation and<br />
amortisation.<br />
Efficiency. In energy conversion, the ratio of useful work performed<br />
to total energy expended. In thermal power stations,<br />
the efficiency is the percentage of thermal energy contained in<br />
the fuel which can be converted to electricity. The higher the<br />
efficiency, the lower the loss of the fuel’s energy content.<br />
Modern gas-fired power plants have an efficiency of up to 60 %.<br />
Efficiencies of 46 % and 43 % can be achieved with hard coal<br />
and lignite respectively.<br />
Equity accounting. Method for accounting for entities whose<br />
assets and liabilities cannot be entirely included in the consolidated<br />
financial statements by fully consolidating the entity. In<br />
such cases, the carrying amount of the investment is recorded<br />
on the basis of the development of the share held in the entity’s<br />
equity. This change is recorded in the income statement of<br />
the company which owns the share in the entity.
218 Glossary<br />
RWE Annual Report <strong>2009</strong><br />
Exploration. Term used for the search for, and prospecting of,<br />
oil and gas res<strong>our</strong>ces.<br />
Fixed asset intensity of investments. Ratio of non-current<br />
assets (property, plant and equipment; intangible assets; and<br />
investment property) to total assets.<br />
<strong>For</strong>ward market/forward trading. Contracts for transactions to<br />
be fulfilled at a fixed point in time in the future are traded on<br />
forward markets. The price of the forward is established when<br />
the contract is agreed.<br />
Full consolidation. Method for including subsidiaries in the<br />
financial statements of a group in cases where the subsidiaries<br />
are controlled by the parent company (through the majority of<br />
the voting rights or by other means).<br />
Hard coal unit (HCU). Unit of measurement for the energy content<br />
of primary energy carriers. One kilogram HCU corresponds<br />
to 29,308 kilojoules.<br />
Joint Implementation. In accordance with the Kyoto Protocol,<br />
countries or companies can obtain emissions certificates by<br />
participating in projects to reduce emissions in certain other<br />
countries which are also obliged to reduce emissions. They can<br />
use these certificates to meet their own reduction requirements.<br />
Peak load. Need for electricity in periods of maximum network<br />
usage, for example, at noon, when meals are prepared in many<br />
factories and homes. Peak-load power plants are often in service<br />
less than 3,000 h<strong>our</strong>s per year. Gas-fired and hydro storage<br />
power stations belong to this category.<br />
Performance shares. Virtual shares, which entitle participants<br />
in the Beat Long-Term Incentive Plan to receive a payment at<br />
the end of the three-year plan period. Performance shares are<br />
not exercised individually. They are paid out in cash at the end<br />
of the period if the pre-defined performance targets have been<br />
met or exceeded.<br />
Put or call options. Options granting their buyer the right<br />
to purchase (call option) or sell (put option) a specific underlying,<br />
for example a share, at a pre-arranged price within a predetermined<br />
period of time.<br />
Rating. Standardised method in international capital markets<br />
for assessing the risk exposure and creditworthiness of debt<br />
issuers. A Single A rating is given to borrowers of strong creditworthiness.<br />
Service cost. Reflects the increase in the cost associated with<br />
the net present value of an employee’s benefit entitlements<br />
in accordance with the employee’s work performance in the<br />
period being reviewed.<br />
Kilowatt (kW). Unit of measurement of electric output.<br />
1 megawatt (MW) = 10 3 kilowatts,<br />
1 gigawatt (GW) = 10 6 kilowatts,<br />
1 terawatt (TW) = 10 9 kilowatts.<br />
Leverage factor. Ratio of net debt to EBITDA.<br />
LNG. Acronym for liquefied natural gas. LNG is obtained by<br />
cooling gas until it becomes liquid. It occupies only 1/600 of<br />
the space filled by natural gas in its gaseous state. In this form,<br />
it is very well suited for transportation and storage.<br />
Spot market/spot trading. General term for markets where<br />
payment and delivery are effected immediately on conclusion<br />
of the transaction.<br />
Syndicated credit line. Credit line offered to companies,<br />
backed by several banks, which can be drawn down in various<br />
amounts, terms and currencies. Generally used to secure<br />
liquidity.
<strong>2009</strong> in brief To <strong>our</strong> investors Review of operations Our responsibility<br />
Responsibility statement Consolidated financial statements Further information<br />
Glossary 219<br />
Total Shareholder Return (TSR). Indicator of the development<br />
of a share investment over the long term. It takes into account<br />
both the dividends paid as well as the changes in share price<br />
for the duration of the investment.<br />
Upstream. Term for all activities involved in the exploration and<br />
production of oil and gas. Also includes the processing of these<br />
res<strong>our</strong>ces into marketable raw materials meeting generally<br />
accepted quality standards.<br />
Value at risk (VaR). Measure of risk indicating the maximum<br />
loss that might occur from a risk position (e.g. a securities<br />
portfolio) assuming a certain probability under normal market<br />
conditions and that the position is held for a certain period<br />
of time. A value at risk of €1 million with a holding period of<br />
one day and a confidence level of 95 % means that there is a<br />
95 % probability that the potential loss resulting from the risk<br />
position will not exceed €1 million from one day to the next.
220 Index<br />
RWE Annual Report <strong>2009</strong><br />
INDEX<br />
A<br />
Apprenticeships 132<br />
Acquisitions 34, 49, 109<br />
B<br />
Balance sheet 86, 87, 142, 166<br />
Bonds 28, 81, 88, 90, 184, 193<br />
I<br />
Income statement 87, 140, 160<br />
Inventories 142, 153, 173<br />
Investor relations 30<br />
L<br />
Liabilities 83, 87, 142, 155, 184, 193<br />
C<br />
Capital expenditure 36, 50, 76, 107<br />
Cash and cash equivalents 83, 142, 153, 173, 198<br />
Cash flow 84, 143, 198<br />
Cash flow statement 85, 143, 198<br />
Climate and environmental<br />
protection 25, 47, 92, 108, 133, 136<br />
CO 2 emissions 35, 47, 59, 108, 133<br />
CO 2 emissions trading 42, 59, 101, 106<br />
Corporate responsibility 133<br />
Cost of capital 70, 207<br />
D<br />
Debt 82, 83, 112, 142, 156, 194,<br />
199, 207<br />
Depreciation 140, 151, 161, 163, 166, 168<br />
Dividend 27, 89, 112, 113, 174<br />
E<br />
Earnings 68, 88, 109, 140<br />
EBITDA 56, 67, 110, 217<br />
Economy 39, 105<br />
Efficiency enhancement 75<br />
Electric vehicles 50, 94, 133<br />
Employees 79, 92, 112, 131, 137, 161<br />
Energy efficiency 50, 94, 133<br />
Equity 86, 87, 142, 144, 173, 206<br />
Executive Board 22, 53, 89, 121, 124, 212<br />
F<br />
Financial assets 76, 87, 142, 152, 170<br />
Financial result 73, 163<br />
N<br />
Net income 72, 74, 186<br />
Nuclear energy 44, 47, 50, 57, 107<br />
O<br />
Operating result 67, 110<br />
P<br />
Procurement 36, 44, 80, 106<br />
Property, plant and<br />
equipment 76, 142, 151, 168<br />
Provisions 73, 83, 86, 142, 154, 178<br />
R<br />
Rating 83, 218<br />
Recurrent net income 74, 110<br />
Renewable energy 36, 47, 51, 58, 108<br />
Research and development 92, 112, 135, 167<br />
Revenue 65, 140, 160, 196, 204<br />
Risk management 95, 145, 190<br />
ROCE 70, 207<br />
RWE AG (holding company) 87, 216<br />
S<br />
Segment reporting 195<br />
Share 26, 74, 89, 173, 186<br />
Shareholder structure 28<br />
Strategy 32, 107, 133<br />
Supervisory Board 54, 116, 130, 209<br />
T<br />
Takeover report 89<br />
G<br />
Group structure 37, 49, 55, 214<br />
V<br />
Value management 70, 207
<strong>2009</strong> in brief to <strong>our</strong> investors review of operations <strong>our</strong> responsibility<br />
responsibility statement consolidated financial statements further information<br />
Imprint 221<br />
ImprInt<br />
RWE Aktiengesellschaft<br />
Opernplatz 1<br />
45128 Essen<br />
Germany<br />
Phone +49 201 12-00<br />
Fax +49 201 12-15199<br />
E-mail contact@rwe.com<br />
Investor Relations:<br />
Phone +49 201 12-15025<br />
Fax +49 201 12-15265<br />
E-mail invest@rwe.com<br />
Design concept and layout:<br />
Claus Koch Identity, Düsseldorf<br />
Typesetting, image editing and production:<br />
Kompass/Chiari Werbeagentur GmbH, Essen<br />
Photographs:<br />
Julia Baier, Berlin<br />
Catrin Moritz, Essen<br />
Andreas Teichmann, Essen<br />
Helmut Kramer<br />
REpower, photographer: Christian Eiche<br />
RWE archive<br />
Corporate Communications:<br />
Phone +49 201 12-15250<br />
Fax +49 201 12-15094<br />
<strong>For</strong> annual reports, interim reports and further<br />
information on RWE, please visit us on the internet at<br />
www.rwe.com or call <strong>our</strong> shareholder hotline:<br />
Phone 0180 1 451280 (callers in Germany)<br />
Phone +49 180 1 451280 (callers outside Germany,<br />
excluding the USA)<br />
Phone +11 49 180 1 451280 (callers from the USA)<br />
Printing:<br />
D+L Printpartner GmbH, Bocholt<br />
RWE is a member of DIRK,<br />
the German Investor Relations Association.<br />
The annual report was published on February 25, 2010. This is<br />
a translation of the German annual report. In case of divergence<br />
from the German version, the German version shall<br />
prevail.
fIve-year overvIew<br />
(part of the revIew of operatIons)<br />
Five-year overview<br />
<strong>2009</strong> 2008 2007 2006 2005<br />
RWE Group<br />
External revenue € million 47,741 48,950 42,507 42,554 39,487<br />
Income<br />
EBITDA 1 € million 9,165 8,773 7,915 7,172 7,095<br />
Operating result € million 7,090 6,826 6,533 5,681 5,371<br />
Income from continuing operations before tax € million 5,598 4,866 5,246 3,537 3,156<br />
Net income / RWE AG shareholders‘ share in net income € million 3,571 2,558 2,667 3,847 2,231<br />
Earnings per share € 6.70 4.75 4.74 6.84 3.97<br />
Recurrent net income per share € 6.63 6.25 5.29 4.38 4.01<br />
Return on equity % 28.5 20.7 20.1 30.3 20.8<br />
Return on revenue % 14.8 12.3 16.0 15.2 13.6<br />
Value management 2<br />
Return on capital employed (ROCE) % 16.3 17.2 16.5 14.2 16.6<br />
Value added € million 3,177 3,453 2,970 2,074 2,451<br />
Capital employed € million 43,597 39,809 39,710 40,206 32,444<br />
Cash flow/capital expenditure/depreciation<br />
and amortisation<br />
Cash flows from operating activities € million 5,299 8,853 6,085 6,783 5,304<br />
Free cash flow € million -614 4,399 2,020 2,289 1,637<br />
Capital expenditure including acquisitions € million 15,637 5,693 4,227 4,728 4,143<br />
of which: property, plant and equipment € million 5,913 4,454 4,065 4,494 3,667<br />
Depreciation, amortisation, impairment losses<br />
and asset disposals € million 2,553 2,416 2,629 3,164 4,098<br />
Degree of asset depreciation % 64.0 69.4 70.9 66.0 59.9<br />
Free cash flow per share € -1.15 8.17 3.59 4.07 2.91<br />
Asset/capital structure<br />
Non-current assets € million 56,563 41,763 41,360 51,999 71,680<br />
Current assets € million 36,875 51,667 42,060 41,456 37,778<br />
Balance sheet equity € million 13,717 13,140 14,659 14,111 12,357<br />
Non-current liabilities € million 45,633 36,793 36,796 52,402 65,065<br />
Current liabilities € million 34,088 43,497 31,965 26,942 32,036<br />
Balance sheet total € million 93,438 93,430 83,420 93,455 109,458<br />
Fixed asset intensity of investments % 49.4 35.5 38.4 44.0 50.4<br />
Current asset intensity of investments % 39.5 55.3 50.4 44.4 34.5<br />
Asset coverage % 104.9 119.6 124.4 127.9 108.0<br />
Equity ratio % 14.7 14.1 17.6 15.1 11.3<br />
Net financial debt of continuing operations € million 10,382 -650 -2,064 -4,720 11,438<br />
Net debt of the RWE Group € million 25,787 18,659 16,514 17,827 33,937<br />
Leverage factor 2.8 2.1 2.1 – –
FIVE-YEAR OVERVIEW (PART OF THE REVIEW OF OPERATIONS) FOLD-OUT TABLE OF CONTENTS<br />
Five-year overview<br />
<strong>2009</strong> 2008 2007 2006 2005<br />
RWE Group<br />
Workforce<br />
Workforce at the end of the year 3 70,726 65,908 63,439 61,725 85,928<br />
Research & development<br />
R&D costs € million 110 105 74 73 55<br />
R&D employees 350 330 270 273 223<br />
Emissions balance<br />
CO 2 emissions million metric tons 149 172 187 178 173<br />
Free allocation of CO 2 certificates million metric tons 105 105 170 167 165<br />
Shortage of CO 2 certificates million metric tons 44 67 17 11 8<br />
Specific CO 2 emissions metric tons/MWh 0.796 0.768 0.866 0.797 0.788<br />
Five-year overview<br />
<strong>2009</strong> 2008 2007 2006 2005<br />
RWE Aktiengesellschaft<br />
Dividend/dividend payment<br />
Dividend payment € million 1,867 4 2,401 1,689 1,968 984<br />
Dividend per share € 3.50 4 4.50 3.15 3.50 1.75<br />
Market capitalisation<br />
Market capitalisation at the end of the year € billion 38.0 35.4 53.5 46.5 34.9<br />
Long-term credit rating<br />
Moody’s A2 A1 A1 A1 A1<br />
(outlook) (negative) (negative) (stable) (stable) (stable)<br />
Standard & Poor’s A A A+ A+ A+<br />
(outlook) (negative) (stable) (negative) (negative) (negative)<br />
1 Since 2008, EBITDA has also included operating income from investments.<br />
2 Figures from 2006 according to the new value management concept; see Annual Report 2007, page 208.<br />
3 Converted to full-time positions.<br />
4 Proposed dividend for RWE AG’s <strong>2009</strong> fiscal year, subject to approval by the April 22, 2010 Annual General Meeting.
FINANCIAL CALENDAR 2010/2011<br />
April 22, 2010<br />
Annual General Meeting<br />
April 23, 2010<br />
Dividend payment<br />
May 12, 2010 Interim report for the first quarter of 2010<br />
August 12, 2010 Interim report for the first half of 2010<br />
November 11, 2010 Interim report for the first three quarters of 2010<br />
February 24, 2011 Annual report for fiscal 2010<br />
April 20, 2011<br />
Annual General Meeting<br />
April 21, 2011<br />
Dividend payment<br />
May 12, 2011 Interim report for the first quarter of 2011<br />
August 11, 2011 Interim report for the first half of 2011<br />
November 10, 2011 Interim report for the first three quarters of 2011<br />
The Annual General Meeting and all events concerning the publication of the financial reports are broadcast live on the internet and recorded.<br />
We will keep the recordings on <strong>our</strong> website for at least twelve months.
CONTENTS<br />
MAKE BIG THINGS HAPPEN.<br />
<strong>For</strong> <strong>our</strong> <strong>customers</strong>.<br />
<strong>2009</strong> IN BRIEF 20<br />
TO OUR INVESTORS 22<br />
Letter from the CEO 22<br />
RWE on the capital market 26<br />
4.0 CONSOLIDATED<br />
FINANCIAL STATEMENTS 139<br />
4.1 Income statement 140<br />
4.2 Statement of recognised<br />
income and expenses 141<br />
4.3 Balance sheet 142<br />
4. 4 Cash fl ow statement 143<br />
4.5 Statement of changes in equity 144<br />
4.6 Notes 145<br />
4.7 Auditor‘s report 203<br />
1.0 REVIEW OF OPERATIONS 31<br />
1.1 Strategy and structure 32<br />
1.2 Economic environment 39<br />
1.3 Political environment 47<br />
1. 4 Major events 49<br />
1.5 Notes on reporting 55<br />
1.6 Business performance 57<br />
1.7 Financial position and net worth 81<br />
1.8 Notes to the financial statements<br />
of RWE AG (holding company) 87<br />
1.9 Innovation 92<br />
1.10 Development of risks and opportunities 95<br />
1.11 Outlook for 2010 105<br />
FURTHER INFORMATION 204<br />
Material investments 204<br />
The RWE Group‘s value management 207<br />
Boards 209<br />
Organisation chart of the RWE Group 214<br />
Organisation chart of RWE AG 216<br />
Glossary 217<br />
Index 220<br />
Imprint 221<br />
Five-year overview<br />
Financial calendar<br />
2.0 OUR RESPONSIBILITY 115<br />
2.1 Supervisory Board report 116<br />
2.2 Corporate governance 121<br />
2.3 Compensation report 124<br />
2. 4 Workforce 131<br />
2.5 Sustainability 133<br />
3.0 RESPONSIBILITY STATEMENT 138
RWE Aktiengesellschaft<br />
Opernplatz 1<br />
45128 Essen<br />
Germany<br />
T +49 201 12-00<br />
F +49 201 12-15199<br />
I www.rwe.com


