innova junior college 2012 jc2 h2 chemistry practical ... - ASKnLearn
innova junior college 2012 jc2 h2 chemistry practical ... - ASKnLearn
innova junior college 2012 jc2 h2 chemistry practical ... - ASKnLearn

Create successful ePaper yourself
Turn your PDF publications into a flip-book with our unique Google optimized e-Paper software.
INNOVA JUNIOR COLLEGE<br />
<strong>2012</strong> JC2 H2 CHEMISTRY PRACTICAL<br />
REACTION KINETICS<br />
I PRINCIPLES OF REACTION KINETICS<br />
RATE EQUATION<br />
For a reaction: aA + bB<br />
The rate equation takes the form:<br />
products<br />
Rate = k [A] m [B] n<br />
The powers m and n are the orders of reaction with respect to reactant A and reactant B<br />
respectively. The overall order is m + n.<br />
m and n can only be determined experimentally.<br />
The rate constant, k, is only constant at a particular temperature.<br />
For elementary and non-elementary reactions, please refer to Reaction Kinetics lecture notes.<br />
The rate of reaction can be varied by changing the concentrations of reactants, changing the<br />
temperature and adding a catalyst.<br />
II METHODS TO DETERMINE ORDER OF REACTION<br />
OVERVIEW<br />
1
(A) Continuous method with sampling (ie. involve titration)<br />
Reactants of known concentrations are mixed and the time noted.<br />
Reaction samples are withdrawn regularly at fixed time intervals.<br />
Reaction samples are stopped by either dilution or addition of a ‘quenching’ reagent (i.e one<br />
which can stop the reaction chemically).<br />
Samples are titrated with a standard solution to determine the reactant/product concentration<br />
at each sample time.<br />
Rate of reaction can be determined with the change in concentration of reactant/product<br />
with time.<br />
(B) Continuous method without sampling<br />
Reactants of known concentrations are mixed and the time noted.<br />
Reaction mixture is continuously monitored with time using a convenient physical property<br />
(must be related to concentration).<br />
Rate of reaction can be determined with the change in concentration of reactant/product<br />
with time.<br />
(C) Discontinuous method (ie. initial rate method)<br />
For reactions that are accompanied by prominent visual changes, the rate of the reaction<br />
may be studied by “clock reaction” (ie. by measuring the time taken for a prescribed visual<br />
change to occur).<br />
Rate of reaction is measured by:<br />
(I) Colourless reactants form coloured products such as precipitate/coloured solution<br />
(II) Coloured reactants form colourless products<br />
III DATA ANALYSIS : CONCENTRATION TIME GRAPHS<br />
A concentration-time graph shows either how the concentration of a product increases with time,<br />
or how the concentration of a reactant decreases with time. The gradient (slope) of a<br />
concentration-time graph at any point measures the rate of reaction at that time.<br />
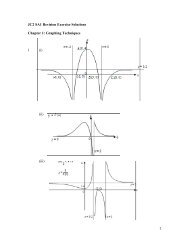
Method 1 : Gas Collection method<br />
One method to monitor the changes in concentration over time is the gas collection method. The<br />
apparatus shown below can be used to study the rate of reaction between marble chips (calcium<br />
carbonate) and dilute hydrochloric acid.<br />
CaCO 3 (s) + 2HCl (aq)<br />
CaCl 2 (aq) + CO 2 (g) + H 2 O (l)<br />
2
Set up 1<br />
100 cm 3<br />
conical flask<br />
100 cm 3<br />
measuring<br />
cylinder<br />
CaCO 3<br />
1000 cm 3<br />
beaker<br />
50 cm 3 of<br />
HCl<br />
OR Set up 2<br />
The reaction is allowed to proceed and the total volume of carbon dioxide gas collected is<br />
recorded. The CaCO 3 used is in excess and the reaction slows down as the hydrochloric acid gets<br />
less concentrated. The total volume of gas collected when the reaction stops = V final . This final<br />
volume is proportional to the concentration and number of moles of dilute hydrochloric acid used.<br />
At time t after the start of timing, the volume of gas collected is V t . This varies with the amount of<br />
acid that has reacted by that time. As time passes, the volume of gas collected V t increases as the<br />
volume of gas produced at time t is proportional to the number of moles of acid used up.<br />
(V final – V t ) is proportional to the concentration of dilute hydrochloric acid unreacted. As time<br />
passes, the concentration of dilute hydrochloric acid decreases. Hence plotting (V final – V t ) against<br />
time gives a concentration-time graph for the experiment.<br />
(V final – V t ) ∝ [HCl] unreacted<br />
3
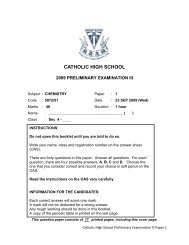
Example of results obtained:<br />
Time/min 1 2 3 4 5 6 7 8 9<br />
Volume of gas 1.7 3.4 4.9 6.6 8.1 9.5 11.2 12.2 12.2<br />
collected, V t /cm 3 (V final )<br />
V final – V t /cm 3 10.5 8.8 7.3 5.6 4.1 2.7 1.0 0 0<br />
[HCl] / mol dm -3 Time / min<br />
(V final – V t ) / cm 3 Time / min<br />
Tangent<br />
at t=0<br />
Tangent<br />
at t=0<br />
Analysis of results:<br />
1) Find the initial rate of the reaction by constructing a tangent to the curve at time = 0s to obtain<br />
the gradient.<br />
2) Vary the concentration of the dilute hydrochloric acid used and plot graphs of (V final – V t )<br />
against time on the same axis.<br />
3) Find the order of reaction with respect to hydrochloric acid by comparing the initial rate of<br />
reaction measured to the concentration of hydrochloric acid used.<br />
V final – V t / cm 3<br />
tangents<br />
[HCl] = 1 mol dm -3<br />
[HCl] = 2 mol dm -3<br />
Time / min<br />
4
Possible Errors and Improvements:<br />
In identifying suggestion for improvements, you must take note that the<br />
suggested improvement must address the error highlighted.<br />
Error 1 (for both set ups): Difficult to stopper the conical flask when starting the stop watch<br />
without loss of CO 2 gas, thus leading to a smaller volume of gas collected.<br />
Improvement 1: Use a pressure-equalizing funnel to introduce the hydrochloric acid.<br />
(containing HCl)<br />
CaCO 3<br />
Error 2 (for set up 1): The volume of gas was not measured at constant pressure. The volume of<br />
a gas is greatly affected by changes in pressure due to compression of air.<br />
Improvement 2: Use a well-greased syringe (refer to set up 2) to collect the gas so that gas is<br />
collected at constant pressure.<br />
Error 3 (for set up 1): Measuring cylinder is used for the measurement of hydrochloric acid. The<br />
volume of HCl measured is inaccurate since the measuring cylinder can only measure to the<br />
nearest 0.5 cm 3 .<br />
Improvement 3: Use a more precise apparatus, eg. burette to measure out 50 cm 3 of hydrochloric<br />
acid. The volume of HCl measured is more accurate since the burette can measure to the nearest<br />
0.05 cm 3 .<br />
5
Error 4 (for set up 1): Initially the gas that was produced will cause the displacement of water<br />
which is present in the tubing. It will thus give a lower volume of gas being collected.<br />
Improvement 4: Use an inverted burette for gas collection by connecting the tubing to the burette<br />
tip. Gas is collected by pushing the liquid level down in the burette.<br />
CaCO 3 in<br />
dilute HCl<br />
OR<br />
Use a frictionless gas syringe (refer to set up 2) to collect the gas that was produced, so that the<br />
gas need not be collected over water.<br />
Error 6 (for set up 1): As CO 2 gas is slightly soluble in water, the volume of gas collected is less<br />
than the actual volume of CO 2 evolved.<br />
Improvement 6: Saturate the water with CO 2 gas before starting gas collection.<br />
OR<br />
Use a frictionless gas syringe (refer to set up 2) to collect the CO 2 gas that was produced, so that<br />
the gas need not be collected over water.<br />
Other examples of reactions involving gas collection:<br />
(1) Metals reacting with acid to form hydrogen gas such as:<br />
Mg(s) + H 2 SO 4 (aq) MgSO 4 (aq) + H 2 (g)<br />
(2) Decomposition of hydrogen peroxide which is catalysed by manganese(IV) oxide<br />
2H 2 O 2 (aq)<br />
2H 2 O(l) + O 2 (g)<br />
6
Method 2 : Mass loss of reaction mixture<br />
The rate of a reaction that produces a gas can also be measured by following the mass loss as the<br />
gas is formed and escapes from the reaction flask. When calcium carbonate reacts with dilute<br />
hydrochloric acid, carbon dioxide is evolved. While the reaction is proceeding, the mass of the<br />
reaction flask decreases as gas escapes. The rate of the reaction is followed by observing the loss<br />
in mass (which is the mass of gas evolved).<br />
CaCO 3 (s) + 2HCl (aq)<br />
CaCl 2 (aq) + CO 2 (g) + H 2 O (l)<br />
The method is suitable for reactions producing carbon dioxide or oxygen but not very accurate for<br />
reactions producing hydrogen gas (as the mass loss is too low for it to be accurate).<br />
Analysis of results:<br />
1) A graph of mass of reaction flask (g) against time is plotted. This is the mass loss curve.<br />
2) Find the initial rate of reaction by measuring the tangent at t = 0s. The reaction rate is<br />
expressed as the rate of loss in mass from the flask in e.g. g/min based on the initial gradient<br />
(see graph below).<br />
3) Vary the concentration of the dilute hydrochloric acid used and plot graphs of mass of reaction<br />
flask against time.<br />
4) Find the order of reaction with respect to hydrochloric acid by comparing the initial rate of<br />
reaction measured to the concentration of hydrochloric acid.<br />
7
Method 3 : Clock Reaction<br />
A clock reaction is a reaction that is set up to produce a sudden observable colour change after a<br />
certain time when it has produced a fixed amount of one reactant/product.<br />
Rate of reaction is measured by:<br />
Colourless reactants form coloured<br />
products such as precipitate/coloured<br />
solution<br />
Example:<br />
Na 2 S 2 O 3 (aq) + 2HCl (aq)<br />
S (s) + SO 2 (g) + 2NaCl (aq)+ H 2 O (l)<br />
yellow ppt<br />
Rate ∝<br />
1<br />
time<br />
Coloured reactants form colourless<br />
products<br />
Example:<br />
CH 2 =CH 2 + Br 2<br />
reddish<br />
brown<br />
Rate ∝<br />
V coloured reactant<br />
time<br />
CH 2 BrCH 2 Br<br />
V Br 2<br />
e.g Rate ∝<br />
time<br />
when total volume of solution is kept<br />
constant.<br />
Eg 1. Reaction between sodium thiosulfate and hydrochloric acid<br />
This expt. will be done<br />
in RK1.<br />
Na 2 S 2 O 3 (aq) + 2HCl (aq) S (s) + SO 2 (g) + 2NaCl (aq) + H 2 O (l)<br />
The reaction of sodium thiosulfate (VI) with dilute hydrochloric acid produces a yellow precipitate<br />
of sulfur.<br />
8
The rate equation for the reaction is in the form:<br />
Rate = k [Na 2 S 2 O 3 ] x [HCl] y<br />
Where k is the rate constant<br />
x is the order of reaction with respect to sodium thiosulfate (VI)<br />
y is the order of reaction with respect to hydrochloric acid.<br />
A simple and effective procedure is to measure the time taken for enough sulfur to form to obscure<br />
a cross beneath the conical flask containing the reaction mixture. A stop watch is used to measure<br />
the time taken. It is reasonable to assume the same amount of sulfur is needed to obscure the<br />
cross at each time when different concentration of sodium thiosulfate (VI) or acid is used.<br />
The rate of the reaction can be determined by calculating the amount of sulfur produced in the<br />
time recorded. This is given by<br />
Rate ∝<br />
amount of sulfur produced<br />
time<br />
Amount of sulfur produced is assumed to be the same in each reaction so<br />
Rate ∝<br />
1<br />
time<br />
The order of reaction for each reactant is determined by varying the concentration of each reactant<br />
in turn, keeping the others constant. The concentration of each reactant is varied by using various<br />
volumes of sodium thiosulfate (VI) and hydrochloric acid. Water is added to keep the total<br />
volume of solution constant so that the volume of each reagent is proportional to its<br />
concentration.<br />
9
Analysis of results:<br />
Graphs of<br />
1<br />
time<br />
The reason is that<br />
(y axis) against volume of reactant that is varied (x axis) are plotted.<br />
1<br />
time<br />
is proportional to the rate of reaction and the volume of reactant is<br />
proportional to its concentration, since the total volume is constant.<br />
Concentration of reactant ∝<br />
volume of reactant<br />
total volume of solution<br />
Hence by plotting<br />
1<br />
time<br />
against concentration of reactant (x axis).<br />
(y axis) against volume of reactant is the same as plotting Rate (y axis)<br />
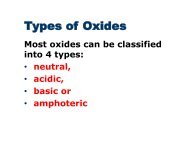
For a zero order reaction,<br />
Rate<br />
[reactant] /<br />
mol dm -3<br />
Vol. of<br />
reactant<br />
/cm3<br />
For a first order reaction,<br />
Rate<br />
[reactant] /<br />
mol dm -3<br />
Vol. of<br />
reactant<br />
/cm3<br />
10
For a second order reaction,<br />
Rate<br />
[reactant] /<br />
mol dm -3<br />
Vol. of<br />
reactant<br />
/cm3<br />
This expt. is<br />
similar to<br />
Eg 2. Reaction between hydrogen peroxide and acidified solution of potassium iodide<br />
RK2.<br />
When hydrogen peroxide is added to an acidified solution of potassium iodide, the iodide ions are<br />
slowly oxidized to form iodine.<br />
2I – (aq) + 2H + (aq) + H 2 O 2 (aq)<br />
colourless<br />
I 2 (aq) + 2H 2 O(l)<br />
brown<br />
Small quantities of starch and sodium thiosulfate (VI) are also present. As the iodine is produced, it<br />
reacts with thiosulfate (VI) and is converted back to iodide ions:<br />
I 2 (aq) + 2S 2 O 3<br />
2–<br />
2I – (aq) + S 4 O 6<br />
2–<br />
brown colourless colourless colourless<br />
When the iodine produced in the reaction is in excess of the sodium thiosulfate (VI), a blue colour<br />
suddenly appears as iodine reacts with starch.<br />
As long as excess thiosulfate (VI) ions are present in the solution, no free iodine can accumulate<br />
because it is immediately turned into iodide ions which are colourless.<br />
The thiosulfate (VI) ions are the limiting reagent. So once all the thiosulfate (VI) ions are<br />
consumed, iodine starts to form in the solution. Aqueous iodine is brown (or pale yellow,<br />
depending on its concentration) in colour. If starch is added to the solution then a more dramatic<br />
blue solution is formed by the complex of starch–iodine. The colour change is sharp, and the time<br />
elapsed to this point is determined simply by the use of a stop watch.<br />
11
The time taken for the blue colour to appear with a constant quantity of sodium thiosulfate (VI)<br />
present depends on the rate of formation of iodine.<br />
Rate of reaction ∝ 1 t<br />
where t is the time from the addition of the peroxide solution to the appearance of the blue colour.<br />
The volume of hydrogen peroxide and potassium iodide are varied, keeping the volume of<br />
thiosulfate (VI) and acid constant. Water is also added keeping the total volume of solution<br />
constant so that the volume of each reagent is proportional to its concentration.<br />
Analysis of results: Method 1<br />
When the mixture is added to the beaker, the stop watch is started and when the blue colour<br />
appears, the time is recorded as t. The product (V H2 O 2<br />
x t) is recorded when the volume of H 2 O 2 is<br />
varied and the rest of the reactants volumes are kept constant. The product (V KI x t) is recorded<br />
when the volume of KI is varied and the rest of the reactants volumes are kept constant. Both the<br />
products are constant when the volumes of KI and H 2 O 2 are varied. Thus, it is first order with<br />
respect to hydrogen peroxide and first order with respect to potassium iodide.<br />
Hence the rate equation is<br />
Rate = k [H 2 O 2 ] [KI]<br />
The reason the products are constant is because:<br />
For a first order reaction,<br />
Rate = k [reactant]<br />
i.e. Rate ∝ concentration of reactant<br />
Since volume of reactant ∝ concentration of reactant and rate∝ 1<br />
time ,<br />
Rate ∝ concentration of reactant<br />
≡<br />
1<br />
∝ volume of reactant<br />
time<br />
∴ volume of reactant = k (<br />
1<br />
time )<br />
∴ volume of reactant x time = k<br />
where k is a constant<br />
12
FOR YOUR KNOWLEDGE…<br />
For a second order reaction,<br />
Rate = k[reactant] 2<br />
ie. Rate α (concentration of reactant) 2<br />
≡<br />
1<br />
time<br />
α (volume of reactant)2<br />
∴ (volume of reactant) 2 = k (<br />
1<br />
time )<br />
∴ (volume of reactant) 2 x time = k<br />
For a zero order reaction,<br />
Rate = k<br />
∴<br />
1<br />
time = k<br />
In addition, the concentration of iodide ion in the solution remains constant at its original value.<br />
Even though the peroxide–iodide reaction tends to consume iodide ions, the thiosulfate (VI) ion<br />
immediately returns the iodine to the iodide ion form:<br />
As long as there are excess thiosulfate (VI) ions present, there is no change in the concentration<br />
of the iodide ion. This means that the rate of the reaction will change only because the<br />
concentration of the KI and H 2 O 2 changes.<br />
Analysis of results: Method 2<br />
From the relationship volume of reactant x time = k,<br />
⇒<br />
1<br />
time<br />
Taking logs on both sides of the equation:<br />
log (<br />
= volume of reactant x k<br />
1<br />
) = log (volume of reactant) + log k<br />
time<br />
13
Plotting log (<br />
1<br />
) against log (volume of reactant) gives a straight line. The gradient of the graph<br />
time<br />
gives the order of reaction with respect to the reactant.<br />
Eg 3. Decolourisation of coloured reactants [Extracted from RJC Prelim 2009]<br />
Ethene reacts with bromine in tetrachloromethane to form 1,2−dibromoethane as shown by the<br />
equation:<br />
CH 2 =CH 2 + Br 2 CH 2 BrCH 2 Br<br />
To find out the orders of reaction with respect to ethene and bromine, ethene and bromine were<br />
first dissolved separately in tetrachloromethane. Various volumes of these solutions and<br />
tetrachloromethane were mixed and the time taken for the colour of bromine to disappear was<br />
recorded. The results are shown in the table below:<br />
Experiment<br />
Volume of ethene<br />
solution/ cm 3<br />
Volume of bromine<br />
solution/ cm 3<br />
Volume of<br />
tetrachloromethane/<br />
cm 3<br />
Time taken for<br />
colour of bromine to<br />
disappear/ s<br />
1 20 20 0 15<br />
2 12 20 8 25<br />
3 20 10 10 15<br />
4 40 20 20 t 4<br />
Discuss (i) to (iii) with reference to experiments 1 to 3.<br />
14
(i) Explain why varying volumes of tetrachloromethane were used.<br />
To keep the total volume constant so that the concentration of ethene or bromine used is<br />
directly proportional to the volume used.<br />
(ii) State the relationship between the rate of reaction and<br />
• time taken for the colour of bromine to disappear<br />
• volume of bromine used<br />
Rate of reaction is inversely proportional to the time taken for the colour of bromine to<br />
disappear and directly proportional to the volume of bromine used.<br />
V Br 2<br />
Rate ∝<br />
time<br />
when total volume of solution is kept constant<br />
(iii) Deduce the order of reaction with respect to ethene and show that the order of reaction with<br />
respect to bromine is 1.<br />
V Br 2<br />
Rate ∝<br />
time<br />
Experiment<br />
Volume of<br />
ethene<br />
solution/ cm 3<br />
Volume of<br />
bromine solution/<br />
cm 3<br />
Volume of<br />
tetrachloromethane/<br />
cm 3<br />
Time taken for<br />
colour of<br />
bromine to<br />
disappear/ s<br />
1 20 20 0 15<br />
2 12 20 8 25<br />
3 20 10 10 15<br />
Rate of<br />
reaction<br />
20<br />
15 = 1.33<br />
20<br />
25 = 0.8<br />
10<br />
15 = 0.667<br />
Comparing experiments 1 and 2,<br />
When [ethene] used is decreased by 0.6 times, keeping [Br 2 ] constant, rate also<br />
decrease by 0.6 times.<br />
Hence, order with respect to ethane = 1<br />
Comparing experiment 1 and 3,<br />
When [Br 2 ] used is doubled, keeping [ethene] constant, rate is also doubled.<br />
Hence, order with respect to bromine = 1<br />
(iv) Suggest a value for t 4 , time taken for the colour of bromine to disappear in experiment 4.<br />
15
Experiment<br />
Volume of<br />
ethene solution/<br />
cm 3<br />
Volume of<br />
Volume of bromine<br />
solution/ cm 3 tetrachloromethane/<br />
cm 3<br />
Time taken for<br />
colour of<br />
bromine to<br />
disappear/ s<br />
4 40 20 20 t 4<br />
The total volume of solution in Experiment 4 is 80 cm 3 which is double that of other<br />
experiments. Halved all the volumes in experiment 4 will result in same volumes as that of<br />
experiment 3.<br />
Volume of<br />
Volume of<br />
Volume of bromine<br />
Experiment ethene solution/<br />
cm 3<br />
solution/ cm 3 tetrachloromethane/<br />
cm 3<br />
3 40÷2 = 20 20÷2 = 10 20÷2 = 10<br />
Hence the concentration of ethene and bromine are the same for Experiment 3 and 4. The<br />
rate of reaction is the same. Hence the time taken for colour of bromine to disappear is the<br />
same. Therefore, t 4 = 15 s.<br />
Method 4 : Titrimetric (Quenching) Method<br />
For the reaction between propanone and iodine:<br />
CH 3 COCH 3 (aq) + I 2 (aq)<br />
H +<br />
CH 3 COCH 2 I (aq) + HI (aq)<br />
The rate equation would be<br />
Rate = k [CH 3<br />
COCH 3<br />
] m [I 2<br />
] n +<br />
[ H ] p<br />
where m, n and p are the orders of the reaction with respect to propanone, iodine and acid<br />
respectively.<br />
The rate of reaction may be studied by determining the amount of unreacted iodine in the reaction<br />
mixture at different times.<br />
Dilute sulfuric acid is used as the catalyst. Sodium hydrogencarbonate solution is used to quench<br />
(stop) the reaction instantly by neutralizing the acid.<br />
The unreacted iodine was then titrated with the diluted sodium thiosulfate (VI) using starch as<br />
indicator.<br />
2S 2 O 3 2– (aq) + I 2 (aq)<br />
S 4 O 6 2– (aq) + 2I – (aq)<br />
16
Experimental Procedure:<br />
(1) Preparation of reaction mixture (2) Withdrawal of samples for analysis<br />
Reactants of known volumes<br />
and concentrations<br />
Stop-watch<br />
started at the<br />
point of mixing<br />
At regular time<br />
intervals (eg, 5 min),<br />
samples (eg, 10.0 cm 3 )<br />
are withdrawn from the<br />
reaction mixture using<br />
a pipette<br />
The reaction vessel should be kept in a<br />
constant-temperature water bath<br />
(3) Quenching of reaction in sample (4) Analysis of sample<br />
Addition of ‘quenching’ reagent (NaHCO 3 )<br />
to remove acid<br />
catalyst<br />
Titration with a standard solution to<br />
determine the concentrations of I 2 at different<br />
time.<br />
Standard thiosulfate solution<br />
with known concentration<br />
Withdrawn sample is placed in conical flask.<br />
The exact time at which the reaction is<br />
“Quenched” sample<br />
quenched is noted.<br />
IV EFFECT OF TEMPERATURE ON REACTION RATE<br />
Aim of expt: To determine a value for the activation energy of a reaction.<br />
Background of reaction:<br />
Peroxodisulfate ions, S 2 O 2- 8 , oxidises I - ions as follows:<br />
S 2 O 2- 8 (aq) + 2I - (aq) I 2 (aq) + 2SO 2- 4 (aq) ……… Reaction 1<br />
The reaction is first order with respect to both the concentration of peroxodisulfate ions and the<br />
concentration of iodide ions.<br />
17
The iodine produced in Reaction 1 reacts immediately with thiosulfate ions, S 2 O 3 2- as shown below.<br />
Thus, the concentration of iodine is kept very low.<br />
2S 2 O 3 2- (aq) + I 2 (aq) 2I - (aq) + S 4 O 6 2- (aq) …………. Reaction 2<br />
Once all the thiosulfate ions have reacted, the concentration of iodine rapidly increases and due to<br />
the presence of starch in the reaction mixture, the dark blue colouration of an iodine-starch<br />
complex is formed.<br />
The amount of iodine required to react with the thiosulfate ions can be deduced from the fixed<br />
volume of S 2 O 2- 3 used in each experiment. By measuring the time it takes for this fixed amount of<br />
iodine to be produced, it is possible to determine values for the rate of Reaction 1 at different<br />
temperatures.<br />
Method:<br />
Six experiments are conducted at different temperatures. For all the experiments, the<br />
concentrations of I - , S 2 O 2- 3 and S 2 O 2- 8 are kept constant. In each experiment, the time taken, t, for<br />
the dark blue colour to appear is measured.<br />
Procedure:<br />
For each experiment, solution 1 is prepared as follows.<br />
To a dry 100 cm 3 beaker, add 20 cm 3 I - , 10 cm 3 S 2 O 3 2- and 5 cm 3 starch.<br />
(i) Experiment 1<br />
1. Pour 20 cm 3 2-<br />
of S 2 O 8 solution rapidly, in a steady stream into the beaker containing<br />
solution 1. Start the stopwatch when about half the S 2 O 2- 8 solution has been added.<br />
2. Sir the mixture using the thermometer.<br />
3. Note the initial temperature, T i , of the reaction mixture.<br />
4. Stop the stopwatch when the dark blue colour first appears.<br />
5. Note the final temperature, T f , of the reaction mixture.<br />
6. Note the time elapsed on the stopwatch, t, to the nearest second.<br />
(ii) Experiment 2<br />
1. Prepare solution 1 as described above.<br />
2. ** Half-fill a 250 cm 3 beaker with ice/salt water to make a cooling bath.<br />
3. Place the 100 cm 3 beaker containing solution 1, into the cooling bath and carefully stir<br />
solution 1 until its temperature is between 5 o C and 10 o C.<br />
4. Remove the beaker from the cooling bath and, using the method described in Experiment<br />
1, determine the time taken, t, for the solution to turn dark blue.<br />
18
Experiment 2 gives the slowest experiment.<br />
(iii) Experiment 3<br />
1. Prepare solution 1 as described above.<br />
2. ** Half-fill a 250 cm 3 beaker with hot water to make a heating bath.<br />
3. Place the 100 cm 3 beaker containing solution 1, into the heating bath and carefully stir<br />
solution 1 until its temperature is between 50 o C and 60 o C.<br />
4. Remove the beaker from the heating bath and, using the method described in Experiment<br />
1, determine the time taken, t, for the solution to turn dark blue.<br />
Experiment 3 gives the fastest experiment.<br />
(iv) Experiments 4 to 6<br />
Select three other suitable reaction temperatures, between the temperatures of Experiments<br />
2 and 3, for use in three additional experiments. In each case, use the heating bath or the<br />
cooling bath to bring solution 1 to an appropriate temperature and perform these<br />
experiments.<br />
Analysis of result:<br />
Sample results:<br />
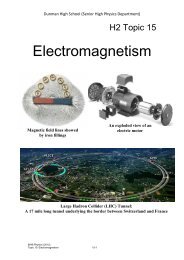
Temp, T/K 280 303 309 312 318 324<br />
Time, t/s 270 204 138 115 75 55<br />
ln (1/t) -5.60 -5.32 -4.93 -4.75 -4.32 -4.01<br />
1/T / K -1 3.57 x 10 -3 3.30 x 10 -3 3.24 x 10 -3 3.21 x 10 -3 3.14 x 10 -3 3.09 x 10 -3<br />
Graphical determination of activation energy<br />
The value for activation energy, E a , can be determined by performing a series of experiments,<br />
where the reaction mixture is kept constant, but different reaction temperatures are used, and the<br />
same end-point (appearance of the dark blue colour) is times. The activation energy for the<br />
reaction can be obtained using the Arrhenius Equation.<br />
k = <br />
By plotting a graph of ln (1/t) against 1/T, a straight line of best-fit will be obtained. The gradient of<br />
the line is –E a /R, where R is the ideal gas constant.<br />
19
ln (1/t)<br />
1/T<br />
x<br />
x<br />
x<br />
x<br />
x<br />
x<br />
Suppose the magnitude of the slope is -6.36 x 10 3 K.<br />
Thus, -E a /R = -6.36 x 10 3 K<br />
Hence, -E a = -6.36 x 10 3 K x 8.81 J K -1 mol -1<br />
E a = 52.9 kJ mol -1<br />
20