d'ieteren auto
d'ieteren auto
d'ieteren auto

Create successful ePaper yourself
Turn your PDF publications into a flip-book with our unique Google optimized e-Paper software.
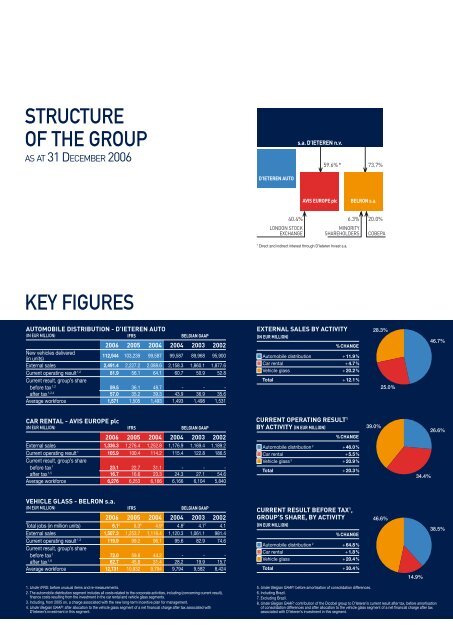
STRUCTURE<br />
OF THE GROUP<br />
AS AT 31 DECEMBER 2006<br />
s.a. D’IETEREN n.v.<br />
59.6% * 73.7%<br />
D’IETEREN AUTO<br />
AVIS EUROPE plc<br />
BELRON s.a.<br />
40.4%<br />
LONDON STOCK<br />
EXCHANGE<br />
6.3%<br />
MINORITY<br />
SHAREHOLDERS<br />
20.0%<br />
COBEPA<br />
* Direct and indirect interest through D’Ieteren Invest s.a.<br />
KEY FIGURES<br />
AUTOMOBILE DISTRIBUTION - D’IETEREN AUTO<br />
(IN EUR MILLION) IFRS BELGIAN GAAP<br />
2006 2005 2004 2004 2003 2002<br />
New vehicles delivered<br />
(in units)<br />
112,944 103,239 99,587 99,587 89,968 95,900<br />
External sales 2,491.4 2,227.2 2,088.6 2,158.3 1,860.1 1,877.6<br />
Current operating result 1,2 81.9 56.1 64.1 60.7 50.9 52.8<br />
Current result, group’s share<br />
before tax 1,2 59.5 36.1 48.7 - - -<br />
after tax 1,2,4 57.0 35.2 39.3 43.9 36.9 35.6<br />
Average workforce 1,571 1,505 1,493 1,493 1,498 1,531<br />
EXTERNAL SALES BY ACTIVITY<br />
(IN EUR MILLION)<br />
% CHANGE<br />
Automobile distribution + 11.9 %<br />
Car rental + 4.7 %<br />
Vehicle glass + 20.2 %<br />
Total + 12.1 %<br />
28.3%<br />
25.0%<br />
46.7%<br />
CAR RENTAL - AVIS EUROPE plc<br />
(IN EUR MILLION) IFRS BELGIAN GAAP<br />
2006 2005 2004 2004 2003 2002<br />
External sales 1,336.3 1,276.4 1,252.8 1,176.9 1,169.4 1,189.2<br />
Current operating result 1 105.9 100.4 114.2 115.4 122.8 186.5<br />
Current result, group’s share<br />
before tax 1 23.1 22.7 31.1 - - -<br />
after tax 1,5 16.7 16.6 23.3 24.3 27.1 54.6<br />
Average workforce 6,276 6,253 6,166 6,166 6,104 5,840<br />
CURRENT OPERATING RESULT 1<br />
BY ACTIVITY (IN EUR MILLION)<br />
% CHANGE<br />
Automobile distribution 2 + 46.0 %<br />
Car rental + 5.5 %<br />
Vehicle glass 3 + 20.9 %<br />
Total + 20.3 %<br />
39.0%<br />
34.4%<br />
26.6%<br />
VEHICLE GLASS - BELRON s.a.<br />
(IN EUR MILLION) IFRS BELGIAN GAAP<br />
2006 2005 2004 2004 2003 2002<br />
Total jobs (in million units) 6.1 6 5.3 6 4.9 6 4.8 7 4.7 7 4.1<br />
External sales 1,507.3 1,253.7 1,118.4 1,120.3 1,061.1 981.4<br />
Current operating result 1,3 119.9 99.2 96.1 95.6 82.9 74.6<br />
Current result, group’s share<br />
before tax 1 72.0 59.8 44.2 - - -<br />
after tax 1,8 62.7 45.8 31.4 28.2 19.9 15.7<br />
Average workforce 12,731 10,932 9,794 9,794 9,582 8,424<br />
CURRENT RESULT BEFORE TAX 1 ,<br />
GROUP’S SHARE, BY ACTIVITY<br />
(IN EUR MILLION)<br />
% CHANGE<br />
Automobile distribution 2 + 64.8 %<br />
Car rental + 1.8 %<br />
Vehicle glass + 20.4 %<br />
Total + 30.4 %<br />
46.6%<br />
14.9%<br />
38.5%<br />
1. Under IFRS: before unusual items and re-measurements.<br />
2. The <strong>auto</strong>mobile distribution segment includes all costs related to the corporate activities, including (concerning current result),<br />
finance costs resulting from the investment in the car rental and vehicle glass segments.<br />
3. Including, from 2005 on, a charge associated with the new long-term incentive plan for management.<br />
4. Under Belgian GAAP: after allocation to the vehicle glass segment of a net financial charge after tax associated with<br />
D’Ieteren’s investment in this segment.<br />
5. Under Belgian GAAP: before amortisation of consolidation differences.<br />
6. Including Brazil.<br />
7. Excluding Brazil.<br />
8. Under Belgian GAAP: contribution of the Dicobel group to D’Ieteren’s current result after tax, before amortisation<br />
of consolidation differences and after allocation to the vehicle glass segment of a net financial charge after tax<br />
associated with D’Ieteren’s investment in this segment.