d'ieteren auto
d'ieteren auto
d'ieteren auto

You also want an ePaper? Increase the reach of your titles
YUMPU automatically turns print PDFs into web optimized ePapers that Google loves.
Annual Report 2006<br />
Serving over 14 million customers
STRUCTURE<br />
OF THE GROUP<br />
AS AT 31 DECEMBER 2006<br />
s.a. D’IETEREN n.v.<br />
59.6% * 73.7%<br />
D’IETEREN AUTO<br />
AVIS EUROPE plc<br />
BELRON s.a.<br />
40.4%<br />
LONDON STOCK<br />
EXCHANGE<br />
6.3%<br />
MINORITY<br />
SHAREHOLDERS<br />
20.0%<br />
COBEPA<br />
* Direct and indirect interest through D’Ieteren Invest s.a.<br />
KEY FIGURES<br />
AUTOMOBILE DISTRIBUTION - D’IETEREN AUTO<br />
(IN EUR MILLION) IFRS BELGIAN GAAP<br />
2006 2005 2004 2004 2003 2002<br />
New vehicles delivered<br />
(in units)<br />
112,944 103,239 99,587 99,587 89,968 95,900<br />
External sales 2,491.4 2,227.2 2,088.6 2,158.3 1,860.1 1,877.6<br />
Current operating result 1,2 81.9 56.1 64.1 60.7 50.9 52.8<br />
Current result, group’s share<br />
before tax 1,2 59.5 36.1 48.7 - - -<br />
after tax 1,2,4 57.0 35.2 39.3 43.9 36.9 35.6<br />
Average workforce 1,571 1,505 1,493 1,493 1,498 1,531<br />
EXTERNAL SALES BY ACTIVITY<br />
(IN EUR MILLION)<br />
% CHANGE<br />
Automobile distribution + 11.9 %<br />
Car rental + 4.7 %<br />
Vehicle glass + 20.2 %<br />
Total + 12.1 %<br />
28.3%<br />
25.0%<br />
46.7%<br />
CAR RENTAL - AVIS EUROPE plc<br />
(IN EUR MILLION) IFRS BELGIAN GAAP<br />
2006 2005 2004 2004 2003 2002<br />
External sales 1,336.3 1,276.4 1,252.8 1,176.9 1,169.4 1,189.2<br />
Current operating result 1 105.9 100.4 114.2 115.4 122.8 186.5<br />
Current result, group’s share<br />
before tax 1 23.1 22.7 31.1 - - -<br />
after tax 1,5 16.7 16.6 23.3 24.3 27.1 54.6<br />
Average workforce 6,276 6,253 6,166 6,166 6,104 5,840<br />
CURRENT OPERATING RESULT 1<br />
BY ACTIVITY (IN EUR MILLION)<br />
% CHANGE<br />
Automobile distribution 2 + 46.0 %<br />
Car rental + 5.5 %<br />
Vehicle glass 3 + 20.9 %<br />
Total + 20.3 %<br />
39.0%<br />
34.4%<br />
26.6%<br />
VEHICLE GLASS - BELRON s.a.<br />
(IN EUR MILLION) IFRS BELGIAN GAAP<br />
2006 2005 2004 2004 2003 2002<br />
Total jobs (in million units) 6.1 6 5.3 6 4.9 6 4.8 7 4.7 7 4.1<br />
External sales 1,507.3 1,253.7 1,118.4 1,120.3 1,061.1 981.4<br />
Current operating result 1,3 119.9 99.2 96.1 95.6 82.9 74.6<br />
Current result, group’s share<br />
before tax 1 72.0 59.8 44.2 - - -<br />
after tax 1,8 62.7 45.8 31.4 28.2 19.9 15.7<br />
Average workforce 12,731 10,932 9,794 9,794 9,582 8,424<br />
CURRENT RESULT BEFORE TAX 1 ,<br />
GROUP’S SHARE, BY ACTIVITY<br />
(IN EUR MILLION)<br />
% CHANGE<br />
Automobile distribution 2 + 64.8 %<br />
Car rental + 1.8 %<br />
Vehicle glass + 20.4 %<br />
Total + 30.4 %<br />
46.6%<br />
14.9%<br />
38.5%<br />
1. Under IFRS: before unusual items and re-measurements.<br />
2. The <strong>auto</strong>mobile distribution segment includes all costs related to the corporate activities, including (concerning current result),<br />
finance costs resulting from the investment in the car rental and vehicle glass segments.<br />
3. Including, from 2005 on, a charge associated with the new long-term incentive plan for management.<br />
4. Under Belgian GAAP: after allocation to the vehicle glass segment of a net financial charge after tax associated with<br />
D’Ieteren’s investment in this segment.<br />
5. Under Belgian GAAP: before amortisation of consolidation differences.<br />
6. Including Brazil.<br />
7. Excluding Brazil.<br />
8. Under Belgian GAAP: contribution of the Dicobel group to D’Ieteren’s current result after tax, before amortisation<br />
of consolidation differences and after allocation to the vehicle glass segment of a net financial charge after tax<br />
associated with D’Ieteren’s investment in this segment.
IFRS, BELRON FULLY<br />
CONSOLIDATED<br />
BELGIAN GAAP, EQUITY<br />
METHOD FOR BELRON<br />
CONSOLIDATED RESULTS (IN EUR MILLION) 2006 2005 5 2004 2004 2003 2002<br />
Sales 5,335.0 4,757.3 4,459.8 3,335.2 3,029.5 3,066.8<br />
Current operating result 1 307.7 255.7 274.4 176.1 173.7 239.3<br />
Current result, group’s share<br />
before tax 1 154.6 118.6 124.0 - - -<br />
after tax 1,2 136.4 97.6 94.0 96.4 83.9 105.9<br />
Group’s share in the result for the period 3 100.0 76.2 43.2 45.6 5.1 72.1<br />
FINANCIAL STRUCTURE (IN EUR MILLION)<br />
Equity of which: 1,023.8 945.5 990.8 1,064.2 1,060.2 1,121.3<br />
- Capital and reserves attributable to equity holders 791.8 709.9 687.1 789.7 762.1 772.3<br />
- Minority interest 232.0 235.6 303.7 274.5 298.1 349.0<br />
Net debt 1,868.9 1,893.1 1,748.1 1,472.8 1,548.5 1,574.6<br />
DATA PER SHARE (IN EUR)<br />
Current result after tax 1,2,4 , group’s share 24.7 17.7 17.0 17.2 15.0 18.9<br />
Group’s share in the result for the period 3,4 18.1 13.8 7.8 8.1 0.9 18.3<br />
Gross dividend per ordinary share 2.6400 2,4000 2.3100 2.3100 2.3100 2.3100<br />
Net dividend per ordinary share 1.9800 1,8000 1.7325 1.7325 1.7325 1.7325<br />
Net dividend per ordinary share + strip VVPR 2.2440 2,0400 1.9635 1.9635 1.9635 1.9635<br />
Capital and reserves attributable to equity holders 4 145.1 130.1 125.8 141.2 136.3 138.1<br />
Highest share price 272.5 239.9 189.1 189.1 179.9 229.3<br />
Lowest share price 218.5 138.5 135.1 135.1 101.0 110.0<br />
Share price as at 31/12 269.7 232.5 136.5 136.5 162.6 129.0<br />
Average share price 250.9 185.3 161.5 161.5 133.9 171.4<br />
Average daily volume (in number of shares) 6,207 4,920 4,723 4,723 10,459 4,370<br />
Market capitalisation as at 31/12 (in EUR million) 1,491.5 1,285.8 754.9 754.9 899.2 713.4<br />
Total number of shares issued 5,530,262 5,530,262 5,530,260 5,530,260 5,530,260 5,530,241<br />
AVERAGE WORKFORCE (AVERAGE FULL TIME EQUIVALENTS) 20,578 18,690 17,453 7,659 7,602 7,371<br />
1. Under IFRS: before unusual items and re-measurements.<br />
2. Under Belgian GAAP: before amortisation of consolidation differences.<br />
3. Result attributable to equity holders of D’Ieteren, as defined by IAS 1.<br />
4. Under IFRS: calculated in accordance with IAS 33. Under Belgian GAAP: calculated on the basis of the number of shares in circulation at the end of the<br />
period (adjusted to take into account the 500,000 participating shares each granting a right to 1/8 of the ordinary dividend).<br />
5. As restated following application of IAS 21 revised (for further details, see note 2 of this report).
1 GROUP PRESENTATION<br />
10 MESSAGE TO SHAREHOLDERS<br />
12 KEY EVENTS<br />
14 CORPORATE GOVERNANCE<br />
16 CORPORATE CITIZENSHIP<br />
18 AUTOMOBILE DISTRIBUTION –<br />
D’IETEREN AUTO<br />
32 SHORT-TERM CAR RENTAL –<br />
AVIS EUROPE plc<br />
38 VEHICLE GLASS REPAIR<br />
AND REPLACEMENT –<br />
BELRON s.a.<br />
45 ANNUAL ACCOUNTS<br />
99 MAJOR RISK FACTORS<br />
100 SHARE INFORMATION
D’Ieteren is an international group, active in three sectors of services to the motorist.<br />
AUTOMOBILE DISTRIBUTION<br />
SHORT-TERM CAR RENTAL<br />
VEHICLE GLASS REPAIR<br />
AND REPLACEMENT<br />
> in Belgium of Volkswagen, Audi, Seat, Skoda,<br />
Bentley, Lamborghini, Bugatti, Porsche and<br />
Yamaha.<br />
> in Europe, Africa, the Middle East and Asia<br />
through Avis Europe plc and the Avis and Budget<br />
brands.<br />
> in Europe, North and South America, Australia<br />
and New Zealand through Belron s.a. and notably<br />
its CARGLASS ® and AUTOGLASS ® brands in<br />
Europe, and SAFELITE ® , LEBEAU ® , DURO ® in<br />
North America.<br />
THE GROUP’S STRATEGY is to be the best “parent” for each activity and to act as an active<br />
majority shareholder. Although the Group’s mode of interaction is specifi c to each activity, the<br />
Group always attempts to contribute its extensive knowledge of the <strong>auto</strong>mobile sector, its ability<br />
for anticipation and adaptability, its long-term vision, its entrepreneurial spirit and its will to invest<br />
wisely.<br />
D’IETEREN - ANNUAL REPORT 2006 1
VEHICLE GLASS REPAIR AND REPLACEMENT<br />
CAR RENTAL & VEHICLE GLASS REPAIR AND REPLACEMENT<br />
CAR RENTAL<br />
AUTOMOBILE DISTRIBUTION, CAR RENTAL<br />
& VEHICLE GLASS REPAIR AND REPLACEMENT
AN ATTRACTIVE GROWTH POTENTIAL<br />
D’Ieteren’s activities are – or are capable of becoming – leaders in the markets they serve.<br />
With very different geographic footprints, they offer together an attractive growth potential,<br />
both organic and acquired.<br />
D’IETEREN AUTO<br />
> A LEADER IN AUTOMOBILE<br />
DISTRIBUTION IN BELGIUM<br />
> MORE THAN 300 INDEPENDENT<br />
DEALERS<br />
> AROUND 1,600 STAFF<br />
AVIS EUROPE plc<br />
> A EUROPEAN LEADER IN SHORT-TERM<br />
CAR RENTAL<br />
> OVER 3,600 LOCATIONS<br />
> AROUND 6,300 STAFF<br />
BELRON s.a.*<br />
> THE WORLD N°1 IN VEHICLE GLASS<br />
REPAIR AND REPLACEMENT<br />
> 29 COUNTRIES, 1,500 BRANCHES,<br />
6,500 SERVICE VEHICLES<br />
> AROUND 18,500 STAFF<br />
* Including Safelite Group, Inc. – see p. 43 of this report.<br />
D’IETEREN - ANNUAL REPORT 2006 3
A PORTFOLIO OF WELL-KNOWN BRANDS<br />
More than 20 globally and locally well-known brands, enabling D’Ieteren and its activities to<br />
cover all segments of the markets they serve.<br />
AUTOMOBILE DISTRIBUTION<br />
SHORT-TERM CAR RENTAL<br />
VEHICLE GLASS REPAIR AND REPLACEMENT<br />
D’IETEREN - ANNUAL REPORT 2006 5
THE HIGHEST STANDARDS OF CUSTOMER SERVICE<br />
In its three activities, the D’Ieteren Group intends to permanently improve global customer<br />
satisfaction, developing strong and innovative commercial proposals. D’Ieteren and its<br />
activities have been several times pioneers, many of the innovations being today standards<br />
in their industry.<br />
D’Ieteren Auto - More than 33,000 customers signed a<br />
WECARE contract for the full coverage of all repair and<br />
maintenance operations on their vehicle.<br />
Avis Europe - Avis Europe customers benefit from the<br />
new rapid car return service that reduces return times<br />
to just 60 seconds.<br />
Belron - Belron offers its customers some 6,500 service<br />
vehicles so that the job can be carried out at the most<br />
convenient location.<br />
D’IETEREN - ANNUAL REPORT 2006 7
A GROUP SERVING<br />
OVER 14 MILLION CUSTOMERS<br />
PERMANENT RESEARCH FOR OPERATIONAL EXCELLENCE<br />
The strength of D’Ieteren and its activities also rests on decentralised organisations that are<br />
fl exible and close to the customer, sharing best practices in terms of, for example, logistics,<br />
brand management, distribution networks or performance management. Result: high service<br />
quality for the customer and guaranteed profi table growth for the shareholder.<br />
D’Ieteren Auto - In order to secure the network’s technicians know-how<br />
against the growing technical complexity of vehicles, D’Ieteren Auto provides<br />
almost 8,000 training days per year in its Technical Training Center.<br />
Avis Europe - Avis Europe continually invests in on-line booking tools in order<br />
to increase the number of reservations at a lower cost.<br />
Belron - The “Best of Belron” is a bi-annual competition to elect the best<br />
technician from across the Belron group. This event tests them on the safety,<br />
quality and service elements of the job. What better demonstration of Belron’s<br />
determination to develop the best technicians in the industry.<br />
D’IETEREN - ANNUAL REPORT 2006 9
MESSAGE TO SHAREHOLDERS<br />
Our Group had an excellent year 2006. We feel very proud of<br />
the strong growth of sales and profi ts our teams at D’Ieteren Auto<br />
and Belron delivered and feel encouraged by the progress the<br />
Avis Europe team made in implementing the recovery strategy.<br />
Our consolidated current result before tax, group’s share, grew by<br />
30.4% to EUR 154.6 million and the group’s share in the result for<br />
the period reached EUR 100.0 million, up 31.2% on 2005.<br />
In <strong>auto</strong>mobile distribution, D’Ieteren Auto took full advantage<br />
of a record new car market in Belgium, with a range of<br />
models well suited to consumer demand. The strong growth of<br />
D’Ieteren Auto sales resulted in a strongly improved operating<br />
margin. In a continuing competitive marketplace, D’Ieteren Auto<br />
made the difference thanks to its high quality networks<br />
specialised by make and through various initiatives aiming at<br />
reinforcing and extending its sales and after-sales services. For<br />
2007, D’Ieteren Auto will aim at 20% market share in a less<br />
buoyant market than 2006, and will rely on the anticipated<br />
success of its new models and on actions aiming at enhancing<br />
customer loyalty for its makes.<br />
In vehicle glass, Belron delivered another strong performance<br />
in 2006. Many business units beat their objectives, particularly in<br />
Europe and Canada, and acquired growth was strong notably as<br />
a result of the 2005/2006 acquisitions in North America.<br />
Operational and commercial effi ciency further improved notably<br />
due to the multinational rollout of best practices. All these<br />
factors allowed Belron to achieve a very strong growth of its<br />
current operating result. Moreover, the group implemented an<br />
integration and transformation programme of the acquisitions in<br />
North America aimed at improving their operating margin.<br />
This programme represents the greater part of unusual costs<br />
before tax of EUR 19.6 million, incurred in line with expectations.<br />
In 2007, organic sales growth is expected to continue, although<br />
at a slightly lower rate, due to strong 2006 comparatives.<br />
In March 2007, Belron took an important new step in its<br />
geographic expansion by completing the acquisition of Safelite,<br />
the US leader in the sector. This transaction allows Belron to<br />
achieve national geographic coverage with an established business<br />
that has already developed excellent long-term relationships<br />
with insurance and fl eet customers. This acquisition, fully fi nanced<br />
by Belron, should be current earnings accretive for Belron and<br />
D’Ieteren as of the fi rst year of consolidation.<br />
In car rental, Avis Europe results were encouraging due to<br />
good volume growth and early benefi ts from the recovery<br />
strategy. However, market conditions remained diffi cult in terms of<br />
pricing and fl eet costs. In this context, Avis Europe carried out a<br />
signifi cant organisational re-structuring and re-design of key<br />
processes to reduce costs. Savings in connection with this<br />
programme amounted to EUR 11 million in 2006 and are<br />
expected to reach EUR 25 million in 2007. Unusual re-structuring<br />
costs of EUR 26 million were lower than expected. The outlook<br />
for continued progress in 2007 remains unchanged.<br />
Based on the current outlook for our three activities and<br />
including the acquisition of Safelite by Belron, we expect our<br />
current consolidated result before tax, group’s share, to grow by<br />
5 to 10% in 2007.<br />
10 D’IETEREN - ANNUAL REPORT 2006
Our management teams, frontliners and support personnel,<br />
at D’Ieteren Auto, Belron and Avis Europe relentlessly pursue their<br />
innovation efforts aimed at serving our customers better and<br />
more effi ciently. Our confi dence in the future rests on everyone’s<br />
energy, entrepreneurial spirit and care for each customer. We<br />
would like to heartily thank all our staff and leadership teams for<br />
their outstanding dedication and contribution.<br />
Our customers, our partners and our shareholders have<br />
continued to demonstrate their unfailing support. We would also<br />
like to thank them very sincerely.<br />
We dedicate this Annual Report to our colleague and friend<br />
Alain Voet, D’Ieteren Auto Parts & Service Manager, who<br />
died in January 2007. His unfl agging commitment for<br />
almost 40 years will remain a source of inspiration for all<br />
of us.<br />
Jean-Pierre Bizet<br />
Managing Director<br />
Roland D’Ieteren<br />
Chairman<br />
MESSAGE TO SHAREHOLDERS 11
01/2006<br />
Very successful exhibition at the Brussels<br />
Motor Show with more than 720,000 visitors.<br />
This will have a very positive impact on<br />
new car sales.<br />
02<br />
As part of its recovery strategy,<br />
Avis Europe launches<br />
an important cost reduction<br />
programme, including the<br />
acceleration of the transfer of back-offi ce<br />
activities into its shared service centre in<br />
Budapest and consolidation of all call centre<br />
activities in Barcelona.<br />
KEY EVENTS<br />
03<br />
Belron expands<br />
in the United States<br />
with the acquisition of<br />
MAVERICK AUTO GLASS<br />
in Phoenix, Arizona.<br />
Audi enters the 4WD segment launching the<br />
luxury Q7.<br />
04<br />
D’Ieteren Lease fi nalises<br />
the securitisation of its<br />
fl eet and lease contracts<br />
raising an initial amount<br />
of EUR 230 million. This long-term vehicle<br />
rental subsidiary of D’Ieteren, celebrating<br />
its thirtieth anniversary, now has access to<br />
<strong>auto</strong>nomous and fl exible fi nancing.<br />
05<br />
Avis Europe launches<br />
several initiatives in order<br />
to live up with customer<br />
expectations: a clearer<br />
rental agreement, simplifi ed vehicle<br />
choice, rapid car return service, etc.<br />
Belron starts an important integration<br />
and transformation programme in North<br />
America aimed at improving operating<br />
margins of its 2005/2006 acquisitions.<br />
Introduction of the new commercial<br />
vehicle VW Crafter.<br />
12 D’IETEREN - ANNUAL REPORT 2006
06<br />
Belron benefi ts from the<br />
successful multinational<br />
rollout of best practice<br />
advertising concepts.<br />
Volkswagen enters the convertible segment<br />
with its Eos.<br />
07<br />
Avis Europe issues sevenyear<br />
senior fl oating notes<br />
of EUR 250 million. This<br />
bond issue will fi nance the<br />
company’s general needs.<br />
Introduction of the new Audi Allroad.<br />
08<br />
Belron acquired its franchisee<br />
in Greece.<br />
09<br />
Belron signs a franchise<br />
agreement in Romania<br />
bringing its franchise<br />
network to 9 partners.<br />
Belron organises its “Best of Belron”<br />
bi-annual competition to elect the best<br />
technician in the Belron group. This<br />
event tests them on the safety, quality<br />
and service elements of the job and<br />
illustrates the group’s commitment to<br />
develop the best technicians in the industry.<br />
Skoda introduces the Roomster and enters<br />
the growth segment of small people carriers.<br />
Introduction of the new Audi TT Coupé.<br />
11<br />
Introduction of the new<br />
Porsche 911 Targa.<br />
Volkswagen AG announces<br />
its intention to restructure its manufacturing<br />
facility in Forest, Belgium; D’Ieteren<br />
expresses its support for employees<br />
impacted by this restructuring and,<br />
conscious of the existing needs in the<br />
distribution and after-sales service activity,<br />
sets up a scholarship for the retraining of<br />
a certain number of workers from the VW<br />
factory in Forest.<br />
12<br />
Seat extends its vehicles<br />
range introducing the new<br />
Altea XL estate version.<br />
During the year Belron strengthens its<br />
presence through additional acquisitions<br />
in Spain, UK, Germany, Sweden, Norway<br />
and Italy which have all been successfully<br />
integrated into the existing businesses.<br />
03/2007<br />
Belron acquires Safelite Group, Inc., the<br />
leader in the US vehicle glass repair and<br />
replacement market, for an enterprise value<br />
of USD 334 million (EUR 258 million).<br />
KEY EVENTS 13
CORPORATE GOVERNANCE<br />
The Company adheres to the corporate governance principles set out in the Belgian Code of corporate governance<br />
and publishes as of 1 January 2006 its Corporate Governance Charter on its website. The implementation of these<br />
principles takes into consideration the unique structure of the Company’s share capital, with family shareholders<br />
owning the majority and having ensured the continuity of the Company since 1805. Exceptions to the principles are<br />
set out in Section 5 of the Charter published on the Company’s website.<br />
BOARD OF DIRECTORS<br />
Composition<br />
The Board of Directors consists of:<br />
six non-executive Directors, appointed on the proposal of the<br />
family shareholders;<br />
one non-executive independent Director, appointed on the proposal<br />
of Cobepa;<br />
three non-executive Directors, two of whom are independent,<br />
proposed on the basis of their experience;<br />
the Managing Director (CEO).<br />
The Chairman and the Deputy Chairman of the Board are selected<br />
among the Directors appointed on the proposal of the family<br />
shareholders.<br />
Roles and activities<br />
Without prejudice to its legal and statutory attributions and those<br />
of the General Meeting, the roles of the Board are to:<br />
determine the strategy and values of the Company and approve<br />
its plans and budgets;<br />
decide on major fi nancial operations, acquisitions and divestments<br />
of an amount above EUR 2,500,000, operations of a lower<br />
amount being the executive management’s responsibility;<br />
ensure that appropriate organisation structures, processes and<br />
controls are in place in order to achieve the Company’s objectives<br />
and properly manage its risks;<br />
appoint the Directors proposed by the Company for the boards<br />
of its main subsidiaries;<br />
appoint and revoke the CEO and CFO of s.a. D’Ieteren n.v. as<br />
well as the CEO and CFO of D’Ieteren Auto and decide on their<br />
remuneration;<br />
monitor and review performance of executive management;<br />
maintain effective communication with the Company’s shareholders<br />
and other stakeholders.<br />
The Board of Directors meets at least six times a year. Additional<br />
meetings are held when business needs require. Decisions of the<br />
Board of Directors are taken by a majority of votes, the Chairman<br />
having a casting vote in case of a tie.<br />
In 2006, the Board met six times, once in the presence of the<br />
Statutory Auditor, who reported on the external audit activities.<br />
Directors’ participation to Board meetings was 95.5%.<br />
Committees of the Board of Directors<br />
At the beginning of 2005, the Board set up two Board<br />
Committees:<br />
the Audit Committee met three times in 2006, twice of which in<br />
the presence of the Statutory Auditor, and reported on its activities<br />
to the Board of Directors;<br />
the Nominations and Remuneration Committee met three<br />
times in 2006 and reported on its activities to the Board of<br />
Directors.<br />
Consultation committee<br />
The Chairman and the Deputy Chairman meet monthly with the<br />
Managing Director, as the Consultation Committee, to keep in<br />
close relation with each other, monitor the Company’s performance,<br />
review progress on major projects and prepare the Board<br />
of Directors’ meetings.<br />
Remuneration of non-executive Directors<br />
The Company discloses Board members’ remuneration globally.<br />
The Board believes that shareholders and investors are adequately<br />
informed by being communicated the total cost of the Board, as a<br />
collegial governing body, without details by individual Director.<br />
For the year ended 31 December 2006, a total fi xed amount of<br />
EUR 1,667,950 was paid to the non-executive Directors by the<br />
Company and its subsidiaries. No other benefi t or remuneration<br />
has been paid, and no loans or guarantees have been extended<br />
by D’Ieteren to members of the Board.<br />
GROUP EXECUTIVE MANAGEMENT<br />
The Managing Director of s.a. D’Ieteren n.v. is responsible for the<br />
Group executive management. He is assisted by the Corporate<br />
management team, in charge, at Group level, of fi nance, fi nancial<br />
communication, investor relations, accounts consolidation, legal<br />
and tax matters and management control.<br />
The Chief Financial Offi cer, the Chief Legal Offi cer and the Group<br />
Treasurer constitute the Senior Management at Group level.<br />
For the year ended 31 December 2006, the aggregate amount<br />
of remuneration of all nature (including employer premiums on<br />
corporate pension plans amounting to EUR 55,612) attributed by<br />
D’Ieteren and its subsidiaries to the Managing Director of the Group<br />
was EUR 1,401,641, the variable part of which represents around<br />
40%. Four hundred D’Ieteren stock options were granted to the<br />
Managing Director. No loans or guarantees have been extended<br />
to him by D’Ieteren.<br />
14 D’IETEREN - ANNUAL REPORT 2006
BOARD OF DIRECTORS AS AT 31 DECEMBER 2006 AGE END OF TERM<br />
Roland D’Ieteren 1,2 Chairman of the Board; Director, Avis Europe plc, Belron s.a. 64 May 2007<br />
Maurice Périer 1,2 Deputy Chairman of the Board; Director of companies 68 May 2008<br />
Jean-Pierre Bizet Managing Director; Director, Avis Europe plc, Belron s.a. 58 May 2008<br />
Nicolas D’Ieteren 1,2 Managing Partner, Enero sprl; Business Analysis Manager, Total s.a. 31 May 2008<br />
Pascal Minne 3 Managing Director, Petercam 56 May 2007<br />
Olivier Périer 1,2 Architect; Founding Partner, Urban Platform s.c.r.l. 35 May 2008<br />
Alain Philippson 3 Director, Banque Degroof, C.F.E. 67 May 2009<br />
Gilbert van Marcke de Lummen 4<br />
Director of companies; Director, Avis Europe plc,<br />
Belron s.a., Cofinimmo s.a. 69 May 2008<br />
Christian Varin 3 Managing Director, Cobepa; Director, Sapec 59 May 2007<br />
s.a. de Participations et de Gestion 1 Permanent representative: Patrick Peltzer 66 May 2007<br />
Nayarit Participations s.c.a. 1 Permanent representative: Etienne Heilporn 67 May 2007<br />
COMPOSITION OF THE COMMITTEES<br />
(AS AT 31 DECEMBER 2006) NOMINATIONS AND REMUNERATION COMMITTEE AUDIT COMMITTEE<br />
Chairman Roland D’Ieteren Gilbert van Marcke de Lummen<br />
Members Pascal Minne Pascal Minne<br />
Alain Philippson<br />
Christian Varin<br />
AUDITOR<br />
END OF TERM<br />
Sc DELVAUX, FRONVILLE, SERVAIS ET ASSOCIÉS, represented by Gérard Delvaux and Jean-Louis Servais May 2008<br />
1. Director appointed on the proposal of the family shareholders.<br />
2. Director descendant of, or related to, the founding family.<br />
3. Independent Director.<br />
4. Former Executive.<br />
For the year ended 31 December 2006, the aggregate amount of<br />
compensation of all nature (including employer premiums on corporate<br />
pension plans amounting to EUR 109,283) attributed by<br />
D’Ieteren and its subsidiaries to the three members of the Senior<br />
Management at Group level was EUR 970,865, the variable part of<br />
which represents around 30%. An aggregate number of one thousand<br />
two hundred D’Ieteren stock options was granted to them.<br />
No loans or guarantees have been extended to them by D’Ieteren.<br />
EXECUTIVE MANAGEMENT OF THE THREE SECTORS<br />
The activities of the D’Ieteren Group are organised in three<br />
sectors.<br />
The Automobile Distribution sector is managed by the CEO<br />
D’Ieteren Auto, reporting to the Group Managing Director. The<br />
CEO D’Ieteren Auto chairs the management committee of<br />
D’Ieteren Auto, comprising six other members with responsibilities<br />
for D’Ieteren Car Centers, Finance, Group Service, Human<br />
Resources, Makes and Marketing.<br />
The Car Rental sector comprises Avis Europe plc and its subsidiaries.<br />
At 31 December 2006, Avis Europe plc is governed<br />
by a board of directors of 12 members: three are appointed on the<br />
proposal of s.a. D’Ieteren n.v., three are independent directors, four<br />
are full time executive directors. The current non-executive chairman<br />
of the board is a former Avis CEO. D’Ieteren’s Managing<br />
Director is executive deputy chairman of the board. The board<br />
of directors of Avis Europe plc has three board committees: the audit<br />
committee, comprising three independent directors, the nominations<br />
committee and the remuneration committee, each comprising<br />
one of the directors proposed by s.a. D’Ieteren n.v. Listed on<br />
the London Stock Exchange, Avis Europe plc is in compliance with<br />
the provisions of the Combined Code, with a few exceptions fully<br />
disclosed in its annual report. The rights and obligations of the<br />
directors appointed by s.a. D’Ieteren n.v., and of s.a. D’Ieteren n.v.<br />
as a shareholder, are set out in the Relationship Agreement entered<br />
into at fl otation in 1997.<br />
The Vehicle Glass sector comprises Belron s.a., in which<br />
D’Ieteren and Cobepa own, at 31 December 2006, respectively<br />
73.7% and 20.0% shareholding, and its subsidiaries. At<br />
31 December 2006, Belron s.a. is governed by a board of directors<br />
consisting of 11 members, six of which are appointed on<br />
proposal of D’Ieteren and Cobepa, one is appointed on proposal<br />
of the founder shareholders, two are executive directors and two<br />
are independent directors. The Managing Director of D’Ieteren is,<br />
ex offi cio, member of the board. The board of directors of Belron<br />
s.a. has two board committees: the audit committee and the<br />
remuneration committee, each chaired by a director appointed on<br />
proposal of D’Ieteren.<br />
DIVIDEND POLICY<br />
The Board of Directors intends to maintain its ongoing policy of<br />
providing the largest possible self-fi nancing for the development<br />
of the Group, while ensuring regular dividend growth, results permitting.<br />
AUDITOR’S FEES<br />
The fees charged in 2006 by the Statutory Auditor and linked<br />
companies for the work carried out on behalf of Group companies<br />
in connection with the compulsory control of the statutory<br />
and consolidated fi nancial statements amounted to EUR 201,957<br />
(excl. VAT). Further fees of EUR 62,653 (excl. VAT) were charged<br />
for non-audit missions of which EUR 52,820 for other specifi c<br />
assignments and EUR 9,833 (excl. VAT) were charged for fi scal<br />
advice.<br />
CORPORATE GOVERNANCE 15
D’IETEREN AUTO<br />
The vehicles sold by D’Ieteren Auto are<br />
increasingly environmentally friendly: fuel consumption<br />
is more effi cient and consequently<br />
CO 2<br />
emissions have been considerably<br />
reduced notably thanks to the optimization of<br />
existing diesel (TDI) and petrol (TSI) engines.<br />
In 2006, Volkswagen introduced the Polo<br />
BlueMotion, the fi rst in a series of models<br />
refl ecting Volkswagen’s aim to market vehicles<br />
with very low fuel consumption, delivering<br />
outstanding performance at competitive<br />
prices. Moreover, constant efforts are made<br />
in order to increase the proportion of recycled<br />
components at the end of the vehicle’s life<br />
cycle. D’Ieteren Auto actively works with<br />
Febiac (the Belgian Federation of the Car and<br />
Two-wheeler Industries) within the framework<br />
CORPORATE CITIZENSHIP<br />
As a company that takes its environmental and social<br />
responsibilities seriously, D’Ieteren is eager to play its part<br />
in improving the quality of life in the communities where<br />
it operates. In some cases, the Group offers its services to<br />
these communities, while in other cases, it becomes involved<br />
with relevant social issues or pursues more cultural or<br />
humanitarian goals.<br />
PROTECTING<br />
CARING FOR<br />
D’IETEREN AUTO<br />
D’Ieteren Auto, in partnership with the Royal<br />
Automobile Club of Belgium, organizes<br />
training courses aimed at responsible<br />
driving for young drivers and advising on<br />
fuel-effi cient driving for companies wanting<br />
to reduce the fuel consumption of their fl eet<br />
of vehicles. D’Ieteren Auto supports a large<br />
number of social and cultural organizations<br />
and programmes such as the events<br />
organised by the ”Maison de la Radio”<br />
(Flagey). Through its Volkswagen division,<br />
the Company is committed to CAP 48 fund<br />
raising campaigns organised by RTBF on<br />
behalf of associations for the disabled. It<br />
also supports Child Focus, the European<br />
Center for Missing and Sexually Exploited<br />
Children, as well as Live collecting funds for<br />
several heart surgery projects.<br />
At the end of 2006, following the<br />
announcement by Volkswagen AG of the<br />
restructuring of their manufacturing facility<br />
in Forest, Belgium, D’Ieteren has set up a<br />
scholarship in order to help the workers<br />
affected by this restructuring to retrain for<br />
other professions in the <strong>auto</strong>mobile sector.<br />
AVIS EUROPE<br />
Avis Europe aims to make a positive<br />
contribution to the quality of life in the<br />
communities where it operates notably by<br />
providing free transport for local community<br />
activities. The company also supports staff<br />
to volunteer and raise funds for charities<br />
16 D’IETEREN - ANNUAL REPORT 2006
of Febel<strong>auto</strong>, the body which controls and<br />
manages the environmentally responsible<br />
disposal of around 130,000 vehicles being<br />
scrapped each year. D’Ieteren Auto also<br />
encourages its dealers to reduce waste and<br />
protect the environment, notably via the<br />
safe storage of hazardous substances, the<br />
use of water-based paints in coachwork<br />
and the selective treatment of waste water,<br />
including the water used for dewaxing new<br />
vehicles. Concerned about its integration in<br />
the urban environment, D’Ieteren Auto supports<br />
initiatives in mobility matters. One of<br />
these is put into practice by staff from the<br />
Company’s headquarters in Ixelles via the<br />
promotion of alternative means of transportation,<br />
the reduction in the number of cars<br />
on the road, etc.<br />
AVIS EUROPE<br />
Avis Europe remains committed to reducing,<br />
wherever possible, its negative impacts on<br />
the environment. Its largest environmental<br />
impact is from greenhouse gas emissions,<br />
both from offi ces and the rental fl eet.<br />
Secondary impacts come from the waste<br />
which is sent to landfi ll and incinerated.<br />
In 2006 Avis Europe achieved carbon neutral<br />
status for its European corporate operations<br />
by reducing CO 2<br />
emissions by the more<br />
effi cient use of offi ce space and of energy,<br />
and by offsetting remaining emissions. 70%<br />
of the offset on 2006 was through innovative<br />
renewable energy and technology projects<br />
which reduce greenhouse gas emissions.<br />
The remaining offset was via tree planting.<br />
The company has offset 94,500 tonnes CO 2<br />
since 2000 and more than 8,400 tonnes<br />
in 2006. Some licensees are also Carbon<br />
Neutral.<br />
BELRON<br />
Belron minimises glass waste through<br />
its repair fi rst strategy. Belron has signed<br />
agreements with specialised partners for the<br />
collection and processing of this waste.<br />
THE ENVIRONMENT<br />
OUR SOCIETY<br />
The CarbonNeutral Company<br />
which are particularly important to them as<br />
individuals. These include “Les Restaurants<br />
du Coeur” in France, Cancer Research in<br />
Germany, “Cooperacion Internacional” in<br />
Spain, an organisation focused on improving<br />
housing in poor city areas, and the NEES<br />
foundation in the Netherlands helping<br />
disabled children or children affected by<br />
chronicle diseases.<br />
BELRON<br />
Belron has launched a number of initiatives<br />
to support local communities in South Africa,<br />
where the company was founded. Belron<br />
supports MaAfrika Tikkun, a charitable<br />
organisation based in Johannesburg.<br />
Established in 1994, its mission is to<br />
support the progress of all disadvantaged<br />
people in South Africa through meaningful<br />
and sustainable contributions to society.<br />
It provides pre-school education, daycare<br />
centres and primary health care, with<br />
the emphasis on assistance to HIV/AIDS<br />
affected patients and their families. The<br />
money raised by Belron staff who took<br />
part in the London Triathlon in 2006 will be<br />
allocated to the building of medical care<br />
centres run by locals who receive regular<br />
training and medicin kits.<br />
Belron also supports the Field Band<br />
Foundation, which uses music and<br />
dance as a social development tool in the<br />
disadvantaged communities in South Africa.<br />
Currently they have 30 bands which are<br />
attended by more than 4,000 young people<br />
from 380 schools.<br />
Locally, business units manage their own<br />
socially responsible programmes, for<br />
example, in the UK, AUTOGLASS ® have<br />
a nation-wide scheme of local community<br />
partnerships supporting a range of<br />
initiatives such as hospitals, schools and<br />
charitable organisations. Also in the United<br />
States Belron supports several charitable<br />
organizations such as The American Cancer<br />
Society, The Ronald McDonald House and<br />
The American Red Cross.<br />
CORPORATE CITIZENSHIP 17
AUTOMOBILE<br />
DISTRIBUTION<br />
18 D’IETEREN - ANNUAL REPORT 2006
D’IETEREN AUTO<br />
9 WELL-KNOWN MAKES, 113,000 NEW VEHICLES DELIVERED,<br />
NEARLY 1,000,000 CUSTOMERS<br />
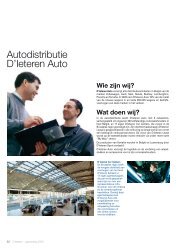
WHO WE ARE<br />
D’Ieteren Auto distributes in Belgium Volkswagen, Audi,<br />
Seat, Skoda, Bentley, Lamborghini, Bugatti, Porsche and<br />
Yamaha. In 2006, D’Ieteren Auto had a 19.43% new car market<br />
share and nearly one million cars and commercial vehicles<br />
of these makes in circulation.<br />
HOW WE DO IT<br />
D’Ieteren Auto’s development is based on:<br />
its in-depth knowledge of the Belgian <strong>auto</strong>mobile market<br />
enabling it to tailor its offer of products and services to customer<br />
needs;<br />
a proven network organisation that is both fl exible and close<br />
to the customer;<br />
its logistics and marketing know-how.<br />
WHAT WE DO<br />
In <strong>auto</strong>mobile distribution, D’Ieteren Auto operates through<br />
5 networks, representing more than 300 independent dealers<br />
throughout Belgium and about 20 corporate-owned D’Ieteren<br />
Car Centers mainly located in the Brussels region. Its D’Ieteren<br />
Lease subsidiary specialises in long-term car rental and represents<br />
a major sales tool. D’Ieteren Lease’s fl eet is sold on the<br />
used car market notably through the two “My Way” centres.<br />
Yamaha products are distributed in Belgium and Luxembourg<br />
by D’Ieteren Sport.<br />
D’Ieteren Auto also handles the distribution of spare parts<br />
and accessories to all its dealers.<br />
AUTOMOBILE DISTRIBUTION 19
POWERFUL COMMERCIAL SUPPORT TO THE NETWORKS<br />
In addition to the logistics and<br />
distribution of new vehicles,<br />
D’Ieteren Auto makes a large range<br />
of services available to its dealers<br />
to differentiate them from their<br />
competitors. Many fi nance products<br />
and services are offered through<br />
D’Ieteren Lease, as well as exclusive<br />
maintenance or insurance services.<br />
The Contact Centers allow the<br />
dealers to enable their customers<br />
to test or to look over the vehicle of<br />
their choice from the many different<br />
models distributed.<br />
In order to allow each dealer to<br />
continually improve, D’Ieteren Auto<br />
has developed a major recruitment,<br />
training and assessment programme<br />
for sales staff and regularly carries<br />
out customer satisfaction surveys.<br />
D’Ieteren Auto has also developed<br />
a tool for its dealers allowing them<br />
to compare their commercial and<br />
operational performance to their<br />
peers.<br />
D’Ieteren Auto also promotes the<br />
makes it distributes by organising<br />
events or national and multimedia<br />
advertising campaigns specifi cally<br />
tailored to the Belgian market.<br />
D’Ieteren Auto is one of the leading<br />
private advertisers in Belgium.<br />
AFTER-SALES SERVICES BACKED UP BY EFFECTIVE INFRASTRUCTURE<br />
D’Ieteren Auto delivers spare parts<br />
and accessories to its dealers<br />
promptly, minimizing the average<br />
immobilisation time of vehicles during<br />
repair or maintenance and enabling<br />
the dealers to reduce their stock<br />
while providing the same effi cient<br />
customer service.<br />
Considering the growing technical<br />
complexity of the vehicles, D’Ieteren<br />
Auto has two units available for its<br />
networks: the Technical Training<br />
Center and the Technical Service<br />
Center. The fi rst is a technical school<br />
that on average provides 5 days<br />
on technical training per person<br />
per year, nearly 8,000 training days<br />
in 2006, and works closely with<br />
the second which is a high-tech<br />
workshop for vehicles if problems<br />
cannot be solved immediately at<br />
the dealers. These two centres<br />
contribute in providing the best<br />
possible after-sales service.<br />
Moreover, D’Ieteren Auto<br />
permanently supports its dealers<br />
with work organisation, architecture<br />
and IT services.<br />
20 D’IETEREN - ANNUAL REPORT 2006
KEY FACTS<br />
NEW CAR MARKET GROWTH OF 9.6%<br />
to a record level of 526,141 registrations.<br />
MARKET SHARE UP AT 19.43%<br />
thanks to Skoda and Volkswagen.<br />
SALES UP 11.9%<br />
to EUR 2,491.4 million as a result of 12.5% new vehicle sales growth.<br />
CURRENT OPERATING RESULT UP 46.0%<br />
to EUR 81.9 million mainly due to new vehicle sales growth.<br />
CURRENT RESULT BEFORE TAX, GROUP’S SHARE, UP 64.8%<br />
to EUR 59.5 million.<br />
FINANCIAL HIGHLIGHTS (IN EUR MILLION)<br />
2006 2005 % CHANGE<br />
New vehicles delivered (in units) 112,944 103,239 + 9.4%<br />
External sales 2,491.4 2,227.2 + 11.9%<br />
Current operating result 81.9 56.1 + 46.0%<br />
Current operating margin 3.3% 2.5% –<br />
Current net finance costs -22.2 -19.6 + 13.3%<br />
Current result before tax 59.7 36.5 + 63.6%<br />
Unusual items and re-measurements,<br />
before tax -2.4 -0.2 –<br />
Current result before tax, group’s share 59.5 36.1 + 64.8%<br />
SALES BREAKDOWN BY ACTIVITY<br />
% CHANGE<br />
New vehicles +12.5%<br />
Used vehicles +29.6%<br />
Spare parts and accessoires +2.8%<br />
D’Ieteren Car Centers (after-sales) +12.3%<br />
D’Ieteren Sport -5.7%<br />
D’Ieteren Lease +7.9%<br />
D’Ieteren Auto +11.9%<br />
2%<br />
2%<br />
5%<br />
6%<br />
5%<br />
80%<br />
ACTIVITIES AND RESULTS<br />
D’Ieteren Auto delivered an excellent 2006 performance. Sales<br />
grew by 11.9% and achieved a record level of EUR 2,491.4 million,<br />
mainly thanks to new vehicle sales growth.<br />
New vehicles<br />
In 2006, new car registrations in Belgium amounted to a record level<br />
of 526,141 units, up 9.6%, benefi ting mainly from the January Motor<br />
Show and the accelerated renewal of the car park following strong<br />
economic growth, with the impact from the more restrictive tax regulation<br />
regarding registration of 4WD as light commercial vehicles.<br />
The makes distributed by D’Ieteren Auto achieved 19.43% market<br />
share for the full year 2006, up in comparison with 19.01% in 2005,<br />
due to Skoda and Volkswagen market share gains, and despite<br />
some supply shortages arising from the manufacturer’s priority<br />
given to the German market in anticipation of the 2007 VAT raise<br />
and from the events at the end of 2006 at the VW Forest factory.<br />
Skoda, whose range was extended in September 2006 with the<br />
introduction of its new small people carrier Roomster, saw its mar-<br />
ket share grow beyond the 2% mark. Volkswagen regained its N° 1<br />
position in the Belgian market, particularly strengthened by models<br />
introduced in 2005 - Jetta, Polo, Fox and Passat – and during the<br />
fi rst half of 2006 - CrossPolo and Eos. Audi continued to benefi<br />
t from its very successful A6 and from its new 4WD model Q7.<br />
During the second half of 2006 the make renewed its Allroad and<br />
TT models. Porsche registrations achieved a record level thanks<br />
to its 911 and Cayman models. Seat’s market share decreased<br />
slightly. The new Seat Altea XL (estate version) was introduced in<br />
December 2006.<br />
The light commercial vehicles market was down 3.1% in 2006 at<br />
58,730 new registrations due to the 4WD registrations transfer.<br />
D’Ieteren Auto achieved 9.75% market share, up compared to<br />
9.62% for the full year 2005, notably thanks to the new VW Crafter<br />
introduced in Belgium in May 2006.<br />
New vehicles, including commercial vehicles, delivered by D’Ieteren<br />
Auto amounted to 112,944 units in 2006, up 9.4%. New vehicle<br />
sales, including commercial vehicles, up 12.5%, amounted to EUR<br />
1,987.0 million.<br />
AUTOMOBILE DISTRIBUTION 21
MARKET SHARE OF THE DISTRIBUTED MAKES<br />
(NEW CAR REGISTRATIONS - in %)<br />
2006 2005 2004 2003 2002<br />
Volkswagen 10.74 10.44 10.33 9.87 10.00<br />
Audi 4.74 4.91 4.39 4.36 4.26<br />
Seat 1.66 1.79 1.91 2.02 2.25<br />
Skoda 2.06 1.65 1.32 1.36 1.38<br />
Bentley/Lamborghini 0.02 0.02 0.02 0.01 –<br />
Porsche 0.21 0.20 0.14 0.14 0.13<br />
D’Ieteren Auto 19.43 19.01 18.11 17.76 18.02<br />
Other activities<br />
Used car sales amounted to EUR 118.2 million, up 29.6%, in a<br />
favourable market.<br />
Sales of spare parts and accessories were up 2.8%, to EUR 141.1<br />
million. The accessories sales decline due to the more comprehensive<br />
standard equipment of new vehicles was more than offset by<br />
spare parts sales growth resulting from the increase of vehicles on<br />
the roads, distributed by D’Ieteren Auto.<br />
After-sales activities by D’Ieteren Car Centers were up 12.3% to<br />
EUR 46.6 million.<br />
Sales of D’Ieteren Lease, the long-term car rental arm of D’Ieteren<br />
Auto, increased by 7.9% to EUR 116.2 million. At 31 December 2006,<br />
its fl eet amounted to almost 18,800 rented vehicles, up around 6%.<br />
D’Ieteren Sport sales, mainly Yamaha motorbikes, quads and<br />
scooters, were down 5.7% at EUR 59.3 million. Notably due to<br />
strong quads competition, Yamaha’s market share was down at<br />
18.14% in a growing market, compared to 19.58% in 2005.<br />
Results<br />
Benefi ting from the strong sales growth and the leveraging of<br />
its cost structure, D’Ieteren Auto’s current operating result grew<br />
46.0% to 81.9 million.<br />
Total net fi nance costs amounted to EUR 25.3 million, an increase<br />
of EUR 5.3 million, including EUR 3.1 million (EUR 0.4 million for<br />
the full year 2005) of re-measurements of fi nancial instruments<br />
(mainly interest rate swaps) at fair value. Excluding these items,<br />
current net fi nance costs increased by EUR 2.6 million to EUR 22.2<br />
million mainly as a result of higher interest rates.<br />
Current result before tax, group’s share, was up 64.8% to EUR<br />
59.5 million (2005: EUR 36.1 million).<br />
22 D’IETEREN - ANNUAL REPORT 2006
MARKET OF NEW CARS AND MARKET SHARE<br />
OF D’IETEREN AUTO<br />
LIGHT COMMERCIAL VEHICLE MARKET AND<br />
MARKET SHARE OF D’IETEREN AUTO<br />
Registrations<br />
550,000<br />
20.48<br />
19.82<br />
20.11<br />
19.61<br />
19.82<br />
18.02<br />
17.76<br />
18.11<br />
19.01<br />
19.43<br />
%<br />
20<br />
Registrations<br />
65,000<br />
11.27<br />
8.51<br />
10.24<br />
9.62<br />
9.75<br />
%<br />
15<br />
450,000<br />
350,000<br />
15<br />
52,000<br />
39,000<br />
10<br />
250,000<br />
150,000<br />
50,000<br />
0<br />
396,240<br />
452,129<br />
489,621<br />
515,204<br />
488,683<br />
467,569<br />
458,796<br />
484,757<br />
480,088<br />
526,141<br />
97 98 99 00 01 02 03 04 05 06<br />
10<br />
5<br />
0<br />
Market share<br />
Market<br />
26,000<br />
13,000<br />
0<br />
48,591<br />
50,606<br />
57,496<br />
60,616<br />
58,730<br />
02 03 04 05 06<br />
5<br />
0<br />
Market share<br />
Market<br />
KEY DEVELOPMENTS<br />
In order to increase customer satisfaction, D’Ieteren Auto is pursuing<br />
its separate distribution policy of the Volkswagen and Audi<br />
makes, in the national network as well as in the Brussels region<br />
where two new D’Ieteren Car Centers were opened in 2006. The<br />
showroom architecture, extended to display a wider range of models,<br />
refl ects the image of the make. D’Ieteren Auto is also completing<br />
the reconfi guration of its Seat and Skoda networks. One<br />
Porsche centre was acquired in the beginning of 2007.<br />
Actions are underway to enhance customer loyalty and thereby<br />
stimulate new vehicle as well as after-sales activities. These actions<br />
include dealer training programmes, implementation of make-specifi<br />
c after-sales structures, development of new customer relationship<br />
management tools and new processes to improve used<br />
vehicle trade-in by dealers. D’Ieteren Auto is also implementing a<br />
“My Way” used car dealer network.<br />
D’Ieteren Lease concluded the securitisation programme of its fl eet<br />
and lease contracts and raised an initial amount of EUR 230 million<br />
in April 2006, thereby achieving <strong>auto</strong>nomous and fl exible fi nancing.<br />
OUTLOOK FY 2007<br />
In 2007 the Belgian market should reach around 490,000 new car<br />
registrations, below the 2006 record, but still a sustained level to<br />
be achieved mainly through the renewal of the car park. D’Ieteren<br />
Auto will pursue its objective of 20% market share. The models to<br />
be introduced or renewed during 2007 include VW Golf Variant,<br />
Cross and BlueMotion ranges, Skoda Fabia, Audi A5 and Porsche<br />
Cayenne. D’Ieteren Auto will furthermore take advantage of its<br />
customer loyalty actions in sales as well as in after-sales activities.<br />
AUTOMOBILE DISTRIBUTION 23
24 D’IETEREN - ANNUAL REPORT 2006<br />
VOLKSWAGEN GOLF VARIANT
AUDI R8
NEW SKODA FABIA
BENTLEY CONTINENTAL GTC
LAMBORGHINI MURCIÉLAGO LP 640 ROADSTER
SEAT ALTEA XL
PORSCHE CAYENNE
YAMAHA R1<br />
AUTOMOBILE DISTRIBUTION 31
SHORT-TERM<br />
CAR RENTAL<br />
32 D’IETEREN - ANNUAL REPORT 2006
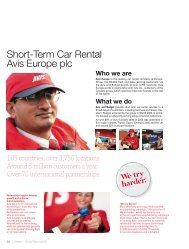
AVIS EUROPE plc<br />
OVER 3,600 LOCATIONS IN EUROPE, AFRICA, THE MIDDLE EAST<br />
AND ASIA, SERVING MORE THAN 5 MILLION CUSTOMERS<br />
WHO WE ARE<br />
Avis Europe is a leading short-term car rental company in<br />
Europe, Africa, the Middle East and Asia, serving customers<br />
via the Avis and Budget brands in over 3,600 locations. Avis<br />
Europe works in partnership with Avis Budget Group, Inc.,<br />
which own the brands and operate them in the rest of the<br />
world.<br />
WHAT WE DO<br />
Avis and Budget provide short-term car rental services to<br />
a broad range of customers, including individuals, corporate<br />
customers, insurance and leasing companies. Budget,<br />
acquired by the group in 2003, is primarily focused on effi -<br />
ciently serving value-conscious customers.<br />
Around 80% of Avis Europe’s sales revenue in 2006 was generated<br />
in fi ve major markets, France, Spain, Germany, Italy<br />
and the UK.<br />
HOW WE DO IT<br />
Avis Europe’s development is supported by:<br />
a global recognition of the Avis and Budget brands;<br />
an extensive network footprint with representation at key<br />
airport and train station locations;<br />
strong travel-related partnerships with airlines, rail, credit<br />
card and hotel companies;<br />
leadership in IT systems including the global Wizard computer<br />
system providing integrated reservation, rental and<br />
management information and the group’s Internet platform.<br />
Avis Europe operates a balance of directly owned corporate<br />
operations and licensees. These two operating structures give<br />
the group a fl exible approach to meet the diverse demands of<br />
a worldwide market.<br />
The group’s management philosophy is one of decentralisation<br />
and local <strong>auto</strong>nomy, underpinned by strong central<br />
support services, an approach which stimulates entrepreneurialism<br />
whilst promoting consistency of image, service levels<br />
and operational effi ciency.<br />
SHORT-TERM CAR RENTAL 33
FINANCIAL HIGHLIGHTS (IN EUR MILLION)<br />
2006 2005 % CHANGE<br />
External sales 1,336.3 1,276.4 + 4.7%<br />
Current operating result 105.9 100.4 + 5.5%<br />
Current operating margin 7.9% 7.9% –<br />
Current net finance costs -67.2 -62.1 + 8.2%<br />
Current result before tax 38.7 38.3 + 1.0%<br />
Unusual items & re-measurements,<br />
before tax -50.2 -45.2 * –<br />
Current result before tax,<br />
group’s share 23.1 22.7 + 1.8%<br />
Note: The average shareholding used for consolidation of Avis Europe in 2006 is 59.63% (59.65% in 2005).<br />
* As restated following application of IAS 21 revised.<br />
CAR RENTAL MADE FASTER AND EASIER BY AVIS<br />
Avis completed one of the most extensive customer research initiatives<br />
in the European car rental industry and is using the fi ndings to improve<br />
further the customer offer and the way Avis operates across all of its major<br />
locations. During 2006 the company launched a programme of “Inspired<br />
Change” to make car rental simpler, faster and easier. Customer innovations<br />
include the new rental agreement, in a new easy-to-understand format in<br />
the customer’s own choice of language, as well as the Avis Rapid Return<br />
service that reduces car return times to just 60 seconds. The procedure<br />
for the rental choice has been simplifi ed notably via a car size classifi cation<br />
(small, medium or large). Other services are made available such as the<br />
possibility to rent satellite navigation systems or portable DVD players.<br />
The launch of Avis Europe’s new car rental reservation website in the UK<br />
marks the latest in a series of customer service initiatives to make car rental<br />
reservations both faster and more straightforward.<br />
A FLEXIBLE BUSINESS MODEL TO ENSURE CUSTOMER<br />
SATISFACTION AND OPERATIONAL EFFICIENCY<br />
Fleet management is a key competence required in order to maximise asset<br />
turnover while guaranteeing customer demand satisfaction even in peak<br />
periods. Every year, more than 160,000 cars are purchased from more than<br />
30 manufacturers and kept 7 months on average. More than 65% of this<br />
fl eet benefi ts from buy-back contracts with the car manufacturers allowing<br />
Avis Europe to return the cars without residual value risks and to quickly<br />
adapt the fl eet size to changing demand.<br />
34 D’IETEREN - ANNUAL REPORT 2006
KEY FACTS<br />
GOOD VOLUME GROWTH; CONTINUING COMPETITIVE<br />
PRICING.<br />
REVENUE MANAGEMENT INVESTMENT<br />
ASSISTED FURTHER UTILISATION IMPROVEMENT.<br />
SALES UP 4.7%<br />
to EUR 1,336.3 million.<br />
CURRENT OPERATING RESULT UP 5.5%<br />
to EUR 105.9 million with anticipated higher fl eet costs.<br />
CURRENT RESULT BEFORE TAX, GROUP’S SHARE, UP 1.8%<br />
to EUR 23.1 million.<br />
RE-STRUCTURING PROGRAMME BENEFITS<br />
ahead of expectations; unusual costs lower.<br />
ACTIVITIES AND RESULTS<br />
The following extracts are taken from the Annual Report by Avis<br />
Europe plc.<br />
“Total sales revenue was up 4.8% at EUR 1,337 million. Sales<br />
revenue from the Avis Corporately-owned business segment was<br />
4.5% ahead of prior year at EUR 1,263 million. Overall volume, in<br />
terms of billed days, was up 5.9%. However, revenue per billed<br />
day was 1.4% lower. This was driven by the impact of the longer<br />
average rental length, together with generally lower underlying<br />
pricing, partly mitigated by favourable customer mix as the proportion<br />
of insurance/leasing business diminished. Budget Corporate<br />
sales revenue of EUR 36 million was 5.9% ahead of prior year<br />
through continued good growth in the UK and France.<br />
Underlying operating profi t was EUR 105.6 million* (2005: EUR 99.9<br />
million), including a EUR 4.8 million anticipated loss from Budget<br />
(2005: loss EUR 6.9 million). Underlying Avis operating profi t of<br />
EUR 158.2 million compared to EUR 153.9 million in the prior year.<br />
This, when combined with an increase in unallocated costs of EUR<br />
0.7 million, to EUR 47.8 million, resulted in an underlying operating<br />
profi t of EUR 110.4 million, compared to EUR 106.8 million in<br />
the prior year. Underlying operating margin, after deducting unallocated<br />
costs, was 0.1% lower at 8.5%. Good volume growth and<br />
the initial benefi ts from the re-structuring programme were offset<br />
by lower pricing and cost increases ahead of infl ation, particularly<br />
fl eet related.<br />
Vehicle holding costs increased ahead of volume growth, refl ecting<br />
an increase in operating lease vehicles (the interest element of<br />
which effectively switches to fl eet cost from net fi nance cost) and<br />
more diffi cult fl eet market conditions. This effect was partially mitigated<br />
by an improvement in utilisation of 0.8 percentage points,<br />
benefi ting from both the revenue management initiative and an<br />
increase in rental length.<br />
Underlying net fi nance costs increased year-on-year to EUR 67.2<br />
million. Average net debt was lower in 2006 benefi ting from the<br />
full year effect of the rights issue proceeds received in mid 2005.<br />
The average fi nance rate increased year-on-year primarily due to<br />
the impact of the new EUR 250 million notes due 2013, that were<br />
issued in July 2006.<br />
SHORT-TERM CAR RENTAL 35
AVIS SALES BY GEOGRAPHIC<br />
MARKET<br />
19%<br />
21%<br />
% CHANGE<br />
France +5%<br />
Spain +2%<br />
Italy +9%<br />
Germany -1%<br />
UK +3%<br />
Other –<br />
14%<br />
14%<br />
15%<br />
17%<br />
The net exceptional charge before tax of EUR 28.9 million includes<br />
lower than expected restructuring costs of EUR 25.3 million<br />
incurred in the year in connection with the restructuring project the<br />
group commenced in late 2005, covering the roles of its European<br />
headquarters, corporate operations, shared service centre and call<br />
centres. These restructuring costs are net of a pension curtailment<br />
credit of EUR 1.2 million.”<br />
* Note: D’Ieteren reports a current operating result of EUR 105.9 million for the car<br />
rental segment. In addition to the unusual items and re-measurements recognised<br />
by Avis Europe, D’Ieteren includes the amortisation of the Avis licence rights for<br />
EUR 21.7 million (already fully amortised in the accounts of Avis Europe).<br />
RECOVERY STRATEGY PROGRESS<br />
“The group continues to progress its strategy to improve its margin<br />
and return on capital in the medium term, whilst further strengthening<br />
its position as a market leader.<br />
The group has largely completed a signifi cant organisational<br />
re-structuring and re-design of key processes to address<br />
fi xed costs. This comprised a reduction in staff and running<br />
costs at the European headquarters; an acceleration<br />
of the transfer of back-offi ce activities into the shared service<br />
centre in Budapest; consolidation of all call centre activities<br />
into the existing Barcelona facility; and a number of staff<br />
and overhead cost reductions in country head offi ces. These<br />
changes have created a more effective and effi cient business.<br />
Savings in 2006 were ahead of expectations at EUR 11 million<br />
and are expected to increase to EUR 25 million in 2007. Final<br />
costs of the programme in 2007 are expected at some EUR<br />
10 million.<br />
36 D’IETEREN - ANNUAL REPORT 2006
A revenue management function has been established to improve<br />
price / yield and utilisation, and has already assisted in the achievement<br />
of the improvement in utilisation in the year. A new demand<br />
forecasting system has been developed and implemented through<br />
the network. Further investment is now being made in data tools<br />
to assist with the fast implementation of tactical price changes and<br />
the optimisation of fl eet levels.<br />
Actions are underway to migrate business towards more profi t-<br />
able customer groups, whilst seeking to improve returns on the<br />
remaining business. Customer service initiatives to improve speed,<br />
transparency and choice were implemented at major locations and<br />
are now being progressively rolled out across the network. Internet<br />
reservations continue to increase, ending the year at 28.7%<br />
(December 2005: 24%).<br />
Initiatives on yield, utilisation and targeted growth support the<br />
group’s focus on fl eet management. The balance between corporately<br />
owned, agency and licensee elements of the network continues<br />
to be reviewed from a fl eet returns perspective.”<br />
OUTLOOK FY 2007<br />
“Overall expectations for 2007 remain unchanged. Volume growth<br />
trends are expected to continue at similar levels to those achieved<br />
in 2006. The current planning assumption is that rate will be<br />
broadly fl at, although at this time, there is the usual limited visibility<br />
on pricing over the full year.<br />
Fleet costs have risen above general infl ation, refl ecting continuing<br />
diffi cult market conditions. The group intends to mitigate this<br />
margin pressure by a further improvement in utilisation, driven by<br />
the revenue management initiatives, together with the benefi ts<br />
from the overhead restructuring programme and the focus on cost<br />
reduction initiatives.<br />
However, looking further ahead, the external environment has<br />
been, and is expected to continue to be, more diffi cult than Avis<br />
Europe assumed two years ago and no longer supports the guidance<br />
Avis Europe gave in 2005 regarding margin improvement.”<br />
End of extracts.<br />
SHORT-TERM CAR RENTAL 37
VEHICLE GLASS<br />
REPAIR AND REPLACEMENT<br />
38 D’IETEREN - ANNUAL REPORT 2006
BELRON s.a.<br />
MORE THAN 8 MILLION CUSTOMERS, 1,500 BRANCHES AND 6,500<br />
SERVICE VEHICLES IN 29 COUNTRIES*<br />
WHO WE ARE<br />
Belron is the world N°1 in vehicle glass repair and replacement<br />
(VGRR), operating in 29 countries, across 4 continents.<br />
Belron is the owner of many of the best known brands in the<br />
industry, CARGLASS ® across continental Europe and in Brazil,<br />
AUTOGLASS ® in the UK, O’BRIEN ® in Australia, LEBEAU ®<br />
and SPEEDY GLASS ® in Canada, and ELITE AUTO GLASS<br />
and AUTO GLASS SPECIALISTS ® in the US. In 2007 Belron<br />
acquired Safelite Group, Inc., the leader in the US VGRR market.<br />
WHAT WE DO<br />
For our customers: Belron offers a 24 hour repair and<br />
replacement service to ensure customers can get their damaged<br />
glass fi xed quickly and easily. The mobile service enables<br />
customers to choose the most convenient location to have the<br />
work carried out.<br />
For our partners: by managing a signifi cant part of the claim<br />
administration and actively promoting the repair concept Belron<br />
works with virtually all the major insurance and vehicle leasing<br />
companies worldwide.<br />
HOW WE DO IT<br />
The group achieves profi table growth by:<br />
increasing sales through organic growth, acquiring and<br />
integrating leading VGRR businesses worldwide and by franchising<br />
its brands into new markets;<br />
maximising the efficiency of its operations, centralising<br />
those parts of the business where there are benefi ts to be<br />
gained and sharing best practices right across the group.<br />
Belron operates via an extensive network of corporatelyowned<br />
and franchised businesses across Europe, North<br />
and South America, Australia and New Zealand. The business<br />
units operate in markets at different stages of maturity. Having<br />
a mixed portfolio enables Belron to pool experience across the<br />
group, share information and so accelerate development.<br />
* Including Safelite Group, Inc. – see p. 43 of this report.<br />
VEHICLE GLASS REPAIR AND REPLACEMENT 39
CUSTOMER FIRST<br />
To refi ne its service even further,<br />
Belron conducts no less than<br />
250,000 customer service interviews<br />
over the course of a year. Together<br />
with informal feedback from its<br />
customers, this helps set new<br />
standards for the industry as a whole.<br />
STAFF<br />
Belron places huge importance on its employees and their<br />
continued development and training. Senior executives<br />
throughout the company participate in a development<br />
programme concentrating on a set of leadership competencies<br />
which defi ne what excellent leadership means to Belron.<br />
Through its “Best of Belron” worldwide technician competition,<br />
Belron promotes best-in-class front line service quality.<br />
RESEARCH AND<br />
DEVELOPMENT<br />
Belron has its own dedicated<br />
research and development centre<br />
where it pools the experience of the<br />
group’s technical staff, evaluates<br />
their ideas and turns them into best<br />
practice for the entire group.<br />
WORLDWIDE EXPANSION<br />
Since its acquisition by D’Ieteren at the end of 1999, Belron<br />
has entered 17 new markets, including Scandinavia, and more<br />
recently the United States. In certain major existing markets, such<br />
as Spain and Canada, the group made new acquisitions in order<br />
to expand. The group also extended its network of franchised<br />
businesses mainly in Eastern Europe.<br />
BELRON, N° 1 IN USA<br />
In March 2007, Belron acquired Safelite Group, Inc., the leader in the US<br />
VGRR market, with about 5,700 employees. Safelite Group, Inc. is the<br />
only provider in the United States with a fully integrated business model<br />
that comprises vehicle glass repair and replacement operations, vehicle<br />
glass claims management, vehicle glass manufacturing and wholesale<br />
distribution services. This acquisition allows Belron to achieve immediate<br />
national geographic coverage with an established 60 year old business that<br />
has developed excellent long-term relationships with insurance and fl eet<br />
customers.<br />
40 D’IETEREN - ANNUAL REPORT 2006
KEY FACTS<br />
SALES: EUR 1,507.3 MILLION, UP 20.2%<br />
equally divided between organic and acquired growth with minimal<br />
currency translation impact.<br />
CURRENT OPERATING RESULT: EUR 119.9 MILLION, UP 20.9%<br />
due to strong sales growth and operational effi ciency improvements.<br />
CURRENT RESULT BEFORE TAX, GROUP’S SHARE:<br />
EUR 72.0 MILLION, UP 20.4%.<br />
UNUSUAL COSTS BEFORE TAX OF EUR 19.6 MILLION<br />
mainly related to the integration and transformation of the 2005/2006<br />
acquisitions in North America.<br />
MARCH 2007: ACQUISITION OF SAFELITE GROUP, INC.,<br />
the leader in the US VGRR market.<br />
FINANCIAL HIGHLIGHTS (IN EUR MILLION)<br />
2006 2005 % CHANGE<br />
Total jobs (incl. Brazil - in million units) 6.1 5.3 + 15.1%<br />
External sales 1,507.3 1,253.7 + 20.2%<br />
Current operating result 119.9 99.2 + 20.9%<br />
Current operating margin 8.0% 7.9% –<br />
Current net finance costs -19.4 -14.8 + 31.1%<br />
Current result before tax 100.5 84.4 + 19.1%<br />
Unusual items and re-measurements,<br />
before tax -16.5 3.4 –<br />
Current result before tax,<br />
group’s share 72.0 59.8 + 20.4%<br />
Note: The average shareholding used for consolidation of Belron in 2006 is 73.7% as in 2005.<br />
ACTIVITIES AND RESULTS<br />
Belron delivered another strong performance in 2006. Sales grew<br />
by 20.2% to EUR 1,507.3 million. Total repair and replacement<br />
jobs grew by 15.1% to EUR 6.1 million.<br />
Organic sales grew by 10% at constant exchange rates.<br />
Geographical expansion during the year, notably in North America,<br />
added 10% and currency translation had a minimal impact.<br />
In Europe, after both currency translation and acquisitions,<br />
sales grew by 13.4%. Organic sales growth was delivered in all<br />
European countries through effective advertising which has benefi<br />
ted from the successful multinational rollout of best practice<br />
advertising concepts, together with further progress with insurers<br />
and fl eet partners. The Northern European businesses benefi ted<br />
from favourable winter weather conditions compared to 2005<br />
but suffered from the mild weather in the autumn. Particularly strong<br />
performance came from the UK, France, Italy and the Benelux<br />
businesses. In France, sales continued their growth trend despite<br />
tougher market conditions resulting mainly from speed restrictions.<br />
Outside Europe, after both currency translation and acquisitions,<br />
sales grew by 44.0% mainly as a result of acquisitions in North<br />
America.<br />
The current operating result amounted to EUR 119.9 million against<br />
EUR 99.2 million in 2005 due to sales increases in existing markets<br />
and, to a lesser degree, resulting from the 2005/2006 acquisitions,<br />
together with operational effi ciency gains.<br />
Unusual costs and re-measurements in operating result of EUR<br />
19.0 million comprise EUR 20.2 million one-off costs related to<br />
the integration and transformation programme underway in North<br />
America aimed at improving operating margins of the recent<br />
acquisitions, EUR 2.1 million costs associated with the closing of<br />
the manufacturing operations in Australia, EUR 2.6 million one-off<br />
gain linked to the closure of a pension scheme in Holland and a net<br />
gain of EUR 0.7 million arising from fi nancial instruments.<br />
Net fi nance costs amounted to EUR 16.9 million compared to<br />
EUR 12.0 million in 2005. Before re-measurements resulting from<br />
the changes in fair value of derivatives, net fi nance costs increased<br />
VEHICLE GLASS REPAIR AND REPLACEMENT 41
from EUR 14.8 million in 2005 to EUR 19.4 million primarily due<br />
to an upward movement in interest rates and to higher average<br />
net debt – linked to the fact that the majority of the 2005 acquisitions<br />
were made at the end of that year. However, despite continued<br />
acquisition activity and the payment of both the 2004 and<br />
2005 dividends, increased generation of operating cash fl ow has<br />
resulted in a reduction in the Belron’s net debt position of EUR<br />
22.9 million as at 31st December 2006.<br />
Current result before tax, group’s share, rose from EUR 59.8 million<br />
to EUR 72.0 million, an increase of EUR 12.2 million refl ecting<br />
the strong operating performance.<br />
KEY ACHIEVEMENTS<br />
During 2006, Belron pursued its successful strategy delivering<br />
sales growth and increased profi tability.<br />
Belron continued to focus on delivering an outstanding and convenient<br />
service to its customers which it measures on a daily<br />
basis. Expansion of the call centre operations, a focus on serving<br />
customers quickly and continued promotion of a mobile service<br />
ensured that customer satisfaction remained high.<br />
The business developed further its strong strategic relationship<br />
with insurance and fl eet partners. The group remained committed<br />
to actively promoting windscreen repair as a safe and cost<br />
effective alternative to replacement thereby generating substantial<br />
savings for its partners. In 2006, 30% of all windscreen jobs were<br />
repairs.<br />
In Europe Belron acquired its former franchisee in Greece and also<br />
the GLASSCAR ® business in Italy. There were also incremental<br />
acquisitions in Spain, UK, Germany, Sweden and Norway which<br />
have all been successfully integrated into the existing businesses.<br />
42 D’IETEREN - ANNUAL REPORT 2006
GEOGRAPHIC SALES<br />
BREAKDOWN 1<br />
% CHANGE<br />
Europe: +13.4 %<br />
Belgium, Denmark, France,<br />
Germany, Greece, Ireland,<br />
Italy, Luxemburg, Netherlands,<br />
Norway, Portugal, Spain,<br />
Sweden, Switzerland, UK<br />
Rest of the world: +44.0%<br />
Australia, Brazil, Canada,<br />
New Zealand, United States<br />
27%<br />
73%<br />
1. At actual exchange rates.<br />
In September 2006, Belron signed a franchise agreement in<br />
Romania, bringing its franchise network to 9 partners.<br />
During 2006, Belron continued the integration of the Canadian<br />
glass operations of AUTOSTOCK INTERNATIONAL, a division of<br />
TCG INTERNATIONAL which was acquired in November 2005,<br />
into its existing operation. This involved the closing of 36 stores and<br />
24 warehouses where there was overlap, the alignment of brands<br />
across the 5 provinces, the integration of IT systems throughout<br />
the business and the consolidation of administrative functions into<br />
one support centre. In the United States, good progress has been<br />
made with integration of the 3 businesses which were acquired in<br />
2005 as well as the 2006 acquisition of MAVERICK AUTO GLASS,<br />
based in Phoenix, Arizona.<br />
OUTLOOK FY 2007<br />
In 2007, organic sales growth is expected to continue, although at<br />
a slightly lower rate due to strong comparatives during the 2006<br />
winter, as Belron remains committed to delivering an outstanding<br />
service to its customers, its key insurance and fl eet partners.<br />
MAJOR EVENTS AFTER CLOSURE OF THE FY 2006 ACCOUNTS<br />
In March 2007, Belron acquired Safelite Group, Inc., the leader in<br />
the US VGRR market, for an enterprise value of USD 334 million<br />
(EUR 258 million), including assumed debt. This acquisition was<br />
entirely fi nanced by Belron through the issuance of new debt<br />
instruments, on its own fi nancing capacity. Based on estimated<br />
2006 results of Safelite, this acquisition would have resulted in an<br />
increase of around EUR 8 million of the current result before tax,<br />
group’s share, of D’Ieteren on a pro-forma 2006 full year basis.<br />
The integration of Belron Inc., the US subsidiary of Belron s.a., and<br />
Safelite operations began in March.<br />
The acquisition of Safelite allows Belron to achieve immediate<br />
national geographic coverage with an established 60 year old<br />
business that has already developed excellent long-term relationships<br />
with insurance and fl eet customers. Belron will maintain<br />
all customer-facing operations while it integrates its US back<br />
offi ce with Safelite’s central support functions. In addition, Belron<br />
VEHICLE GLASS REPAIR AND REPLACEMENT 43
will seek to further leverage its global scale in key functional areas<br />
while also sharing best practices both with the Safelite business<br />
and from Safelite across its global operations.<br />
Safelite Group Inc. had sales of around USD 592 million (EUR 457<br />
million) for the year ended 31 March 2006 and is the only provider<br />
in the United States with a fully integrated business model<br />
that comprises vehicle glass repair and replacement operations,<br />
vehicle glass claims management, vehicle glass manufacturing<br />
and wholesale distribution services.<br />
Safelite provides the most extensive company-owned vehicle glass<br />
repair and replacement operations in the US, covering 93% of the<br />
population. With around 3,500 fi eld-based associates and around<br />
2,200 mobile service vehicles, the company’s national operations<br />
perform more than 2.2 million vehicle glass repairs and replacements<br />
annually. Safelite also holds an industry-leading position in<br />
outsourced vehicle glass claims management. Supported by two<br />
national call centres, and an extensive technology platform directly<br />
linked to its clients, Safelite provides complete and tailored claims<br />
processing solutions for more than 100 insurance carriers and<br />
fl eet management companies, including multi-year contracts with<br />
the major ones. Coupled with the company’s extensive national<br />
network of more than 10,000 affi liates and its reputation for the<br />
highest levels of service in the industry, Safelite processes approximately<br />
4 million transactions annually.<br />
chain system also enables it to sell approximately 1 million wholesale<br />
glass units annually to independent third party glass shops<br />
and other distributors.<br />
The acquisition by Belron of this large, profi table and well run company<br />
brings Belron’s sales close to the EUR 2 billion mark – a greater<br />
than twofold increase since its acquisition by D’Ieteren in 1999 –<br />
and enhances its profi ts, thereby validating D’Ieteren’s strategy of<br />
strengthening its own stake in Belron.<br />
The company’s manufacturing and distribution operation provides<br />
Safelite with guaranteed supply, effi cient procurement and logistical<br />
support. This highly fl exible and scalable model consists of<br />
1 manufacturing facility and 81 warehouses. The company’s supply<br />
44 D’IETEREN - ANNUAL REPORT 2006
s.a. D’Ieteren n.v.<br />
Consolidated Financial<br />
Statements 2006<br />
Contents<br />
46 Consolidated Income Statement<br />
47 Consolidated Balance Sheet<br />
48 Consolidated Statement of Recognised<br />
Income and Expense<br />
49 Consolidated Cash Flow Statement<br />
50 Notes to the Consolidated Financial<br />
Statements<br />
50 Note 1: General Information<br />
50 Note 2: Accounting Policies<br />
56 Note 3: Segment Information<br />
60 Note 4: Sales<br />
61 Note 5: Operating Result<br />
62 Note 6: Net Finance Costs<br />
62 Note 7: Entities Accounted for Using the Equity<br />
Method<br />
63 Note 8: Tax Expense<br />
64 Note 9: Unusual Items and Re-Measurements<br />
66 Note 10: Earnings per Share<br />
67 Note 11: Goodwill<br />
69 Note 12: Business Combinations<br />
70 Note 13: Other Intangible Assets<br />
71 Note 14: Vehicles<br />
72 Note 15: Other Property, Plant and Equipment<br />
73 Note 16: Investment Property<br />
73 Note 17: Available-for-Sale Financial Assets<br />
73 Note 18: Derivative Hedging Instruments<br />
74 Note 19: Derivatives Held for Trading<br />
75 Note 20: Long-Term Employee Benefit Assets<br />
and Obligations<br />
78 Note 21: Deferred Taxes<br />
79 Note 22: Other Non-Current Receivables<br />
79 Note 23: Non-Current Assets Classified as Held<br />
for Sale<br />
79 Note 24: Inventories<br />
80 Note 25: Other Financial Assets<br />
80 Note 26: Current Tax Assets and Liabilities<br />
80 Note 27: Trade and Other Receivables<br />
80 Note 28: Cash and Cash Equivalents<br />
81 Note 29: Equity<br />
82 Note 30: Provisions<br />
84 Note 31: Borrowings<br />
87 Note 32: Net Debt<br />
87 Note 33: Put Options Granted to Minority<br />
Shareholders<br />
87 Note 34: Other Non-Current Payables<br />
87 Note 35: Trade and Other Current Payables<br />
88 Note 36: Employee Benefit Expense<br />
88 Note 37: Share-Based Payments<br />
89 Note 38: Risks Related to Financial Instruments<br />
90 Note 39: Contingencies and Commitments<br />
91 Note 40: Related Party Transactions<br />
91 Note 41: Subsequent Events<br />
92 Note 42: List of Subsidiaries, Associates<br />
and Joint Ventures<br />
92 Note 43: Exchange Rates<br />
93 Note 44: Auditor’s report<br />
95 Abridged Statutory Financial Statements<br />
2006<br />
CONSOLIDATED FINANCIAL STATEMENTS<br />
45
Consolidated Income Statement<br />
Year ended 31 December<br />
in EUR million Notes 2006 2005 (1)<br />
Current Unusual Total Current Unusual Total<br />
items (2) items and items (2) items and<br />
re-measu-<br />
re-measurements<br />
(2) rements (2)<br />
Sales 4 5,335.0 5,335.0 4,757.3 - 4,757.3<br />
Cost of sales -3,718.2 0.7 -3,717.5 -3,353.6 - -3,353.6<br />
Gross margin 1,616.8 0.7 1,617.5 1,403.7 - 1,403.7<br />
Commercial and administrative expenses -1,307.1 1.2 -1,305.9 -1,143.0 -5.3 -1,148.3<br />
Other operating income 3.9 7.6 11.5 1.7 5.6 7.3<br />
Other operating expenses -5.9 -77.5 -83.4 -6.7 -45.5 -52.2<br />
Operating result 5 307.7 -68.0 239.7 255.7 -45.2 210.5<br />
Net finance costs 6 -108.8 -1.1 -109.9 -96.5 3.2 -93.3<br />
Result before tax 9 198.9 -69.1 129.8 159.2 -42.0 117.2<br />
Share of result of entities accounted<br />
for using the equity method 7 0.7 - 0.7 0.6 - 0.6<br />
Tax expense 8 -27.7 12.5 -15.2 -32.5 8.3 -24.2<br />
Result from continuing operations 171.9 -56.6 115.3 127.3 -33.7 93.6<br />
Discontinued operations - - - - - -<br />
Result for the period 171.9 -56.6 115.3 127.3 -33.7 93.6<br />
Result attributable to:<br />
Equity holders of the Parent 9/29 136.4 -36.4 100.0 97.6 -21.4 76.2<br />
Minority interest 35.5 -20.2 15.3 29.7 -12.3 17.4<br />
Basic earnings per share (in EUR) 10 24.72 -6.61 18.11 17.68 -3.88 13.80<br />
Diluted earnings per share (in EUR) 10 24.62 -6.59 18.03 17.63 -3.87 13.76<br />
(1) As restated (see note 2).<br />
(2) See summary of significant accounting policies in note 2 and unusual items and re-measurements in note 9.<br />
46 D’Ieteren - Annual Report 2006
Consolidated Balance Sheet<br />
At 31 December<br />
in EUR million Notes 2006 2005<br />
Goodwill 11 644.4 572.0<br />
Other intangible assets 13 936.3 959.7<br />
Vehicles 14 778.7 722.7<br />
Other property, plant and equipment 15 339.5 334.3<br />
Investment property 16 6.5 6.1<br />
Equity accounted investments 7 11.6 11.8<br />
Available-for-sale financial assets 17 1.3 1.6<br />
Derivatives held for trading 19 6.8 -<br />
Long-term employee benefit assets 20 1.8 1.3<br />
Deferred tax assets 21 97.7 91.9<br />
Other receivables 22 2.4 1.0<br />
Non-current assets 2,827.0 2,702.4<br />
Non-current assets classified as held for sale 23 8.4 11.2<br />
Inventories 24 418.2 422.3<br />
Derivative hedging instruments 18 1.0 -<br />
Derivatives held for trading 19 11.1 10.3<br />
Other financial assets 25 48.1 18.5<br />
Current tax assets 26 17.3 14.4<br />
Trade and other receivables 27 1,643.2 1,617.4<br />
Cash and cash equivalents 28 155.9 118.7<br />
Current assets 2,303.2 2,212.8<br />
Total assets 5,130.2 4,915.2<br />
Capital and reserves attributable to equity holders 791.8 709.9<br />
Minority interest 232.0 235.6<br />
Equity 29 1,023.8 945.5<br />
Long-term employee benefit obligations 20 175.3 190.0<br />
Other provisions 30 146.1 105.0<br />
Derivative hedging instruments 18 42.3 52.8<br />
Borrowings 31/32 1,391.9 1,400.5<br />
Put options granted to minority shareholders 33 223.3 170.3<br />
Other payables 34 1.8 5.3<br />
Deferred tax liabilities 21 271.2 275.7<br />
Non-current liabilities 2,251.9 2,199.6<br />
Provisions 30 8.7 3.3<br />
Derivative hedging instruments 18 30.3 0.4<br />
Borrowings 31/32 624.2 575.7<br />
Derivatives held for trading 19 9.8 16.7<br />
Current tax liabilities 26 85.1 89.1<br />
Trade and other payables 35 1,096.4 1,084.9<br />
Current liabilities 1,854.5 1,770.1<br />
Total equity and liabilities 5,130.2 4,915.2<br />
CONSOLIDATED FINANCIAL STATEMENTS<br />
47
Consolidated Statement of Recognised<br />
Income and Expense<br />
Year ended 31 December<br />
in EUR million Notes 2006 2005 (1)<br />
Result for the period 115.3 93.6<br />
Income and expense recognised directly in equity<br />
Actuarial gains (losses) on employee benefit obligations 20 -1.1 -53.3<br />
Translation differences 0.2 -0.7<br />
Fair value of available-for-sale financial instruments -0.2 -0.6<br />
Cash flow hedges: fair value gains (losses) in equity -11.1 2.4<br />
Cash flow hedges: transferred to income statement 7.7 6.1<br />
Share-based payments 0.7 0.5<br />
Tax on items taken directly to equity 1.8 9.0<br />
Subtotal -2.0 -36.6<br />
Total recognised income and expense for the period 29 113.3 57.0<br />
being: attributable to equity holders of the Parent 29 99.0 52.6<br />
attributable to minority interest 29 14.3 4.4<br />
(1) As restated (see note 2).<br />
48 D’Ieteren - Annual Report 2006
Consolidated Cash Flow Statement<br />
Year ended 31 December<br />
in EUR million Notes 2006 2005<br />
Cash flows from operating activities<br />
Operating profit 239.7 210.5<br />
Depreciation of vehicles for rent-a-car and operating lease activities 5 211.5 179.4<br />
Depreciation of other items 5 57.7 51.4<br />
Amortisation of Avis licence rights 9 21.7 21.7<br />
Amortisation of other intangible assets 5 11.9 7.2<br />
Impairment losses on goodwill and other non-current assets 9 0.3 0.5<br />
Non-cash operating lease charge on buy-back agreements 5 171.4 190.4<br />
Other non-cash items 21.2 3.7<br />
Retirement benefit obligations -8.1 1.1<br />
Other cash items -1.2 -0.5<br />
Net payments with respect to vehicles purchased under buy-back agreements -121.8 -278.9<br />
Change in net working capital -32.8 19.1<br />
Cash generated from operations 571.5 405.6<br />
Tax paid -29.3 -20.8<br />
Net cash from operating activities 542.2 384.8<br />
Cash flows from investing activities<br />
Purchase of vehicles for rent-a-car and operating lease activities (1) -678.3 -663.5<br />
Sale of vehicles for rent-a-car and operating lease activities (1) 503.4 487.9<br />
Purchase of other items -81.4 -80.7<br />
Sale of other items 11.1 10.2<br />
Net capital expenditure -245.2 -246.1<br />
Acquisition of equity instruments 9/12 -32.2 -96.3<br />
Net investment in other financial assets 25 -31.6 54.7<br />
Net cash from investing activities -309.0 -287.7<br />
Cash flows from financing activities<br />
Net proceeds from rights issue 9 - 61.7<br />
Net acquisition of treasury shares 29 -3.8 0.7<br />
Net capital element of finance lease payments -100.7 -97.3<br />
Net change in other borrowings 44.8 102.2<br />
Net interest paid -111.3 -92.4<br />
Dividends paid by Parent -13.3 -12.8<br />
Dividends paid by subsidiaries -12.0 -16.6<br />
Net cash from financing activities -196.3 -54.5<br />
Total cash flow for the period 36.9 42.6<br />
Reconciliation with balance sheet<br />
Cash at beginning of period 28 98.9 55.3<br />
Cash equivalents at beginning of period 28 19.8 18.0<br />
Cash and cash equivalents at beginning of period 28 118.7 73.3<br />
Total cash flow for the period 36.9 42.6<br />
Translation differences 0.3 2.8<br />
Cash and cash equivalents at end of period 28 155.9 118.7<br />
(1) Excluding vehicles held under buy-back agreements.<br />
CONSOLIDATED FINANCIAL STATEMENTS<br />
49
Notes to the Consolidated<br />
Financial Statements<br />
Note 1: General Information<br />
s.a. D’Ieteren n.v. (the Company or the Parent) is a public company incorporated and domiciled in Belgium, whose controlling shareholders are<br />
listed in note 29. The address of the Company’s registered office is:<br />
Rue du Mail 50<br />
B-1050 Brussels<br />
The Company and its subsidiaries (together the Group) form an international group, active in three sectors of services to the motorist:<br />
- Automobile distribution in Belgium of Volkswagen, Audi, Seat, Skoda, Bentley, Lamborghini, Porsche, Yamaha and MBK;<br />
- Short-term car rental in Europe, Africa, the Middle East and Asia through Avis Europe plc and the Avis and Budget brands;<br />
- Vehicle glass repair and replacement in Europe, North and South America, Australia and New Zealand through Belron s.a. and notably its<br />
CARGLASS ® and AUTOGLASS ® brands.<br />
The Group is present in 110 countries on 5 continents.<br />
The Company is listed on Euronext.<br />
These consolidated financial statements have been approved for issue by the Board of Directors on 27 February 2007.<br />
The owners of the Company have the power to amend the consolidated financial statements after issue at the Annual General Meeting of<br />
Shareholders, which will be held on 31 May 2007.<br />
Note 2: Accounting Policies<br />
Note 2.1: Basis of Preparation<br />
These 2006 consolidated financial statements are for the 12 months ended 31 December 2006. They have been prepared in accordance with the<br />
International Financial Reporting Standards (“IFRS“) and the related International Financial Reporting Interpretations Committee (“IFRIC“)<br />
interpretations issued and effective, or issued and early adopted as at 31 December 2006 which have been adopted by the European Union<br />
(“EU“). They correspond to the standards and interpretations issued by the International Accounting Standards Board (“IASB”) and effective as at<br />
31 December 2006, since the elements of IAS 39 “carved out” by the EU are not applicable to the Group.<br />
The policies set out below have been consistently applied to all the periods presented since the comparative data were restated to reflect the<br />
revised IAS 21 “The Effects of Changes in Foreign Exchange Rates“ (see below).<br />
These consolidated financial statements have been prepared under the historical cost convention, as modified by the revaluation of available-forsale<br />
financial assets, and financial assets and liabilities held for trading (including derivative instruments) at fair value through profit or loss.<br />
These consolidated financial statements are prepared on an accruals basis and on the assumption that the Group is a going concern and will<br />
continue in operation for the foreseeable future.<br />
The preparation of the consolidated financial statements requires management to make estimates and assumptions that affect the reported<br />
amounts of revenue, expenses, assets and liabilities and disclosure of contingent assets and liabilities at the date of the financial statements. If in<br />
the future such estimates and assumptions, which are based on management’s best judgement at the date of the financial statements, deviate<br />
from the actual circumstances, the original estimates and assumptions will be modified as appropriate in the period in which the circumstances<br />
change. The areas involving a higher degree of judgement or complexity, or areas where assumptions and estimates are significant to the<br />
consolidated financial statements, are disclosed in the relevant notes.<br />
A summary of significant accounting policies is provided in note 2.2. The only significant accounting policy amended in 2006 is related to IAS 21<br />
“The Effects of Change in Foreign Exchange Rates”. The paragraphs added or amended in December 2005 became retrospectively applicable<br />
on 1 January 2006 following endorsement by the EU in May 2006. IAS 21 revised states that the net investment definition includes loans<br />
between sister companies, and requires certain inter-company items denominated in any currency to be included within net investment in a<br />
foreign operation. The application of the requirements of IAS 21 revised has resulted in the reclassification of foreign exchange movements on<br />
certain inter-company debt balances from the consolidated income statement to the consolidated statement of recognised income and expense.<br />
This reclassification concerns the Car Rental segment. Comparative amounts have been restated accordingly. The comparative amounts in<br />
respect of foreign exchange on debt recognised in the consolidated income statement have been reduced with a corresponding increase in the<br />
amount recorded in the consolidated statement of recognised income and expense. These restatements did not affect the capital and reserves<br />
attributable to equity holders. For the year ended 31 December 2005, in the Car Rental segment, the restatement reduced the foreign exchange<br />
result on debt recognised in the consolidated income statement (presented as unusual items and re-measurements in net finance costs)<br />
from a gain of EUR 9.6 million to a loss of EUR 0.1 million with a corresponding reduction in the tax charge related to unusual items and<br />
re-measurements from EUR 4.2 million to EUR 1.3 million. The net effect of these restatements on the result for the period amounts to a<br />
reduction of EUR 6.8 million (a reduction of EUR 4.1 million for the result for the period attributable to equity holders of the Parent).<br />
50 D’Ieteren - Annual Report 2006
Note 2: Accounting Policies (continued)<br />
Certain new standards, amendments and interpretations to existing standards have been published that are mandatory for the Group’s accounting<br />
periods beginning on or after 1 January 2007 or later periods but which the Group has not early adopted, as follows:<br />
- IFRS 7 “Financial Instruments: Disclosures” and amendment to IAS 1 “Presentation of Financial Statements – Capital Disclosures” (effective<br />
1 January 2007);<br />
- IFRS 8 “Operating Segments” (effective 1 January 2009, subject to endorsement by the EU);<br />
- IFRIC 7 “Applying the Restatement Approach under IAS 29 Financial Reporting in Hyperinflationary Economies“ (this interpretation is not relevant<br />
to the Group);<br />
- IFRIC 8 “Scope of IFRS 2” (effective 1 January 2007);<br />
- IFRIC 9 “Reassessment of Embedded Derivatives” (effective 1 January 2007);<br />
- IFRIC 10 “Interim Financial Reporting and Impairment” (effective 1 January 2007, subject to endorsement by the EU);<br />
- IFRIC 11 “IFRS 2 - Group and Treasury Share Transactions” (effective 1 March 2007, subject to endorsement by the EU);<br />
- IFRIC 12 “Service Concession Arrangements” (effective 1 January 2008, subject to endorsement by the EU).<br />
The Group is currently assessing the impact of the new standards, interpretations and amendments listed above.<br />
Note 2.2: Summary of Significant Accounting Policies<br />
The principal accounting policies applied in the preparation of these consolidated financial statements are set out below. These policies have been<br />
consistently applied to all the years presented, unless otherwise stated.<br />
The estimates of amounts reported in the interim financial reporting have not been changed significantly during the final interim period of the<br />
financial year.<br />
Principles of Consolidation<br />
Subsidiary undertakings<br />
Subsidiary undertakings, which are those entities in which the Group has, directly or indirectly, an interest of more than half of the voting rights or<br />
otherwise has the power to exercise control over the operations are consolidated. Subsidiaries are consolidated from the date that control is<br />
transferred to the Group, and are no longer consolidated from the date that control ceases. All inter-company transactions, balances and unrealised<br />
gains on transactions between group companies are eliminated upon consolidation.<br />
Associated undertakings<br />
Investments in associated undertakings are accounted for using the equity method. These are undertakings over which the Group generally has<br />
between 20% and 50% of the voting rights, or over which the Group has significant influence, but which it does not control. Unrealised gains on<br />
transactions between the Group and its associated undertakings are eliminated to the extent of the Group’s interest in the associated<br />
undertakings; unrealised losses are also eliminated. The Group’s investment in associated undertakings includes goodwill on acquisition. Equity<br />
accounting is discontinued when the carrying amount of the investment in an associated undertaking reaches zero, unless the Group has incurred<br />
obligations or guaranteed obligations in respect of the associated undertaking.<br />
Interests in joint ventures<br />
Interests in jointly controlled entities are recognised using the equity method. The above principles regarding associated undertakings are also<br />
applicable to joint ventures.<br />
Foreign Currency Translation<br />
The Group consolidation is prepared in euro. Income statements of foreign operations are translated into euro at the weighted average exchange<br />
rates for the period and balance sheets are translated into euro at the exchange rate ruling on the balance sheet date. Goodwill and fair value<br />
adjustments arising on the acquisition of a foreign entity are treated as local currency assets and liabilities of the foreign entity and are translated<br />
at the closing rate.<br />
Foreign currency transactions are accounted for at the exchange rate prevailing at the date of the transaction. Gains and losses resulting from<br />
the settlement of such transactions and from the translation of monetary assets and liabilities denominated in foreign currencies are recognised<br />
in the income statement. Exchange movements arising from the retranslation at closing rates of the Group’s net investment in subsidiaries, joint<br />
ventures and associates are taken to the translation reserve. The Group’s net investment includes the Group’s share of net assets of subsidiaries,<br />
joint ventures and associates, and certain inter-company loans. The net investment definition includes loans between “sister” companies and<br />
certain inter-company items denominated in any currency. Other exchange movements are taken to the income statement.<br />
Where the Group hedges net investments in foreign operations, the gains and losses relating to the effective portion of the hedging instrument<br />
are recognised in the translation reserve in equity. The gain or loss relating to any ineffective portion is recognised in the income statement.<br />
Gains and losses accumulated in equity are included in the income statement when the foreign operation is disposed of.<br />
CONSOLIDATED FINANCIAL STATEMENTS<br />
51
Note 2: Accounting Policies (continued)<br />
Goodwill<br />
Business combinations are accounted for by applying the purchase method. The excess of the cost of the business combination over the acquirer’s<br />
interest in the net fair value of the identifiable assets, liabilities and contingent liabilities recognised in accordance with IFRS 3 constitutes goodwill,<br />
and is recognised as an asset. In case this excess is negative, it is recognised immediately in the income statement. After initial recognition,<br />
goodwill is measured at cost less any accumulated impairment losses.<br />
Intangible Assets<br />
An item of intangible assets is valued at its cost less any accumulated amortisation and any accumulated impairment losses.<br />
Generally, costs associated with developing or maintaining computer software programmes are recognised as an expense as incurred. However,<br />
costs that are directly associated with identifiable and unique software products controlled by the Group which have probable economic benefits<br />
exceeding the cost beyond one year, are recognised as intangible assets.<br />
Intangible assets with a finite useful life are amortised over their useful life in accordance with the following methods:<br />
- Computer software programmes: straight-line method over 2 to 7 years.<br />
- Avis licence rights: straight-line method until 2036 (the licenses being held until that year).<br />
The brands CARGLASS ® and AUTOGLASS ® , acquired in 1999, as well as ELITE AUTO GLASS, GLASPRO , SPEEDY GLASS ® , APPLE AUTO<br />
GLASS ® , WINDSHIELD PROS and AUTO GLASS SPECIALISTS acquired in 2005, have indefinite useful lives, since there is no foreseeable<br />
limit to the period over which these assets are expected to generate net cash inflows for the Group. They are therefore not amortised but tested<br />
for impairment annually.<br />
For any intangible asset with a definite or indefinite useful life, where an indication of impairment exists, its carrying amount is assessed and<br />
written down immediately to its recoverable amount.<br />
Research and Development<br />
Expenditure on research (or on the research phase of an internal project) is recognised as an expense when it is incurred.<br />
An intangible asset arising from development (or from the development phase of an internal project) is recognised if, and only if, all of the following<br />
are demonstrated:<br />
(a) the technical feasibility of completing the intangible asset so that it will be available for use or sale;<br />
(b) the Group has the intention to complete the intangible asset and use or sell it;<br />
(c) the Group has ability to use or sell the intangible asset;<br />
(d) how the intangible asset will generate probable future economic benefits;<br />
(e) the availability of adequate technical, financial and other resources to complete the development and to use or sell the intangible asset;<br />
(f) the Group has the ability to measure reliably the expenditure attributable to the intangible asset during its development.<br />
Property, Plant and Equipment<br />
An item of property, plant and equipment is initially measured at cost. This cost comprises its purchase price (including import duties and nonrefundable<br />
purchase taxes, after deducting trade discounts and rebates), plus any costs directly attributable to bringing the asset to the location<br />
and condition necessary for it to be capable of operating. If applicable, the initial estimate of the cost of dismantling and removing the item and<br />
restoring the site is also included in the cost of the item. After initial recognition, the item is carried at its cost less any accumulated depreciation<br />
and any accumulated impairment losses. The depreciable amount of the item is allocated according to the straight-line method over its useful life.<br />
The main depreciation periods are the following:<br />
- Buildings: 40 to 50 years;<br />
- Plant and equipment: 3 to 15 years;<br />
- IT equipment: 2 to 7 years;<br />
- Leased assets: depending on the length of the lease.<br />
Straight-line depreciation on the vehicle fleet is based on the acquisition costs of the vehicles, estimates of their future residual values, and<br />
expected holding periods.<br />
Where the carrying amount of an asset is greater than its estimated recoverable amount, it is written down immediately to its recoverable amount.<br />
Leases<br />
Operating leases for which the Group is the lessor<br />
Assets leased out under operating leases (other than vehicles sold under buy-back agreements) are included in property, plant and equipment in<br />
the balance sheet. They are depreciated over their expected useful lives. Rental income is recognised on a straight-line basis over the lease term.<br />
52 D’Ieteren - Annual Report 2006
Note 2: Accounting Policies (continued)<br />
Operating leases for which the Group is the lessee<br />
Lease payments under operating leases are recognised as expenses in the income statement on a straight-line basis over the lease term.<br />
Finance leases for which the Group is the lessee<br />
Leases of property, plant and equipment where the Group has substantially all the risks and rewards of ownership are classified as finance leases.<br />
Finance leases are capitalised at the inception of the lease at the lower of the fair value of the leased property or the present value of the<br />
minimum lease payments. Each lease payment is allocated between the liability and the finance charge so as to achieve a constant rate of return<br />
on the finance balance outstanding. The corresponding rental obligations, net of finance charges, are included in borrowings. The interest element<br />
of the finance cost is charged to the income statement over the lease period. The leased assets are depreciated over their expected useful lives<br />
on a basis consistent with similar owned property, plant and equipment. If there is no reasonable certainty that ownership will be acquired by the<br />
end of the lease term, the asset is depreciated over the shorter of the lease term and its useful life.<br />
Vehicles sold under buy-back agreements<br />
Vehicles sold under buy-back agreements are accounted for as operating leases (lessor accounting), and are presented in the balance sheet under<br />
inventories. The difference between the sale price and the repurchase price (buy-back obligation) is considered as deferred income, while buy-back<br />
obligations are recognised in trade payables.<br />
Vehicles purchased under buy-back agreements<br />
Vehicles purchased under buy-back agreements are not recognised as assets since these arrangements are accounted for as operating leases<br />
(lessee accounting). The difference between the purchase price and the resale price (buy-back obligation of the supplier) is considered as deferred<br />
expense, while a trade receivable is recognised for the resale price.<br />
Investment Properties<br />
Investment properties are measured at cost less accumulated depreciation and accumulated impairment losses.<br />
Inventories<br />
Inventories are measured at the lower of cost and net realisable value. The cost of inventories comprises all costs of purchase, costs of conversion<br />
and other costs incurred in bringing the inventories to their location and condition at the balance sheet date. Items that are not interchangeable,<br />
like new vehicles and second-hand vehicles, are valued using specific identification of their individual costs. Other items are valued using the first<br />
in, first out or weighted average cost formula. When inventories are used, the carrying amount of those inventories are recognised as an expense<br />
in the period in which the related revenue is recognised. Losses and write-downs of inventories are recognised in the period in which they occur.<br />
Reversal of a write-down is recognised as a credit to cost of sales in the period in which the reversal occurs.<br />
Cash and Cash Equivalents<br />
Cash comprises cash on hand and demand deposits. Cash equivalents are short-term (maximum 3 months), highly liquid investments that are<br />
readily convertible to known amounts of cash and which are subject to an insignificant risk of changes in value.<br />
Equity<br />
Where the Company (or its subsidiaries) reacquires its own equity instruments, those instruments are deducted from equity as treasury shares.<br />
Where such equity instruments are subsequently sold, any consideration received is recognised in equity.<br />
Dividends to holders of equity instruments proposed or declared after the balance sheet date are not recognised as a liability at the balance sheet<br />
date; they are presented in equity.<br />
Provisions<br />
A provision is recognised when:<br />
- there is a present obligation (legal or constructive) as a result of a past event;<br />
- it is probable that an outflow of resources embodying economic benefits will be required to settle the obligation; and<br />
- a reliable estimate can be made of the amount of the obligation.<br />
If these conditions are not met, no provision is recognised.<br />
Post-employment Employee Benefits<br />
The Group has various defined benefit pension plans and defined contribution pension plans. Most of these plans are funded schemes, i.e. they<br />
are financed through a pension fund or an external insurance policy. The minimum funding level of these schemes is defined by national rules.<br />
Payments to defined contribution pension plans are charged as an expense as they fall due.<br />
CONSOLIDATED FINANCIAL STATEMENTS<br />
53
Note 2: Accounting Policies (continued)<br />
The Group’s commitments under defined benefit pension plans, and the related costs, are valued using the “projected unit credit method”, with<br />
actuarial valuations being carried out at least on a yearly basis. Actuarial gains and losses are recognised in full in the period in which they occur.<br />
They are recognised outside the income statement, and are presented in the statement of recognised income and expense. Past service cost is<br />
recognised immediately to the extent that the benefits have already vested, and otherwise is amortised on a straight-line basis over the average<br />
period until the benefits become vested.<br />
The long-term employee benefit obligation recognised in the balance sheet represents the present value of the defined benefit obligations as<br />
reduced by the fair value of scheme assets. Any asset resulting from this calculation is limited to past service cost, plus the present value of any<br />
refunds and reductions in future contributions to the plan.<br />
Financial Instruments Excluding Derivatives<br />
IAS 32 and 39 are applied to measure financial instruments:<br />
(a) Available-for-sale financial assets are measured at fair value through equity. Impairment losses are recorded in the income statement.<br />
(b) The carrying amount of treasury shares is deducted from equity.<br />
(c) Trade and other receivables are measured at their amortised cost using the effective interest method, as reduced by appropriate allowances for<br />
irrecoverable amounts.<br />
(d) Financial assets held for trading are measured at fair value.<br />
(e) Trade and other payables, as well as borrowings, are measured at amortised cost using the effective interest method.<br />
Financial Instruments – Derivatives<br />
Derivatives are used as hedges in the financing and financial risk management of the Group.<br />
IAS 32 and IAS 39 are applied. The Group’s activities expose it to the financial risks of changes in foreign currency exchange rates and interest<br />
rates. The Group uses foreign exchange forward contracts, interest rate swaps, cross currency interest rate swaps, and options to hedge these<br />
exposures. The Group does not use derivatives for speculative purposes. However, certain financial derivative transactions, while constituting<br />
effective economic hedges, do not qualify for hedge accounting under the specific rules in IAS 39.<br />
Derivatives are recorded initially at fair value. Unless accounted for as hedges, they are classified as held for trading and are subsequently<br />
measured at fair value.<br />
Changes in fair value of derivatives that do not qualify for hedge accounting are recognised in the income statement as they arise.<br />
Changes in the fair value of derivative financial instruments that are designated and effective as hedges of future cash flows are recognised<br />
directly in equity and any ineffective portion is recognised immediately in the income statement. If the cash flow hedge is a firm commitment or<br />
the forecasted transaction results in the recognition of an asset or a liability, then, at the time the asset or liability is recognised, the associated<br />
gains or losses on the derivative that had previously been recognised in equity are included in the initial measurement of the asset or liability. For<br />
hedges that do not result in the recognition of an asset or a liability, amounts deferred in equity are recognised in the income statement in the<br />
same period in which the hedged item affects net profit or loss.<br />
For an effective hedge of an exposure to changes in the fair value, the hedged item is adjusted for changes in fair value attributable to the risk<br />
being hedged with a corresponding entry in profit or loss. Gains or losses from re-measuring the derivative, or for non-derivatives the foreign<br />
currency component of its carrying amount, are recognised in profit or loss.<br />
Hedge accounting is discontinued when the hedging instrument expires or is sold, terminated, or exercised, or no longer qualifies for hedge<br />
accounting. At that time, any cumulative gain or loss recognised in equity is transferred to profit or loss in accordance with IAS 39.<br />
Derivatives embedded in other financial instruments or other host contracts are treated as separate derivatives when their risks and characteristics<br />
are not closely related to those of the host contracts, and the host contracts are not carried at fair value with unrealised gains or losses reported in<br />
income statement.<br />
Put Options Granted to Minority Shareholders<br />
The Group is committed to acquiring the minority shareholdings owned by third parties in Belron, should these third parties wish to exercise their<br />
put options. IAS 32 requires that the exercise price of such options granted to minority interest be reflected as a financial liability in the<br />
consolidated balance sheet. As of today, there remains some uncertainty regarding the treatment of the difference between the exercise price of<br />
the options (reflected in the financial liabilities) and the carrying value of the minority interest that must be reclassified within financial liabilities. In<br />
the absence of guidance from IFRIC, the Group has chosen to present such differences as additional goodwill. This goodwill is adjusted at period<br />
end to reflect the change in the exercise price of the options and the carrying value of minority interest to which they relate. This treatment<br />
reflects the economic substance of the transaction. However, this treatment may have to be modified if a new standard or interpretation were to<br />
suggest a different treatment.<br />
54 D’Ieteren - Annual Report 2006
Note 2: Accounting Policies (continued)<br />
Revenue Recognition<br />
Revenue from the sale of goods is recognised when all the following conditions have been satisfied:<br />
(a) the Group has transferred to the buyer the significant risks and rewards of ownership of the goods;<br />
(b) the Group retains neither continuing managerial involvement to the degree usually associated with ownership nor effective control over the<br />
goods sold;<br />
(c) the amount of revenue can be measured reliably;<br />
(d) it is probable that the economic benefits associated with the transaction will flow to the Group; and<br />
(e) the cost incurred or to be incurred in respect of transaction can be measured reliably.<br />
When the outcome of a transaction involving the rendering of services can be estimated reliably, revenue associated with the transaction is<br />
recognised by reference to the stage of completion of the transaction at the balance sheet date. The outcome of a transaction can be estimated<br />
reliably when all the following conditions are satisfied:<br />
(a) the amount of revenue can be measured reliably;<br />
(b) it is probable that the economic benefits associated with the transaction will flow to the Group;<br />
(c) the stage of completion of the transaction at the balance sheet date can be measured reliably; and<br />
(d) the cost incurred for the transaction and the costs to complete the transaction can be measured reliably.<br />
Interest is recognised on a time proportion basis that takes into account the effective yield on the asset. Royalties are recognised on an accrual<br />
basis in accordance with the substance of the relevant agreement. Dividends are recognised when the shareholder’s right to receive payment has<br />
been established.<br />
In the income statement, sales of goods, rendering of services and royalties are presented under the heading “sales”. Interest income is presented<br />
under the heading “net finance costs”.<br />
Share-Based Payments<br />
Share-based payments are exclusively made in connection with employee stock option plans (“ESOP”).<br />
For equity-settled ESOP, IFRS 2 is not applied to shares, share options or other equity instruments that were granted before or on 7 November<br />
2002 and which had not vested at 1 January 2004. Equity-settled ESOP granted after that date are accounted for in accordance with IFRS 2, such<br />
that their cost is recognised in the income statement over the related performance period.<br />
All cash-settled ESOP (i.e. granted before, on, or after 7 November 2002) are recognised as liabilities, and their cost is recognised in the income<br />
statement over the related performance period.<br />
Borrowing Costs<br />
Borrowing costs are recognised as an expense in the period in which they are incurred.<br />
Government Grants<br />
Government grants related to assets are presented in liabilities as deferred income, and amortised over the useful life of the related assets.<br />
Income Taxes<br />
Current taxes relating to current and prior periods are, to the extent unpaid, recognised as a liability. If the amount already paid in respect of<br />
current and prior periods exceeds the amount due for those periods, the excess is recognised as an asset. The benefit relating to a tax loss that<br />
can be carried back to recover current tax of a previous period is recognised as an asset.<br />
Deferred taxes are provided in full using the balance sheet liability method, on temporary differences between the carrying amount of assets and<br />
liabilities for financial reporting purposes and the amounts used for taxation purposes. Deferred taxes are not calculated on the following<br />
temporary differences: (i) the initial recognition of goodwill and (ii) the initial recognition of assets and liabilities that affects neither accounting nor<br />
taxable profit. The amount of deferred tax provided is based on the expected manner of realisation or settlement of the carrying amount of assets<br />
and liabilities, using tax rates enacted or substantially enacted at the balance sheet date. A deferred tax asset is recognised only to the extent that<br />
it is probable that future taxable profits will be available against which the unused tax losses and credits can be utilised. Deferred tax assets are<br />
reduced to the extent that it is no longer probable that the related tax benefit will be realised.<br />
CONSOLIDATED FINANCIAL STATEMENTS<br />
55
Note 2: Accounting Policies (continued)<br />
Unusual Items and Re-measurements<br />
Each line of the income statement, and each subtotal of the segment income statement, is broken down in order to provide information on the<br />
current result and on unusual items and re-measurements. Unusual items and re-measurements comprise the following items:<br />
(a) Recognised fair value gains and losses on financial instruments, excluding the accrued cash flows that occur under the Group’s hedging<br />
arrangements, where hedge accounting is unable to be applied under IAS 39.<br />
(b) Exchange gains and losses arising upon the translation of foreign currency borrowings at the closing rate.<br />
(c) Impairment of goodwill and other non-current assets.<br />
(d) Amortisation of the Avis licence rights.<br />
(e) Other unusual items. They are material items that derive from events or transactions that fall within the ordinary activities of the Group, and<br />
which individually or, if of a similar type, in aggregate, are separately disclosed by virtue of their size or incidence.<br />
All other items are recognised as part of the current result.<br />
Note 3: Segment information<br />
Note 3.1: Basis of Segmentation<br />
The Group’s primary segment reporting format is by business segment. Reportable business segments are Automobile Distribution, Car Rental<br />
and Vehicle Glass.<br />
The Automobile Distribution segment includes the <strong>auto</strong>mobile distribution activities (see note 1) as well as corporate activities. The Car Rental<br />
segment comprises Avis Europe plc and its subsidiaries, joint ventures and associates (see note 1). The Vehicle Glass segment comprises Belron s.a.<br />
and its subsidiaries (see note 1).<br />
This segmentation is consistent with the Group’s organisational and internal reporting structure.<br />
56 D’Ieteren - Annual Report 2006
Note 3: Segment information (continued)<br />
Note 3.2: Segment Income Statement - Business Segments (Year ended 31 December)<br />
in EUR million Notes 2006 2005 (1)<br />
Auto- Car Vehicle Elimi- Group Auto- Car Vehicle Elimi- Group<br />
mobile Rental Glass nations mobile Rental Glass nations<br />
Distri-<br />
Distribution<br />
bution<br />
External sales 4 2,491.4 1,336.3 1,507.3 5,335.0 2,227.2 1,276.4 1,253.7 4,757.3<br />
Inter-segment sales 3.0 0.8 2.5 -6.3 - 2.7 0.1 2.8 -5.6 -<br />
Segment sales 2,494.4 1,337.1 1,509.8 -6.3 5,335.0 2,229.9 1,276.5 1,256.5 -5.6 4,757.3<br />
Operating result (being segment result) 5 82.6 56.2 100.9 239.7 56.3 54.4 99.8 210.5<br />
of which: current items 5 81.9 105.9 119.9 307.7 56.1 100.4 99.2 255.7<br />
unusual items<br />
and re-measurements 5 0.7 -49.7 -19.0 -68.0 0.2 -46.0 0.6 -45.2<br />
Net finance costs -25.3 -67.7 -16.9 -109.9 -20.0 -61.3 -12.0 -93.3<br />
Result before taxes 9 57.3 -11.5 84.0 129.8 36.3 -6.9 87.8 117.2<br />
of which: current items 9 59.7 38.7 100.5 198.9 36.5 38.3 84.4 159.2<br />
unusual items<br />
and re-measurements 9 -2.4 -50.2 -16.5 -69.1 -0.2 -45.2 3.4 -42.0<br />
Share of result of entities<br />
accounted for using the equity method 7 0.2 0.5 - 0.7 0.6 - - 0.6<br />
Tax expense 8 -1.7 1.0 -14.5 -15.2 -0.8 -1.3 -22.1 -24.2<br />
Result from continuing operations 55.8 -10.0 69.5 115.3 36.1 -8.2 65.7 93.6<br />
of which: current items 57.1 28.0 86.8 171.9 35.5 28.1 63.7 127.3<br />
unusual items<br />
and re-measurements -1.3 -38.0 -17.3 -56.6 0.6 -36.3 2.0 -33.7<br />
Discontinued operations - - - - - - - -<br />
Result for the period 55.8 -10.0 69.5 115.3 36.1 -8.2 65.7 93.6<br />
Attributable to:<br />
Equity holders of the Parent 29 55.7 -5.7 50.0 100.0 35.8 -6.9 47.3 76.2<br />
of which: current items 9 57.0 16.7 62.7 136.4 35.2 16.6 45.8 97.6<br />
unusual items<br />
and re-measurements -1.3 -22.4 -12.7 -36.4 0.6 -23.5 1.5 -21.4<br />
Minority interest 0.1 -4.3 19.5 15.3 0.3 -1.3 18.4 17.4<br />
Result for the period 55.8 -10.0 69.5 115.3 36.1 -8.2 65.7 93.6<br />
(1) As restated (see note 2).<br />
CONSOLIDATED FINANCIAL STATEMENTS<br />
57
Note 3: Segment information (continued)<br />
Note 3.3: Segment Balance Sheet - Business Segments (At 31 December)<br />
in EUR million Notes 2006 2005<br />
Automobile Car Vehicle Group Automobile Car Vehicle Group<br />
Distribution Rental Glass Distribution Rental Glass<br />
Goodwill 11 0.2 7.9 636.3 644.4 0.2 7.8 564.0 572.0<br />
Other intangible assets 13 1.9 654.4 280.0 936.3 0.7 673.1 285.9 959.7<br />
Vehicles 14 273.1 505.6 - 778.7 258.7 464.0 - 722.7<br />
Other property, plant and equipment 15 134.8 85.3 119.4 339.5 136.4 85.4 112.5 334.3<br />
Investment property 16 6.5 - - 6.5 6.1 - - 6.1<br />
Equity accounted investments 7 1.4 10.2 - 11.6 1.2 10.6 - 11.8<br />
Available-for-sale financial assets 17 0.5 0.7 0.1 1.3 0.5 0.7 0.4 1.6<br />
Derivatives held for trading 19 - 6.8 - 6.8 - - - -<br />
Long-term employee benefit assets 20 - - 1.8 1.8 - - 1.3 1.3<br />
Deferred tax assets 21 1.0 70.5 26.2 97.7 0.4 60.7 30.8 91.9<br />
Other receivables 22 1.8 - 0.6 2.4 1.0 - - 1.0<br />
Non-current assets 421.2 1,341.4 1,064.4 2,827.0 405.2 1,302.3 994.9 2,702.4<br />
Non-current assets classified as held for sale 23 - 8.4 - 8.4 0.1 11.1 - 11.2<br />
Inventories 24 296.7 7.4 114.1 418.2 296.9 7.0 118.4 422.3<br />
Derivative hedging instruments 18 - 1.0 - 1.0 - - - -<br />
Derivatives held for trading 19 4.3 3.5 3.3 11.1 6.6 3.1 0.6 10.3<br />
Other financial assets 25 25.5 22.6 - 48.1 - 15.0 3.5 18.5<br />
Current tax assets 26 1.4 6.0 9.9 17.3 1.9 3.3 9.2 14.4<br />
Trade and other receivables 27 118.5 1,358.6 166.1 1,643.2 124.3 1,331.9 161.2 1,617.4<br />
Cash and cash equivalents 28 1.5 116.6 37.8 155.9 1.4 98.8 18.5 118.7<br />
Current assets 447.9 1,524.1 331.2 2,303.2 431.2 1,470.2 311.4 2,212.8<br />
Total assets 869.1 2,865.5 1,395.6 5,130.2 836.4 2,772.5 1,306.3 4,915.2<br />
of which: segment assets 833.5 2,627.6 1,318.3 4,779.4 824.4 2,580.3 1,243.3 4,648.0<br />
Capital and reserves attributable to equity holders 791.8 - - 791.8 709.9 - - 709.9<br />
Minority interest 1.7 225.3 5.0 232.0 1.7 230.4 3.5 235.6<br />
Equity 29 793.5 225.3 5.0 1,023.8 711.6 230.4 3.5 945.5<br />
Long-term employee benefit obligations 20 7.2 121.9 46.2 175.3 7.8 129.2 53.0 190.0<br />
Other provisions 30 35.4 64.6 46.1 146.1 30.4 52.3 22.3 105.0<br />
Derivative hedging instruments 18 - 42.3 - 42.3 - 52.8 - 52.8<br />
Borrowings 31/32 484.6 593.9 313.4 1,391.9 393.8 646.2 360.5 1,400.5<br />
Put options granted to minority shareholders 33 223.3 - - 223.3 170.3 - - 170.3<br />
Other payables 34 - - 1.8 1.8 - - 5.3 5.3<br />
Deferred tax liabilities 21 11.0 260.1 0.1 271.2 13.0 259.7 3.0 275.7<br />
Non-current liabilities 761.5 1,082.8 407.6 2,251.9 615.3 1,140.2 444.1 2,199.6<br />
Provisions 30 - - 8.7 8.7 - - 3.3 3.3<br />
Derivative hedging instruments 18 - 30.3 - 30.3 - 0.4 - 0.4<br />
Borrowings 31/32 28.4 515.1 80.7 624.2 144.4 390.6 40.7 575.7<br />
Derivatives held for trading 19 8.1 1.1 0.6 9.8 7.3 6.2 3.2 16.7<br />
Current tax liabilities 26 3.9 29.3 51.9 85.1 0.4 30.3 58.4 89.1<br />
Trade and other payables 35 167.8 671.2 257.4 1,096.4 186.2 657.3 241.4 1,084.9<br />
Current liabilities 208.2 1,247.0 399.3 1,854.5 338.3 1,084.8 347.0 1,770.1<br />
Total equity and liabilities 1,763.2 2,555.1 811.9 5,130.2 1,665.2 2,455.4 794.6 4,915.2<br />
of which: segment liabilities 210.4 857.7 360.2 1,428.3 224.4 838.8 325.3 1,388.5<br />
Segment assets, as defined by IAS 14, consist of goodwill, other intangible assets, vehicles, other property, plant and equipment, investment<br />
property, long-term employee benefit assets, non-current assets classified as held for sale, inventories, trade receivables and other receivables.<br />
Segment liabilities, as defined by IAS 14, comprise long-term employee benefit obligations, provisions, trade payables and other payables.<br />
58 D’Ieteren - Annual Report 2006
Note 3: Segment information (continued)<br />
Note 3.4: Segment Cash Flow Statement - Business Segments (Year ended 31 December)<br />
in EUR million Notes 2006 2005<br />
Automobile Car Vehicle Group Automobile Car Vehicle Group<br />
Distribution Rental Glass Distribution Rental Glass<br />
Cash flows from operating activities<br />
Operating profit 82.6 56.2 100.9 239.7 56.3 54.4 99.8 210.5<br />
Depreciation of vehicles for rent-a-car<br />
and operating lease activities 5 50.8 160.7 - 211.5 46.2 133.2 - 179.4<br />
Depreciation of other items 5 10.9 19.8 27.0 57.7 9.2 19.1 23.1 51.4<br />
Amortisation of Avis licence rights 9 - 21.7 - 21.7 - 21.7 - 21.7<br />
Amortisation of other intangible assets 5 - 5.2 6.7 11.9 0.6 1.3 5.3 7.2<br />
Impairment losses on goodwill and other<br />
non-current assets 9 - 0.3 - 0.3 - 0.5 - 0.5<br />
Non-cash operating lease charge<br />
on buy-back agreements 5 - 171.4 - 171.4 - 190.4 - 190.4<br />
Other non-cash items 0.8 -11.4 31.8 21.2 -0.5 3.2 1.0 3.7<br />
Retirement benefit obligations -0.3 -4.8 -3.0 -8.1 -0.9 3.2 -1.2 1.1<br />
Other cash items - -1.2 - -1.2 - -0.5 - -0.5<br />
Net payments with respect to vehicles purchased<br />
under buy-back agreements - -121.8 - -121.8 - -278.9 - -278.9<br />
Change in net working capital -13.0 -24.5 4.7 -32.8 12.4 30.2 -23.5 19.1<br />
Cash generated from operations 131.8 271.6 168.1 571.5 123.3 177.8 104.5 405.6<br />
Tax paid -0.5 -9.8 -19.0 -29.3 -0.8 -3.1 -16.9 -20.8<br />
Net cash from operating activities 131.3 261.8 149.1 542.2 122.5 174.7 87.6 384.8<br />
Cash flows from investing activities<br />
Purchase of vehicles for rent-a-car and operating<br />
lease activities (1) -185.7 -492.6 - -678.3 -167.9 -495.6 - -663.5<br />
Sale of vehicles for rent-a-car and operating<br />
lease activities (1) 123.7 379.7 - 503.4 118.1 369.8 - 487.9<br />
Purchase of other items -12.2 -29.8 -39.4 -81.4 -20.7 -22.7 -37.3 -80.7<br />
Sale of other items 2.1 2.1 6.9 11.1 3.1 5.1 2.0 10.2<br />
Net capital expenditure -72.1 -140.6 -32.5 -245.2 -67.4 -143.4 -35.3 -246.1<br />
Acquisition of equity instruments 9/12 - -0.3 -31.9 -32.2 -37.3 -1.3 -57.7 -96.3<br />
Net investment in other financial assets 25 -26.3 -8.2 2.9 -31.6 -0.2 58.4 -3.5 54.7<br />
Net cash from investing activities -98.4 -149.1 -61.5 -309.0 -104.9 -86.3 -96.5 -287.7<br />
Cash flows from financing activities<br />
Net proceeds from rights issue 9 - - - - -104.5 166.2 - 61.7<br />
Net acquisition of treasury shares 29 -3.8 - - -3.8 0.7 - - 0.7<br />
Net capital element of finance lease payments - -97.3 -3.4 -100.7 - -92.7 -4.6 -97.3<br />
Net change in other borrowings -23.4 71.6 -3.4 44.8 71.6 -42.4 73.0 102.2<br />
Net interest paid -22.9 -69.8 -18.6 -111.3 -17.2 -61.8 -13.4 -92.4<br />
Dividends paid by Parent -13.3 - - -13.3 -12.8 - - -12.8<br />
Dividends paid by subsidiaries 30.6 - -42.6 -12.0 44.9 - -61.5 -16.6<br />
Net cash from financing activities -32.8 -95.5 -68.0 -196.3 -17.3 -30.7 -6.5 -54.5<br />
Total cash flow for the period 0.1 17.2 19.6 36.9 0.3 57.7 -15.4 42.6<br />
Reconciliation with balance sheet<br />
Cash at beginning of period 28 1.4 79.0 18.5 98.9 1.1 21.3 32.9 55.3<br />
Cash equivalents at beginning of period 28 - 19.8 - 19.8 -12.8 18.0 12.8 18.0<br />
Cash and cash equivalents<br />
at beginning of period 28 1.4 98.8 18.5 118.7 -11.7 39.3 45.7 73.3<br />
Total cash flow for the period 0.1 17.2 19.6 36.9 0.3 57.7 -15.4 42.6<br />
Inter-segment transfer - - - - 12.8 - -12.8 -<br />
Translation differences - 0.6 -0.3 0.3 - 1.8 1.0 2.8<br />
Cash and cash equivalents at end of period 28 1.5 116.6 37.8 155.9 1.4 98.8 18.5 118.7<br />
(1) Excluding vehicles held under buy-back agreements.<br />
CONSOLIDATED FINANCIAL STATEMENTS<br />
59
Note 3: Segment information (continued)<br />
Note 3.5: Other Segment Information - Business Segments (Year ended 31 December)<br />
in EUR million 2006 2005<br />
Automobile Car Vehicle Group Automobile Car Vehicle Group<br />
Distribution Rental Glass Distribution Rental Glass<br />
Capital additions (1) 197.9 794.6 64.3 1,056.8 190.2 674.8 106.0 971.0<br />
(1) Capital additions include both additions and acquisitions through business combinations including goodwill.<br />
Besides depreciation and amortisation of segment assets (which are provided in note 5), the operating lease charges on buy-back agreements<br />
(also disclosed in note 5) and the charge arising from the long-term management incentive schemes are the other significant expenses deducted<br />
in measuring segment result.<br />
Note 3.6: Geographical segment information (Year ended 31 December)<br />
The Group’s three business segments operate in three main geographical areas, being Belgium (main market for the Automobile Distribution<br />
segment), the rest of Europe and the rest of world.<br />
in EUR million 2006 2005<br />
Belgium Rest of Rest of Group Belgium Rest of Rest of Group<br />
Europe world Europe world<br />
Segment sales from external customers (1) 2,394.4 2,521.6 419.0 5,335.0 2,185.8 2,282.2 289.3 4,757.3<br />
Segment assets (2) 910.4 3,672.3 196.7 4,779.4 888.6 3,537.3 222.1 4,648.0<br />
Capital additions (3) 201.0 838.6 17.2 1,056.8 190.5 749.1 31.4 971.0<br />
(1) Based on the geographical location of the customers.<br />
(2) Segment assets are defined above (see note 3.3).<br />
(3) Capital additions include both additions and acquisitions through business combinations including goodwill.<br />
Note 4: Sales<br />
in EUR million 2006 2005<br />
New vehicles 1,987.0 1,766.9<br />
Used cars 118.2 91.2<br />
Spare parts and accessories 141.1 137.2<br />
After-sales activities by D’Ieteren Car Centers 46.6 41.5<br />
D’Ieteren Sport 59.3 62.9<br />
D’Ieteren Lease 116.2 107.7<br />
Rental income under buy-back agreements 2.3 2.2<br />
Other sales 20.7 17.6<br />
Subtotal Automobile Distribution 2,491.4 2,227.2<br />
Avis 1,290.9 1,234.6<br />
Budget 45.4 41.8<br />
Subtotal Car Rental 1,336.3 1,276.4<br />
Vehicle Glass 1,507.3 1,253.7<br />
Sales (external) 5,335.0 4,757.3<br />
of which: sales of goods 2,437.1 2,170.8<br />
rendering of services 2,859.2 2,552.3<br />
royalties 38.7 34.2<br />
Interest income and dividend income (if any) are presented among net finance costs (see note 6).<br />
60 D’Ieteren - Annual Report 2006
Note 5: Operating result<br />
Operating result is stated after charging:<br />
in EUR million 2006 2005<br />
Automobile Car Vehicle Group Automobile Car Vehicle Group<br />
Distribution Rental Glass Distribution Rental Glass<br />
Current items:<br />
Purchases and changes in inventories -2,106.1 -66.5 -401.3 -2,573.9 -1,888.6 -61.0 -352.1 -2,301.7<br />
Depreciation of vehicles -50.8 -160.7 - -211.5 -46.2 -133.2 - -179.4<br />
Depreciation of other items<br />
(excl. investment property) -10.4 -19.8 -27.0 -57.2 -8.9 -19.1 -23.1 -51.1<br />
Amortisation (excl. on Avis licence rights) - -5.2 -6.7 -11.9 -0.6 -1.3 -5.3 -7.2<br />
Operating lease charge on buy-back agreements - -171.4 - -171.4 - -190.4 - -190.4<br />
Contingent operating lease rentals (1) - -51.8 - -51.8 - -49.0 - -49.0<br />
Other operating lease rentals - -120.2 -69.4 -189.6 - -95.0 -64.1 -159.1<br />
Write-down on inventories -0.2 - -1.0 -1.2 -3.8 - -1.3 -5.1<br />
Net gain (loss) on vehicles 3.1 22.9 - 26.0 2.7 6.2 - 8.9<br />
Employee benefit expenses (see note 36) -107.5 -296.8 -513.0 -917.3 -101.6 -283.7 -401.4 -786.7<br />
Research and development expenditure - - -1.3 -1.3 - - -1.6 -1.6<br />
Sundry -139.0 -355.5 -369.7 -864.2 -123.8 -345.0 -305.4 -774.2<br />
Other operating expenses:<br />
Bad and doubtful debts 0.5 -5.4 -0.1 -5.0 -0.3 -4.5 -0.9 -5.7<br />
Investment property expenses:<br />
Depreciation -0.5 - - -0.5 -0.3 - - -0.3<br />
Operating expenses (2) -0.1 - - -0.1 -0.1 - - -0.1<br />
Sundry -0.3 - - -0.3 -0.5 - -0.1 -0.6<br />
Subtotal other operating expenses -0.4 -5.4 -0.1 -5.9 -1.2 -4.5 -1.0 -6.7<br />
Other operating income:<br />
Gain on property, plant and equipment 1.0 - 1.7 2.7 0.1 - 0.8 0.9<br />
Rental income from investment property (3) 0.6 - - 0.6 0.5 - - 0.5<br />
Sundry 0.2 - 0.4 0.6 0.3 - - 0.3<br />
Subtotal other operating income 1.8 - 2.1 3.9 0.9 - 0.8 1.7<br />
Subtotal current items -2,409.5 -1,230.4 -1,387.4 -5,027.3 -2,171.1 -1,176.0 -1,154.5 -4,501.6<br />
Unusual items and re-measurements (see note 9) 0.7 -49.7 -19.0 -68.0 0.2 -46.0 0.6 -45.2<br />
Net operating expenses -2,408.8 -1,280.1 -1,406.4 -5,095.3 -2,170.9 -1,222.0 -1,153.9 -4,546.8<br />
(1) Contingent rentals primarily arise with respect to airport rental desk concessions, and are ordinarily based on the level of revenue generated by the individual concession.<br />
(2) The full amount is related to investment property that generated rental income.<br />
(3) Does not include any contingent rent.<br />
CONSOLIDATED FINANCIAL STATEMENTS<br />
61
Note 6: NET FINANCE COSTS<br />
Net finance costs are broken down as follows:<br />
in EUR million 2006 2005 (1)<br />
Automobile Car Vehicle Group Automobile Car Vehicle Group<br />
Distribution Rental Glass Distribution Rental Glass<br />
Current items:<br />
Finance costs:<br />
Interest expense -23.4 -70.5 -19.5 -113.4 -18.5 -61.9 -14.7 -95.1<br />
Transfer from re-measurements 0.1 -1.0 -0.7 -1.6 -1.2 -2.1 -2.0 -5.3<br />
Current interest expense -23.3 -71.5 -20.2 -115.0 -19.7 -64.0 -16.7 -100.4<br />
Other financial charges -0.2 - - -0.2 -0.3 - - -0.3<br />
Subtotal finance costs -23.5 -71.5 -20.2 -115.2 -20.0 -64.0 -16.7 -100.7<br />
Finance income 1.3 4.3 0.8 6.4 0.4 1.9 1.9 4.2<br />
Current net finance costs -22.2 -67.2 -19.4 -108.8 -19.6 -62.1 -14.8 -96.5<br />
Unusual items and re-measurements (see note 9):<br />
Unusual items - - 0.1 0.1 - - 0.2 0.2<br />
Re-measurements of financial instruments:<br />
Gains (Losses) on “dirty” fair value<br />
of derivatives (2) -3.0 -2.4 1.7 -3.7 -1.6 -1.2 0.6 -2.2<br />
Transfer to current items -0.1 1.0 0.7 1.6 1.2 2.1 2.0 5.3<br />
Subtotal gains (losses) on “clean” fair value<br />
of derivatives (2) -3.1 -1.4 2.4 -2.1 -0.4 0.9 2.6 3.1<br />
Foreign exchange gain (loss) on net debt - 0.9 - 0.9 - -0.1 - -0.1<br />
Unusual items and re-measurements -3.1 -0.5 2.5 -1.1 -0.4 0.8 2.8 3.2<br />
Net finance costs -25.3 -67.7 -16.9 -109.9 -20.0 -61.3 -12.0 -93.3<br />
(1) As restated (see note 2).<br />
(2) Change in “dirty” fair value of derivatives corresponds to the change of value of the derivatives between the beginning and the end of the period. Change in “clean” fair value of derivatives<br />
corresponds to the change of “dirty” fair value excluding the accrued cash flows of the derivatives that occured during the period.<br />
Note 7: Entities accounted for using the equity method<br />
Three group entities are accounted for using the equity method.<br />
D’Ieteren Vehicle Trading s.a. is a 49%-owned associate which provides finance lease services to customers of the Automobile Distribution segment.<br />
At year end, the Automobile Distribution’s interest in this associate comprised:<br />
in EUR million 2006 2005<br />
Share of gross assets 24.4 21.0<br />
Share of gross liabilities -23.0 -19.8<br />
Share of net assets 1.4 1.2<br />
Share of sales 6.0 4.9<br />
Share of profit (loss) 0.2 0.6<br />
62 D’Ieteren - Annual Report 2006
Note 7: Entities accounted for using the equity method (continued)<br />
Mercury Car Rentals Ltd is a 33%-owned associate of Avis Europe plc which provides short-term car rental services in India under the Avis brand.<br />
At year end, the Car Rental’s interest in this associate comprised:<br />
in EUR million 2006 2005<br />
Share of gross assets (incl. goodwill) 2.5 2.1<br />
Share of gross liabilities -2.2 -1.9<br />
Share of net assets 0.3 0.2<br />
Share of sales 3.1 2.6<br />
Share of profit (loss) 0.1 -<br />
Anji Car Rental and Leasing Company Ltd is a 50%-owned joint venture of Avis Europe plc which provides short-term car rental services in China<br />
under the Avis brand. At year end, the Car Rental’s interest in this joint venture comprised:<br />
in EUR million 2006 2005<br />
Share of non-current assets (incl. goodwill) 17.2 17.5<br />
Share of current assets 2.4 2.4<br />
Share of current liabilities -9.7 -9.5<br />
Share of net assets 9.9 10.4<br />
Share of sales 12.0 9.1<br />
Share of profit (loss) 0.4 -<br />
Note 8: TAX EXPENSE<br />
Tax expense is broken down as follows:<br />
in EUR million 2006 2005 (1)<br />
Automobile Car Vehicle Group Automobile Car Vehicle Group<br />
Distribution Rental Glass Distribution Rental Glass<br />
Current year income tax -4.7 -5.8 -15.8 -26.3 -1.1 -7.1 -19.4 -27.6<br />
Prior year income tax 0.3 - 3.4 3.7 0.2 -0.4 -2.6 -2.8<br />
Movement in deferred taxes 2.7 6.8 -2.1 7.4 0.1 6.2 -0.1 6.2<br />
Tax expense -1.7 1.0 -14.5 -15.2 -0.8 -1.3 -22.1 -24.2<br />
of which: current items -2.8 -11.2 -13.7 -27.7 -1.6 -10.2 -20.7 -32.5<br />
unusual items and re-measurements<br />
(see note 9) 1.1 12.2 -0.8 12.5 0.8 8.9 -1.4 8.3<br />
(1) As restated (see note 2).<br />
The relationship between tax expense and accounting profit is explained below:<br />
in EUR million 2006 2005 (1)<br />
Automobile Car Vehicle Group Automobile Car Vehicle Group<br />
Distribution Rental Glass Distribution Rental Glass<br />
Result before taxes 57.3 -11.5 84.0 129.8 36.3 -6.9 87.8 117.2<br />
Tax at the Belgian corporation tax rate of 33.99% -19.5 3.9 -28.6 -44.2 -12.4 2.3 -29.9 -40.0<br />
Reconciling items<br />
(sum of items marked (a) and (b) below) 17.8 -2.9 14.1 29.0 11.6 -3.6 7.8 15.8<br />
Actual tax on result before taxes -1.7 1.0 -14.5 -15.2 -0.8 -1.3 -22.1 -24.2<br />
(1) As restated (see note 2).<br />
CONSOLIDATED FINANCIAL STATEMENTS<br />
63
Note 8: TAX EXPENSE (continued)<br />
The reconciling items are provided below:<br />
in EUR million 2006 2005 (1)<br />
Automobile Car Vehicle Group Automobile Car Vehicle Group<br />
Distribution Rental Glass Distribution Rental Glass<br />
Current PBT 59.7 38.7 100.5 198.9 36.5 38.3 84.4 159.2<br />
Tax at the Belgian corporation tax rate<br />
of 33.99% -20.3 -13.1 -34.2 -67.6 -12.4 -13.0 -28.7 -54.1<br />
Rate differential (a) - 5.4 1.7 7.1 14.9 6.5 1.1 22.5<br />
Permanent differences (a) 21.9 -2.9 7.6 26.6 -1.7 -2.1 2.9 -0.9<br />
Utilisation of tax losses (a) - - 10.1 10.1 - 13.2 6.6 19.8<br />
Other temporary differences (a) 0.1 - - 0.1 0.1 - - 0.1<br />
Adjustments in respect of prior years (a) 1.4 8.1 2.9 12.4 -0.1 -4.6 -2.6 -7.3<br />
Deferred tax assets not recognised (a) -5.3 -7.5 -1.8 -14.6 -1.1 -10.0 -1.1 -12.2<br />
Impact of dividends (a) -0.5 - - -0.5 -1.6 - 1.1 -0.5<br />
Other (a) -0.1 -1.2 - -1.3 0.3 -0.2 - 0.1<br />
Actual tax on current PBT -2.8 -11.2 -13.7 -27.7 -1.6 -10.2 -20.7 -32.5<br />
Actual tax rate on current PBT 5% 29% 14% 14% 4% 27% 25% 20%<br />
Unusual items and re-measurements in PBT -2.4 -50.2 -16.5 -69.1 -0.2 -45.2 3.4 -42.0<br />
Tax at the Belgian corporation tax rate<br />
of 33.99% 0.8 17.1 5.6 23.5 0.1 15.3 -1.2 14.2<br />
Rate differential (b) - -1.8 0.5 -1.3 - -1.4 0.8 -0.6<br />
Permanent differences (b) - -3.4 - -3.4 - -2.6 -1.0 -3.6<br />
Adjustments in respect of prior years (b) 0.1 - - 0.1 - - - -<br />
Deferred tax assets not recognised (b) - 0.3 -6.9 -6.6 - -0.6 - -0.6<br />
Permanent difference due to rights issue<br />
(see note 9 item (e)) (b) - - - - - -1.8 - -1.8<br />
Other (b) 0.2 - - 0.2 0.7 - - 0.7<br />
Actual tax on unusual items<br />
and re-measurements in PBT 1.1 12.2 -0.8 12.5 0.8 8.9 -1.4 8.3<br />
(1) As restated (see note 2).<br />
Note 9: UNUSUAL ITEMS AND RE-MEASUREMENTS<br />
Result for the Period<br />
Current result after tax (“current PAT”) consists of the reported profit from continuing operations (or the result for the period when no discontinued<br />
operation is reported), excluding unusual items and re-measurements as defined in note 2, and excluding their tax impact.<br />
Current result before tax (“current PBT”) consists of the reported result before tax excluding unusual items and re-measurements as defined in<br />
note 2.<br />
Current PAT, Group’s share, and current PBT, Group’s share, exclude the share of minority shareholders in current PAT and current PBT.<br />
64 D’Ieteren - Annual Report 2006
Note 9: UNUSUAL ITEMS AND RE-MEASUREMENTS (continued)<br />
Current result is a non-GAAP measure, i.e. its definition is not addressed by IFRS. The Group does not represent current result as an alternative to<br />
financial measures determined in accordance with IFRS. Current result as reported by the Group may differ from similarly titled measures by other<br />
companies. The Group uses the concept of current result to reflect its underlying performance.<br />
in EUR million 2006 2005 (1)<br />
Automobile Car Vehicle Group Automobile Car Vehicle Group<br />
Distribution Rental Glass Distribution Rental Glass<br />
From reported PBT to current PBT,<br />
Group’s share:<br />
Reported PBT 57.3 -11.5 84.0 129.8 36.3 -6.9 87.8 117.2<br />
Less: Unusual items and re-measurements in PBT:<br />
Re-measurements of financial instruments 3.1 (a) 0.2 (b) -3.1 (f) 0.2 0.4 4.4 -2.6 2.2<br />
Foreign exchange - -0.9 (c) - -0.9 - 0.1 - 0.1<br />
Impairment losses on goodwill - 0.3 (d) - 0.3 - 0.5 - 0.5<br />
Amortisation of Avis licence rights - 21.7 - 21.7 - 21.7 - 21.7<br />
Other unusual items -0.7 28.9 (e) 19.6 (g) 47.8 -0.2 18.5 -0.8 17.5<br />
Current PBT 59.7 38.7 100.5 198.9 36.5 38.3 84.4 159.2<br />
Share of minority interest in current PBT -0.2 -15.6 -28.5 -44.3 -0.4 -15.6 -24.6 -40.6<br />
Current PBT, Group’s share 59.5 23.1 72.0 154.6 36.1 22.7 59.8 118.6<br />
From current PBT, Group’s share,<br />
to current PAT, Group’s share:<br />
Current PBT, Group’s share 59.5 23.1 72.0 154.6 36.1 22.7 59.8 118.6<br />
Share of the group in current result<br />
of equity accounted entities 0.2 0.3 - 0.5 0.6 - - 0.6<br />
Tax on current PBT, Group’s share -2.7 -6.7 -9.3 -18.7 -1.5 -6.1 -14.0 -21.6<br />
Current PAT, Group’s share 57.0 16.7 62.7 136.4 35.2 16.6 45.8 97.6<br />
(1) As restated (see note 2).<br />
Automobile Distribution<br />
(a) Net finance costs include re-measurements of financial instruments amounting to EUR -3.1 million (2005: EUR -0.4 million) arising from<br />
changes in the “clean” fair value of derivatives.<br />
Car Rental<br />
(b) Net finance costs and commercial and administrative expenses include re-measurements of financial instruments amounting to respectively<br />
EUR -1.4 million (2005: EUR 0.9 million) and EUR 1.2 million (2005: EUR -5.3 million) arising from changes in the “clean” fair value of derivatives.<br />
(c) Foreign exchange gain on net debt amounts to EUR 0.9 million (2005: loss of EUR 0.1 million after application of IAS 21 revised – see note 2),<br />
recognised in net finance costs.<br />
(d) An impairment charge of EUR 0.3 million was recognised in 2006 following the acquisition during the year of several Avis licensee locations<br />
in Germany (see note 12) which have been integrated into existing operations. Given that goodwill arising in the overall German cashgenerating<br />
unit had been fully provided against in previous accounting periods, an impairment provision has been recognised against the<br />
goodwill arising in 2006. This impairment provision writes down the carrying value of the associated goodwill to nil and is presented in other<br />
operating expenses. A similar impairment charge, amounting to EUR 0.5 million, was recorded in 2005 due to the acquisition of licensee<br />
locations in France (Budget) and Holland (Avis).<br />
(e) Other unusual items of the Car Rental segment are set out below:<br />
- Restructuring costs of EUR 25.3 million (2005: EUR 6.4 million) were incurred in the year in connection with the restructuring project Avis Europe<br />
commenced in late 2005 covering the roles of its European headquarters, corporate operations, shared service centre and call centres. These<br />
restructuring costs include redundancy costs and onerous lease provisions and are net of unusual pension curtailments of EUR 1.2 million (2005:<br />
nil). Restructuring costs of EUR 2.0 million in 2005 were also incurred in connection with the transfer of back-office functions to the Group’s shared<br />
service centre in Budapest. Restructuring costs are presented in other operating expenses, pension curtailments in other operating income.<br />
- Following Avis Europe’s decision in 2004 to terminate the agreement with the principal contractor on the IT back-office project, additional<br />
termination costs of EUR 7.4 million (2005: EUR 3.6 million) have been recognised in 2006, primarily arising from the mitigating action being<br />
taken against the termination costs, which may lead to a net credit in future accounting periods. Termination costs are presented in other<br />
operating expenses.<br />
CONSOLIDATED FINANCIAL STATEMENTS<br />
65
Note 9: UNUSUAL ITEMS AND RE-MEASUREMENTS (continued)<br />
- In June 2006, significant changes were made to the unfunded pension scheme in Germany resulting in an unusual credit to past service<br />
costs of EUR 3.2 million (2005: nil). This is presented in other operating income.<br />
- During the current and prior year, the collection of credit hire receivable balances in the closed Centrus business was more successful than<br />
previously anticipated and resulted in an unusual credit (in other operating income) of EUR 0.6 million (2005: EUR 3.2 million), reflecting a<br />
partial reversal of the receivable write-offs and adjustment of reorganisation provisions made in previous years.<br />
- In 2005, various professional, legal and consultancy costs were incurred in conjunction with Avis Europe’s capital restructuring and the<br />
rights issue (see note 9 of the 2005 annual report). Where such costs were not directly attributable to the issue of new shares, or the<br />
drawing down of new debt facilities, they were recognised in the income statement as unusual items (in other operating expenses). In<br />
addition to the costs expensed by Avis Europe (EUR 4.4 million), the Group recognised a EUR 5.3 million unusual charge, representing its<br />
share in the difference between the gross and the net proceeds of the rights issue. The minority share in this difference was deducted from<br />
minority interest in equity.<br />
Vehicle Glass<br />
(f) Net finance costs and cost of sales include re-measurements of financial instruments amounting to respectively EUR 2.4 million (2005:<br />
EUR 2.6 million) and EUR 0.7 million (2005: nil) arising from changes in the “clean” fair value of derivatives.<br />
(g) Other unusual items of the Vehicle Glass segment are set out below:<br />
- Unusual costs of EUR 22.3 million (in other operating expenses) were incurred in 2006 and comprise EUR 20.2 million one-off costs related<br />
to the integration and transformation programme underway in North America aimed at improving operating margins of recent acquisitions,<br />
as well as EUR 2.1 million arising from the decision to close the manufacturing operations in Australia. Restructuring costs amounted to<br />
EUR 1.7 million in 2005.<br />
- Significant changes were made to the funded pension scheme in Holland resulting in an unusual curtailment credit of EUR 2.6 million (2005: nil).<br />
This is presented in other operating income.<br />
- Other unusual items in net finance costs include realised gains on disposals of financial assets amounting to EUR 0.1 million (2005: EUR 0.2 million).<br />
- In 2005, an unusual reversal (in other operating income) of EUR 2.1 million was booked to bring a provision previously set up to cover the<br />
cash settlement of the former management share option scheme in line with the amounts due, while sundry unusual items (in other<br />
operating income) amounted to EUR 0.2 million.<br />
Cash Flows<br />
The line “acquisition of equity instruments” includes the business combinations disclosed in note 12.<br />
The net cash from operating activities for the period to 31 December 2005 includes the actual cash settlement of the management share option<br />
scheme of Belron, amounting to EUR 17.2 million.<br />
In July 2005, Avis Europe plc raised EUR 166.2 million, net of expenses by way of a rights issue to qualifying shareholders. The Group subscribed<br />
its share of the capital increase, i.e. EUR 104.5 million. In the 2005 cash flow statement, only the share subscribed by minority shareholders of<br />
Avis Europe impacts the line “net proceeds from rights issue”.<br />
Note 10: Earnings per share<br />
Earnings per share (“EPS”) are shown above, on the face of the consolidated income statement.<br />
Basic and diluted EPS are based on the profit for the period attributable to equity holders of the Parent, after adjustment for participating shares (each<br />
participating share confers one voting right and gives right to a dividend equal to one eighth of the dividend of an ordinary share). Current EPS, which<br />
do not include unusual items and re-measurements as defined in note 9, are presented to highlight underlying trading performance.<br />
The weighted average number of ordinary shares in issue for the period is shown in the table below.<br />
The Group has granted options to employees over ordinary shares of the Parent and of Avis Europe plc. Such shares constitute the only category<br />
of potentially dilutive ordinary shares.<br />
The options over ordinary shares of Avis Europe did not impact earnings per share in either 2005 or 2006 as either the option exercise prices were<br />
in excess of the prevailing market share price, or exercise of the options is subject to performance conditions which had not been fully satisfied by<br />
the year end.<br />
The options over ordinary shares of the Parent increased the weighted average number of shares of the Parent in 2005 and 2006 as some option<br />
exercise prices were below the market share price. These options are dilutive.<br />
66 D’Ieteren - Annual Report 2006
Note 10: Earnings per share (continued)<br />
The computation of basic and diluted EPS is set out below:<br />
2006 2005 (1)<br />
Result for the period attributable to equity holders 100.0 76.2<br />
Adjustment for participating shares -1.2 -0.9<br />
Numerator for EPS (in EUR million) (a) 98.8 75.3<br />
Current result for the period attributable to equity holders 136.4 97.6<br />
Adjustment for participating shares -1.5 -1.1<br />
Numerator for current EPS (in EUR million) (b) 134.9 96.5<br />
Weighted average number of ordinary shares outstanding during the period (c) 5,456,239 5,458,062<br />
Adjustment for stock option plans 22,826 14,993<br />
Weighted average number of ordinary shares taken into account for diluted EPS (d) 5,479,065 5,473,055<br />
Basic EPS (in EUR) (a)/(c) 18.11 13.80<br />
Diluted EPS (in EUR) (a)/(d) 18.03 13.76<br />
Basic current EPS (in EUR) (b)/(c) 24.72 17.68<br />
Diluted current EPS (in EUR) (b)/(d) 24.62 17.63<br />
(1) As restated (see note 2).<br />
Note 11: Goodwill<br />
in EUR million 2006 2005<br />
Gross amount at 1 January 615.1 504.7<br />
Accumulated impairment losses at 1 January -43.1 -42.6<br />
Carrying amount at 1 January 572.0 462.1<br />
Additions 18.0 39.4<br />
Increase arising from put options granted to minority shareholders (see note 33) 47.3 69.7<br />
Impairment losses -0.3 -0.5<br />
Adjustments 10.1 1.3<br />
Translation differences -2.7 -<br />
Carrying amount at 31 December 644.4 572.0<br />
of which: gross amount 687.8 615.1<br />
accumulated impairment losses -43.4 -43.1<br />
The additions arising from business combinations that occurred in the period are detailed in note 12.<br />
The adjustments result from subsequent changes in the goodwill on the 2005 acquisitions. This goodwill was increased by EUR 10.1 million<br />
reflecting fair value adjustments made to the initial valuations disclosed in note 12 of the 2005 annual report. This increase reflects changes in the fair<br />
value of intangible assets (decrease of EUR 5.7 million), other net assets (decrease of EUR 2.5 million) and consideration (increase of EUR 1.9 million).<br />
In accordance with the requirements of IAS 36 “Impairment of Assets”, the Group completed a review of the carrying value of goodwill and of<br />
the other intangible assets with indefinite useful lives (see note 13) as at each year end. The impairment review, undertaken by calculating value<br />
in use, was carried out to ensure that the carrying value of the Group’s assets are stated at no more than their recoverable amount, being the<br />
higher of fair value less costs to sell and value in use. The impairment losses of 2006 and 2005 arose in the Car Rental segment (see note 9).<br />
CONSOLIDATED FINANCIAL STATEMENTS<br />
67
Note 11: Goodwill (continued)<br />
In determining the value in use, the Group calculated the present value of the estimated future cash flows expected to arise from the continuing<br />
use of the assets using pre-tax discount rates in the range from 7% to 10% (2005: from 7% to 11%). The discount rate applied is based upon<br />
the weighted average cost of capital of each segment with appropriate adjustment for the relevant risks associated with the businesses.<br />
Estimated future cash flows are based on long-term plans (i.e. over 4 or 5 years) for each cash generating unit, with extrapolation thereafter<br />
based on long-term average growth rates for the individual cash generating units. This growth rate is in the range from 2% to 3% (2005: 2% to<br />
3%) for most of the units, including the ones that carry the most significant goodwill and intangible assets with indefinite useful lives.<br />
Future cash flows are estimates that are likely to be revised in future periods as underlying assumptions change. Key assumptions in supporting<br />
the value of goodwill and intangible assets with indefinite useful lives include long-term interest rates and other market data. Should the<br />
assumptions vary adversely in the future, the value in use of goodwill and intangible assets with indefinite useful lives may reduce below their<br />
carrying amounts. Based on current valuations, headroom appears to be sufficient to absorb a normal variation in the underlying assumptions.<br />
The allocation of goodwill to cash generating units is set out below (the allocation of other intangible assets with indefinite useful lives is set out in<br />
note 13):<br />
in EUR million 2006 2005<br />
Automobile Distribution 0.2 0.2<br />
Car Rental:<br />
Greece 7.9 7.8<br />
China (presented in equity-accounted investments, see note 7) 0.9 0.9<br />
Vehicle Glass:<br />
United Kingdom 97.1 95.1<br />
France 64.8 64.8<br />
Italy 52.7 48.5<br />
Germany 46.8 46.6<br />
Canada 32.2 29.5<br />
Holland 29.1 29.1<br />
Belgium 27.1 27.1<br />
Australia 24.8 24.8<br />
United States 18.1 7.1<br />
Spain 14.6 13.5<br />
Norway 7.1 7.1<br />
New Zealand 6.4 6.4<br />
Greece 3.6 -<br />
Sweden 3.2 2.9<br />
Switzerland 2.0 2.0<br />
Portugal 1.2 1.2<br />
Denmark 0.8 0.8<br />
Unallocated 204.7 157.5<br />
Subtotal Vehicle Glass 636.3 564.0<br />
Group 645.3 572.9<br />
The unallocated amount in the Vehicle Glass segment comes from the acquisition of Belron by the Group in 1999, from the transactions entered<br />
into with the minority shareholders of Belron since 1999, and from the recognition of the put options granted to minority shareholders of Belron<br />
following the introduction of IAS 32 from 1 January 2005 onwards (see note 33).<br />
68 D’Ieteren - Annual Report 2006
Note 12: Business Combinations<br />
During the period, the Group made the following acquisitions:<br />
Car Rental<br />
- Avis Europe acquired a 100% interest in a number of the rental locations of a former Avis licensee in Germany. The businesses, which provide<br />
vehicle rental services, were acquired with effect from the year end and cash consideration for the acquisition was paid during the year. The<br />
goodwill arising from this business combination was immediately impaired (see note 9).<br />
Vehicle Glass<br />
- A 100% interest in Nationwide Autoglazing Ltd and Glasscare Ltd (United Kingdom), which are a third party agent negotiating preferred supplier<br />
arrangements with insurers and referral arrangements with insurance brokers. These acquisitions were effective from 31 January 2006.<br />
- A 100% interest in Gifford Enterprises Inc. and Rowford Express Distributors Inc, trading as Maverick Auto Glass and headquartered in Phoenix,<br />
Arizona, which operate 5 service centres in this region of the United States. This acquisition was effective from 31 March 2006.<br />
- A 100% interest in Cristal<strong>auto</strong> Toledo S.L. which operate a branch in Spain. This acquisition was effective from 16 May 2006.<br />
- A 100% interest in AB Alatalo & Co which operate a branch in Sweden. This acquisition was effective from 1 June 2006.<br />
- A 100% interest in Jan Gustavsen AS which operate a branch in Norway. This acquisition was effective from 30 June 2006.<br />
- A 100% interest in Ergofil SA which was a former franchisee fitting and wholesale business in Greece. This acquisition was effective from<br />
1 August 2006.<br />
- A 100% interest in Autoglaserei Brauckhoff which operate 2 branches in Germany. This acquisition was effective from 1 August 2006.<br />
- A 100% interest in Le Salon de l’Auto R. Lebeau Ltee and 601085 British Columbia Ltd which operate 2 branches in Canada. This acquisition was<br />
effective from 3 November 2006.<br />
- A 100% interest in Glasscar s.r.l. which operate 11 branches in Italy. This acquisition was effective from 28 December 2006.<br />
The sales arising subsequent to these acquisitions amount to approximately EUR 15 million (approximately EUR 25 million if they had occurred on<br />
the first day of the period). The results arising subsequent to these acquisitions (even if they had occurred on the first day of the period) are not<br />
considered material to the Group and accordingly are not disclosed separately. The acquisitions have been accounted for using the acquisition<br />
method of accounting.<br />
The details of the net assets acquired, goodwill and consideration of the acquisitions are set out below:<br />
in EUR million Book Adjustment (1) Provisional<br />
value fair value (2)<br />
Other intangibles 0.2 - 0.2<br />
Other property, plant & equipment 1.0 - 1.0<br />
Inventories 2.7 -0.2 2.5<br />
Trade and other receivables 6.3 0.1 6.4<br />
Trade and other payables -6.5 -0.5 -7.0<br />
Net assets acquired 3.7 -0.6 3.1<br />
Goodwill (see note 11) 18.0<br />
Consideration 21.1<br />
Consideration satisfied by:<br />
Cash payment 14.1<br />
Deferred consideration 6.0<br />
Associated costs arising on acquisition 1.0<br />
21.1<br />
(1) Fair value and accounting policy adjustments.<br />
(2) The fair values are provisional since the integration process of the acquired entities and businesses is still ongoing.<br />
A business combination occurred in the Automobile Distribution segment after the balance sheet date but before the consolidated financial<br />
statements were authorised for issue (see note 41).<br />
CONSOLIDATED FINANCIAL STATEMENTS<br />
69
Note 13: OTHER INTANGIBLE ASSETS<br />
Goodwill is analysed in note 11. All the other intangible assets have definite useful lives, unless specified otherwise.<br />
in EUR million Avis Other Brands Com- Intan- Other Total<br />
licence licenses (with puter gibles<br />
rights and indefinite software under<br />
similar useful developrights<br />
lives) ment<br />
Gross amount at 1 January 2006 711.5 0.4 252.8 40.1 31.2 0.2 1,036.2<br />
Accumulated amortisation and impairment losses at 1 January 2006 -43.4 -0.2 - -30.6 -2.3 - -76.5<br />
Carrying amount at 1 January 2006 668.1 0.2 252.8 9.5 28.9 0.2 959.7<br />
Additions:<br />
Internal development - - - 2.2 1.2 0.1 3.5<br />
Items separately acquired - - - 8.9 3.1 - 12.0<br />
Amortisation -21.7 -0.1 - -7.9 -3.8 -0.1 -33.6<br />
Transfer to another caption - - -5.8 -0.4 0.5 - -5.7<br />
Group changes (items acquired through business combinations) - - - 0.2 - - 0.2<br />
Translation differences - - - -0.1 0.3 - 0.2<br />
Carrying amount at 31 December 2006 646.4 0.1 247.0 12.4 30.2 0.2 936.3<br />
of which: gross amount 711.5 0.4 247.0 46.9 37.7 0.3 1,043.8<br />
accumulated amortisation and impairment losses -65.1 -0.3 - -34.5 -7.5 -0.1 -107.5<br />
Gross amount at 1 January 2005 711.5 0.4 219.0 44.2 26.0 - 1,001.1<br />
Accumulated amortisation and impairment losses at 1 January 2005 -21.7 -0.1 - -37.1 - - -58.9<br />
Carrying amount at 1 January 2005 689.8 0.3 219.0 7.1 26.0 - 942.2<br />
Additions:<br />
Internal development - - - 1.7 2.7 - 4.4<br />
Items separately acquired - - - 4.8 2.0 - 6.8<br />
Disposals - - - -0.1 - - -0.1<br />
Amortisation -21.7 -0.1 - -4.5 -2.6 - -28.9<br />
Transfer to another caption - - - -0.3 0.1 0.2 -<br />
Group changes (items acquired through business combinations) - - 34.8 0.4 - - 35.2<br />
Translation differences - - -1.0 0.4 0.7 - 0.1<br />
Carrying amount at 31 December 2005 668.1 0.2 252.8 9.5 28.9 0.2 959.7<br />
of which: gross amount 711.5 0.4 252.8 40.1 31.2 0.2 1,036.2<br />
accumulated amortisation and impairment losses -43.4 -0.2 - -30.6 -2.3 - -76.5<br />
The carrying amount of the Avis licence rights is supported by the net present value of theoretical royalty streams, based on the projected sales of<br />
the Avis network. Theoretical royalty streams are estimates that may change in future periods. The discount rate is calculated based on long-term<br />
interest rates and other market data. Should the estimates or other data adversely vary in the future, the value in use of the Avis licence rights<br />
could fall below its current carrying amount. Based on current valuations, headroom appears to be sufficient to absorb a normal variation in the<br />
underlying assumptions.<br />
The nature of the brands with indefinite useful lives is provided in the summary of significant accounting policies in note 2. The decrease in<br />
brands reflects the fair value adjustments made to the initial valuations disclosed in note 12 of the 2005 annual report (see note 11).<br />
At 31 December 2006, assets under construction mainly include the intangible components of the new centralised ERP system (“Bridge” -<br />
EUR 29.4 million) in the Vehicle Glass segment. The tangible components of Bridge are disclosed in note 15. The total carrying amount of<br />
Bridge is EUR 40.0 million. Amortisation started in the second half of 2005, following the successful go-live of the system in a major country.<br />
Bridge will continue to be presented as assets under construction until the completion of the first phase of the roll-out process.<br />
70 D’Ieteren - Annual Report 2006
Note 13: OTHER INTANGIBLE ASSETS (continued)<br />
The allocation of brands (with indefinite useful lives) to cash generating units in the Vehicle Glass segment is set out below:<br />
in EUR million 2006 2005<br />
United Kingdom 67.9 67.9<br />
France 61.9 61.8<br />
Germany 34.8 34.8<br />
Holland 24.2 24.2<br />
Belgium 18.1 18.1<br />
Canada 15.3 18.3<br />
United States 12.5 15.5<br />
Spain 9.1 9.1<br />
Portugal 2.9 2.9<br />
Italy 0.3 0.2<br />
Carrying amount of brands 247.0 252.8<br />
The other disclosures required by IAS 36 for intangible assets with indefinite useful lives are provided in note 11.<br />
Note 14: Vehicles<br />
in EUR million 2006 2005<br />
Gross amount at 1 January 889.3 818.4<br />
Accumulated depreciation -166.6 -142.4<br />
Carrying amount at 1 January 722.7 676.0<br />
Additions 950.2 819.0<br />
Disposals -618.9 -543.1<br />
Depreciation charge -211.5 -179.4<br />
Transfer to non-current assets held for sale -81.6 -91.8<br />
Transfer from (to) current assets 18.2 41.5<br />
Group changes (items acquired through business combinations) - 0.5<br />
Translation differences -0.4 -<br />
Carrying amount at 31 December 778.7 722.7<br />
of which: gross amount 966.4 889.3<br />
accumulated depreciation -187.7 -166.6<br />
Vehicles held under finance leases are included in the above (in the Car Rental segment only) at the following amounts:<br />
2006 EUR 119.0 million<br />
2005 EUR 113.1 million<br />
The Automobile Distribution’s fleet is rented out in Belgium by s.a. D’Ieteren Lease n.v. (“D’Ieteren Lease”), a wholly-owned subsidiary of the<br />
Group. All rentals are operating leases. On average, the rentals are 41 months long (2005: 41 months). The average size of the fleet is as follows:<br />
2006 18,466 vehicles<br />
2005 17,401 vehicles<br />
In 2006 D’Ieteren Lease undertook a securitisation programme of its fleet and lease contracts to achieve a more <strong>auto</strong>nomous and flexible<br />
financing structure, its fleet having doubled in 6 years. This securitisation operation, which fits into the Group’s strategy of diversified financing,<br />
consists of the issue of bonds to professional investors. That securitisation programme had no impact on the net debt of the Group (this<br />
programme being a substitute to other external sources of financing). An initial amount of EUR 229.5 million was raised in April 2006, covering<br />
approximately 80% of the carrying amount of the fleet of D’Ieteren Lease. The balance is financed by inter-company loans. The carrying amount<br />
of the bonds changes as new lease contracts are concluded and as old ones expire. The reimbursement of the bonds and the payment of interest<br />
are covered by customers’ lease payments and the resale of the vehicles. The programme enables the carrying amount of the bonds to follow the<br />
evolution of the carrying amount of the fleet until the third anniversary of the initial financing. It then starts to amortise, in line with the maturation<br />
of the underlying lease contracts. The securitisation programme does not result in the derecognition of any item from the balance sheet. Other<br />
disclosures regarding the securitisation programme are provided in notes 19, 25, 31 and 39.<br />
CONSOLIDATED FINANCIAL STATEMENTS<br />
71
Note 14: Vehicles (continued)<br />
The Car Rental’s fleet is rented out by Avis Europe plc and its subsidiaries in Europe. All rentals are operating leases. On average, the rentals are 6 days<br />
long (2005: 6 days). The average size of the fleet (including vehicles held under buy-back agreements and under other operating leases) is as follows:<br />
2006 129,000 vehicles<br />
2005 123,000 vehicles<br />
The vehicles recognised in the balance sheet as non-current items are those that are not held under buy-back agreements. Their value at end of<br />
rental life will depend on the market for those vehicles at the time of disposal. Judgement is therefore required in the estimation of disposal value.<br />
Note 15: OTHER PROPERTY, PLANT AND EQUIPMENT<br />
in EUR million Property Plant Assets Total<br />
and<br />
under<br />
equipment construction<br />
Gross amount at 1 January 2006 316.3 290.8 25.2 632.3<br />
Accumulated depreciation at 1 January 2006 -116.3 -181.7 - -298.0<br />
Carrying amount at 1 January 2006 200.0 109.1 25.2 334.3<br />
Additions 15.4 50.7 5.2 71.3<br />
Disposals -4.4 -3.3 - -7.7<br />
Depreciation -17.6 -39.5 -0.1 -57.2<br />
Transfer to another caption 13.4 2.2 -15.7 -0.1<br />
Group changes (items acquired through business combinations) 0.1 0.9 - 1.0<br />
Translation differences -1.2 -1.0 0.1 -2.1<br />
Carrying amount at 31 December 2006 205.7 119.1 14.7 339.5<br />
of which: gross amount 336.1 306.9 14.8 657.8<br />
accumulated depreciation -130.4 -187.8 -0.1 -318.3<br />
Gross amount at 1 January 2005 300.4 279.1 19.9 599.4<br />
Accumulated depreciation at 1 January 2005 -108.4 -180.5 - -288.9<br />
Carrying amount at 1 January 2005 192.0 98.6 19.9 310.5<br />
Additions 13.4 38.7 16.4 68.5<br />
Disposals -1.1 -4.1 -0.3 -5.5<br />
Depreciation -16.2 -34.9 - -51.1<br />
Transfer to another caption 6.1 0.4 -10.8 -4.3<br />
Group changes (items acquired through business combinations) 3.3 8.3 - 11.6<br />
Translation differences 2.5 2.1 - 4.6<br />
Carrying amount at 31 December 2005 200.0 109.1 25.2 334.3<br />
of which: gross amount 316.3 290.8 25.2 632.3<br />
accumulated depreciation -116.3 -181.7 - -298.0<br />
At 31 December 2006, assets under construction mainly include property under construction in the Automobile Distribution segment (EUR 3.6<br />
million) and the tangible components of the new centralised ERP system (“Bridge” - EUR 10.6 million) in the Vehicle Glass segment (see note 13).<br />
Assets held under finance leases are included in the above at the following amounts:<br />
in EUR million Property Plant Assets Total<br />
and<br />
under<br />
equipment construction<br />
31 December 2006 - 15.5 - 15.5<br />
31 December 2005 - 9.8 - 9.8<br />
72 D’Ieteren - Annual Report 2006
Note 16: Investment property<br />
in EUR million 2006 2005<br />
Gross amount at 1 January 11.1 9.5<br />
Accumulated depreciation at 1 January -5.0 -4.6<br />
Carrying amount at 1 January 6.1 4.9<br />
Additions 0.6 0.6<br />
Disposals -0.6 -0.1<br />
Depreciation -0.5 -0.3<br />
Transfer to another caption 0.9 1.0<br />
Carrying amount at 31 December 6.5 6.1<br />
of which: gross amount 11.2 11.1<br />
accumulated depreciation -4.7 -5.0<br />
Fair value 9.1 8.9<br />
The fair value is supported by market evidence, and is based on a valuation by an independent valuer who holds a recognised and relevant<br />
professional qualification, and who has recent experience in the location and category of the investment property held by the Group. The latest<br />
valuations were performed in March and December 2005.<br />
All items of investment property are located in Belgium and are held by the Automobile Distribution segment.<br />
See also notes 5 and 39 for other disclosures on investment property.<br />
Note 17: Available-for-sale financial assets<br />
Available-for-sale financial assets are those non-derivative financial assets that are designated as available for sale or are not classified as (i) loans<br />
and receivables, (ii) held-to-maturity investments or (iii) financial assets held for trading.<br />
in EUR million 2006 2005<br />
Carrying Fair value Carrying Fair value<br />
amount<br />
amount<br />
Sundry 1.3 1.3 1.6 1.6<br />
Total available-for-sale financial assets 1.3 1.3 1.6 1.6<br />
Available-for-sale financial assets primarily comprise minority interests in listed companies (measured at fair value) and non listed companies<br />
(measured at cost less accumulated impairment losses if any, being an approximation of their fair value), held by the three segments. They are<br />
considered as non-current assets, and are not expected to be realised within 12 months. However, some or all of them could be disposed of in the<br />
near future, depending on opportunities.<br />
Note 18: DERIVATIVE HEDGING INSTRUMENTS<br />
Derivative hedging instruments are derivatives that meet the strict criteria of IAS 39 for application of hedge accounting. They provide economic<br />
hedges against risks faced by the Group (see note 38).<br />
Derivative hedging instruments are classified in the balance sheet as follows:<br />
in EUR million 2006 2005<br />
Current assets 1.0 -<br />
Non-current liabilities -42.3 -52.8<br />
Current liabilities -30.3 -0.4<br />
Net derivative hedging instruments -71.6 -53.2<br />
Derivative hedging instruments are analysed as follows:<br />
Cross currency interest rate swaps (debt derivatives) - see below -72.0 -52.8<br />
Interest rate swaps (debt derivatives) -0.5 -<br />
Forward foreign exchange contracts (non-debt derivatives) 0.9 -0.4<br />
Net derivative hedging instruments -71.6 -53.2<br />
All derivative hedging instruments are recognised in the Car Rental segment.<br />
CONSOLIDATED FINANCIAL STATEMENTS<br />
73
Note 18: DERIVATIVE HEDGING INSTRUMENTS (continued)<br />
Cross currency interest rate swaps of aggregate notional principal amounts of USD 390.0 million (2005: USD 390.0 million) were used to hedge the<br />
Avis Europe’s USD denominated loan notes. Fair value hedge adjustments of EUR 0.7 million (2005: EUR 22.3 million) arise from the hedging of the<br />
principal value of the exposures to euro denominated liabilities. Of this adjustment, EUR 0.7 million (2005: nil) relates to hedged items due for<br />
settlement within one year and EUR nil (2005: EUR 22.3 million) relates to hedged items due for settlement after one year. Cash flow hedges of<br />
EUR 7.5 million (2005: EUR 0.9 million) arise from the conversion of the regular semi-annual USD denominated interest payments to euro denominated<br />
interest payments. Amounts recognised within equity will be released to the income statement when the underlying fixed interest payments occur at<br />
various dates between the year end and 2014. There was no ineffectiveness of these hedges recorded at the balance sheet date.<br />
Interest rate swaps of aggregate notional principal amounts of EUR 200.0 million (2005: nil) with average fixed interest payable of 4.03% were<br />
used to hedge variable quarterly interest payments arising under the Senior Floating Rate Notes due 2013 issued by Avis Europe in 2006. The<br />
aim of the hedge relationship is to transform the variable interest borrowing into a fixed interest borrowing. Credit risks do not form part of the<br />
hedge. There was no material ineffectiveness of these hedges recorded as at the balance sheet date.<br />
The non-current portion of the derivative hedging instruments is expected to be settled after more than 12 months; the current portion within 12 months.<br />
The fair values are determined using valuation techniques. The Group uses a variety of methods and makes assumptions that are based on<br />
conditions at the balance sheet date. The fair value of cross currency interest rate swaps, and interest rate swaps is calculated as the present<br />
value of future estimated cash flows. The fair value of interest rate caps and collars are valued using option valuation techniques. The fair value<br />
of forward exchange contracts is determined using forward exchange market rates at the balance sheet date.<br />
The notional principal amounts of the outstanding derivative hedging instruments are as follows:<br />
in EUR million 2006 2005<br />
Cross currency interest rate swaps (debt derivatives) 294.9 328.7<br />
Interest rate swaps (debt derivatives) 200.0 -<br />
Forward foreign exchange contracts (non-debt derivatives) 19.7 10.1<br />
Note 19: Derivatives held for trading<br />
Derivatives held for trading are derivatives that do not meet the strict criteria of IAS 39 for application of hedge accounting. They however provide<br />
economic hedges against risks faced by the Group (see note 38).<br />
Derivatives held for trading are classified in the balance sheet as follows:<br />
in EUR million 2006 2005<br />
Non-current assets<br />
Debt derivatives<br />
Embedded derivatives 6.8 -<br />
Current assets<br />
Debt derivatives<br />
Interest rate swaps excluding securitisation swaps 6.6 9.9<br />
Interest rate securitisation swaps (1) 1.2 -<br />
Interest rate caps 1.6 0.1<br />
Non-debt derivatives<br />
Forward foreign exchange contracts 1.3 0.2<br />
Forward foreign exchange options 0.4 0.1<br />
Subtotal 11.1 10.3<br />
Current liabilities<br />
Debt derivatives<br />
Interest rate swaps excluding securitisation swaps -8.4 -16.0<br />
Interest rate securitisation swaps (1) -1.3 -<br />
Forward foreign exchange contracts -0.1 -0.1<br />
Non-debt derivatives<br />
Forward foreign exchange contracts - -0.6<br />
Subtotal -9.8 -16.7<br />
Net derivatives held for trading 8.1 -6.4<br />
(1) Other disclosures regarding the securitisation programme are provided in notes 14, 25, 31 and 39.<br />
74 D’Ieteren - Annual Report 2006
Note 19: Derivatives held for trading (continued)<br />
The EUR 250.0 million Senior Floating Rate Notes due 2013 issued by Avis Europe in 2006 include a two year call option permitting Avis Europe<br />
to repay the notes with effect from 31 July 2008. Under the option, the notes may be redeemed at the following redemption prices (expressed<br />
as a percentage of principal amounts) if repaid during the 12 month period beginning on 31 July 2008: 102%; 31 July 2009: 101%; 31 July 2010<br />
and thereafter: 100%. In accordance with IAS 39, this option is separately recognised from the underlying notes as an embedded derivative.<br />
See note 18 for details on the valuation techniques used.<br />
The notional principal amounts of the outstanding derivatives held for trading are as follows:<br />
in EUR million 2006 2005<br />
Interest rate swaps excluding securitisation swaps 925.7 1,084.8<br />
Interest rate securitisation swaps (1) 555.2 -<br />
Interest rate caps and collars 172.0 110.0<br />
Interest rate floors 48.0 23.0<br />
Forward rate agreements - 40.5<br />
Forward foreign exchange contracts and options 21.8 7.9<br />
(1) Other disclosures regarding the securitisation programme are provided in notes 14, 25, 31 and 39.<br />
Note 20: LONG-TERM EMPLOYEE BENEFIT ASSETS AND OBLIGATIONS<br />
Long-term employee benefits include post-employment employee benefits and other long-term employee benefits. Post-employment employee<br />
benefits are analysed below. Other long-term employee benefits are presented among non-current provisions or non-current other payables, and,<br />
if material, separately disclosed in the relevant note.<br />
Post-employment benefits are limited to retirement benefit schemes. Where applicable, Group entities contribute to the relevant state pension<br />
schemes. Certain Group entities operate schemes which provide retirement benefits, including those of the defined benefit type, which are in<br />
most cases funded by investments held outside the Group. The disclosures related to defined contribution schemes are provided in note 36.<br />
The Group operates defined benefit schemes for qualifying employees in the following countries:<br />
Automobile Distribution:<br />
Funded and unfunded schemes:<br />
Belgium<br />
Car Rental:<br />
Funded schemes:<br />
Austria<br />
France<br />
Spain<br />
United Kingdom<br />
Unfunded schemes:<br />
Germany<br />
Greece<br />
Italy<br />
Vehicle Glass:<br />
Funded schemes:<br />
Canada<br />
Holland<br />
Ireland<br />
United Kingdom<br />
The valuations used have been based on the most recent actuarial valuations, updated by the scheme actuaries to assess the liabilities of the<br />
scheme and the market value of the scheme assets at each of the balance sheet dates.<br />
CONSOLIDATED FINANCIAL STATEMENTS<br />
75
Note 20: LONG-TERM EMPLOYEE BENEFIT ASSETS AND OBLIGATIONS (continued)<br />
The main actuarial assumptions are as follows (ranges are provided given the plurality of schemes operated throughout the Group):<br />
in EUR million funded schemes Unfunded schemes<br />
2006 2005 2006 2005<br />
Min. Max. Min. Max. Min. Max. Min. Max.<br />
Inflation rate 2.0% 3.1% 2.0% 2.9% 1.6% 2.0% 1.6% 2.0%<br />
Discount rate 4.3% 5.2% 4.2% 5.3% 3.7% 4.4% 2.9% 4.0%<br />
Expected return on scheme assets:<br />
Equities 7.0% 8.5% 7.2% 8.5% - - - -<br />
Bonds 4.0% 5.0% 4.5% 5.8% - - - -<br />
Other 2.3% 6.1% 2.9% 4.5% - - - -<br />
Rate of salary increases 1.0% 5.2% 1.0% 5.0% 2.0% 3.0% 1.0% 4.0%<br />
Rate of pension increases 2.0% 3.1% 2.0% 2.9% 1.1% 2.0% 1.6% 2.0%<br />
The expected rates of return on scheme assets are based on market expectations at the beginning of each year, for returns over the entire life of<br />
the related obligation. The expected return on bonds is based on long-term bond yields. The expected return on equities is based on a wide range<br />
of qualitative and quantitative market analysis including consideration of market equity risk premiums.<br />
The actual return on scheme assets is analysed as follows:<br />
in EUR million 2006 2005<br />
Expected return on scheme assets 19.6 15.4<br />
Actual return less expected return on scheme assets 0.1 31.9<br />
Actual return on scheme assets 19.7 47.3<br />
The amounts recognised in the balance sheet are summarised as follows:<br />
in EUR million 2006 2005<br />
Long-term employee benefit assets 1.8 1.3<br />
Long-term employee benefit obligations -175.3 -190.0<br />
Recognised net deficit (-) / surplus (+) in the schemes -173.5 -188.7<br />
of which: amount expected to be settled within 12 months -1.0 -1.2<br />
amount expected to be settled in more than 12 months -172.5 -187.5<br />
The amounts recognised in the balance sheet are analysed as follows:<br />
in EUR million 2006 2005<br />
Funded Unfunded Total Funded Unfunded Total<br />
schemes schemes schemes schemes<br />
Present value of defined benefit obligations -467.8 -45.9 -513.7 -432.4 -51.7 -484.1<br />
Fair value of scheme assets 340.2 - 340.2 295.4 - 295.4<br />
Net deficit (-) / surplus (+) in the schemes -127.6 -45.9 -173.5 -137.0 -51.7 -188.7<br />
The fair value of scheme assets includes the following items:<br />
in EUR million 2006 2005<br />
Funded Unfunded Total Funded Unfunded Total<br />
schemes schemes schemes schemes<br />
Equity instruments 209.2 - 209.2 187.5 - 187.5<br />
Debt instruments 97.8 - 97.8 78.3 - 78.3<br />
Property 16.6 - 16.6 - - -<br />
Other assets 16.6 - 16.6 29.6 - 29.6<br />
Fair value of scheme assets 340.2 - 340.2 295.4 - 295.4<br />
The fair value of scheme assets did not comprise any property or other assets used by the Group, nor any financial instruments of the Group.<br />
76 D’Ieteren - Annual Report 2006
Note 20: LONG-TERM EMPLOYEE BENEFIT ASSETS AND OBLIGATIONS (continued)<br />
The movements in the recognised net deficit are as follows:<br />
in EUR million 2006 2005<br />
Funded Unfunded Total Funded Unfunded Total<br />
schemes schemes schemes schemes<br />
Net deficit (-) / surplus (+) at 1 January -137.0 -51.7 -188.7 -87.1 -40.9 -128.0<br />
Contributions paid by the Group 31.3 - 31.3 15.4 - 15.4<br />
Benefits paid by the Group - 1.9 1.9 - 2.6 2.6<br />
Expense recognised in the income statement -14.4 -1.3 -15.7 -14.9 -5.1 -20.0<br />
Actuarial gains (+) / losses (-) -6.0 4.9 -1.1 -44.9 -8.4 -53.3<br />
Group changes - - - -4.0 - -4.0<br />
Translation differences -1.5 0.3 -1.2 -1.5 0.1 -1.4<br />
Net deficit (-) / surplus (+) at 31 December -127.6 -45.9 -173.5 -137.0 -51.7 -188.7<br />
The amounts recognised in the income statement are as follows:<br />
in EUR million 2006 2005<br />
Funded Unfunded Total Funded Unfunded Total<br />
schemes schemes schemes schemes<br />
Current service cost -17.4 -2.6 -20.0 -13.7 -4.0 -17.7<br />
Past service cost 0.2 3.2 3.4 - - -<br />
Interest cost -20.6 -1.9 -22.5 -16.6 -1.1 -17.7<br />
Effect of curtailment or settlement 3.8 - 3.8 - - -<br />
Expected return on scheme assets 19.6 - 19.6 15.4 - 15.4<br />
Expense recognised in the income statement -14.4 -1.3 -15.7 -14.9 -5.1 -20.0<br />
of which: commercial and administrative expenses (current items) -18.2 -4.5 -22.7 -14.9 -5.1 -20.0<br />
other operating income (unusual items - see note 9) 3.8 3.2 7.0 - - -<br />
The amounts recognised through the statement of recognised income and expense are as follows:<br />
in EUR million 2006 2005<br />
Funded Unfunded Total Funded Unfunded Total<br />
schemes schemes schemes schemes<br />
Actual return less expected return on scheme assets 0.1 - 0.1 31.9 - 31.9<br />
Experience gain (+) / loss (-) on liabilities -6.8 1.5 -5.3 6.4 0.2 6.6<br />
Gain (+) / Loss (-) on change of assumptions (1) 0.7 3.4 4.1 -83.2 -8.6 -91.8<br />
Actuarial gains (+) / losses (-) -6.0 4.9 -1.1 -44.9 -8.4 -53.3<br />
(1) Financial and/or demographic assumptions.<br />
The best estimate of the contributions expected to be paid to the schemes during the 2007 annual period is EUR 25.5 million.<br />
The obligation of defined benefit schemes is calculated on the basis of a set of actuarial assumptions (including among others: mortality, discount<br />
rate of future payments, salary increases, personnel turnover, etc.). Should these assumptions change in the future, the obligation may increase.<br />
The defined benefit scheme assets are invested in a diversified portfolio, with a return that is likely to experience volatility in the future. Should the<br />
return of these assets be insufficient, the deficit might increase.<br />
CONSOLIDATED FINANCIAL STATEMENTS<br />
77
Note 21: DEFERRED TAXES<br />
Deferred income tax assets and liabilities are offset when there is a legally enforceable right to set off current assets against current tax liabilities<br />
and when the deferred income taxes relate to the same fiscal authority.<br />
The movement in deferred tax assets and liabilities during the period and the prior period is as follows:<br />
in EUR million Buy-back Revalua- Depreciation Provi- Divi- Tax losses Financial Other Total<br />
agree- tions amortisation sions dends available instruments<br />
write-downs for offset ments<br />
Deferred tax liabilities (negative amounts)<br />
At 1 January 2005, before offsetting -16.8 -224.7 -34.2 -0.3 -2.8 - -1.9 -4.4 -285.1<br />
Credited (charged) to income statement 15.6 6.7 -3.7 - 2.3 - -3.4 -5.2 12.3<br />
Credited (charged) to equity - - - - - - - - -<br />
Exchange differences - - -0.2 - - - - 0.1 -0.1<br />
At 31 December 2005, before offsetting -1.2 -218.0 -38.1 -0.3 -0.5 - -5.3 -9.5 -272.9<br />
Offsetting 1.3 - -9.4 5.9 - 7.5 5.6 -13.7 -2.8<br />
At 1 January 2006, after offsetting 0.1 -218.0 -47.5 5.6 -0.5 7.5 0.3 -23.2 -275.7<br />
Credited (charged) to income statement -0.1 6.7 -2.9 -0.2 0.2 -5.1 0.6 6.0 5.2<br />
Credited (charged) to equity - - - -0.1 - - - - -0.1<br />
Exchange differences - - -0.6 - - - - - -0.6<br />
At 31 December 2006, after offsetting - -211.3 -51.0 5.3 -0.3 2.4 0.9 -17.2 -271.2<br />
Deferred tax assets (positive amounts)<br />
At 1 January 2005, before offsetting 18.1 - 3.0 39.3 - 12.4 6.9 2.1 81.8<br />
Credited (charged) to income statement -17.6 - 0.5 -0.2 - 10.2 2.4 -1.4 -6.1<br />
Credited (charged) to equity - - - 13.7 - - -1.8 - 11.9<br />
Exchange differences - - 0.1 1.0 - - 0.4 - 1.5<br />
At 31 December 2005, before offsetting 0.5 - 3.6 53.8 - 22.6 7.9 0.7 89.1<br />
Offsetting -0.5 - 8.6 -5.9 - -7.5 -5.6 13.7 2.8<br />
At 1 January 2006, after offsetting - - 12.2 47.9 - 15.1 2.3 14.4 91.9<br />
Credited (charged) to income statement - - 8.1 -18.8 - 14.7 -0.2 -1.6 2.2<br />
Credited (charged) to equity - - - 1.5 - - 1.0 - 2.5<br />
Exchange differences - - 0.5 0.3 - - 0.3 - 1.1<br />
At 31 December 2006, after offsetting - - 20.8 30.9 - 29.8 3.4 12.8 97.7<br />
Net deferred tax assets (liabilities)<br />
after offsetting recognised<br />
in the consolidated balance sheet:<br />
31 December 2005 0.1 -218.0 -35.3 53.5 -0.5 22.6 2.6 -8.8 -183.8<br />
31 December 2006 - -211.3 -30.2 36.2 -0.3 32.2 4.3 -4.4 -173.5<br />
The revaluation column mainly includes the deferred tax liability (EUR 200.7 million; 2005: EUR 207.4 million) arising on the recognition of the Avis<br />
licence rights.<br />
The net deferred tax balance includes a liability of EUR 6.7 million (2005: EUR 6.7 million) that will be reversed in the following year, due to the<br />
amortisation of the Avis licence rights. It also includes net deferred tax assets amounting to EUR 3.6 million (2005: EUR 8.5 million) that are<br />
expected to be reversed in the following year. However, given the low predictability of deferred tax movements, this net amount might not be<br />
reversed as originally foreseen.<br />
At the balance sheet date, the Group has unused tax losses of EUR 190.4 million (EUR 150.2 million at 31 December 2005) available for offset<br />
against future profits, for which no deferred tax asset has been recognised, due to the unpredictability of future profit streams. This includes<br />
unused tax losses of EUR 20.3 million (2005: EUR 11.2 million) that will expire in the period 2007-2026 (2005: 2006-2025). Other losses may be<br />
carried forward indefinitely.<br />
Deferred tax has not been recognised in respect of other deductible temporary differences amounting to EUR 49.5 million (2005: EUR 21.5 million)<br />
due to the unpredictability of future profit streams.<br />
78 D’Ieteren - Annual Report 2006
Note 21: DEFERRED TAXES (continued)<br />
At the balance sheet date the aggregate amount of temporary differences associated with the investments in subsidiaries, branches, associates<br />
and interests in joint ventures (being mainly the accumulated positive consolidated reserves of these entities) for which deferred tax liabilities<br />
have not been recognised is EUR 927.6 million. No deferred tax liability has been recognised in respect of these differences because the Group<br />
is in a position to control the timing of the reversal of the temporary differences and it is probable that such differences will not reverse in the<br />
foreseeable future. It should also be noted that the reversal of these temporary differences, for example by way of distribution of dividends by<br />
the subsidiaries to the Parent, would generate no (or a marginal) current tax effect.<br />
Deferred tax assets include, among other items:<br />
- EUR 6.6 million (2005: EUR 18.1 million) of which the utilisation is dependent on future taxable profits in excess of the profit arising from the<br />
reversal of existing taxable temporary differences.<br />
- EUR 20.4 million (2005: EUR 12.6 million) related to entities that suffered a loss in either the current or preceding period in a tax jurisdiction to<br />
which the deferred tax assets relate.<br />
The recognition of these deferred tax assets is supported by profit expectations in the foreseeable future.<br />
Deferred tax assets are recognised provided that there is a sufficient probability that they will be recovered in the foreseeable future.<br />
Recoverability has been conservatively assessed. However, should the conditions for this recovery not be met in the future, the current carrying<br />
amount of the deferred tax assets may be reduced.<br />
Note 22: Other non-current receivables<br />
The other non-current receivables are comprised of guarantee deposits. Their carrying amount approximates their fair value, and they generally<br />
generate no interest income. They are expected to be recovered after more than 12 months.<br />
Note 23: Non-current assets classified as held for sale<br />
The major classes of assets classified as held for sale are the following ones:<br />
in EUR million 2006 2005<br />
Automobile Car Vehicle Group Automobile Car Vehicle Group<br />
Distribution Rental Glass Distribution Rental Glass<br />
Vehicles - 8.4 - 8.4 - 11.1 - 11.1<br />
Other property, plant and equipment - - - - 0.1 - - 0.1<br />
Non-current assets classified as held for sale - 8.4 - 8.4 0.1 11.1 - 11.2<br />
In the Car Rental segment, non-current assets held for sale comprise ex-rental vehicles where management are committed to the disposal of<br />
the vehicles. The disposals are expected to occur in early 2007.<br />
Note 24: Inventories<br />
in EUR million 2006 2005<br />
Automobile Distribution<br />
Vehicles 269.7 272.2<br />
Spare parts and accessories 26.4 23.9<br />
Other 0.6 0.8<br />
Subtotal 296.7 296.9<br />
Car Rental<br />
Fuel 6.0 5.7<br />
Spare parts and accessories 1.4 1.3<br />
Subtotal 7.4 7.0<br />
Vehicle Glass<br />
Glass and related product 114.1 118.4<br />
Subtotal 114.1 118.4<br />
Group 418.2 422.3<br />
of which: items carried at fair value less costs to sell 38.9 33.4<br />
The items carried out at fair value less costs to sell are mainly the vehicles sold under buy-back agreements (this kind of agreement being<br />
accounted for as operating lease) that are kept on balance sheet until their subsequent resale.<br />
The inventories are expected to be recovered within 12 months.<br />
CONSOLIDATED FINANCIAL STATEMENTS<br />
79
Note 25: OTHER FINANCIAL ASSETs<br />
The other financial assets are analysed as follows:<br />
in EUR million 2006 2005<br />
Automobile Distribution - Securitisation cash reserves 25.5 -<br />
Car Rental - Finance lease collateral 22.6 15.0<br />
Vehicle Glass - Restricted cash related to deferred consideration - 3.5<br />
Other financial assets 48.1 18.5<br />
The securitisation (see note 14) cash reserves are pledged by D’Ieteren Lease and are held on its own bank accounts. The set up of these<br />
reserves explains the majority of the negative cash flow from net investment in other financial assets in the Automobile Distribution segment.<br />
Other disclosures regarding the securitisation programme are provided in notes 14, 19, 31 and 39.<br />
The other financial assets are expected to be recovered within 12 months. They attract interest with reference to EURIBID, LIBID or equivalent.<br />
Note 26: CURRENT TAX ASSETS AND LIABILITIES<br />
Current tax assets (liabilities) are largely expected to be recovered (settled) within 12 months.<br />
Note 27: TRADE AND OTHER RECEIVABLES<br />
Trade and other receivables are analysed as follows:<br />
in EUR million 2006 2005<br />
Automobile Car Vehicle Group Automobile Car Vehicle Group<br />
Distribution Rental Glass Distribution Rental Glass<br />
Trade receivables - net 95.3 153.9 134.7 383.9 102.0 131.9 125.9 359.8<br />
Vehicle related receivables - 1,082.4 - 1,082.4 - 1,078.7 - 1,078.7<br />
Receivables from entities accounted<br />
for using the equity method 0.4 0.1 - 0.5 0.3 0.2 - 0.5<br />
Other receivables 22.8 122.2 31.4 176.4 22.0 121.1 35.3 178.4<br />
Trade and other receivables 118.5 1,358.6 166.1 1,643.2 124.3 1,331.9 161.2 1,617.4<br />
The trade and other receivables are expected to be recovered within 12 months. Their carrying amount approximates to their fair value, and they<br />
generate no interest income.<br />
In the Car Rental segment, vehicle related receivables include receivables related to vehicles purchased under buy-back agreements, prepaid<br />
vehicle operating lease charges, amounts due from leasing companies and other vehicle receivables. Credit risk is concentrated with the main<br />
European vehicle manufacturers.<br />
Concentrations of credit risk with respect to non-vehicle related receivables are limited due to the diversity of the Group’s customer base. Balance<br />
sheet amounts are stated net of provisions for doubtful debts, and accordingly, the maximum credit risk exposure is the carrying amount of the<br />
receivables in the balance sheet.<br />
Note 28: CASH AND CASH EQUIVALENTS<br />
Cash and cash equivalents are analysed below:<br />
in EUR million 2006 2005<br />
Automobile Car Vehicle Group Automobile Car Vehicle Group<br />
Distribution Rental Glass Distribution Rental Glass<br />
Cash at bank and in hand 1.5 52.0 37.8 91.3 1.4 79.0 18.5 98.9<br />
Short-term deposits - 64.6 - 64.6 - 19.8 - 19.8<br />
Cash and cash equivalents 1.5 116.6 37.8 155.9 1.4 98.8 18.5 118.7<br />
Cash and cash equivalents are mainly floating rate assets which earn interest at various rates set with reference to the prevailing EURIBID, LIBID<br />
or equivalent.<br />
Due to legal restrictions, cash balances held in Brazil, amounting to EUR 4.4 million (2005: EUR 2.3 million), are not available for general use by the<br />
Parent or other subsidiaries.<br />
80 D’Ieteren - Annual Report 2006
Note 29: Equity<br />
The change in ordinary share capital is set out below:<br />
in EUR million, except number of shares stated in units Number Ordinary<br />
of ordinary<br />
share<br />
shares<br />
capital<br />
At 1 January 2005 5,530,260 160.0<br />
Change 2 -<br />
At 31 December 2005 5,530,262 160.0<br />
Change - -<br />
At 31 December 2006 5,530,262 160.0<br />
All ordinary shares issued are fully paid. Ordinary shares have no face value. They are either nominative or bearer shares. Each ordinary share<br />
confers one voting right.<br />
Treasury shares are held by the Parent and by subsidiaries as set out below:<br />
in EUR million, except number of shares stated in units 2006 2005<br />
Number Amount Number Amount<br />
Treasury shares held by the Parent 77,270 12.9 68,309 9.1<br />
Treasury shares held by subsidiaries 1 - 1 -<br />
Treasury shares held 77,271 12.9 68,310 9.1<br />
Treasury shares are held to cover the stock option plans set up by the Parent in the period since 1999 (see note 37).<br />
On 27 May 2004, the Extraordinary General Meeting of Shareholders authorised the Board of Directors to increase the share capital on one or<br />
more occasions, during a renewable period of five years, up to a maximum of EUR 60 million by contributions in cash or in kind or by incorporation<br />
of available or non-available reserves or share premium account, with or without creation of new shares, either preference or other shares, with or<br />
without voting rights, with or without subscription rights, with the possibility of limiting or withdrawing preferential subscription rights including in<br />
favour of one or more specified people.<br />
In addition to ordinary shares, there are 500,000 nominative participating shares, which do not represent share capital. The number of participating<br />
shares remained unchanged in 2005 and in 2006. Each participating share confers one voting right and gives the right to a dividend equal to one<br />
eighth of the dividend of an ordinary share.<br />
Registered shares not fully paid-up may not be transferred except by virtue of a special authorisation from the Board of Directors for each<br />
assignment and in favour of an assignee appointed by the Board (art. 7 of the Articles). Participating shares may not be transferred except by the<br />
agreement of a majority of members of the Board of Directors, in which case they must be transferred to an assignee appointed by said members<br />
(art. 8 of the Articles).<br />
Disclosure of company shareholders (according to “declarations Capital Participating Total voting<br />
of transparency” dated 8 July 1994, 9 December 1996, shares shares rights<br />
30 January 1998, 14 November 2005 and 20 December 2006) Number % Number % Number %<br />
s.a. de Participations et de Gestion, Brussels 1,032,206 18.66% - - 1,032,206 17.12%<br />
Reptid Commercial Corporation, Dover, Delaware 202,532 3.66% - - 202,532 3.36%<br />
Mrs Catheline Périer-D’Ieteren 152,990 2.77% 125,000 25.00% 277,990 4.61%<br />
Mr Olivier Périer 1,000 0.02% - - 1,000 0.02%<br />
The four abovementioned persons (collectively “SPDG<br />
Group”) are associated and act in concert with Cobepa s.a. 1,388,728 25.11% 125,000 25.00% 1,513,728 25.10%<br />
Nayarit Participations s.c.a., Brussels 1,209,151 21.86% - - 1,209,151 20.05%<br />
Mr Roland D’Ieteren 46,619 0.84% 375,000 75.00% 421,619 6.99%<br />
Mr Nicolas D’Ieteren 1,000 0.02% - - 1,000 0.02%<br />
The three abovementioned persons (collectively “Nayarit<br />
Group”) are associated and act in concert with Cobepa s.a. 1,256,770 22.73% 375,000 75.00% 1,631,770 27.06%<br />
The persons referred to as SPDG Group and Nayarit<br />
Group are associated and act in concert.<br />
Cobepa s.a., Brussels 425,000 7.68% - - 425,000 7.05%<br />
Cobepa s.a. acts in concert on the one hand with Nayarit<br />
Group and on the other hand with SPDG Group. 425,000 7.68% - - 425,000 7.05%<br />
CONSOLIDATED FINANCIAL STATEMENTS<br />
81
Note 29: Equity (continued)<br />
Changes in equity are set out below:<br />
in EUR million Capital and reserves attributable to equity holders Total Minority Equity<br />
Share Share Treasury Share- Fair Hedging Retained Actuarial Taxes Cumu- Group’s<br />
capital premium shares based value reserve earnings gains lative share<br />
interest<br />
payment reserve and translation<br />
reserve losses differences<br />
At 1 January 2005 160.0 24.4 -9.8 0.4 0.8 -9.2 513.0 -8.4 4.3 -6.1 669.4 176.7 846.1<br />
Treasury shares - - 0.7 - - - - - - - 0.7 0.1 0.8<br />
Dividend 2004 paid in 2005 - - - - - - -12.8 - - - -12.8 -16.7 -29.5<br />
Other movements - - - - - - - - - - - 71.1 71.1<br />
Total recognised income and expense - - - 0.4 -0.4 4.7 80.3 -33.9 7.9 -6.4 52.6 4.4 57.0<br />
At 31 December 2005 (as reported) 160.0 24.4 -9.1 0.8 0.4 -4.5 580.5 -42.3 12.2 -12.5 709.9 235.6 945.5<br />
Restatements (see note 2) - - - - - - -4.1 - -1.7 5.8 - - -<br />
At 31 December 2005 (as restated) 160.0 24.4 -9.1 0.8 0.4 -4.5 576.4 -42.3 10.5 -6.7 709.9 235.6 945.5<br />
At 1 January 2006 160.0 24.4 -9.1 0.8 0.4 -4.5 576.4 -42.3 10.5 -6.7 709.9 235.6 945.5<br />
Treasury shares - - -3.8 - - - - - - - -3.8 0.2 -3.6<br />
Dividend 2005 paid in 2006 - - - - - - -13.3 - - - -13.3 -12.2 -25.5<br />
Other movements - - - - - - - - - - - -5.9 -5.9<br />
Total recognised income and expense - - - 0.7 -0.2 -1.7 100.0 -1.2 1.1 0.3 99.0 14.3 113.3<br />
At 31 December 2006 160.0 24.4 -12.9 1.5 0.2 -6.2 663.1 -43.5 11.6 -6.4 791.8 232.0 1,023.8<br />
The Board of Directors proposed the distribution of a gross dividend amounting to EUR 2.64 per share (2005: EUR 2.40 per share), or EUR 14.6 million<br />
in aggregate (2005: EUR 13.3 million).<br />
Note 30: PROVISIONS<br />
Provisions for post-retirement benefit schemes are analysed in note 20. The other provisions, either current or non-current, are analysed below.<br />
The major classes of provisions are the following ones:<br />
in EUR million 2006 2005<br />
Automobile Car Vehicle Group Automobile Car Vehicle Group<br />
Distribution Rental Glass Distribution Rental Glass<br />
Non-current provisions<br />
Dealer-related 21.3 - - 21.3 18.0 - - 18.0<br />
Warranty 5.0 - - 5.0 4.6 - - 4.6<br />
Insurance and covers 3.6 45.2 - 48.8 3.5 37.1 - 40.6<br />
Other non-current items 5.5 19.4 46.1 71.0 4.3 15.2 22.3 41.8<br />
Subtotal 35.4 64.6 46.1 146.1 30.4 52.3 22.3 105.0<br />
Current provisions<br />
Other current items - - 8.7 8.7 - - 3.3 3.3<br />
Total provisions 35.4 64.6 54.8 154.8 30.4 52.3 25.6 108.3<br />
82 D’Ieteren - Annual Report 2006
Note 30: PROVISIONS (continued)<br />
The changes in provisions are set out below for the year ended 31 December 2006:<br />
in EUR million Dealer- Warranty Insurance Other Other Total<br />
related and non-current current<br />
covers items items<br />
At 1 January 2006 18.0 4.6 40.6 41.8 3.3 108.3<br />
Charged in the year 9.8 0.9 26.1 40.1 5.9 82.8<br />
Utilised in the year -4.5 -0.4 -18.0 -10.6 - -33.5<br />
Reversed in the year -2.0 -0.1 - -0.3 - -2.4<br />
Translation differences - - 0.1 - -0.5 -0.4<br />
At 31 December 2006 21.3 5.0 48.8 71.0 8.7 154.8<br />
The timing of the outflows being largely uncertain, most of the provisions are considered as a non-current items. Current provisions are expected<br />
to be settled within 12 months.<br />
The dealer-related provisions arise from the ongoing improvement of the distribution networks.<br />
Warranty provisions relate to the cost of services offered to new vehicle customers, like mobility. Expected reimbursements by third parties<br />
amount to at least EUR 0.2 million (2005: EUR 0.2 million).<br />
In the Car Rental segment, insurance reserves provide for uninsured losses under third party liabilities or claims. Due to the timescales and<br />
uncertainties involved in such claims, provision is made based upon the profile of claims experience, allowing for potential claims for a number of<br />
years after policy inception. In the Automobile Distribution segment, provisions are set up for incurred material damage (registered or not) at<br />
D’Ieteren Lease.<br />
Other non-current provisions primarily comprise:<br />
- Reorganisation and employee termination provisions that are expected to crystallise within the next few years.<br />
- Dilapidation and environmental provisions to cover the costs of the remediation of certain properties held under operating leases.<br />
- Provisions for vacant properties.<br />
- Provision against the future redemption of benefits under customer loyalty programmes.<br />
- Provision against legal claims that arise in the normal course of business, that are expected to crystalise in the next couple of years. After taking<br />
appropriate legal advice, the outcome of these legal claims should not give rise to any significant loss beyond amounts provided at 31 December 2006.<br />
- The provision for a long-term management incentive scheme set up in 2005 in the Vehicle Glass segment. The settlement of this scheme is<br />
expected to occur in 2010.<br />
CONSOLIDATED FINANCIAL STATEMENTS<br />
83
Note 31: BORROWINGS<br />
Borrowings are analysed as follows:<br />
in EUR million 2006 2005<br />
Automobile Car Vehicle Group Automobile Car Vehicle Group<br />
Distribution Rental Glass Distribution Rental Glass<br />
Non-current borrowings<br />
Bonds 200.0 - - 200.0 200.0 - - 200.0<br />
Bonds under securitisation programme 231.0 - - 231.0 - - - -<br />
Obligations under finance leases - 2.0 8.4 10.4 - 1.9 6.0 7.9<br />
Bank and other loans 53.6 - 305.0 358.6 193.8 70.7 354.5 619.0<br />
Loan notes - 559.2 - 559.2 - 540.9 - 540.9<br />
Deferred consideration - 32.7 - 32.7 - 32.7 - 32.7<br />
Subtotal non-current borrowings 484.6 593.9 313.4 1,391.9 393.8 646.2 360.5 1,400.5<br />
Current borrowings<br />
Obligations under finance leases - 283.1 3.7 286.8 - 276.3 3.4 279.7<br />
Bank and other loans 28.4 10.4 31.0 69.8 56.2 23.2 23.3 102.7<br />
Loan notes - 221.3 - 221.3 - 24.9 - 24.9<br />
Medium term notes - - - - 12.4 - - 12.4<br />
Commercial paper 46.0 - - 46.0 89.8 66.0 - 155.8<br />
Deferred consideration - 0.3 - 0.3 - 0.2 - 0.2<br />
Inter-segment financing -46.0 - 46.0 - -14.0 - 14.0 -<br />
Subtotal current borrowings 28.4 515.1 80.7 624.2 144.4 390.6 40.7 575.7<br />
Total borrowings 513.0 1,109.0 394.1 2,016.1 538.2 1,036.8 401.2 1,976.2<br />
The Group issues bonds through its wholly-owned subsidiary D’Ieteren Trading b.v. The bonds outstanding at 31 December are as follows:<br />
2006 2005<br />
Issued Principal Maturing Fixed rate Issued Principal Maturing Fixed rate<br />
(in EUR million)<br />
(in EUR million)<br />
July 2004 100.0 2012 5.25% July 2004 100.0 2012 5.25%<br />
July 2005 100.0 2015 4.25% July 2005 100.0 2015 4.25%<br />
Total 200.0 200.0<br />
The weighted average cost of bonds in 2006 was 4.8% (2005: 5.0%).<br />
The Group issues bonds under a securitisation programme, through its wholly-owned subsidiary s.a. D’Ieteren Lease n.v. (“D’Ieteren Lease”).<br />
The programme is set out in note 14. The bonds are rated A1. The spread payable over EURIBOR is 65 basis points. The weighted average cost<br />
of this programme, including the amortisation of the initial set-up costs over a 3-year period, was 4.3%. Pledged accounts related to this<br />
securitisation programme are recorded under the heading “other financial assets” (see note 25). Other disclosures regarding the securitisation<br />
programme are also provided in notes 19 and 39.<br />
Obligations under finance leases are analysed below:<br />
in EUR million 2006 2005<br />
Minimum Present value Minimum Present value<br />
lease of minimum lease of minimum<br />
payments lease payments payments lease payments<br />
Within one year 292.7 286.8 283.0 279.7<br />
Between one and five years 10.6 9.6 8.0 7.1<br />
More than five years 0.9 0.8 0.9 0.8<br />
Subtotal 304.2 297.2 291.9 287.6<br />
Less: future finance charges -7.0 - -4.3 -<br />
Present value of finance lease obligations 297.2 - 287.6 -<br />
84 D’Ieteren - Annual Report 2006
Note 31: BORROWINGS (continued)<br />
Obligations under finance leases are mainly located in the Car Rental segment, which leases certain of its vehicles (including some vehicles held under<br />
buy-back agreements) and some plant and equipment under finance leases. The average lease term is less than one year. For the year ended<br />
31 December 2006 the average effective interest rate was 3.2% (2005: 3.0%) and interest rates are fixed at the contract date. All these finance leases<br />
are on a fixed repayment basis and no arrangements have been entered into for contingent rent payments. Finance leases are occasionally used in the<br />
Vehicle Glass segment, and not used in the Automobile Distribution segment. The Group’s obligations under finance leases are secured by the lessors<br />
having legal title over the leased assets. In addition, collateral is held against certain of the leases in the Car Rental segment (see note 25).<br />
Bank and other loans mainly represent non syndicated bank loans (in the Automobile Distribution segment) and syndicated arrangements (in the<br />
Car Rental and the Vehicle Glass segments), as well as overdrafts. Depending on the currency of the bank borrowings and the segment<br />
concerned, the weighted average cost ranged from 3.3% to 6.1% in 2006 (2005: 2.6% to 5.2%).<br />
On 20 February 2006 Avis Europe plc entered into a new five year multicurrency Senior Revolving Credit Facility which terminates on<br />
20 February 2011. This facility was provided by a syndicate of 14 banks. The facility provides for loan advances denominated in euro, pound<br />
sterling, or other such currencies as may be agreed upon with the lenders, for a total aggregate principal amount of EUR 580.0 million<br />
outstanding at any one time. The interest rates applicable to advances under the facility are based on EURIBOR (or LIBOR for drawings in<br />
currencies other than euro), plus a margin. No amounts were drawn at 31 December 2006 under this facility.<br />
Loan notes mainly represent the following outstanding balances in the Car Rental segment, due by Avis Finance Company plc (“AFC”), an indirect<br />
wholly-owned subsidiary of Avis Europe plc:<br />
2006 2005<br />
Issued Currency Principal Maturing Principal Maturing<br />
(in million)<br />
(in million)<br />
August 2000 USD 150.0 2007, 2010 150.0 2007, 2010<br />
November 2001 EUR - - 25.0 2006<br />
March 2002 EUR 25.0 2007 25.0 2007<br />
June 2002 EUR 26.8 2012 26.8 2012<br />
July 2002 EUR 120.0 2007 120.0 2007<br />
June 2004 USD 240.0 2011, 2012, 2014 240.0 2011, 2012, 2014<br />
June 2004 EUR 65.0 2012 65.0 2012<br />
July 2006 EUR 250.0 2013 - -<br />
The USD loan notes bear interest at an average fixed rate of 6.8% (2005: 6.8%). The euro denominated loan notes bear interest at an average<br />
fixed rate of 6.0% (2005: 6.1%). In July 2006, AFC issued EUR 250.0 million Senior Floating Rate Notes due 2013 which bear interest at EURIBOR<br />
plus 2.625%. These notes reprice quarterly and include a two year call option, permitting AFC to repay the notes with effect from 31 July 2008.<br />
This option is separately recognised as an embedded derivative at fair value (see note 19).<br />
The Group runs two commercial paper programmes in Belgium:<br />
- s.a. D’Ieteren Treasury n.v., a wholly-owned subsidiary of the Parent, runs a EUR 300.0 million (2005: EUR 300.0 million through s.a. D’Ieteren<br />
Services n.v.) programme guaranteed by the Parent. The weighted average cost over 2006 was 2.8% (2005: 2.3%). Medium term notes can<br />
also be drawn from this programme. The weighted average cost of these notes was nil in 2006 (2005: 4.5%).<br />
- AFC runs a programme guaranteed by Avis Europe plc, which provides the Car Rental segment with borrowings of up to EUR 200.0 million (2005:<br />
EUR 200.0 million). Amounts drawn under the facility attract interest at a floating rate set by reference to EURIBOR plus a margin which will vary<br />
depending upon market conditions at the time of issue. The average rate applicable to the drawn facility at 31 December 2005 was 2.6%.<br />
Deferred consideration represents amounts still due arising on the acquisition of Avis Europe Investment Holdings Limited (a wholly-owned<br />
subsidiary of Avis Europe plc) from Avis Inc. in 1997, and payable in annual instalments of GBP 1.9 million including interest. The deferred<br />
consideration is denominated in GBP and bears an interest rate of 8.0% fixed for 31 years.<br />
Inter-segment financing items are amounts lent by the Automobile Distribution segment to the Car Rental and Vehicle Glass segments, at arm’s<br />
length conditions.<br />
Current borrowings are due for settlement within one year.<br />
Non-current borrowings are due for settlement after more than one year, in accordance with the maturity profile set out below:<br />
in EUR million 2006 2005<br />
Between one and five years 726.4 894.7<br />
After more than five years 665.5 505.8<br />
Non-current borrowings 1,391.9 1,400.5<br />
CONSOLIDATED FINANCIAL STATEMENTS<br />
85
Note 31: BORROWINGS (continued)<br />
The exposure of the Group’s borrowings to interest rate changes and the repricing dates (before the effect of the debt derivatives) at the balance<br />
sheet date is as follows:<br />
in EUR million 2006 2005<br />
Less than one year 1,213.8 1,124.0<br />
Between one and five years 136.8 346.4<br />
After more than five years 665.5 505.8<br />
Borrowings 2,016.1 1,976.2<br />
The interest rate and currency profiles of borrowings are as follows (including the value of the adjustment for hedged borrowings disclosed in note 32):<br />
in EUR million 2006 2005<br />
Fixed Floating Total Fixed Floating Total<br />
Currency rate rate rate rate<br />
EUR 441.0 1,085.5 1,526.5 418.2 1,004.0 1,422.2<br />
GBP 33.5 81.6 115.1 33.8 135.4 169.2<br />
USD 354.2 28.7 382.9 363.4 26.2 389.6<br />
Other 3.2 45.2 48.4 2.8 46.5 49.3<br />
Total 831.9 1,241.0 2,072.9 818.2 1,212.1 2,030.3<br />
When the effects of debt derivatives are taken into account, the interest rate and currency profiles of borrowings are as follows:<br />
in EUR million 2006 2005<br />
Fixed Floating Total Fixed Floating Total<br />
Currency rate rate rate rate<br />
EUR 1,306.7 499.1 1,805.8 1,181.0 621.7 1,802.7<br />
GBP 131.1 26.3 157.4 96.5 17.7 114.2<br />
USD 3.9 24.9 28.8 2.9 26.1 29.0<br />
Other 32.7 48.2 80.9 35.2 49.2 84.4<br />
Total 1,474.4 598.5 2,072.9 1,315.6 714.7 2,030.3<br />
The floating rate borrowings bear interest at various rates set with reference to the prevailing EURIBOR or equivalent. The range of interest rates<br />
applicable for fixed rate borrowings outstanding is as follows:<br />
2006 2005<br />
Currency Min. Max. Min. Max.<br />
EUR 3.8% 6.8% 2.7% 6.8%<br />
GBP 5.3% 5.9% 4.0% 6.7%<br />
USD 5.4% 6.1% 8.5% 8.5%<br />
Other 4.3% 5.0% 6.0% 8.0%<br />
The fair value of current borrowings approximates to their carrying amount. The fair value of non-current borrowings is set out below:<br />
in EUR million 2006 2005<br />
Fair Carrying Fair Carrying<br />
value amount value amount<br />
Bonds 198.1 200.0 208.5 200.0<br />
Bonds under securitisation programme 231.0 231.0 - -<br />
Obligations under finance leases 8.4 10.4 7.9 7.9<br />
Bank loans, loan notes and other loans 870.9 917.8 1,187.8 1,159.9<br />
Deferred consideration 35.5 32.7 34.7 32.7<br />
Non-current borrowings 1,343.9 1,391.9 1,438.9 1,400.5<br />
The fair value of the bonds is determined based on their market prices. The fair value of the bonds under securitisation programme is equal to<br />
their carrying amount. The fair value of the other borrowings is estimated by discounting the future contractual cash flows at the current market<br />
interest rate that is available to the Group for similar financial instruments.<br />
Certain of the borrowings in the Group have covenants attached.<br />
86 D’Ieteren - Annual Report 2006
Note 32: NET DEBT<br />
Net debt is a non-GAAP measure, i.e. its definition is not addressed by IFRS. The Group does not represent net debt as an alternative to financial<br />
measures determined in accordance with IFRS. The Group uses the concept of net debt to reflect its indebtedness. Net debt is based on<br />
borrowings less cash, cash equivalents and current asset investments. It excludes the fair value of derivative debt instruments. The hedged<br />
borrowings (i.e. those that are accounted for in accordance with the hedge accounting rules of IAS 39) are translated at the contractual foreign<br />
exchange rates of the related cross currency swaps. The other borrowings are translated at closing foreign exchange rates.<br />
in EUR million 31 December 2006 31 December 2005<br />
Automobile Car Vehicle Group Automobile Car Vehicle Group<br />
Distribution Rental Glass Distribution Rental Glass<br />
Non-current borrowings 484.6 593.9 313.4 1,391.9 393.8 646.2 360.5 1,400.5<br />
Current borrowings 28.4 515.1 80.7 624.2 144.4 390.6 40.7 575.7<br />
Adjustment for hedged borrowings - 56.8 - 56.8 - 54.1 - 54.1<br />
Gross debt 513.0 1,165.8 394.1 2,072.9 538.2 1,090.9 401.2 2,030.3<br />
Less: Cash and cash equivalents -1.5 -116.6 -37.8 -155.9 -1.4 -98.8 -18.5 -118.7<br />
Less: Current financial assets -25.5 -22.6 - -48.1 - -15.0 -3.5 -18.5<br />
Net debt 486.0 1,026.6 356.3 1,868.9 536.8 977.1 379.2 1,893.1<br />
Note 33: PUT OPTIONS GRANTED TO MINORITY SHAREHOLDERS<br />
The Group is committed to acquiring the minority shareholdings owned by third parties in Belron, should these third parties wish to exercise their<br />
put options. IAS 32 requires that the exercise price of such options granted to minority interest (EUR 223.3 million at 31 December 2006, of which<br />
EUR 84.3 million of put options with related call options, exercisable until 2014, and EUR 139.0 million of put options with no related call options,<br />
exercisable until 2009) be reflected as a financial liability in the consolidated balance sheet. As of this moment, there remains some uncertainty<br />
regarding the treatment of the difference between the exercise price of the options and the carrying value of the minority interest that must be<br />
presented within financial liabilities (EUR 106.3 million at 31 December 2006). In the absence of guidance from IFRIC, the Group has chosen to<br />
present such differences as additional goodwill (EUR 117.0 million). This goodwill is adjusted at period end to reflect the change in the exercise<br />
price of the options and the carrying value of minority interest to which they relate. This treatment reflects the economic substance of the<br />
transaction, and has no impact on the result attributable to equity holders of the Parent.<br />
The exercise price of the put options takes into account estimates of the future profitability of Belron. Should the underlying estimates change,<br />
the value of the put options recognised in the balance sheet (and of the related goodwill) would be impacted (this would however have no impact<br />
on the income statement under the accounting treatment currently applied).<br />
Note 34: OTHER NON-CURRENT PAYABLES<br />
Other non-current payables are non interest-bearing deferred consideration on acquisitions, payable after more than 12 months. The carrying value<br />
of other non-current payables approximates to their fair value.<br />
Note 35: TRADE AND OTHER CURRENT PAYABLES<br />
Trade and other payables are analysed below:<br />
in EUR million 2006 2005<br />
Automobile Car Vehicle Group Automobile Car Vehicle Group<br />
Distribution Rental Glass Distribution Rental Glass<br />
Trade payables 95.7 362.7 61.8 520.2 119.4 352.4 59.7 531.5<br />
Accrued charges and deferred income 34.2 221.7 0.5 256.4 31.8 226.3 0.8 258.9<br />
Non-income taxes 0.5 11.6 11.1 23.2 2.0 3.1 8.7 13.8<br />
Deferred consideration on acquisitions - - 6.9 6.9 - 0.1 12.9 13.0<br />
Other creditors 37.4 75.2 177.1 289.7 33.0 75.4 159.3 267.7<br />
Trade and other payables 167.8 671.2 257.4 1,096.4 186.2 657.3 241.4 1,084.9<br />
Trade and other current payables are expected to be settled within 12 months. The carrying value of trade and other current payables approximates<br />
to their fair value.<br />
CONSOLIDATED FINANCIAL STATEMENTS<br />
87
Note 36: EMPLOYEE BENEFIT EXPENSE<br />
The employee benefit expense is analysed below:<br />
in EUR million 2006 2005<br />
Automobile Car Vehicle Group Automobile Car Vehicle Group<br />
Distribution Rental Glass Distribution Rental Glass<br />
Retirement benefit charges under defined<br />
contribution schemes -4.0 -4.4 -9.2 -17.6 -3.1 -3.9 -9.7 -16.7<br />
Retirement benefit charges under defined<br />
benefit schemes (see note 20) -0.6 -9.4 -5.7 -15.7 -1.5 -13.2 -5.3 -20.0<br />
Total retirement benefit charge -4.6 -13.8 -14.9 -33.3 -4.6 -17.1 -15.0 -36.7<br />
Wages, salaries and social security costs -102.4 -278.4 -495.5 -876.3 -96.7 -266.2 -386.4 -749.3<br />
Share-based payments: cash-settled - - - - - - 2.1 2.1<br />
Share-based payments: equity-settled -0.5 -0.2 - -0.7 -0.3 -0.4 - -0.7<br />
Total employee benefit expense -107.5 -292.4 -510.4 -910.3 -101.6 -283.7 -399.3 -784.6<br />
of which: current items -107.5 -296.8 -513.0 -917.3 -101.6 -283.7 -401.4 -786.7<br />
unusual items (defined benefit schemes -<br />
see notes 9 and 20) - 4.4 2.6 7.0 - - 2.1 2.1<br />
The above expense does not include the amounts charged during the period relating to the long-term management incentive scheme mentioned<br />
in note 30.<br />
The staff numbers are set out below (average full time equivalents):<br />
2006 2005<br />
Automobile Distribution 1,571 1,505<br />
Car Rental 6,276 6,253<br />
Vehicle Glass 12,731 10,932<br />
Group 20,578 18,690<br />
Note 37: Share-based payments<br />
There are in the Group two kinds of equity-settled share-based payment schemes:<br />
- Since 1999, share option schemes have been granted to officers and managers of the Automobile Distribution segment, in the framework of the<br />
Belgian law of 26 March 1999. The underlying share is the ordinary share of s.a. D’Ieteren n.v.<br />
- Since 1997, several share option schemes, an equity partnership plan, a performance share plan and a share retention plan have been granted to<br />
certain categories of employees in the Car Rental segment. The underlying share is the ordinary share of Avis Europe plc.<br />
Automobile Distribution Segment<br />
Options outstanding are as follows:<br />
Number of options<br />
Exercise<br />
(in units) price Exercise period<br />
Date of grant 2006 2005 (in EUR) From To<br />
2006 8,315 - 266.0 1/1/2010 27/11/2016<br />
2005 11,710 12,210 209.0 1/1/2009 6/11/2015<br />
2004 9,035 9,035 142.0 1/1/2008 28/11/2014<br />
2003 12,805 12,805 163.4 1/1/2007 16/11/2013<br />
2002 9,830 17,480 116.0 1/1/2006 13/10/2015<br />
2001 8,245 13,475 133.0 1/1/2005 25/10/2014<br />
2000 14,800 14,770 267.0 1/1/2004 25/9/2013<br />
1999 11,735 11,710 375.0 1/1/2003 17/10/2012<br />
Total 86,475 91,485<br />
A high proportion of outstanding options is covered by treasury shares (see note 29).<br />
88 D’Ieteren - Annual Report 2006
Note 37: Share-based payments (continued)<br />
A reconciliation of the movements in the number of outstanding options during the year is as follows:<br />
Number<br />
(in units)<br />
Weighted average<br />
exercise price<br />
(in EUR)<br />
2006 2005 2006 2005<br />
Outstanding options at the beginning of the period 91,485 86,580 197.6 190.6<br />
Granted during the period 8,315 12,210 266.0 209.0<br />
Forfeited during the period - -30 - 267.0<br />
Exercised during the period -13,380 -7,295 125.5 133.0<br />
Other movements during the period 55 20 159.4 129.0<br />
Outstanding options at the end of the period 86,475 91,485 215.4 197.6<br />
of which: exercisable at the end of the period 44,610 39,955 237.4 253.5<br />
In 2006, two third of the options were exercised during the second half of the period. The average share price during the period was EUR 250.9<br />
(2005: EUR 185.3).<br />
For share options outstanding at the end of the period, the weighted average remaining contractual life is as follows:<br />
Number<br />
of years<br />
31 December 2006 7.7<br />
31 December 2005 8.6<br />
IFRS 2 “Share-Based Payment” requires that the fair value of all share options issued after 7 November 2002 is charged to the income statement.<br />
The fair value of the options must be assessed on the date of each issue. A simple Cox valuation model was used at each issue date re-assessing<br />
the input assumptions on each occasion. The assumptions for the 2006 and 2005 issues were as follows:<br />
2006 2005<br />
Number of employees 140 168<br />
Spot share price (in EUR) 270.1 227.0<br />
Option exercise price (in EUR) 266.0 209.0<br />
Vesting period (in years) 3.0 3.0<br />
Expected life (in years) 6.9 6.8<br />
Expected volatility (in %) 17% 20%<br />
Risk free rate of return (in %) 4.18% 3.47%<br />
Expected dividend (in EUR) 2.50 2.32<br />
Probability of ceasing employment before vesting (in %) - -<br />
Weighted average fair value per option (in EUR) 83.5 74.4<br />
Expected volatility and expected dividends were provided by an independent expert. The risk free rate of return is based upon EUR zero-coupon<br />
rates with an equivalent term to the options granted.<br />
Car Rental Segment<br />
The share option schemes of the Car Rental segment might have a dilutive impact on the Group’s shareholding in Avis Europe plc. The total<br />
number of share options in issue at 31 December 2006 is 7,093,000 (2005: 9,211,300). This represents 0.8% (2005: 1.0%) of Avis Europe plc share<br />
capital. These share options can be exercised until 2014 (2005: 2014). Details on these share option schemes are provided in Avis Europe’s annual<br />
report.<br />
Note 38: Risks related to financial instruments<br />
Treasury policies aim to ensure permanent access to sufficient liquidity, and to monitor and limit interest and currency exchange risks.<br />
To minimise liquidity risk, each of the Group’s three businesses ensures, on the basis of long-term financial projections, that it has a core level of<br />
committed long-term funding in place, with maturities spread over a wide range of dates, supplemented by various shorter-term, usually<br />
uncommitted, facilities.<br />
CONSOLIDATED FINANCIAL STATEMENTS<br />
89
Note 38: Risks related to financial instruments (continued)<br />
To mitigate interest and currency risks, tradable derivatives may be used, such as interest rate and foreign exchange swaps, forward rate<br />
agreements, foreign exchange forward contracts or options. Transactions are only undertaken with counterparties of strong credit quality and must<br />
be related to existing or highly probable exposures.<br />
Credit risk on trade and other receivables is mitigated both by the selection of counterparties based on credit quality, and their diversity. Certain<br />
receivables are also credit insured.<br />
There is no meaningful price risk other than those mentioned above.<br />
Within this framework, considerable <strong>auto</strong>nomy is granted to each of the three businesses.<br />
Note 39: Contingencies and commitments<br />
in EUR million 2006 2005<br />
Commitments to acquisition of non-current assets 50.1 166.8<br />
Other important commitments:<br />
Commitments given 41.6 29.9<br />
Commitments received 5.5 12.0<br />
The commitments to acquisition of non-current assets mainly concern the vehicle fleet of the Car Rental segment.<br />
The Group is a lessee in a number of operating leases. The related future minimum lease payments under non-cancellable operating leases, per<br />
maturity, are as follows:<br />
in EUR million 2006 2005<br />
Within one year 137.1 86.0<br />
Later than one year and less than five years 201.7 180.1<br />
After five years 107.8 48.2<br />
Total 446.6 314.3<br />
At each year end, the Group also had prepaid various other operating lease commitments in relation to vehicles purchased under buy-back<br />
agreements, included in vehicle related receivables in note 27.<br />
The Group also acts as a lessor in a number of operating leases, mainly through its wholly-owned subsidiary s.a. D’Ieteren Lease n.v. The related<br />
future minimum lease payments under non-cancellable operating leases, per maturity, are as follows:<br />
in EUR million 2006 2005<br />
Investment Vehicles Other Total Investment Vehicles Other Total<br />
property property, property property,<br />
plant and<br />
plant and<br />
equipment<br />
equipment<br />
Within one year - 70.9 - 70.9 0.3 64.1 - 64.4<br />
Later than one year<br />
and less than five years 0.6 98.4 - 99.0 0.4 90.7 - 91.1<br />
After five years 0.5 - - 0.5 0.1 - - 0.1<br />
Total 1.1 169.3 - 170.4 0.8 154.8 - 155.6<br />
At each year end, the Group also had prepaid various other operating lease commitments in relation to vehicles sold under buy-back agreements,<br />
included in deferred income in note 35.<br />
The revenue, expenses, rights and obligations arising from leasing arrangements regarding investment property are not considered material to the<br />
Group, and accordingly a general description of these leasing arrangements is not disclosed.<br />
Under the securitisation programme (see notes 14, 19, 25, 31), D’Ieteren Lease granted a floating charge on its business to the bondholders to<br />
secure its obligations. The floating charge was granted for up to the following amounts:<br />
- in respect of principal: EUR 324.0 million;<br />
- three years of interest calculated at the rate of 5%, or such other rate as may be agreed between the parties.<br />
Etablissementen Verellen n.v., a wholly-owned subsidiary of the Group, granted a floating charge on its business to its creditors to secure its<br />
obligations. The floating charge was granted for up to EUR 0.6 million.<br />
90 D’Ieteren - Annual Report 2006
Note 40: RELATED PARTY TRANSACTIONS<br />
in EUR million 2006 2005<br />
With entities with joint control or significant influence over the Group:<br />
Amount of the transactions entered into during the period 0.7 0.4<br />
Outstanding creditor balance at 31 December 8.3 5.9<br />
With associates:<br />
Sales 7.0 10.6<br />
Purchases -0.5 -0.3<br />
Trade receivables outstanding at 31 December 0.4 0.3<br />
With joint ventures in which the Group is a venturer:<br />
Sales 0.5 0.4<br />
Trade receivables outstanding at 31 December 0.1 0.2<br />
With key management personnel:<br />
Compensation:<br />
Short-term employee benefits 3.8 5.1<br />
Post-employment benefits 0.2 0.2<br />
Total compensation 4.0 5.3<br />
Amount of the other transactions entered into during the period n/a n/a<br />
Outstanding creditor balance at 31 December n/a n/a<br />
With other related parties:<br />
Amount of the transactions entered into during the period 0.6 1.0<br />
Outstanding creditor balance at 31 December - -<br />
Note 41: Subsequent events<br />
Automobile Distribution<br />
On 4 January 2007, the Automobile Distribution segment acquired a 100% interest in Kronos Management s.a. and Kronos Automobiles s.a.<br />
(collectively “Kronos”), which operate a garage distributing the make Porsche in Gembloux, Belgium. The provisional fair value of the net assets<br />
acquired amounted to EUR 1.3 million, after fair value adjustments of EUR 1.0 million. The consideration, satisfied by a cash payment, amounted<br />
to EUR 3.7 million. The goodwill arising from this acquisition is currently estimated at EUR 2.4 million. After elimination of inter-company<br />
transactions, the additional sales arising from this acquisition will be marginal, while the additional result is not expected to be material to the<br />
Group and accordingly is not disclosed separately.<br />
Vehicle Glass<br />
D’Ieteren announced on 6 February 2007 that Belron has signed an agreement to acquire, subject to local regulatory approval and other<br />
customary closing conditions, Safelite Group, Inc., the US leader in the vehicle glass repair and replacement (“VGRR”) market, for an enterprise<br />
value of USD 334 million (EUR 258 million), including assumed debt.<br />
This acquisition will be entirely financed by Belron through the issuance of new debt instruments, on its own financing capacity. Based on<br />
estimated 2006 results of Safelite, this acquisition would have resulted in an increase of EUR 8 million of the current PBT, Group’s share (as<br />
defined in note 9), of D’Ieteren on a pro-forma 2006 full year basis.<br />
The transaction is expected to close in March 2007, and the integration of Belron Inc., the current US subsidiary of Belron, and Safelite operations<br />
would begin at that time.<br />
After year-end, Belron negotiated a new EUR 750 million underwritten facility agreement to ensure adequate future funding for strategic<br />
initiatives and the immediate funding requirement for the acquisition of Safelite. The EUR 750 million facilities are divided into a 5 year<br />
multicurrency revolving facility of EUR 500 million and a EUR 250 million, 364 day short-term facility with a further 364 day term out option. It is<br />
Belron’s intention to refinance this short-term facility via a US private placement in the forthcoming months. This will achieve an appropriate mix<br />
for Belron between long-term core borrowing and shorter term revolving debt together with a diversification of it’s lender base.<br />
CONSOLIDATED FINANCIAL STATEMENTS<br />
91
Note 42: List of subsidiaries, associates and joint ventures<br />
The full list of companies concerned by articles 114 and 165 of the Royal Decree of 30 January 2001 implementing the Company Code will be lodged<br />
with the Central Balance Sheet department of the National Bank of Belgium. It is also available on request from the Parent head office (see note 1).<br />
The main fully consolidated subsidiaries of the Parent are listed below:<br />
Name Country of % of share % of share<br />
incorporation capital owned capital owned<br />
at 31 Dec. 2006 at 31 Dec. 2005<br />
Automobile Distribution<br />
s.a. D’Ieteren Lease n.v. Belgium 100% 100%<br />
s.a. D’Ieteren Sport n.v. Belgium 75% 75%<br />
s.a. D’Ieteren Services n.v. Belgium 100% 100%<br />
s.a. D’Ieteren Treasury n.v. Belgium 100% 100%<br />
D’Ieteren Trading b.v. The Netherlands 100% 100%<br />
D’Ieteren Invest s.a. Luxemburg 100% 100%<br />
Dicobel s.a. Belgium 100% 100%<br />
Car Rental<br />
Avis Europe plc United Kingdom 59.59% 59.59%<br />
Vehicle Glass<br />
Belron s.a. Luxemburg 73.73% 73.73%<br />
Taking into account the treasury shares held by Avis Europe, the percentages used for the consolidation of Avis Europe are slightly higher than the<br />
proportion held in Avis Europe’s share capital shown above:<br />
2006 2005<br />
Average percentage 59.63% 59.65%<br />
Year-end percentage 59.62% 59.64%<br />
Note 43: EXCHANGE RATES<br />
Monthly income statements of foreign operations are translated at the relevant rate of exchange for that month. Except for the balance sheet<br />
which is translated at the closing rate, each line item in these consolidated financial statements represents a weighted average rate.<br />
The main exchange rates used for the translations were as follows:<br />
Number of euros for one unit of foreign currency 2006 2005<br />
Closing rate<br />
AUD 0.59 0.62<br />
BRL 0.35 0.37<br />
CAD 0.66 0.72<br />
GBP 1.49 1.48<br />
USD 0.76 0.84<br />
Average rate (1)<br />
AUD 0.60 0.61<br />
BRL 0.37 0.33<br />
CAD 0.70 0.67<br />
GBP (2) 1.43 1.46<br />
USD 0.80 0.81<br />
(1) Effective average rate for the profit or loss attributable to equity holders.<br />
(2) Both the Car Rental segment and the Vehicle Glass segment have significant operations in GBP. The average presented is the average of the Car Rental average rate (1.38 at<br />
31 December 2006; 1.45 at 31 December 2005) and of the Vehicle Glass average rate (1.47 at 31 December 2006; 1.46 at 31 December 2005).<br />
92 D’Ieteren - Annual Report 2006
Note 44: Auditor’s report<br />
Statutory Auditor’s report to the General Meeting of Shareholders of D’Ieteren s.a. in respect of the financial consolidated statements for<br />
the financial year closed as at December 31, 2006<br />
In accordance with the existing legal requirements, we have the honour to report herewith on the performance of our functions as statutory auditor.<br />
The present report includes our opinion on the financial consolidated statements as well as the additional required information.<br />
Unqualified audit opinion on the consolidated financial statements<br />
We have audited the financial consolidated statements for the financial year ended December 31, 2006, established on the basis of the International<br />
Financial Information Standards referential as adopted by the European Union, of which the balance sheet closes with a total of EUR 5,130.2 million<br />
and of which the profit and loss account closes with a profit for the year attributable to equity holders for an amount of EUR 100.00 million.<br />
The financial statements of the foreign daughter companies, which are included in the consolidation, were audited by other auditors; our statement<br />
is thereby based on their opinion.<br />
The preparation of the financial consolidated statements is carried out under the responsibility of the management of the company. This<br />
responsibility includes: the conception, installation and follow up of the internal control in respect of the drafting and a sincere presentation of the<br />
financial consolidated statements so as to asurtain that these do not include significant irregularities as may result from fraud or errors; the choice<br />
and practical application of appropriated accounting methods and the determination of reasonable accounting valuations considering the<br />
circumstances.<br />
Our responsibility is to express opinion on the financial statements on the basis of the audit. We proceeded with our audit in accordance with the<br />
legal regulations and in accordance with the audit norms applicable in Belgium such as fixed by the Belgian Institute of Chartered Auditors (Institut<br />
des Reviseurs d’Entreprises).<br />
These audit standards require that our control be organized and performed in such a way so as to obtain a reasonable certitude that the financial<br />
statements do not include material irregularities as may result from fraud or errors.<br />
In accordance with those standards, we considered the group’s administrative and accounting organisation as a consolidated entity as well as the<br />
existing internal control systems. We obtained from the company’s management and employees the explanation and information, which were<br />
necessary in order to perform our audit. We have examined the figures showing in the financial consolidated statements. We have assessed the<br />
valuation rules, consolidation rules and reasonable character of the material accounting estimates made by the company as well as the presentation<br />
of the overall consolidated financial statements. We believe that our audit provides a reasonable basis for our opinion.<br />
In our opinion, the financial consolidated statements for the financial year closed as 31st December 2006 give true view of the equity, financial<br />
situation, financial performance and cash flows of the consolidated group, in accordance with the referential of International Financial Information<br />
Standards as these have been adopted by the European Union.<br />
Additional information<br />
Establishing the consolidated report and its contents is the responsibility of the management.<br />
Our responsibility is to include in our report the following additional mention which however does not modify the extent of our opinion on the<br />
consolidated statements:<br />
- The consolidated management report includes the information required by law and is in agreement with the consolidated statements. We are,<br />
however, unable to comment the description of the principal risks and uncertainties, which the group is facing, and of its situation, its foreseeable<br />
evolution or the significant influence of certain facts on its future development. We can nevertheless confirm that the informations disclosed do<br />
not present any obvious contradictions with the informations of which we became aware during our audit.<br />
Brussels, March 11th, 2007<br />
SC DELVAUX, FRONVILLE, SERVAIS ET ASSOCIéS<br />
Statutory Auditor<br />
Represented by<br />
Jean-Louis SERVAIS<br />
Reviseur d’Entreprises<br />
Gérard DELVAUX<br />
Reviseur d’Entreprises<br />
CONSOLIDATED FINANCIAL STATEMENTS<br />
93
94 D’Ieteren - Annual Report 2006
s.a. D’Ieteren n.v.<br />
Abridged Statutory<br />
Financial Statements 2006<br />
Contents<br />
96 Abridged Balance Sheet<br />
97 Abridged Income Statement<br />
97 Abridged Notes<br />
98 Summary of Accounting Policies<br />
The statutory financial statements of s.a. D’Ieteren n.v. are summarised below in accordance with article 105 of the Company Code. The unabridged<br />
version of the statutory financial statements of s.a. D’Ieteren n.v., the related management report and Statutory Auditor’s report shall be deposited at the<br />
National Bank of Belgium within the legal deadline and may be obtained free of charge from the internet site www.dieteren.com or on request from:<br />
s.a. D’Ieteren n.v.<br />
Rue du Mail 50<br />
B-1050 Brussels<br />
The Statutory Auditor has issued an unqualified opinion on the statutory financial statements of s.a. D’Ieteren n.v.<br />
Abridged Statutory Financial Statements 95
Abridged Balance Sheet<br />
At 31 December<br />
in EUR million 2006 2005<br />
Assets<br />
Fixed assets 2,278.9 2,109.4<br />
II. Intangible assets 1.9 0.6<br />
III. Tangible assets 94.2 96.7<br />
IV. Financial assets 2,182.8 2,012.1<br />
Current assets 343.9 342.1<br />
V. Non-current receivables 0.8 -<br />
VI. Stocks 281.2 272.4<br />
VII. Amounts receivable within one year 35.4 49.2<br />
VIII. Investments 14.8 8.6<br />
IX. Cash at bank and in hand 1.2 1.0<br />
X. Deferred charges and accrued income 10.5 10.9<br />
Total assets 2,622.8 2,451.5<br />
in EUR million 2006 2005<br />
Liabilities<br />
Capital and reserves 782.7 767.6<br />
I.A. Issued capital 160.0 160.0<br />
II. Share premium account 24.4 24.4<br />
IV. Reserves 572.8 556.6<br />
V. Accumulated profits 25.5 26.6<br />
Provisions and deferred taxes 34.9 30.6<br />
Creditors 1,805.2 1,653.3<br />
VIII. Amounts payable after one year 1,262.5 1,373.7<br />
IX. Amounts payable within one year 501.2 243.6<br />
X. Accrued charges and deferred income 41.5 36.0<br />
Total liabilities 2,622.8 2,451.5<br />
96 D’Ieteren - Annual Report 2006
Abridged Income Statement<br />
in EUR million 2006 2005<br />
I. Operating income 2,425.5 2,182.2<br />
II. Operating charges 2,365.4 2,145.7<br />
III. Operating profit 60.1 36.5<br />
IV. Financial income 34.8 108.2<br />
V. Financial charges 65.2 46.8<br />
VI. Profit on ordinary activities before income taxes 29.7 97.9<br />
VII. Extraordinary income - 12.4<br />
VIII. Extraordinary charges - 5.4<br />
IX. Profit for the period before taxes 29.7 104.9<br />
IXbis. Deferred taxes - 0.1<br />
X. Income taxes - 0.1<br />
XI. Profit for the period 29.7 105.1<br />
XII. Variation of untaxed reserves (1) 0.1 0.2<br />
XIII. Profit for the period available for appropriation 29.8 105.3<br />
(1) Transfers from untaxed reserves (+) / Transfers to untaxed reserves (-).<br />
Abridged Notes<br />
Auditor’s Remuneration<br />
The Statutory Auditor is SC Delvaux, Fronville, Servais et Associés (“DFSA”). Auditor’s remuneration, including the fees charged by entities<br />
related to the Statutory Auditor as defined by article 134 of the Company Law, is analysed as follows:<br />
in EUR 2006<br />
Audit<br />
s.a. D’Ieteren n.v. (charged by DFSA) 144,000<br />
Subsidiaries (charged by DFSA) 57,957<br />
Non-audit<br />
Other assurance services<br />
s.a. D’Ieteren n.v. (charged by DFSA) 3,535<br />
Subsidiaries (charged by DFSA) 49,285<br />
Tax advisory services (charged by SC Socofidex) 9,833<br />
Total 264,610<br />
Abridged Statutory Financial Statements<br />
97
Summary of Accounting Policies<br />
The capitalised costs for the development of information technology projects (intangible assets) are amortised on a straight-line basis over<br />
their useful life. The amortisation period cannot be less than 2 years nor higher than 7 years.<br />
Tangible Fixed Assets are recognised at their acquisition value; this value does not include borrowing costs. Assets held by virtue of long-term<br />
leases (“emphytéose”), finance leases or similar rights are entered at their capital reconstitution cost. The rates of depreciation for fixed assets<br />
depend on the probable economic lifetime for the assets concerned. As from the 1st of January 2003, tangible fixed assets acquired or<br />
constructed after this date shall be depreciated pro rata temporis and the ancillary costs shall be depreciated at the same rate as the tangible fixed<br />
assets to which they relate.<br />
The main depreciation rates are the following:<br />
Rate<br />
Method<br />
Buildings 5% L/D<br />
Building improvements 10% L/D<br />
Warehouse and garage 15% L/D<br />
Network identification equipment 20% L/D<br />
Furniture 10% L/D<br />
Office equipment 20% L/D<br />
Rolling stock 25% L<br />
Heating system 10% L/D<br />
EDP hardware 20%-33% L/D<br />
L: straight-line.<br />
D: declining balance (at a rate twice as high as the equivalent straight-line rate).<br />
Tangible fixed assets are revalued if they represent a definite, long-term capital gain. Depreciation of any revaluation surplus is calculated linearly<br />
over the remaining lifetime in terms of the depreciation period of the asset concerned.<br />
Financial Fixed Assets are entered either at their acquisition price, after deduction of the uncalled amounts (in the case of shareholdings), or at<br />
their nominal value (amounts receivable). They can be revalued, and are written down if they suffer a capital loss or a justifiable long-term loss in<br />
value. The ancillary costs are charged to the income statement during the financial year.<br />
Amounts Receivable within one year and those receivable after one year are recorded at their nominal value. Write-downs are applied if<br />
repayment by the due date is uncertain or compromised in whole or in part, or if the repayment value at the closing date is less than the book<br />
value.<br />
Stocks of new vehicles are valued at their individual acquisition price. Other categories of stocks are valued at their acquisition price according to<br />
the fifo method, the weighted average price or the individual acquisition price. Write-downs are applied as appropriate, according to the selling<br />
price or the market value.<br />
Treasury Investments and Cash at Bank and in Hand are recorded at their acquisition value. They are written down if their realisation value on<br />
the closing date of the financial year is less than their acquisition value.<br />
When these treasury investments consist of own shares held for hedging share options, additional write-downs are applied if the exercise price is<br />
less than the book value resulting from the above paragraph.<br />
Provisions for Liabilities and Charges are subject to individual valuation, taking into account any foreseeable risks. They are written back by the<br />
appropriate amount at the end of the financial year if they exceed the current assessment of the risks which they were set aside to cover.<br />
Amounts Payable are recorded at their nominal value.<br />
Valuation of assets and liabilities in foreign currencies<br />
Financial fixed assets are valued in accordance with recommendation 152/4 by the Accounting Standards Commission. Stocks are valued at their<br />
historical cost. However, the market value (as defined by the average rate on the closing date of the balance sheet) is applied if this is less than<br />
the historical cost. Monetary items and commitments are valued at the official rate on the closing date, or at the contractual rate in the case of<br />
specific hedging operations. Only negative differences for each currency are entered in the income statement.<br />
98 D’Ieteren - Annual Report 2006
Major Risk Factors (1)<br />
Automobile Distribution: D’Ieteren Auto’s activity is primarily based on close relations built during the last sixty years with the Volkswagen<br />
group and largely depending on the existence of import agreements between both parties. This close relationship also makes the results of<br />
D’Ieteren Auto dependent on the success of the models developed by the Volkswagen group. Furthermore, future developments of the European<br />
regulation concerning <strong>auto</strong>mobile distribution could potentially influence the competitive environment in a way that is difficult to foresee for the<br />
time being. The development of environmental standards or tax regulation on company cars could have a negative influence on volumes and mix<br />
of new vehicles sold. D’Ieteren Lease’s fleet represents an important asset of which the value is largely depending on the used vehicle market<br />
development.<br />
Car Rental: with about 50% of its sales coming from airports, Avis Europe’s results can be influenced by the risks faced by the air transport<br />
sector such as geopolitical instability, significant higher petrol prices and the economical environment in general. Fleet costs, one of the most<br />
important elements in operating costs, largely depend on the buying conditions negotiated with the car manufacturers, on the selling conditions<br />
on the used car market and are therefore depending on the car industry development in general. It is important for the activity to have access to<br />
the necessary funds in order to finance the fleet. During the last years, competition in the car rental sector has intensified notably due to the<br />
Internet development with a tougher pricing environment as a consequence. In this difficult context, leading to continued margin reductions,<br />
Avis Europe implemented a recovery strategy aiming at higher profitability.<br />
Vehicle Glass: Belron operates in the vehicle glass repair and replacement (VGRR) market which is dependent on various factors notably<br />
weather conditions, changes in the vehicle park and driving speed. Weather extremes create peaks in demand which need to be managed<br />
through flexible operations whilst changes in vehicle technology or traffic speed result in changes in breakage rates and thereby overall market<br />
size. The VGRR market is also influenced by insurer and commercial business decisions towards glass coverage and preferred suppliers.<br />
Changes in insurance coverage affect motorists’ propensity to act on damage despite the associated safety risk. Belron employs around 18,500<br />
full time equivalents and makes a significant investment in training to insure all its staff are appropriately qualified to fulfill their roles throughout<br />
the business. In addition, Belron uses sophisticated information technology and centralised distribution facilities which are key to the business<br />
operation and represent key risk points. In addition to its organic operational activities, Belron is also an acquisitive company and accordingly<br />
faces the usual risks associated with buying and integrating businesses.<br />
Risks related to financial instruments are explained in note 38 of the consolidated financial statements.<br />
(1) Publication in accordance with the law of 13 January 2006 modifying the Company Code.<br />
MAJOR RISK FACTORS<br />
99
Share information<br />
FINANCIAL YEAR FROM 1 JANUARY TO 31 DECEMBER<br />
Minimum lot<br />
1 share<br />
ISIN code BE 0003669802<br />
Sicovam code or security code 941039<br />
Reuters code<br />
IETB.BR<br />
Bloomberg code<br />
DIE.BB<br />
FTSE classification<br />
Business Support Services<br />
EVOLUTION OF THE SHARE PRICE AND TRADED VOLUMES<br />
IN 2006<br />
Share Price (EUR)<br />
300<br />
250<br />
200<br />
150<br />
100<br />
50<br />
Volumes<br />
40,000<br />
35,000<br />
30,000<br />
25,000<br />
20,000<br />
15,000<br />
10,000<br />
5,000<br />
INDICES<br />
D’Ieteren share forms part of the Next 150, Next Prime and BEL MID<br />
indices of Euronext with respective weighting of 0.61%, 1.84% and<br />
3.68% as at 28 February 2007. It also forms part of sector indices<br />
published by MSCI, Dow Jones, Eurostoxx and Bloomberg.<br />
DIVIDEND<br />
If the allocation of results proposed on note 29 of this Annual Report is<br />
approved by the Ordinary General Meeting of 31 May 2007, a gross dividend<br />
for the 2006 year of EUR 2.6400 per share will be distributed, i.e.:<br />
• a net dividend of EUR 1.9800 in return for coupon n°16, after deduction<br />
of the occupancy tax of 25%;<br />
• a net dividend of EUR 2.2440 in return for the coupon and VVPR strip<br />
n°16, after deduction of the occupancy tax of 15%.<br />
Payment of the dividend will take place as from 7 June 2007 at the head<br />
offices and branches of the following establishments:<br />
• Bank Degroof<br />
• Fortis Bank<br />
• ING Bank<br />
• Petercam<br />
GROSS DIVIDEND PER SHARE (IN EUR)<br />
0<br />
01/06<br />
02/06<br />
03/06<br />
04/06<br />
05/06<br />
06/06<br />
07/06<br />
0<br />
3.0<br />
EVOLUTION OF THE SHARE PRICE OVER 5 YEARS (IN EUR)<br />
300<br />
250<br />
2.5<br />
2.0<br />
1.5<br />
1.0<br />
2.31 2.31 2.31<br />
2.40<br />
2.64<br />
200<br />
0.5<br />
150<br />
0.0<br />
02 03 04 05<br />
06<br />
100<br />
50<br />
0<br />
01/02<br />
07/02<br />
01/03<br />
07/03<br />
01/04<br />
07/04<br />
01/05<br />
07/05<br />
01/06<br />
07/06<br />
01/07<br />
08/06<br />
09/06<br />
10/06<br />
11/06<br />
12/06<br />
01/07<br />
Detailed and historic information on the share price and the traded<br />
volumes are available on the websites of D’Ieteren (www.<br />
dieteren.com) and Euronext (www.euronext.com). Avis Europe,<br />
a 59.6% subsidiary of D’Ieteren, is listed on the London Stock<br />
Exchange in the Transport sector (code AVE.L).<br />
100 D’Ieteren - Annual Report 2006
DeNOMINATOR<br />
31 december 2006 Number Related<br />
voting rights<br />
Existing shares (1) 5,530,262 5,530,262<br />
Participating shares (1) 500,000 500,000<br />
TOTAL 6,030,262<br />
(1) Each of the shares and participating shares grants a voting right.<br />
SHAREHOLDING STRUCTURE<br />
FINANCIAL CALENDAR<br />
31 december 2006 - in voting rights<br />
Nayarit Group 27.06%<br />
SPDG Group 25.10%<br />
Cobepa s.a. 7.05%<br />
Own shares 1.28%<br />
Public 39.51%<br />
Information about the statement of capital can be found on note 29 of<br />
this Annual Report.<br />
PRESS AND INVESTOR RELATIONS<br />
Catherine Vandepopeliere<br />
Financial Communication<br />
s.a. D’Ieteren n.v.<br />
rue du Mail, 50<br />
B-1050 Brussels<br />
Belgium<br />
Tel.: + 32-2-536.54.39<br />
Fax: + 32-2-536.91.39<br />
E-mail: financial.communication@dieteren.be<br />
VAT BE 0403.448.140 – Company registration number Brussels<br />
Information about the Group (press releases, annual reports, financial<br />
calendar, share price, statistical information, social documents…) is<br />
available mostly in three languages (French, Dutch, English) on the<br />
website: www.dieteren.com.<br />
Through the Group’s website it is also possible to subscribe in order<br />
to receive via e-mail information such as: agenda of general meetings,<br />
press releases, articles of association, special reports of the Board of<br />
Directors, publication of the annual report, statutory accounts, payment<br />
of dividend, information regarding the denominator and transparency<br />
declarations.<br />
Ce rapport annuel est également disponible en français.<br />
Dit jaarverslag is beschikbaar in het Nederlands.<br />
Last day for the deposit of shares<br />
for the Ordinary General Meeting 25 May 2007<br />
Ordinary General Meeting 31 May 2007<br />
Payment of the dividend<br />
for the year 2006 7 June 2007<br />
Publication of results<br />
for the first half 2007 28 August 2007<br />
Publication of annual results 2007 February 2008<br />
FORWARD-LOOKING STATEMENTS<br />
This Annual Report contains forward-looking information that involves risks and uncertainties, including statements about D’Ieteren’s plans, objectives, expectations and intentions. Readers are<br />
cautioned that forward-looking statements include known and unknown risks and are subject to significant business, economic and competitive uncertainties and contingencies, many of which<br />
are beyond the control of D’Ieteren. Should one or more of these risks, uncertainties or contingencies materialize, or should any underlying assumptions prove incorrect, actual results could vary<br />
materially from those anticipated, expected, estimated or projected. As a result, D’Ieteren does not assume any responsibility for the accuracy of these forward-looking statements.<br />
Share information 101
Press and investor relations<br />
Catherine Vandepopeliere<br />
Financial Communication<br />
s.a. D’Ieteren n.v.<br />
rue du Mail, 50<br />
B-1050 Brussels<br />
Belgium<br />
Tel.: + 32-2-536.54.39<br />
Fax: + 32-2-536.91.39<br />
E-mail: financial.communication@dieteren.be<br />
Website: www.dieteren.com<br />
VAT BE 0403.448.140 - Company Registration Number Brussels<br />
Ce rapport annuel est également disponible en français.<br />
Dit jaarverslag is beschikbaar in het Nederlands.<br />
Concept and realisation: CHRIS – Communication Agency<br />
www.chriscom.be<br />
Photography: Jean-Michel Byl – Clair Obscur<br />
Nicolas Van Haren and picture libraries of<br />
Audi, Avis, Belron, Bentley, Budget, Carglass,<br />
Lamborghini, Seat, Skoda, Porsche, VW, Yamaha<br />
Prepress and printing: SNEL Grafics, Liège<br />
The major trading brands of the Belron group: Belron ® , the Belron Device, Autoglass ® ,<br />
Carglass ® , Glass Medic ® , Lebeau ® , Duro ® , Speedy Glass ® and Apple AutoGlass ® are<br />
registered trademarks and Elite Auto Glass , GlasPro , Windshield Pros and Auto<br />
Glass Specialists ® are trademarks of Carglass Luxembourg S.à.r.l. - Zug Branch or<br />
associated companies. O’Brien ® is a registered trademark of O’Brien Glass Industries<br />
Limited and Smith & Smith ® is the registered trademark of Carglass NZ Limited.<br />
SAFELITE ® is a registered trademark of Belron US.