2006 National Survey of Fishing, Hunting, and Wildlife-Associated ...
2006 National Survey of Fishing, Hunting, and Wildlife-Associated ...
2006 National Survey of Fishing, Hunting, and Wildlife-Associated ...

Create successful ePaper yourself
Turn your PDF publications into a flip-book with our unique Google optimized e-Paper software.
U.S. Fish & <strong>Wildlife</strong> Service<br />
<strong>2006</strong> <strong>National</strong> <strong>Survey</strong><br />
<strong>of</strong> <strong>Fishing</strong>, <strong>Hunting</strong>, <strong>and</strong><br />
<strong>Wildlife</strong>-<strong>Associated</strong><br />
Recreation
FHW/06-NAT<br />
<strong>2006</strong> <strong>National</strong> <strong>Survey</strong> <strong>of</strong><br />
<strong>Fishing</strong>, <strong>Hunting</strong>, <strong>and</strong><br />
<strong>Wildlife</strong>-<strong>Associated</strong> Recreation<br />
U.S. Department <strong>of</strong> the Interior<br />
Dirk Kempthorne,<br />
Secretary<br />
U.S. Fish <strong>and</strong> <strong>Wildlife</strong> Service<br />
H. Dale Hall,<br />
Director<br />
U.S. Department <strong>of</strong> Commerce<br />
Carlos M. Gutierrez,<br />
Secretary<br />
Economics <strong>and</strong> Statistics Administration<br />
Cynthia A. Glassman,<br />
Under Secretary for Economic Affairs<br />
U.S. CENSUS BUREAU<br />
Charles Louis Kincannon,<br />
Director
Economics <strong>and</strong> Statistics<br />
Administration<br />
U.S. Department <strong>of</strong> the Interior<br />
Dirk Kempthorne,<br />
Secretary<br />
Cynthia A. Glassman,<br />
Under Secretary for Economic Affairs<br />
U.S. CENSUS BUREAU<br />
Charles Louis Kincannon,<br />
Director<br />
U.S. Fish <strong>and</strong> <strong>Wildlife</strong> Service<br />
H. Dale Hall,<br />
Director<br />
<strong>Wildlife</strong> <strong>and</strong> Sport Fish Restoration<br />
Rowan Gould,<br />
Assistant Director<br />
The U.S. Department <strong>of</strong> the Interior protects <strong>and</strong> manages the Nation’s natural resources <strong>and</strong> cultural<br />
heritage; provides scientific <strong>and</strong> other information about those resources; <strong>and</strong> honors its trust responsibilities<br />
or special commitments to American Indians, Alaska Natives, <strong>and</strong> affiliated Isl<strong>and</strong> Communities.<br />
The mission <strong>of</strong> the Department’s U.S. Fish <strong>and</strong> <strong>Wildlife</strong> Service is working with others to conserve,<br />
protect, <strong>and</strong> enhance fish, wildlife, <strong>and</strong> their habitats for the continuing benefit <strong>of</strong> the American people.<br />
The Service is responsible for national programs <strong>of</strong> vital importance to our natural resources, including<br />
administration <strong>of</strong> the <strong>Wildlife</strong> <strong>and</strong> Sport Fish Restoration Programs. These two programs provide financial<br />
assistance to the States for projects to enhance <strong>and</strong> protect fish <strong>and</strong> wildlife resources <strong>and</strong> to assure<br />
their availability to the public for recreational purposes. Multistate grants from these programs fund the<br />
<strong>National</strong> <strong>Survey</strong> <strong>of</strong> <strong>Fishing</strong>, <strong>Hunting</strong>, <strong>and</strong> <strong>Wildlife</strong>-<strong>Associated</strong> Recreation.<br />
Suggested Citation<br />
U.S. Department <strong>of</strong> the Interior, Fish <strong>and</strong> <strong>Wildlife</strong> Service, <strong>and</strong> U.S. Department <strong>of</strong> Commerce, U.S.<br />
Census Bureau. <strong>2006</strong> <strong>National</strong> <strong>Survey</strong> <strong>of</strong> <strong>Fishing</strong>, <strong>Hunting</strong>, <strong>and</strong> <strong>Wildlife</strong>-<strong>Associated</strong> Recreation.
Contents<br />
List <strong>of</strong> Tables . . . . . . . . . . . . . . . . . . . . . . . . . . . . . . . . . . . . . . . . . . . . . . . . . . . . . . . . . . . . . . . . . . . . . . . . . . . . . . . . . . .<br />
Foreword . . . . . . . . . . . . . . . . . . . . . . . . . . . . . . . . . . . . . . . . . . . . . . . . . . . . . . . . . . . . . . . . . . . . . . . . . . . . . . . . . . . . . .<br />
<strong>Survey</strong> Background <strong>and</strong> Method . . . . . . . . . . . . . . . . . . . . . . . . . . . . . . . . . . . . . . . . . . . . . . . . . . . . . . . . . . . . . . . . . . . . .<br />
iv<br />
vi<br />
vii<br />
Highlights<br />
Introduction . . . . . . . . . . . . . . . . . . . . . . . . . . . . . . . . . . . . . . . . . . . . . . . . . . . . . . . . . . . . . . . . . . . . . . . . . . . . . . . . . . . . . 2<br />
Summary . . . . . . . . . . . . . . . . . . . . . . . . . . . . . . . . . . . . . . . . . . . . . . . . . . . . . . . . . . . . . . . . . . . . . . . . . . . . . . . . . . . . . . . 4<br />
<strong>Fishing</strong> Highlights . . . . . . . . . . . . . . . . . . . . . . . . . . . . . . . . . . . . . . . . . . . . . . . . . . . . . . . . . . . . . . . . . . . . . . . . . . . . . . . . 8<br />
<strong>Hunting</strong> Highlights . . . . . . . . . . . . . . . . . . . . . . . . . . . . . . . . . . . . . . . . . . . . . . . . . . . . . . . . . . . . . . . . . . . . . . . . . . . . . . . 22<br />
<strong>Wildlife</strong>-Watching Highlights . . . . . . . . . . . . . . . . . . . . . . . . . . . . . . . . . . . . . . . . . . . . . . . . . . . . . . . . . . . . . . . . . . . . . . 36<br />
Tables<br />
Guide to Statistical Tables . . . . . . . . . . . . . . . . . . . . . . . . . . . . . . . . . . . . . . . . . . . . . . . . . . . . . . . . . . . . . . . . . . . . . . . . . 56<br />
<strong>Fishing</strong> <strong>and</strong> <strong>Hunting</strong> Tables . . . . . . . . . . . . . . . . . . . . . . . . . . . . . . . . . . . . . . . . . . . . . . . . . . . . . . . . . . . . . . . . . . . . . . . . 57<br />
<strong>Wildlife</strong>-Watching Tables . . . . . . . . . . . . . . . . . . . . . . . . . . . . . . . . . . . . . . . . . . . . . . . . . . . . . . . . . . . . . . . . . . . . . . . . . . 87<br />
State Tables . . . . . . . . . . . . . . . . . . . . . . . . . . . . . . . . . . . . . . . . . . . . . . . . . . . . . . . . . . . . . . . . . . . . . . . . . . . . . . . . . . . . . 96<br />
Appendixes<br />
A. Definitions . . . . . . . . . . . . . . . . . . . . . . . . . . . . . . . . . . . . . . . . . . . . . . . . . . . . . . . . . . . . . . . . . . . . . . . . . . . . . . . . . 118<br />
B. 2005 Participation <strong>of</strong> 6-to-15-Year-Olds <strong>and</strong> Historical Participation <strong>of</strong> Sportspersons:<br />
Data From Screening Interviews . . . . . . . . . . . . . . . . . . . . . . . . . . . . . . . . . . . . . . . . . . . . . . . . . . . . . . . . . . . . . . . . 122<br />
C. Significant Methodological Changes From Previous <strong>Survey</strong>s <strong>and</strong> Regional Trends . . . . . . . . . . . . . . . . . . . . . . . . . 136<br />
D. Sample Design <strong>and</strong> Statistical Accuracy . . . . . . . . . . . . . . . . . . . . . . . . . . . . . . . . . . . . . . . . . . . . . . . . . . . . . . . . . . 148<br />
U.S. Fish & <strong>Wildlife</strong> Service <strong>2006</strong> <strong>National</strong> <strong>Survey</strong> <strong>of</strong> <strong>Fishing</strong>, <strong>Hunting</strong>, <strong>and</strong> <strong>Wildlife</strong>-<strong>Associated</strong> Recreation iii
List <strong>of</strong> Tables<br />
<strong>Fishing</strong> <strong>and</strong> <strong>Hunting</strong>: <strong>2006</strong><br />
1. Anglers <strong>and</strong> Hunters 16 Years Old <strong>and</strong> Older, Days <strong>of</strong> Participation, <strong>and</strong> Trips by Type <strong>of</strong> <strong>Fishing</strong> <strong>and</strong> <strong>Hunting</strong> . . . 57<br />
2. Anglers, Trips, <strong>and</strong> Days <strong>of</strong> <strong>Fishing</strong> by Type <strong>of</strong> <strong>Fishing</strong> . . . . . . . . . . . . . . . . . . . . . . . . . . . . . . . . . . . . . . . . . . . . . . . 57<br />
3. Freshwater Anglers <strong>and</strong> Days <strong>of</strong> <strong>Fishing</strong> by Type <strong>of</strong> Fish . . . . . . . . . . . . . . . . . . . . . . . . . . . . . . . . . . . . . . . . . . . . . 58<br />
4. Great Lakes Anglers <strong>and</strong> Days <strong>of</strong> <strong>Fishing</strong> by Type <strong>of</strong> Fish . . . . . . . . . . . . . . . . . . . . . . . . . . . . . . . . . . . . . . . . . . . . . 58<br />
5. Saltwater Anglers <strong>and</strong> Days <strong>of</strong> <strong>Fishing</strong> by Type <strong>of</strong> Fish . . . . . . . . . . . . . . . . . . . . . . . . . . . . . . . . . . . . . . . . . . . . . . 59<br />
6. Hunters, Trips, <strong>and</strong> Days <strong>of</strong> <strong>Hunting</strong> by Type <strong>of</strong> <strong>Hunting</strong> . . . . . . . . . . . . . . . . . . . . . . . . . . . . . . . . . . . . . . . . . . . . . 59<br />
7. Hunters <strong>and</strong> Days <strong>of</strong> <strong>Hunting</strong> by Type <strong>of</strong> Game . . . . . . . . . . . . . . . . . . . . . . . . . . . . . . . . . . . . . . . . . . . . . . . . . . . . . 60<br />
8. Selected Characteristics <strong>of</strong> Anglers <strong>and</strong> Hunters . . . . . . . . . . . . . . . . . . . . . . . . . . . . . . . . . . . . . . . . . . . . . . . . . . . . 61<br />
9. Selected Characteristics <strong>of</strong> Anglers by Type <strong>of</strong> <strong>Fishing</strong> . . . . . . . . . . . . . . . . . . . . . . . . . . . . . . . . . . . . . . . . . . . . . . . 63<br />
10. Selected Characteristics <strong>of</strong> Hunters by Type <strong>of</strong> <strong>Hunting</strong> . . . . . . . . . . . . . . . . . . . . . . . . . . . . . . . . . . . . . . . . . . . . . . 65<br />
11. Summary <strong>of</strong> Expenditures for <strong>Fishing</strong> <strong>and</strong> <strong>Hunting</strong> . . . . . . . . . . . . . . . . . . . . . . . . . . . . . . . . . . . . . . . . . . . . . . . . . . 67<br />
12. Expenditures for <strong>Fishing</strong> . . . . . . . . . . . . . . . . . . . . . . . . . . . . . . . . . . . . . . . . . . . . . . . . . . . . . . . . . . . . . . . . . . . . . . . 68<br />
13. Trip <strong>and</strong> Equipment Expenditures for Freshwater <strong>Fishing</strong> . . . . . . . . . . . . . . . . . . . . . . . . . . . . . . . . . . . . . . . . . . . . . 69<br />
14. Trip <strong>and</strong> Equipment Expenditures for Freshwater <strong>Fishing</strong>, Except Great Lakes . . . . . . . . . . . . . . . . . . . . . . . . . . . . 70<br />
15. Trip <strong>and</strong> Equipment Expenditures for Great Lakes <strong>Fishing</strong> . . . . . . . . . . . . . . . . . . . . . . . . . . . . . . . . . . . . . . . . . . . . 71<br />
16. Trip <strong>and</strong> Equipment Expenditures for Saltwater <strong>Fishing</strong> . . . . . . . . . . . . . . . . . . . . . . . . . . . . . . . . . . . . . . . . . . . . . . 72<br />
17. Expenditures for <strong>Hunting</strong> . . . . . . . . . . . . . . . . . . . . . . . . . . . . . . . . . . . . . . . . . . . . . . . . . . . . . . . . . . . . . . . . . . . . . . 73<br />
18. Trip <strong>and</strong> Equipment Expenditures for Big Game <strong>Hunting</strong> . . . . . . . . . . . . . . . . . . . . . . . . . . . . . . . . . . . . . . . . . . . . . 74<br />
19. Trip <strong>and</strong> Equipment Expenditures for Small Game <strong>Hunting</strong> . . . . . . . . . . . . . . . . . . . . . . . . . . . . . . . . . . . . . . . . . . . 75<br />
20. Trip <strong>and</strong> Equipment Expenditures for Migratory Bird <strong>Hunting</strong> . . . . . . . . . . . . . . . . . . . . . . . . . . . . . . . . . . . . . . . . . 76<br />
21. Trip <strong>and</strong> Equipment Expenditures for <strong>Hunting</strong> Other Animals . . . . . . . . . . . . . . . . . . . . . . . . . . . . . . . . . . . . . . . . . 77<br />
22. Special Equipment Expenditures for <strong>Fishing</strong> <strong>and</strong> <strong>Hunting</strong> . . . . . . . . . . . . . . . . . . . . . . . . . . . . . . . . . . . . . . . . . . . . . 78<br />
23. Anglers <strong>and</strong> Hunters Who Purchased Licenses or Were Exempt . . . . . . . . . . . . . . . . . . . . . . . . . . . . . . . . . . . . . . . . 78<br />
24. Selected Characteristics <strong>of</strong> Anglers <strong>and</strong> Hunters Who Purchased Licenses . . . . . . . . . . . . . . . . . . . . . . . . . . . . . . . . 79<br />
25. Freshwater Anglers <strong>and</strong> Days <strong>of</strong> <strong>Fishing</strong> by Type <strong>of</strong> Water . . . . . . . . . . . . . . . . . . . . . . . . . . . . . . . . . . . . . . . . . . . . 80<br />
26. Great Lakes Anglers <strong>and</strong> Days <strong>of</strong> <strong>Fishing</strong> by Great Lake . . . . . . . . . . . . . . . . . . . . . . . . . . . . . . . . . . . . . . . . . . . . . . 80<br />
27. Hunters <strong>and</strong> Days <strong>of</strong> <strong>Hunting</strong> on Public <strong>and</strong> Private L<strong>and</strong> by Type <strong>of</strong> <strong>Hunting</strong> . . . . . . . . . . . . . . . . . . . . . . . . . . . . 80<br />
28. Hunters <strong>and</strong> Days <strong>of</strong> <strong>Hunting</strong> on Public L<strong>and</strong> by Selected Characteristic . . . . . . . . . . . . . . . . . . . . . . . . . . . . . . . . . 81<br />
29. Hunters <strong>and</strong> Days <strong>of</strong> <strong>Hunting</strong> on Private L<strong>and</strong> by Selected Characteristic . . . . . . . . . . . . . . . . . . . . . . . . . . . . . . . . . 82<br />
30. Anglers <strong>Fishing</strong> From Boats <strong>and</strong> Days <strong>of</strong> Participation by Type <strong>of</strong> <strong>Fishing</strong> . . . . . . . . . . . . . . . . . . . . . . . . . . . . . . . . 83<br />
31. Anglers <strong>Fishing</strong> From Motorboats <strong>and</strong> Non-Motorboats . . . . . . . . . . . . . . . . . . . . . . . . . . . . . . . . . . . . . . . . . . . . . . 83<br />
32. Boats <strong>and</strong> Boat Launches Used by Anglers <strong>and</strong> Completion <strong>of</strong> Boating Safety Courses . . . . . . . . . . . . . . . . . . . . . . 84<br />
33. Anglers <strong>Fishing</strong> Most Often From Boats Alone or With Others . . . . . . . . . . . . . . . . . . . . . . . . . . . . . . . . . . . . . . . . . 84<br />
34. Information Used by Anglers <strong>Fishing</strong> From Boats . . . . . . . . . . . . . . . . . . . . . . . . . . . . . . . . . . . . . . . . . . . . . . . . . . . 85<br />
35. Participation in Ice <strong>Fishing</strong> <strong>and</strong> Fly-<strong>Fishing</strong> . . . . . . . . . . . . . . . . . . . . . . . . . . . . . . . . . . . . . . . . . . . . . . . . . . . . . . . . 85<br />
36. Participation in Catch-<strong>and</strong>-Release <strong>Fishing</strong> . . . . . . . . . . . . . . . . . . . . . . . . . . . . . . . . . . . . . . . . . . . . . . . . . . . . . . . . 85<br />
37. Hunters Using Bows <strong>and</strong> Arrows, Muzzleloaders, or Other Firearms . . . . . . . . . . . . . . . . . . . . . . . . . . . . . . . . . . . . 86<br />
38. L<strong>and</strong> Owned or Leased for the Primary Purpose <strong>of</strong> <strong>Fishing</strong> or <strong>Hunting</strong> . . . . . . . . . . . . . . . . . . . . . . . . . . . . . . . . . . 86<br />
iv <strong>2006</strong> <strong>National</strong> <strong>Survey</strong> <strong>of</strong> <strong>Fishing</strong>, <strong>Hunting</strong>, <strong>and</strong> <strong>Wildlife</strong>-<strong>Associated</strong> Recreation<br />
U.S. Fish & <strong>Wildlife</strong> Service
<strong>Wildlife</strong>-Watching Activities: <strong>2006</strong><br />
39. <strong>Wildlife</strong>-Watching Participants by Type <strong>of</strong> Activity . . . . . . . . . . . . . . . . . . . . . . . . . . . . . . . . . . . . . . . . . . . . . . . . . . 87<br />
40. Participants, Area Visited, Trips, <strong>and</strong> Days <strong>of</strong> Participation in <strong>Wildlife</strong> Watching Away From Home . . . . . . . . . . . . 87<br />
41. Participation in <strong>Wildlife</strong>-Watching Activities Around the Home . . . . . . . . . . . . . . . . . . . . . . . . . . . . . . . . . . . . . . . . 88<br />
42. Away-From-Home <strong>Wildlife</strong> Watchers by <strong>Wildlife</strong> Observed, Photographed, or Fed <strong>and</strong> Place . . . . . . . . . . . . . . . . . 89<br />
43. Wild Bird Observers <strong>and</strong> Days <strong>of</strong> Observation . . . . . . . . . . . . . . . . . . . . . . . . . . . . . . . . . . . . . . . . . . . . . . . . . . . . . . 89<br />
44. Expenditures for <strong>Wildlife</strong> Watching . . . . . . . . . . . . . . . . . . . . . . . . . . . . . . . . . . . . . . . . . . . . . . . . . . . . . . . . . . . . . . 90<br />
45. Selected Characteristics <strong>of</strong> Participants in <strong>Wildlife</strong>-Watching Activities Away From Home . . . . . . . . . . . . . . . . . . . 91<br />
46. Selected Characteristics <strong>of</strong> Participants in <strong>Wildlife</strong>-Watching Activities Around the Home . . . . . . . . . . . . . . . . . . . 93<br />
47. L<strong>and</strong> Owned or Leased for the Primary Purpose <strong>of</strong> <strong>Wildlife</strong> Watching . . . . . . . . . . . . . . . . . . . . . . . . . . . . . . . . . . . 95<br />
48. Participation <strong>of</strong> <strong>Wildlife</strong>-Watching Participants in <strong>Fishing</strong> <strong>and</strong> <strong>Hunting</strong> . . . . . . . . . . . . . . . . . . . . . . . . . . . . . . . . . . 95<br />
49. Participation <strong>of</strong> Sportspersons in <strong>Wildlife</strong>-Watching Activities . . . . . . . . . . . . . . . . . . . . . . . . . . . . . . . . . . . . . . . . . 95<br />
State <strong>Wildlife</strong>-Related Recreation: <strong>2006</strong><br />
50. Participation in <strong>Wildlife</strong>-<strong>Associated</strong> Recreation by State Residents Inside <strong>and</strong> Outside Their Resident State . . . . . 96<br />
51. Participation in <strong>Wildlife</strong>-<strong>Associated</strong> Recreation in Each State by Both Residents <strong>and</strong> Nonresidents <strong>of</strong> the State . . . 97<br />
52. Expenditures for <strong>Wildlife</strong>-Related Recreation by State Where Spending Took Place . . . . . . . . . . . . . . . . . . . . . . . . 98<br />
53. Expenditures for <strong>Wildlife</strong>-Related Recreation in the United States by State Residents<br />
Both Inside <strong>and</strong> Outside Their Resident State . . . . . . . . . . . . . . . . . . . . . . . . . . . . . . . . . . . . . . . . . . . . . . . . . . . . . . 100<br />
54. Anglers <strong>and</strong> Hunters by Sportsperson’s State <strong>of</strong> Residence . . . . . . . . . . . . . . . . . . . . . . . . . . . . . . . . . . . . . . . . . . . . 102<br />
55. Anglers <strong>and</strong> Hunters by State Where <strong>Fishing</strong> or <strong>Hunting</strong> Took Place . . . . . . . . . . . . . . . . . . . . . . . . . . . . . . . . . . . . 103<br />
56. Hunters by Type <strong>of</strong> <strong>Hunting</strong> <strong>and</strong> State Where <strong>Hunting</strong> Took Place . . . . . . . . . . . . . . . . . . . . . . . . . . . . . . . . . . . . . . 104<br />
57. Days <strong>of</strong> <strong>Hunting</strong> by State Where <strong>Hunting</strong> Took Place <strong>and</strong> Hunter’s State <strong>of</strong> Residence . . . . . . . . . . . . . . . . . . . . . . 105<br />
58. Days <strong>of</strong> <strong>Hunting</strong> by Type <strong>of</strong> <strong>Hunting</strong> <strong>and</strong> State Where <strong>Hunting</strong> Took Place . . . . . . . . . . . . . . . . . . . . . . . . . . . . . . . 106<br />
59. Expenditures for <strong>Hunting</strong> by State Where Spending Took Place . . . . . . . . . . . . . . . . . . . . . . . . . . . . . . . . . . . . . . . . 107<br />
60. Freshwater (Except Great Lakes) Anglers <strong>and</strong> Days <strong>of</strong> <strong>Fishing</strong> by State Where <strong>Fishing</strong> Took Place . . . . . . . . . . . . 108<br />
61. Great Lakes Anglers <strong>and</strong> Days <strong>of</strong> Great Lakes <strong>Fishing</strong> by State Where <strong>Fishing</strong> Took Place . . . . . . . . . . . . . . . . . . . 109<br />
62. Saltwater Anglers <strong>and</strong> Days <strong>of</strong> Saltwater <strong>Fishing</strong> by State Where <strong>Fishing</strong> Took Place . . . . . . . . . . . . . . . . . . . . . . . 109<br />
63. Days <strong>of</strong> <strong>Fishing</strong> by State Where <strong>Fishing</strong> Took Place <strong>and</strong> Angler’s State <strong>of</strong> Residence . . . . . . . . . . . . . . . . . . . . . . . 110<br />
64. Expenditures for <strong>Fishing</strong> by State Where Spending Took Place . . . . . . . . . . . . . . . . . . . . . . . . . . . . . . . . . . . . . . . . . 111<br />
65. Participation in <strong>Wildlife</strong>-Watching Activities by State Residents Both Inside <strong>and</strong> Outside Their Resident State . . . 112<br />
66. Participation in <strong>Wildlife</strong>-Watching Activities by State Where Activity Took Place . . . . . . . . . . . . . . . . . . . . . . . . . . 113<br />
67. Participation in Away-From-Home <strong>Wildlife</strong> Watching by State Where Activity Took Place . . . . . . . . . . . . . . . . . . . 114<br />
68. Days <strong>of</strong> <strong>Wildlife</strong> Watching Away From Home by State Where Activity Took Place<br />
<strong>and</strong> Participant’s State <strong>of</strong> Residence . . . . . . . . . . . . . . . . . . . . . . . . . . . . . . . . . . . . . . . . . . . . . . . . . . . . . . . . . . . . . 115<br />
69. Expenditures for <strong>Wildlife</strong>-Watching Activities by State Where Spending Took Place . . . . . . . . . . . . . . . . . . . . . . . . 116<br />
U.S. Fish & <strong>Wildlife</strong> Service <strong>2006</strong> <strong>National</strong> <strong>Survey</strong> <strong>of</strong> <strong>Fishing</strong>, <strong>Hunting</strong>, <strong>and</strong> <strong>Wildlife</strong>-<strong>Associated</strong> Recreation v
Foreword<br />
I find duck hunting with friends in<br />
a bottoml<strong>and</strong> hardwood swamp or<br />
fishing with my kids on an Oregon<br />
river bolsters my spirit <strong>and</strong> reminds me<br />
why I care about conservation <strong>and</strong> our<br />
wildlife heritage.<br />
But wildlife-associated <strong>and</strong> vital<br />
recreation—activities such as hunting,<br />
fishing, <strong>and</strong> birding—also provide<br />
significant financial support for wildlife<br />
conservation in our Nation’s economy.<br />
According to information from the<br />
newest <strong>National</strong> <strong>Survey</strong> <strong>of</strong> <strong>Fishing</strong>,<br />
<strong>Hunting</strong>, <strong>and</strong> <strong>Wildlife</strong>-<strong>Associated</strong><br />
Recreation, 87.5 million Americans<br />
spent more than $122 billion in <strong>2006</strong><br />
on wildlife-related recreation. And<br />
this spending supports hundreds <strong>of</strong><br />
thous<strong>and</strong>s <strong>of</strong> jobs in industries <strong>and</strong><br />
businesses.<br />
The <strong>Survey</strong> is conducted every five<br />
years at the request <strong>of</strong> State fish <strong>and</strong><br />
wildlife agencies to measure the importance<br />
<strong>of</strong> wildlife-based recreation to the<br />
American people. The <strong>2006</strong> <strong>Survey</strong><br />
represents the 11th in a series that<br />
began in 1955. Developed in collaboration<br />
with the States, the Association<br />
<strong>of</strong> Fish <strong>and</strong> <strong>Wildlife</strong> Agencies, <strong>and</strong><br />
national conservation organizations,<br />
the <strong>Survey</strong> has become one <strong>of</strong> the most<br />
important sources <strong>of</strong> information on<br />
fish <strong>and</strong> wildlife-related recreation in<br />
the United States.<br />
In the 75-year history <strong>of</strong> the Sport Fish<br />
<strong>and</strong> <strong>Wildlife</strong> Restoration Programs,<br />
excise taxes on firearms, ammunition,<br />
archery, <strong>and</strong> angling equipment have<br />
generated a cumulative total <strong>of</strong> more<br />
than $10 billion for wildlife conservation<br />
efforts by State <strong>and</strong> Territorial<br />
wildlife agencies for fish <strong>and</strong> wildlife<br />
management.<br />
My thanks go to the men <strong>and</strong> women<br />
who took time to participate in the<br />
survey, as well as to the State fish <strong>and</strong><br />
wildlife agencies for their financial<br />
support through the Multistate State<br />
Conservation Grant Programs. Without<br />
that support, the <strong>2006</strong> <strong>Survey</strong> would<br />
never have been possible.<br />
I am comforted to know that my children<br />
<strong>and</strong> all Americans will have the<br />
opportunity to appreciate our Nation’s<br />
rich wildlife tradition. Along with<br />
a record number <strong>of</strong> Americans, we<br />
continue to enjoy wildlife. We are<br />
laying the foundation for conservation’s<br />
future.<br />
H. Dale Hall<br />
Director, U.S. Fish <strong>and</strong> <strong>Wildlife</strong> Service<br />
vi <strong>2006</strong> <strong>National</strong> <strong>Survey</strong> <strong>of</strong> <strong>Fishing</strong>, <strong>Hunting</strong>, <strong>and</strong> <strong>Wildlife</strong>-<strong>Associated</strong> Recreation<br />
U.S. Fish & <strong>Wildlife</strong> Service
<strong>Survey</strong> Background <strong>and</strong> Method<br />
The <strong>National</strong> <strong>Survey</strong> <strong>of</strong> <strong>Fishing</strong>,<br />
<strong>Hunting</strong>, <strong>and</strong> <strong>Wildlife</strong>-<strong>Associated</strong><br />
Recreation (<strong>Survey</strong>) has been<br />
conducted since 1955 <strong>and</strong> is one <strong>of</strong><br />
the oldest <strong>and</strong> most comprehensive<br />
continuing recreation surveys. The<br />
<strong>Survey</strong> collects information on the<br />
number <strong>of</strong> anglers, hunters, <strong>and</strong> wildlife<br />
watchers; how <strong>of</strong>ten they participate;<br />
<strong>and</strong> how much they spend on their<br />
activities in the United States.<br />
Preparations for the <strong>2006</strong> <strong>Survey</strong> began<br />
in 2004 when the Association <strong>of</strong> Fish<br />
<strong>and</strong> <strong>Wildlife</strong> Agencies (AFWA) recommended<br />
that the Fish <strong>and</strong> <strong>Wildlife</strong><br />
Service conduct the eleventh <strong>Survey</strong><br />
<strong>of</strong> wildlife-related recreation. Funding<br />
came from the Multistate Conservation<br />
Grant Programs, authorized by Sport<br />
Fish <strong>and</strong> <strong>Wildlife</strong> Restoration Acts, as<br />
amended.<br />
We consulted with State <strong>and</strong> Federal<br />
agencies <strong>and</strong> nongovernmental<br />
organizations such as the <strong>Wildlife</strong><br />
Management Institute <strong>and</strong> American<br />
Sportfishing Association to determine<br />
survey content. Other sportspersons’<br />
organizations <strong>and</strong> conservation<br />
groups, industry representatives, <strong>and</strong><br />
researchers also provided valuable<br />
advice.<br />
Four regional technical committees<br />
were set up under the auspices <strong>of</strong> the<br />
AFWA to ensure that State fish <strong>and</strong><br />
wildlife agencies had an opportunity to<br />
participate in all phases <strong>of</strong> survey planning<br />
<strong>and</strong> design. The committees were<br />
made up <strong>of</strong> agency representatives.<br />
Data collection for the <strong>Survey</strong> was<br />
carried out by the U.S. Census Bureau<br />
in two phases. The first phase was<br />
the screen which began in April <strong>2006</strong>.<br />
During this phase the Census Bureau<br />
interviewed a sample <strong>of</strong> 85,000 households<br />
nationwide to determine who<br />
in the household had fished, hunted,<br />
or wildlife watched in 2005, <strong>and</strong> who<br />
had engaged or planned to engage<br />
in those activities in <strong>2006</strong>. In most<br />
cases, one adult household member<br />
provided information for all members.<br />
The screen primarily covered 2005<br />
activities while the next, more in-depth<br />
phase covered <strong>2006</strong> activities. For<br />
more information on 2005 data, refer to<br />
Appendix B.<br />
The second phase <strong>of</strong> data collection<br />
consisted <strong>of</strong> three detailed interview<br />
waves. The first began in April<br />
<strong>2006</strong> concurrent with the screen, the<br />
second in September <strong>2006</strong>, <strong>and</strong> the<br />
last in January 2007. Interviews were<br />
conducted with samples <strong>of</strong> likely<br />
anglers, hunters, <strong>and</strong> wildlife watchers<br />
who were identified in the initial<br />
screening phase. Interviews were<br />
conducted primarily by phone, with<br />
in-person interviews for respondents<br />
who could not be reached by phone.<br />
Respondents in the second survey<br />
phase were limited to those who were<br />
at least 16 years old. Each respondent<br />
provided information pertaining only to<br />
his or her activities <strong>and</strong> expenditures.<br />
Sample sizes were designed to provide<br />
statistically reliable results at the state<br />
level. Altogether, interviews were<br />
completed with 21,938 anglers <strong>and</strong><br />
hunters <strong>and</strong> 11,279 wildlife watchers.<br />
More detailed information on sampling<br />
procedures <strong>and</strong> response rates is found<br />
in Appendix D.<br />
Comparability With Previous<br />
<strong>Survey</strong>s<br />
The <strong>2006</strong> survey questions <strong>and</strong> methodology<br />
were similar to those used in the<br />
2001, 1996, <strong>and</strong> 1991 <strong>Survey</strong>s. Therefore,<br />
the estimates are comparable.<br />
The methodology <strong>of</strong> these <strong>Survey</strong>s<br />
did differ importantly from the 1985<br />
<strong>and</strong> 1980 <strong>Survey</strong>s, so these estimates<br />
are not directly comparable to those<br />
<strong>of</strong> earlier surveys. Changes in methodology<br />
included reducing the recall<br />
period over which respondents had to<br />
report their activities <strong>and</strong> expenditures.<br />
Previous <strong>Survey</strong>s used a 12-month<br />
recall period, which resulted in greater<br />
reporting bias. Research found that the<br />
amount <strong>of</strong> activity <strong>and</strong> expenditures<br />
reported in 12-month recall surveys<br />
was overestimated in comparison<br />
with that reported using shorter recall<br />
periods.<br />
U.S. Fish & <strong>Wildlife</strong> Service <strong>2006</strong> <strong>National</strong> <strong>Survey</strong> <strong>of</strong> <strong>Fishing</strong>, <strong>Hunting</strong>, <strong>and</strong> <strong>Wildlife</strong>-<strong>Associated</strong> Recreation vii
Highlights
Introduction<br />
The <strong>National</strong> <strong>Survey</strong> <strong>of</strong> <strong>Fishing</strong>,<br />
<strong>Hunting</strong>, <strong>and</strong> <strong>Wildlife</strong>-<strong>Associated</strong><br />
Recreation reports results from interviews<br />
with U.S. residents about their<br />
fishing, hunting, <strong>and</strong> wildlife watching.<br />
This report focuses on <strong>2006</strong> participation<br />
<strong>and</strong> expenditures <strong>of</strong> persons 16<br />
years <strong>of</strong> age <strong>and</strong> older.<br />
However, in addition to <strong>2006</strong> estimates,<br />
we also provide trend information in<br />
the Highlights section <strong>and</strong> Appendix<br />
C <strong>of</strong> the report. The <strong>2006</strong> numbers<br />
reported can be compared with those<br />
in the 1991, 1996, <strong>and</strong> 2001 <strong>Survey</strong><br />
reports because they used similar methodologies.<br />
However, <strong>2006</strong> estimates<br />
should not be directly compared with<br />
results from <strong>Survey</strong>s conducted earlier<br />
than 1991 because <strong>of</strong> changes in methodology<br />
to improve accuracy.<br />
The report also provides information<br />
on participation in wildlife recreation<br />
in 2005, particularly <strong>of</strong> persons 6 to 15<br />
years <strong>of</strong> age. The 2005 information is<br />
provided in Appendix B. Information<br />
about the <strong>Survey</strong>’s scope <strong>and</strong> coverage<br />
is in Appendix D. The remainder <strong>of</strong><br />
this section defines important terms<br />
used in the <strong>Survey</strong>.<br />
<strong>Wildlife</strong>-<strong>Associated</strong> Recreation<br />
<strong>Wildlife</strong>-associated recreation is<br />
fishing, hunting, <strong>and</strong> wildlife-watching<br />
activities. These categories are not<br />
mutually exclusive because many individuals<br />
participated in more than one<br />
activity. <strong>Wildlife</strong>-associated recreation<br />
is reported in two major categories: (1)<br />
fishing <strong>and</strong> hunting <strong>and</strong> (2) wildlife<br />
watching, which includes observing,<br />
photographing, <strong>and</strong> feeding fish or<br />
wildlife.<br />
<strong>Fishing</strong> <strong>and</strong> <strong>Hunting</strong><br />
This <strong>Survey</strong> reports information about<br />
residents <strong>of</strong> the United States who<br />
fished or hunted in <strong>2006</strong>, regardless <strong>of</strong><br />
whether they were licensed. The fishing<br />
<strong>and</strong> hunting sections report information<br />
for three groups: (1) sportspersons, (2)<br />
anglers, <strong>and</strong> (3) hunters.<br />
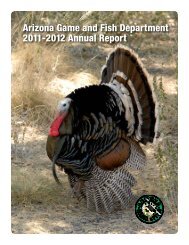
Sportspersons<br />
Sportspersons are those who fished<br />
or hunted. Individuals who fished<br />
or hunted commercially in <strong>2006</strong> are<br />
reported as sportspersons only if they<br />
also fished or hunted for recreation.<br />
The sportspersons group is composed<br />
<strong>of</strong> three subgroups as shown in the<br />
diagram below: (1) those that fished<br />
<strong>and</strong> hunted, (2) those that only fished,<br />
<strong>and</strong> (3) those that only hunted.<br />
The total number <strong>of</strong> sportspersons is<br />
equal to the sum <strong>of</strong> people who only<br />
fished, only hunted, <strong>and</strong> both hunted<br />
<strong>and</strong> fished. It is not the sum <strong>of</strong> all<br />
anglers <strong>and</strong> all hunters because those<br />
people who both fished <strong>and</strong> hunted are<br />
included in both the angler <strong>and</strong> hunter<br />
population <strong>and</strong> would be incorrectly<br />
counted twice.<br />
Sportspersons<br />
Anglers<br />
Fished<br />
only<br />
Fished<br />
<strong>and</strong><br />
hunted<br />
Hunters<br />
Hunted<br />
only<br />
Anglers<br />
Anglers are sportspersons who only<br />
fished plus those who fished <strong>and</strong><br />
hunted. Anglers include not only<br />
licensed hook <strong>and</strong> line anglers, but<br />
also those who have no license <strong>and</strong><br />
those who use special methods such as<br />
fishing with spears.<br />
Three types <strong>of</strong> fishing are reported: (1)<br />
freshwater, excluding the Great Lakes,<br />
(2) Great Lakes, <strong>and</strong> (3) saltwater.<br />
Since many anglers participated in<br />
more than one type <strong>of</strong> fishing, the total<br />
number <strong>of</strong> anglers is less than the sum<br />
<strong>of</strong> the three types <strong>of</strong> fishing.<br />
Hunters<br />
Hunters are sportspersons who only<br />
hunted plus those who hunted <strong>and</strong><br />
fished. Hunters include not only<br />
licensed hunters using rifles <strong>and</strong> shotguns<br />
but also those who had no license<br />
<strong>and</strong> those who hunted with a bow <strong>and</strong><br />
arrow, primitive firearm, or pistol or<br />
h<strong>and</strong>gun.<br />
Four types <strong>of</strong> hunting are reported: (1)<br />
big game, (2) small game, (3) migratory<br />
bird, <strong>and</strong> (4) other animals. Since<br />
many hunters participated in more than<br />
one type <strong>of</strong> hunting, the sum <strong>of</strong> hunters<br />
for big game, small game, migratory<br />
bird, <strong>and</strong> other animals exceeds the<br />
total number <strong>of</strong> hunters.<br />
<strong>Wildlife</strong> Watchers<br />
Since 1980, the <strong>National</strong> <strong>Survey</strong> has<br />
included information on wildlifewatching<br />
activities in addition to<br />
fishing <strong>and</strong> hunting. The 1991, 1996,<br />
2001, <strong>and</strong> <strong>2006</strong> <strong>Survey</strong>s, unlike the<br />
1980 <strong>and</strong> 1985 <strong>Survey</strong>s, collected data<br />
only for activities where the primary<br />
purpose was wildlife watching. The<br />
1980 <strong>and</strong> 1985 <strong>Survey</strong>s included estimates<br />
<strong>of</strong> unplanned wildlife watching<br />
around the home <strong>and</strong> while on trips<br />
taken for another purpose.<br />
The <strong>2006</strong> <strong>Survey</strong> uses a strict definition<br />
<strong>of</strong> wildlife watching. Participants<br />
must either take a “special interest”<br />
in wildlife around their homes or take<br />
a trip for the “primary purpose” <strong>of</strong><br />
2 <strong>2006</strong> <strong>National</strong> <strong>Survey</strong> <strong>of</strong> <strong>Fishing</strong>, <strong>Hunting</strong>, <strong>and</strong> <strong>Wildlife</strong>-<strong>Associated</strong> Recreation U.S. Fish & <strong>Wildlife</strong> Service
wildlife watching. Secondary wildlife<br />
watching, such as incidentally<br />
observing wildlife while pleasure<br />
driving, is not included.<br />
Two types <strong>of</strong> wildlife watching<br />
are reported: (1) away-from-home<br />
(formerly nonresidential) activities <strong>and</strong><br />
(2) around-the-home (formerly residential)<br />
activities. Because some people<br />
participated in more than one type <strong>of</strong><br />
wildlife watching, the sum <strong>of</strong> participants<br />
in each type will be greater than<br />
the total number <strong>of</strong> wildlife watchers.<br />
The two types <strong>of</strong> wildlife-watching<br />
activity are explained next.<br />
Away-From-Home <strong>Wildlife</strong><br />
Watching<br />
This group includes persons who<br />
took trips or outings <strong>of</strong> at least 1 mile<br />
from home for the primary purpose <strong>of</strong><br />
observing, feeding, or photographing<br />
fish <strong>and</strong> wildlife. Trips to fish, hunt, or<br />
scout <strong>and</strong> trips to zoos, circuses, aquariums,<br />
<strong>and</strong> museums are not considered<br />
wildlife-watching activities.<br />
Around-The-Home <strong>Wildlife</strong><br />
Watching<br />
This group includes those who<br />
participated within 1 mile <strong>of</strong> home <strong>and</strong><br />
involves one or more <strong>of</strong> the following:<br />
(1) closely observing or trying to identify<br />
birds or other wildlife; (2) photographing<br />
wildlife; (3) feeding birds or<br />
other wildlife; (4) maintaining natural<br />
areas <strong>of</strong> at least 1/4 acre where benefit<br />
to wildlife is the primary concern; (5)<br />
maintaining plantings (shrubs, agricultural<br />
crops, etc.) where benefit to<br />
wildlife is the primary concern; or (6)<br />
visiting public parks within 1 mile<br />
<strong>of</strong> home for the primary purpose <strong>of</strong><br />
observing, feeding, or photographing<br />
wildlife.<br />
U.S. Fish & <strong>Wildlife</strong> Service <strong>2006</strong> <strong>National</strong> <strong>Survey</strong> <strong>of</strong> <strong>Fishing</strong>, <strong>Hunting</strong>, <strong>and</strong> <strong>Wildlife</strong>-<strong>Associated</strong> Recreation 3
Summary<br />
The <strong>2006</strong> <strong>Survey</strong> found that 87.5<br />
million U.S. residents 16 years old <strong>and</strong><br />
older participated in wildlife-related<br />
recreation. During that year, 30.0<br />
million people fished, 12.5 million<br />
hunted, <strong>and</strong> 71.1 million participated in<br />
at least one type <strong>of</strong> wildlife-watching<br />
activity such as observing, feeding, or<br />
photographing fish <strong>and</strong> other wildlife in<br />
the United States.<br />
The focus <strong>of</strong> the <strong>National</strong> <strong>Survey</strong> is to<br />
estimate participation <strong>and</strong> expenditures<br />
<strong>of</strong> persons 16 years old <strong>and</strong> older in a<br />
single year. These estimates are based<br />
on data collected in the detailed phase<br />
<strong>of</strong> the <strong>2006</strong> <strong>Survey</strong>. They are comparable<br />
to estimates from the 1991, 1996,<br />
<strong>and</strong> 2001 <strong>Survey</strong>s but not with earlier<br />
ones because <strong>of</strong> changes in methodology.<br />
A complete explanation <strong>of</strong> the<br />
change is provided in Appendix C.<br />
While the focus <strong>of</strong> the <strong>Survey</strong> is to<br />
estimate wildlife-related recreationists<br />
16 years old <strong>and</strong> older <strong>and</strong> their<br />
associated expenditures in a single<br />
year, information collected in the<br />
survey screen can be used to estimate<br />
the number <strong>of</strong> anglers <strong>and</strong> hunters who<br />
were active over a five-year window <strong>of</strong><br />
time. Because many do not participate<br />
every year, the following estimates may<br />
be more representative <strong>of</strong> the number<br />
<strong>of</strong> individuals considered to be anglers<br />
<strong>and</strong> hunters in the United States: 44.4<br />
million individuals fished <strong>and</strong> 18.6<br />
million hunted in the United States over<br />
the five-year period from 2002 to <strong>2006</strong>.<br />
The survey screen also provides some<br />
information about 6-to-15-year-olds’<br />
participation. Assuming their proportion<br />
<strong>of</strong> participation was the same in<br />
<strong>2006</strong> as in 2005, the following estimates<br />
were calculated: <strong>of</strong> the 6-to-<br />
15-year-olds in the United States, 1.6<br />
million hunted, 8.3 million fished, <strong>and</strong><br />
12 million wildlife watched in <strong>2006</strong>.<br />
More information about this age group<br />
is provided in Appendix B. For the rest<br />
<strong>of</strong> this report, all information pertains<br />
to participants 16 years old <strong>and</strong> older.<br />
There was a considerable overlap in<br />
activities among anglers, hunters, <strong>and</strong><br />
wildlife watchers. In <strong>2006</strong>, 68 percent<br />
<strong>of</strong> all hunters also fished <strong>and</strong> 29 percent<br />
<strong>of</strong> all anglers also hunted. In addition,<br />
52 percent <strong>of</strong> anglers <strong>and</strong> 57 percent<br />
<strong>of</strong> hunters wildlife watched, while 25<br />
percent <strong>of</strong> all wildlife watchers reported<br />
hunting <strong>and</strong>/or fishing during the year.<br />
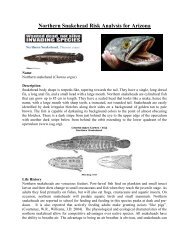
<strong>Wildlife</strong> recreationists’ avidity also<br />
is reflected in the $122.3 billion they<br />
spent in <strong>2006</strong> on their activities, which<br />
equated to 1 percent <strong>of</strong> the Gross<br />
Domestic Product. Of the total amount<br />
Total <strong>Wildlife</strong>-Related Recreation<br />
Participants . . . . . . . . . . . . . . . . . . . 87.5 million<br />
Expenditures . . . . . . . . . . . . . . . . . . $122.3 billion<br />
Sportspersons<br />
Total participants* . . . . . . . . . . . . . .<br />
Anglers . . . . . . . . . . . . . . . . . . . . .<br />
Hunters . . . . . . . . . . . . . . . . . . . . .<br />
Total days . . . . . . . . . . . . . . . . . . . .<br />
<strong>Fishing</strong> . . . . . . . . . . . . . . . . . . . . .<br />
<strong>Hunting</strong> . . . . . . . . . . . . . . . . . . . .<br />
Total expenditures . . . . . . . . . . . . . .<br />
<strong>Fishing</strong> . . . . . . . . . . . . . . . . . . . . .<br />
<strong>Hunting</strong> . . . . . . . . . . . . . . . . . . . .<br />
Unspecified . . . . . . . . . . . . . . . . .<br />
<strong>Wildlife</strong> Watchers<br />
Total participants** . . . . . . . . . . . . .<br />
Around the home . . . . . . . . . . . . .<br />
Away from home . . . . . . . . . . . . .<br />
Total expenditures . . . . . . . . . . . . . .<br />
spent, $37.4 billion was trip-related,<br />
$64.1 billion was spent on equipment,<br />
<strong>and</strong> $20.7 billion was spent on other<br />
items such as licenses <strong>and</strong> l<strong>and</strong> leasing<br />
<strong>and</strong> ownership.<br />
Sportspersons spent a total <strong>of</strong> $76.7<br />
billion in <strong>2006</strong>—$42.0 billion on<br />
fishing, $22.9 billion on hunting, <strong>and</strong><br />
$11.7 billion on items used for both<br />
hunting <strong>and</strong> fishing. <strong>Wildlife</strong> watchers<br />
spent $45.7 billion on their activities<br />
around the home <strong>and</strong> on trips away<br />
from home.<br />
<strong>Fishing</strong> <strong>and</strong> <strong>Hunting</strong><br />
In <strong>2006</strong>, 33.9 million U.S. residents 16<br />
years old <strong>and</strong> older went fishing <strong>and</strong>/or<br />
33.9 million<br />
30.0 million<br />
12.5 million<br />
737 million<br />
517 million<br />
220 million<br />
$76.7 billion<br />
42.0 billion<br />
22.9 billion<br />
11.7 billion<br />
71.1 million<br />
67.8 million<br />
23.0 million<br />
$45.7 billion<br />
* 8.5 million both fished <strong>and</strong> hunted.<br />
** 19.7 million both wildlife watched around the home <strong>and</strong> away<br />
from home.<br />
4 <strong>2006</strong> <strong>National</strong> <strong>Survey</strong> <strong>of</strong> <strong>Fishing</strong>, <strong>Hunting</strong>, <strong>and</strong> <strong>Wildlife</strong>-<strong>Associated</strong> Recreation U.S. Fish & <strong>Wildlife</strong> Service
Expenditures for <strong>Wildlife</strong>-Related Recreation<br />
(Total expenditures: $122.3 billion)<br />
<strong>Fishing</strong><br />
34%<br />
$42.0 billion<br />
Unspecified<br />
10%<br />
$11.7 billion<br />
<strong>Hunting</strong><br />
19%<br />
$22.9 billion<br />
Equipment<br />
52%<br />
$64.1 billion<br />
Other<br />
17%<br />
$20.7 billion<br />
Trip-related<br />
31%<br />
$37.4 billion<br />
<strong>Wildlife</strong> watching<br />
37%<br />
$45.7 billion<br />
Expenditures by Sportspersons<br />
(Total expenditures: $76.7 billion)<br />
Expenditures by <strong>Wildlife</strong>-Watching Participants<br />
(Total expenditures: $45.7 billion)<br />
Equipment<br />
53%<br />
$41.0 billion<br />
Other<br />
15%<br />
$11.1 billion<br />
Trip-related<br />
32%<br />
$24.6 billion<br />
Equipment<br />
51%<br />
$23.2 billion<br />
Other<br />
21%<br />
$9.6 billion<br />
Trip-related<br />
28%<br />
$12.9 billion<br />
hunting. This includes 30.0 million who<br />
fished <strong>and</strong> 12.5 million who hunted—<br />
8.5 million both fished <strong>and</strong> hunted.<br />
In <strong>2006</strong>, expenditures by sportspersons<br />
totaled $76.7 billion. Trip-related<br />
expenditures, including food, lodging,<br />
<strong>and</strong> transportation, were $24.6<br />
billion—32 percent <strong>of</strong> all fishing <strong>and</strong><br />
hunting expenditures. Total equipment<br />
expenditures amounted to $41.0 billion,<br />
53 percent <strong>of</strong> the total. Other expenditures—magazines,<br />
membership dues,<br />
contributions, l<strong>and</strong> leasing <strong>and</strong> ownership,<br />
<strong>and</strong> licenses, stamps, tags, <strong>and</strong><br />
permits—accounted for $11.1 billion,<br />
or 15 percent <strong>of</strong> all sportspersons’<br />
expenditures.<br />
<strong>Wildlife</strong>-Watching Recreation<br />
Observing, feeding, or photographing<br />
wildlife was enjoyed by 71.1 million<br />
people 16 years old <strong>and</strong> older in <strong>2006</strong>.<br />
Among this group, 23.0 million people<br />
took trips away from home for the<br />
primary purpose <strong>of</strong> enjoying wildlife,<br />
while 67.8 million stayed within a<br />
mile <strong>of</strong> home to participate in wildlifewatching<br />
activities.<br />
In <strong>2006</strong>, wildlife watchers spent $45.7<br />
billion. Trip-related expenses, including<br />
food, lodging, <strong>and</strong> transportation,<br />
totaled $12.9 billion, 28 percent <strong>of</strong> all<br />
expenditures. A total <strong>of</strong> $23.2 billion<br />
was spent on equipment, 51 percent <strong>of</strong><br />
all wildlife-watching expenses. The<br />
remaining $9.6 billion, 21 percent <strong>of</strong><br />
the total, was spent on magazines,<br />
membership dues, <strong>and</strong> contributions<br />
made to conservation or wildlife-related<br />
organizations, plantings, <strong>and</strong> l<strong>and</strong><br />
leasing <strong>and</strong> ownership for the purpose<br />
<strong>of</strong> wildlife watching.<br />
2001 <strong>and</strong> <strong>2006</strong> Comparison<br />
Six percent more people 16 years <strong>of</strong><br />
age <strong>and</strong> older participated in wildliferelated<br />
recreation in <strong>2006</strong> than in 2001.<br />
Although 5.2 million more people<br />
participated, there were declines in<br />
some activities.<br />
The number <strong>of</strong> sportspersons fell from<br />
37.8 million in 2001 to 33.9 million in<br />
<strong>2006</strong>. Their expenditures decreased<br />
from $79.7 billion (in <strong>2006</strong> dollars) in<br />
2001 to $76.7 billion in <strong>2006</strong>.<br />
In <strong>2006</strong>, 30.0 million U.S. residents 16<br />
years <strong>of</strong> age <strong>and</strong> older fished compared<br />
to 34.1 million who fished in 2001, a<br />
drop <strong>of</strong> 12 percent. The 4 percent drop<br />
in the number <strong>of</strong> hunters, 13.0 million<br />
in 2001 to 12.5 million in <strong>2006</strong>, is not<br />
statistically significant.<br />
Although fishing participation declined<br />
from 2001 to <strong>2006</strong>, overall expenditures<br />
for fishing held steady. No<br />
expenditure category had a statistically<br />
significant change.<br />
<strong>Hunting</strong> participation <strong>and</strong> overall<br />
hunting expenditures stayed about the<br />
same from 2001 to <strong>2006</strong>. No expenditure<br />
category had a statistically significant<br />
change.<br />
U.S. Fish & <strong>Wildlife</strong> Service <strong>2006</strong> <strong>National</strong> <strong>Survey</strong> <strong>of</strong> <strong>Fishing</strong>, <strong>Hunting</strong>, <strong>and</strong> <strong>Wildlife</strong>-<strong>Associated</strong> Recreation 5
The increase in wildlife-related<br />
recreation participation from 2001 to<br />
<strong>2006</strong> was due to wildlife watching<br />
(observing, feeding, <strong>and</strong> photographing<br />
wildlife). During this period, the<br />
number <strong>of</strong> people wildlife watching<br />
increased by 8 percent. Although their<br />
overall expenditures showed little<br />
change, they did spend 38 percent more<br />
on trips <strong>and</strong> 18 percent more on bird<br />
food <strong>and</strong> wildlife-watching equipment<br />
(such as binoculars, cameras, bird<br />
feeders). Total expenditures over the<br />
five-year period showed little change<br />
because wildlife watchers spent 14<br />
percent less on equipment in <strong>2006</strong> than<br />
in 2001.<br />
2001–<strong>2006</strong> <strong>Wildlife</strong>-<strong>Associated</strong> Recreation Comparison <strong>of</strong> Participants<br />
(Numbers in thous<strong>and</strong>s)<br />
2001 <strong>2006</strong><br />
Number Percent Number Percent<br />
Total wildlife-related recreationists . . . . . . . . . . . . . 82,302 100 87,465 100<br />
Total sportspersons . . . . . . . . . . . . . . . . . . . . . . . . . . 37,805 46 33,916 39<br />
Anglers . . . . . . . . . . . . . . . . . . . . . . . . . . . . . . . . . . 34,071 41 29,952 34<br />
Hunters . . . . . . . . . . . . . . . . . . . . . . . . . . . . . . . . . . 13,034 16 12,510 14<br />
Total wildlife-watching participants . . . . . . . . . . . . 66,105 80 71,132 81<br />
Around the home . . . . . . . . . . . . . . . . . . . . . . . . . . 62,928 76 67,756 77<br />
Away from home . . . . . . . . . . . . . . . . . . . . . . . . . . 21,823 27 22,977 26<br />
2001–<strong>2006</strong> <strong>Wildlife</strong>-<strong>Associated</strong> Recreation Comparison <strong>of</strong> Expenditures<br />
(Numbers in billions <strong>of</strong> <strong>2006</strong> dollars)<br />
2001 <strong>2006</strong><br />
Number Percent Number Percent<br />
Total wildlife-related recreation expenditures . . . . 123.4 100 122.3 100<br />
Total fishing <strong>and</strong> hunting expenditures . . . . . . . . . . 79.7 100 76.7 100<br />
Angling expenditures, total . . . . . . . . . . . . . . . . . . . 40.6 100 42.0 100<br />
Trip-related . . . . . . . . . . . . . . . . . . . . . . . . . . . . . . . 16.7 41 17.9 43<br />
Equipment, total . . . . . . . . . . . . . . . . . . . . . . . . . . . 19.3 48 18.8 45<br />
<strong>Fishing</strong> equipment . . . . . . . . . . . . . . . . . . . . . . . 5.3 13 5.3 13<br />
Auxiliary equipment . . . . . . . . . . . . . . . . . . . . . 0.8 2 0.8 2<br />
Special equipment . . . . . . . . . . . . . . . . . . . . . . . 13.2 33 12.6 30<br />
Other . . . . . . . . . . . . . . . . . . . . . . . . . . . . . . . . . . . . 4.6 11 5.4 13<br />
<strong>Hunting</strong> expenditures, total . . . . . . . . . . . . . . . . . . . 23.5 100 22.9 100<br />
Trip-related . . . . . . . . . . . . . . . . . . . . . . . . . . . . . . . 6.0 26 6.7 29<br />
Equipment, total . . . . . . . . . . . . . . . . . . . . . . . . . . . 11.8 50 10.7 47<br />
<strong>Hunting</strong> equipment . . . . . . . . . . . . . . . . . . . . . . 5.2 22 5.4 24<br />
Auxiliary equipment . . . . . . . . . . . . . . . . . . . . . 1.4 6 1.3 6<br />
Special equipment . . . . . . . . . . . . . . . . . . . . . . . 5.2 22 4.0 17<br />
Other . . . . . . . . . . . . . . . . . . . . . . . . . . . . . . . . . . . . 5.7 24 5.5 24<br />
<strong>Wildlife</strong>-watching expenditures, total . . . . . . . . . . 43.7 100 45.7 100<br />
Trip-related . . . . . . . . . . . . . . . . . . . . . . . . . . . . . . . 9.3 21 12.9 28<br />
Equipment, total . . . . . . . . . . . . . . . . . . . . . . . . . . . 26.8 61 23.2 51<br />
<strong>Wildlife</strong>-watching equipment . . . . . . . . . . . . . . 8.4 19 9.9 22<br />
Auxiliary equipment . . . . . . . . . . . . . . . . . . . . . 0.8 2 1.0 2<br />
Special equipment . . . . . . . . . . . . . . . . . . . . . . . 17.6 40 12.3 27<br />
Other . . . . . . . . . . . . . . . . . . . . . . . . . . . . . . . . . . . . 7.7 17 9.6 21<br />
6 <strong>2006</strong> <strong>National</strong> <strong>Survey</strong> <strong>of</strong> <strong>Fishing</strong>, <strong>Hunting</strong>, <strong>and</strong> <strong>Wildlife</strong>-<strong>Associated</strong> Recreation U.S. Fish & <strong>Wildlife</strong> Service
<strong>Fishing</strong>
<strong>Fishing</strong> Highlights<br />
In <strong>2006</strong>, 30.0 million U.S. residents 16<br />
years old <strong>and</strong> older enjoyed a variety<br />
<strong>of</strong> fishing opportunities throughout<br />
the United States. Anglers fished 517<br />
million days <strong>and</strong> took 403 million<br />
fishing trips. They had $42.0 billion<br />
in fishing-related expenses during the<br />
year. Freshwater anglers numbered<br />
25.4 million. They fished 433 million<br />
days <strong>and</strong> took 337 million trips to<br />
freshwater in <strong>2006</strong>. Freshwater anglers<br />
spent $26.3 billion on freshwater<br />
fishing trips <strong>and</strong> equipment. Saltwater<br />
fishing attracted 7.7 million anglers<br />
who enjoyed 67 million trips on 86<br />
million days. They spent $8.9 billion<br />
on their saltwater trips <strong>and</strong> equipment.<br />
<strong>Fishing</strong><br />
Million<br />
35<br />
517 million<br />
Anglers<br />
Freshwater<br />
Saltwater<br />
Total <strong>Fishing</strong><br />
Anglers . . . . . . . . 30.0 million<br />
Freshwater . . . . 25.4 million<br />
Saltwater . . . . . 7.7 million<br />
30<br />
25<br />
403 million<br />
Days . . . . . . . . . . 516.8 million<br />
Freshwater . . . . 433.3 million<br />
Saltwater . . . . . 85.7 million<br />
20<br />
15<br />
10<br />
5<br />
433<br />
337<br />
Trips . . . . . . . . . . 403.5 million<br />
Freshwater . . . . 336.5 million<br />
Saltwater . . . . . 67.0 million<br />
Expenditures . . . $42.0 billion<br />
Freshwater . . . . 26.3 billion<br />
Saltwater . . . . . 8.9 billion<br />
Nonspecific . . . 6.8 billion<br />
0<br />
Total Freshwater Saltwater<br />
86<br />
67<br />
Anglers<br />
Days<br />
Trips<br />
Note: Detail does not add to total because <strong>of</strong> multiple responses <strong>and</strong> nonresponse.<br />
Note: Detail does not add to total<br />
because <strong>of</strong> multiple responses<br />
<strong>and</strong> nonresponse.<br />
Source: Tables 1, 12, 13, <strong>and</strong> 16.<br />
8 <strong>2006</strong> <strong>National</strong> <strong>Survey</strong> <strong>of</strong> <strong>Fishing</strong>, <strong>Hunting</strong>, <strong>and</strong> <strong>Wildlife</strong>-<strong>Associated</strong> Recreation U.S. Fish & <strong>Wildlife</strong> Service
<strong>Fishing</strong> Expenditures<br />
Anglers spent $42.0 billion in <strong>2006</strong><br />
including $17.9 billion on travel-related<br />
items—43 percent <strong>of</strong> all fishing expenditures.<br />
Food <strong>and</strong> lodging accounted<br />
for $6.3 billion, 35 percent <strong>of</strong> all triprelated<br />
costs. Spending on transportation<br />
totaled $5.0 billion, 28 percent <strong>of</strong><br />
trip-related expenditures. Other trip<br />
expenditures, such as l<strong>and</strong> use fees,<br />
guide fees, equipment rental, boating<br />
expenses, <strong>and</strong> bait, cost anglers $6.6<br />
billion—37 percent <strong>of</strong> all trip expenses.<br />
Total <strong>Fishing</strong> Expenditures<br />
Total fishing expenditures. . . . . . . . . . . . . . . . . . . . . . . .<br />
Total trip-related . . . . . . . . . . . . . . . . . . . . . . . . . . . . . . .<br />
Food <strong>and</strong> lodging . . . . . . . . . . . . . . . . . . . . . . . . . . . . .<br />
Transportation . . . . . . . . . . . . . . . . . . . . . . . . . . . . . . .<br />
Other trip costs . . . . . . . . . . . . . . . . . . . . . . . . . . . . . . .<br />
Total equipment expenditures . . . . . . . . . . . . . . . . . . . .<br />
<strong>Fishing</strong> equipment . . . . . . . . . . . . . . . . . . . . . . . . . . . .<br />
Auxiliary equipment. . . . . . . . . . . . . . . . . . . . . . . . . . .<br />
Special equipment . . . . . . . . . . . . . . . . . . . . . . . . . . . .<br />
$42.0 billion<br />
$17.9 billion<br />
6.3 billion<br />
5.0 billion<br />
6.6 billion<br />
$18.8 billion<br />
5.3 billion<br />
0.8 billion<br />
12.6 billion<br />
<strong>Fishing</strong> equipment expenditures<br />
totaled $18.8 billion in <strong>2006</strong>, 45<br />
percent <strong>of</strong> all fishing expenditures.<br />
Anglers spent $5.3 billion on fishing<br />
equipment, such as rods, reels, tackle<br />
boxes, depth finders, <strong>and</strong> artificial<br />
lures <strong>and</strong> flies. This amounted to 28<br />
percent <strong>of</strong> all equipment expenditures.<br />
Auxiliary equipment expenditures,<br />
which includes camping equipment,<br />
binoculars, <strong>and</strong> special fishing clothing,<br />
totaled $779 million—4 percent <strong>of</strong><br />
equipment costs. Expenditures for<br />
special equipment, such as boats, vans,<br />
<strong>and</strong> cabins, were $12.6 billion—67<br />
percent <strong>of</strong> all equipment expenditures.<br />
Anglers also spent a considerable<br />
amount on other fishing-related items,<br />
such as l<strong>and</strong> leasing <strong>and</strong> ownership,<br />
membership dues, contributions,<br />
licenses, stamps, <strong>and</strong> permits. L<strong>and</strong><br />
leasing <strong>and</strong> ownership spending totaled<br />
$4.6 billion, which is 11 percent <strong>of</strong><br />
all expenditures. Expenditures on<br />
magazines, books, membership dues,<br />
contributions, licenses, stamps, tags,<br />
<strong>and</strong> permits were $776 million.<br />
Total other fishing expenditures . . . . . . . . . . . . . . . . . .<br />
Magazines, books . . . . . . . . . . . . . . . . . . . . . . . . . . . . .<br />
Membership dues <strong>and</strong> contributions . . . . . . . . . . . . . .<br />
L<strong>and</strong> leasing <strong>and</strong> ownership . . . . . . . . . . . . . . . . . . . . .<br />
Licenses, stamps, tags, <strong>and</strong> permits . . . . . . . . . . . . . . .<br />
Source: Table 12.<br />
Nonspecific<br />
16%<br />
$6.8 billion<br />
<strong>Fishing</strong> Expenditures by Type <strong>of</strong> <strong>Fishing</strong><br />
(Total expenditures: $42.0 billion)<br />
Saltwater<br />
21%<br />
$8.9 billion<br />
Percent <strong>of</strong> Total <strong>Fishing</strong> Expenditures<br />
(Total expenditures: $42.0 billion)<br />
Freshwater<br />
63%<br />
$26.3 billion<br />
$5.4 billion<br />
0.1 billion<br />
0.2 billion<br />
4.6 billion<br />
0.5 billion<br />
Other<br />
13%<br />
Equipment<br />
45%<br />
Trip-related<br />
43%<br />
U.S. Fish & <strong>Wildlife</strong> Service <strong>2006</strong> <strong>National</strong> <strong>Survey</strong> <strong>of</strong> <strong>Fishing</strong>, <strong>Hunting</strong>, <strong>and</strong> <strong>Wildlife</strong>-<strong>Associated</strong> Recreation 9
Freshwater <strong>Fishing</strong><br />
Anglers . . . . . . . . . . . . . . . . . . . . . . . . . . . . . . . . . . . . . .<br />
Freshwater except Great Lakes . . . . . . . . . . . . . . . . . .<br />
Great Lakes . . . . . . . . . . . . . . . . . . . . . . . . . . . . . . . . .<br />
Days . . . . . . . . . . . . . . . . . . . . . . . . . . . . . . . . . . . . . . . . .<br />
Freshwater except Great Lakes . . . . . . . . . . . . . . . . . .<br />
Great Lakes . . . . . . . . . . . . . . . . . . . . . . . . . . . . . . . . .<br />
Trips . . . . . . . . . . . . . . . . . . . . . . . . . . . . . . . . . . . . . . . . .<br />
Freshwater except Great Lakes . . . . . . . . . . . . . . . . . .<br />
Great Lakes . . . . . . . . . . . . . . . . . . . . . . . . . . . . . . . . .<br />
Trip <strong>and</strong> equipment expenditures . . . . . . . . . . . . . . . . .<br />
Freshwater except Great Lakes . . . . . . . . . . . . . . . . . .<br />
Great Lakes . . . . . . . . . . . . . . . . . . . . . . . . . . . . . . . . .<br />
Note: Detail does not add to total because <strong>of</strong> multiple response <strong>and</strong> nonresponse.<br />
Source: Tables 1, 13, 14, <strong>and</strong> 15.<br />
Freshwater <strong>Fishing</strong> Trip <strong>and</strong> Equipment Expenditures<br />
(Total expenditures: $26.3 billion)<br />
25.4 million<br />
25.0 million<br />
1.4 million<br />
433.3 million<br />
419.9 million<br />
18.0 million<br />
336.5 million<br />
323.3 million<br />
13.3 million<br />
$26.3 billion<br />
24.6 billion<br />
1.5 billion<br />
Freshwater <strong>Fishing</strong> Highlights<br />
Freshwater fishing was the most<br />
popular type <strong>of</strong> fishing. In <strong>2006</strong>, 25.4<br />
million anglers went freshwater fishing<br />
for 433 million days <strong>and</strong> 337 million<br />
trips. Their expenditures for trips <strong>and</strong><br />
equipment totaled $26.3 billion for the<br />
year. Freshwater fishing can be separated<br />
into Great Lakes <strong>and</strong> freshwater<br />
other than the Great Lakes.<br />
There were 25.0 million anglers who<br />
fished for 420 million days on 323<br />
million trips to freshwater other than<br />
the Great Lakes. Trip <strong>and</strong> equipment<br />
expenditures for non-Great Lakes<br />
freshwater fishing totaled $24.6 billion<br />
for an average <strong>of</strong> $982 per angler.<br />
Total trip expenditures were $11.5<br />
billion. Food <strong>and</strong> lodging composed<br />
$4.2 billion or 37 percent <strong>of</strong> total trip<br />
expenditures. Transportation costs<br />
were $3.7 billion or 32 percent. Other<br />
trip expenses, which include guide fees,<br />
equipment rental, <strong>and</strong> bait, were $3.6<br />
billion or 31 percent.<br />
Great Lakes<br />
6%<br />
$1.5 billion<br />
Freshwater except Great Lakes<br />
94%<br />
$24.6 billion<br />
Anglers spent $13.1 billion on equipment<br />
for non-Great Lakes freshwater<br />
fishing. Expenditures for fishing equipment,<br />
such as rods <strong>and</strong> reels, tackle<br />
boxes, depth finders, <strong>and</strong> artificial lures<br />
<strong>and</strong> flies, totaled $3.4 billion. Expenditures<br />
for auxiliary equipment such<br />
as binoculars <strong>and</strong> camping equipment<br />
were $601 million. Expenditures for<br />
Freshwater <strong>Fishing</strong><br />
Days<br />
(Total: 433.3 million)<br />
Million<br />
30<br />
Great Lakes<br />
13.4 million<br />
Both<br />
4.6 million<br />
25<br />
20<br />
15<br />
Freshwater except Great Lakes<br />
415.3 million<br />
10<br />
5<br />
Great Lakes<br />
13.3 million<br />
Trips<br />
(Total: 336.5 million)<br />
0<br />
Total<br />
Freshwater<br />
except Great<br />
Lakes<br />
Great<br />
Lakes<br />
Freshwater except Great Lakes<br />
323.3 million<br />
Freshwater anglers<br />
Note: Detail does not add to total because <strong>of</strong><br />
multiple responses <strong>and</strong> nonresponse.<br />
10 <strong>2006</strong> <strong>National</strong> <strong>Survey</strong> <strong>of</strong> <strong>Fishing</strong>, <strong>Hunting</strong>, <strong>and</strong> <strong>Wildlife</strong>-<strong>Associated</strong> Recreation U.S. Fish & <strong>Wildlife</strong> Service
special equipment such as boats, vans,<br />
<strong>and</strong> cabins accounted for $9.1 billion.<br />
There were 1.4 million people who<br />
fished 18 million days on 13 million<br />
trips to the Great Lakes in <strong>2006</strong>. Their<br />
Great Lakes-related expenditures<br />
totaled $1.5 billion. Trip-related<br />
expenses totaled $1.1 billion. Of these<br />
expenditures, $375 million was spent<br />
on food <strong>and</strong> lodging, 35 percent <strong>of</strong> trip<br />
costs; $238 million went for transportation,<br />
22 percent <strong>of</strong> trip costs; <strong>and</strong><br />
$453 million, or 43 percent, was spent<br />
on other items such as guide fees,<br />
equipment rental <strong>and</strong> bait. Equipment<br />
expenditures totaled $442 million. Of<br />
this $442 million, $165 million was for<br />
fishing equipment (rods, reels, etc.),<br />
$18 million was for auxiliary equipment<br />
(camping equipment, binoculars,<br />
etc.), <strong>and</strong> $258 million was for special<br />
equipment (boats, vans, etc.).<br />
Saltwater <strong>Fishing</strong> Highlights<br />
In <strong>2006</strong>, 7.7 million anglers enjoyed<br />
saltwater fishing on 67 million trips<br />
totaling 86 million days. Overall, they<br />
spent $8.9 billion during the year<br />
on trips <strong>and</strong> equipment for saltwater<br />
fishing. Trip-related expenditures<br />
accounted for $5.3 billion or 60 percent<br />
<strong>of</strong> the total. Spending for food <strong>and</strong><br />
lodging was $1.7 billion or 32 percent<br />
<strong>of</strong> trip expenditures. Transportation<br />
spending totaled $1.1 billion, 20<br />
percent <strong>of</strong> trip expenditures. Other trip<br />
expenditures, such as equipment rental,<br />
bait, <strong>and</strong> guide fees, were $2.5 billion<br />
(48 percent).<br />
Anglers spent a total <strong>of</strong> $3.6 billion on<br />
equipment for saltwater fishing. Of the<br />
$3.6 billion, $1.3 billion was for fishing<br />
equipment (rods, reels, etc.), $108<br />
million was for auxiliary equipment<br />
(camping equipment, binoculars, etc.),<br />
<strong>and</strong> $2.2 billion was for special equipment<br />
(boats, vans, etc.).<br />
Saltwater <strong>Fishing</strong><br />
Anglers . . . . . . . .<br />
Days . . . . . . . . . .<br />
Trips . . . . . . . . . .<br />
Trip <strong>and</strong> equipment<br />
expenditures . . .<br />
7.7 million<br />
85.7 million<br />
67.0 million<br />
$8.9 billion<br />
Comparative Trip <strong>and</strong> Equipment Expenditures<br />
Total expenses<br />
Trip-related<br />
Equipment<br />
$24.6 billion<br />
Source: Tables 1 <strong>and</strong> 16.<br />
71%<br />
60%<br />
47%<br />
$8.9 billion<br />
29%<br />
40%<br />
53%<br />
$1.5 billion<br />
Great<br />
Lakes<br />
Saltwater Freshwater<br />
except<br />
Great Lakes<br />
Great<br />
Lakes<br />
Saltwater Freshwater<br />
except<br />
Great Lakes<br />
U.S. Fish & <strong>Wildlife</strong> Service <strong>2006</strong> <strong>National</strong> <strong>Survey</strong> <strong>of</strong> <strong>Fishing</strong>, <strong>Hunting</strong>, <strong>and</strong> <strong>Wildlife</strong>-<strong>Associated</strong> Recreation 11
Days per angler<br />
Trips per angler<br />
Trip expenditures<br />
per angler<br />
Trip expenditures<br />
per day<br />
Selected Fish by Type <strong>of</strong> <strong>Fishing</strong><br />
(In millions)<br />
Type <strong>of</strong> fishing Anglers Days<br />
Freshwater except Great Lakes, total . . . . . . . . . . . . 25.0 419.9<br />
Black bass. . . . . . . . . . . . . . . . . . . . . . . . . . . . . . . . . 10.0 161.0<br />
Panfish . . . . . . . . . . . . . . . . . . . . . . . . . . . . . . . . . . . 7.5 101.6<br />
Catfish/bullhead . . . . . . . . . . . . . . . . . . . . . . . . . . . . 7.0 98.2<br />
Trout . . . . . . . . . . . . . . . . . . . . . . . . . . . . . . . . . . . . . 6.8 75.5<br />
Crappie . . . . . . . . . . . . . . . . . . . . . . . . . . . . . . . . . . . 6.2 90.7<br />
White bass, striped bass, <strong>and</strong> striped bass hybrids . . 4.8 65.2<br />
Great Lakes, total . . . . . . . . . . . . . . . . . . . . . . . . . . . . 1.4 18.0<br />
Walleye, sauger . . . . . . . . . . . . . . . . . . . . . . . . . . . . 0.5 4.9<br />
Perch . . . . . . . . . . . . . . . . . . . . . . . . . . . . . . . . . . . . . 0.5 5.5<br />
Salmon . . . . . . . . . . . . . . . . . . . . . . . . . . . . . . . . . . . 0.4 5.7<br />
Lake trout . . . . . . . . . . . . . . . . . . . . . . . . . . . . . . . . . 0.3 4.4<br />
Black bass. . . . . . . . . . . . . . . . . . . . . . . . . . . . . . . . . 0.3 2.9<br />
Steelhead . . . . . . . . . . . . . . . . . . . . . . . . . . . . . . . . . 0.2 1.9<br />
Saltwater, total . . . . . . . . . . . . . . . . . . . . . . . . . . . . . . . 7.7 85.7<br />
Flatfish (flounder, halibut) . . . . . . . . . . . . . . . . . . . . 2.1 20.5<br />
Redfish (red drum) . . . . . . . . . . . . . . . . . . . . . . . . . 1.8 20.2<br />
Sea trout (weak fish). . . . . . . . . . . . . . . . . . . . . . . . . 1.5 18.2<br />
Striped bass . . . . . . . . . . . . . . . . . . . . . . . . . . . . . . . 1.4 15.4<br />
Bluefish . . . . . . . . . . . . . . . . . . . . . . . . . . . . . . . . . . 1.0 9.9<br />
Salmon . . . . . . . . . . . . . . . . . . . . . . . . . . . . . . . . . . . 0.6 3.4<br />
Source: Tables 3, 4, <strong>and</strong> 5.<br />
Comparative <strong>Fishing</strong> by Type <strong>of</strong> <strong>Fishing</strong><br />
$35<br />
$27<br />
$59<br />
$62<br />
9<br />
9<br />
11<br />
13<br />
13<br />
13<br />
17<br />
17<br />
All fishing<br />
Freshwater except Great Lakes<br />
Great Lakes<br />
Saltwater<br />
$460<br />
$597<br />
$686<br />
$751<br />
Comparative <strong>Fishing</strong> Highlights<br />
In <strong>2006</strong>, anglers spent an average <strong>of</strong> 17<br />
days fishing <strong>and</strong> took an average <strong>of</strong> 13<br />
fishing trips. Similarly, in freshwater<br />
excluding the Great Lakes, anglers<br />
fished an average <strong>of</strong> 17 days <strong>and</strong> took<br />
13 trips. For Great Lakes fishing,<br />
participants averaged 13 days <strong>of</strong> fishing<br />
on an average <strong>of</strong> 9 trips. Saltwater<br />
anglers fished fewer days, averaging 11<br />
days <strong>of</strong> fishing on 9 saltwater trips.<br />
Overall, anglers spent an average <strong>of</strong><br />
$1,407 on fishing-related expenses in<br />
<strong>2006</strong>. They averaged $597 per angler<br />
on their trips, or about $35 per day. For<br />
freshwater fishing excluding the Great<br />
Lakes, participants averaged $460 in<br />
trip-related expenses in <strong>2006</strong>, equaling<br />
$27 per day. For fishing in the Great<br />
Lakes, participants averaged $751 in<br />
trip-related expenses, equaling $59 per<br />
day. Anglers in saltwater averaged trip<br />
expenditures <strong>of</strong> $686 per participant,<br />
which amounts to approximately $62<br />
per day.<br />
<strong>Fishing</strong> for Selected Fish<br />
The most popular fish species among<br />
the 25.0 million anglers who fished<br />
freshwater other than the Great Lakes<br />
was black bass. Ten million spent 161<br />
million days fishing for black bass.<br />
Following black bass in popularity<br />
were several species with a similar<br />
number <strong>of</strong> anglers <strong>and</strong> days <strong>of</strong> fishing.<br />
Panfish were pursued by 7.5 million<br />
anglers on 102 million days. Catfish<br />
<strong>and</strong> bullheads drew 7.0 million anglers<br />
on 98 million days. About 6.8 million<br />
anglers fished for trout on 76 million<br />
days. Crappie fishing attracted 6.2<br />
million anglers on 91 million days.<br />
Three species were very close in<br />
popularity among Great Lakes anglers.<br />
Walleye <strong>and</strong> sauger attracted nearly<br />
500 thous<strong>and</strong> anglers, as did perch.<br />
Anglers fished for walleye <strong>and</strong> sauger<br />
for 4.9 million days <strong>and</strong> for perch, 5.5<br />
million days. Salmon followed closely<br />
with 418 thous<strong>and</strong> anglers fishing for<br />
5.7 million days. Lake trout, black bass<br />
<strong>and</strong> steelhead were also popular Great<br />
Lakes species, as they were pursued by<br />
328 thous<strong>and</strong>, 298 thous<strong>and</strong>, <strong>and</strong> 201<br />
thous<strong>and</strong> anglers, respectively.<br />
Among the 7.7 million saltwater<br />
anglers, 2.1 million fished for flatfish,<br />
which includes flounder <strong>and</strong> halibut, on<br />
21 million days. Redfish (red drum)<br />
followed in popularity with 1.8 million<br />
12 <strong>2006</strong> <strong>National</strong> <strong>Survey</strong> <strong>of</strong> <strong>Fishing</strong>, <strong>Hunting</strong>, <strong>and</strong> <strong>Wildlife</strong>-<strong>Associated</strong> Recreation U.S. Fish & <strong>Wildlife</strong> Service
anglers fishing for 20 million days.<br />
Also popular were sea trout <strong>and</strong> striped<br />
bass with 1.5 <strong>and</strong> 1.4 million anglers<br />
who fished for 18.2 <strong>and</strong> 15.4 million<br />
days, respectively. Other prominent<br />
saltwater species were bluefish with 1.0<br />
million anglers <strong>and</strong> salmon with nearly<br />
600 thous<strong>and</strong> anglers.<br />
Participation by Geographic Region<br />
In <strong>2006</strong>, 229 million people 16 years<br />
old <strong>and</strong> older lived in the United States<br />
<strong>and</strong> 1 <strong>of</strong> every 8 <strong>of</strong> these U.S. residents<br />
went fishing. While the national<br />
participation rate was 13 percent, the<br />
regional rates ranged from 8 percent<br />
in the Middle Atlantic <strong>and</strong> Pacific to<br />
21 percent in the West North Central.<br />
The West North Central, East North<br />
Central, East South Central, West South<br />
Central, <strong>and</strong> South Atlantic all reported<br />
participation rates above the national<br />
rate. The Mountain region tied the<br />
national rate at 13 percent, <strong>and</strong> New<br />
Engl<strong>and</strong> was below the national rate at<br />
11 percent.<br />
<strong>Fishing</strong> in State <strong>of</strong> Residence <strong>and</strong><br />
in Other States<br />
A large majority <strong>of</strong> the 30.0 million<br />
anglers who fished in <strong>2006</strong> did so<br />
within their home state. Approximately<br />
27.6 million participants, 92 percent <strong>of</strong><br />
all anglers, fished in their resident state.<br />
Nearly 6.5 million, 22 percent, fished<br />
out <strong>of</strong> state. Percentages do not add to<br />
100 because those anglers who fished<br />
both in state <strong>and</strong> out <strong>of</strong> state were<br />
included in both categories.<br />
Of the 25.0 million non-Great Lakes<br />
freshwater anglers, 93 percent, 23.3<br />
million, fished within their resident<br />
state. About 4.6 million, 18 percent, <strong>of</strong><br />
these freshwater anglers fished out <strong>of</strong><br />
state.<br />
Eighty-three percent, 1.2 million,<br />
<strong>of</strong> all Great Lakes anglers enjoyed<br />
fishing within their home state in <strong>2006</strong>.<br />
Twenty-two percent, 306 thous<strong>and</strong>, <strong>of</strong><br />
all Great Lakes anglers fished out <strong>of</strong><br />
state.<br />
Pacific<br />
8%<br />
HI<br />
CA<br />
AK<br />
OR<br />
WA<br />
NV<br />
ID<br />
AZ<br />
UT<br />
<strong>Fishing</strong> Participation<br />
(<strong>National</strong> participation rate: 13%)<br />
Mountain<br />
13%<br />
MT<br />
WY<br />
NM<br />
CO<br />
West North<br />
Central<br />
21%<br />
ND<br />
SD<br />
NE<br />
TX<br />
KS<br />
OK<br />
Of the three different types <strong>of</strong> fishing,<br />
saltwater fishing had both the highest<br />
percentage <strong>of</strong> anglers fishing outside<br />
their resident state, 28 percent, <strong>and</strong> the<br />
lowest percentage fishing within their<br />
resident state, 79 percent. Nonresident<br />
saltwater anglers numbered 2.2 million<br />
<strong>and</strong> resident anglers 6.1 million.<br />
MN<br />
West South<br />
Central<br />
16%<br />
IA<br />
MO<br />
AR<br />
LA<br />
WI<br />
IL<br />
MS<br />
East<br />
North<br />
Central<br />
15%<br />
IN<br />
MI<br />
KY<br />
TN<br />
AL<br />
OH<br />
East South<br />
Central<br />
18%<br />
GA<br />
WV<br />
SC<br />
FL<br />
PA<br />
VA<br />
NC<br />
NH<br />
VT<br />
New Engl<strong>and</strong><br />
11%<br />
ME<br />
MA<br />
NY<br />
RI<br />
CT<br />
NJ<br />
DE<br />
MD<br />
DC<br />
South Atlantic<br />
14%<br />
Middle<br />
Atlantic<br />
8%<br />
<strong>Fishing</strong> in State <strong>of</strong> Residence<br />
<strong>and</strong> in Other States<br />
(In millions)<br />
Out <strong>of</strong><br />
In state state<br />
Total anglers . . . . . 27.6 6.5<br />
Freshwater except<br />
Great Lakes . . . 23.3 4.6<br />
Great Lakes . . . . 1.2 0.3<br />
Saltwater . . . . . . . 6.1 2.2<br />
Percent <strong>of</strong> All <strong>Fishing</strong>—in State <strong>of</strong> Residence <strong>and</strong> in Other States<br />
(Total: 30.0 million participants)<br />
In state <strong>of</strong> residence only<br />
78%<br />
In state <strong>of</strong> residence <strong>and</strong><br />
other states<br />
14%<br />
In other states only<br />
8%<br />
Source: Table 2.<br />
U.S. Fish & <strong>Wildlife</strong> Service <strong>2006</strong> <strong>National</strong> <strong>Survey</strong> <strong>of</strong> <strong>Fishing</strong>, <strong>Hunting</strong>, <strong>and</strong> <strong>Wildlife</strong>-<strong>Associated</strong> Recreation 13
Total freshwater<br />
excluding Great Lakes<br />
Lakes <strong>and</strong> reservoirs<br />
Rivers <strong>and</strong> streams<br />
Total freshwater<br />
excluding Great Lakes<br />
Lakes <strong>and</strong> reservoirs<br />
Rivers <strong>and</strong> streams<br />
Great Lakes <strong>Fishing</strong><br />
Types <strong>of</strong> Freshwater Fished, Excluding Great Lakes<br />
(In millions)<br />
Anglers<br />
Days<br />
11.3<br />
136.0<br />
21.1<br />
25.0<br />
304.5<br />
Percentage<br />
Anglers <strong>of</strong> all Great<br />
(thous<strong>and</strong>s) Lakes anglers<br />
Total, all Great Lakes . . . . . . . . . . . . . . . . . 1,420 100<br />
Lake Erie . . . . . . . . . . . . . . . . . . . . . . . . . . . . 526 37<br />
Lake Michigan . . . . . . . . . . . . . . . . . . . . . . . 474 33<br />
Lake Ontario . . . . . . . . . . . . . . . . . . . . . . . . . 218 15<br />
Tributaries to the Great Lakes . . . . . . . . . . . . 134 9<br />
Lake Huron . . . . . . . . . . . . . . . . . . . . . . . . . . *93 7<br />
Lake Superior . . . . . . . . . . . . . . . . . . . . . . . . *89 6<br />
St. Lawrence River . . . . . . . . . . . . . . . . . . . . ... ...<br />
Lake St. Clair . . . . . . . . . . . . . . . . . . . . . . . . ... ...<br />
419.9<br />
Types <strong>of</strong> Freshwater Fished,<br />
Excluding Great Lakes<br />
Excluding the Great Lakes, 84 percent<br />
or 21.1 million <strong>of</strong> all freshwater anglers<br />
fished in reservoirs, lakes, <strong>and</strong> ponds.<br />
Forty-five percent or 11.3 million fished<br />
in rivers <strong>and</strong> streams. They spent 304<br />
million days fishing in lakes, reservoirs,<br />
<strong>and</strong> ponds <strong>and</strong> 136 million days fishing<br />
in rivers <strong>and</strong> streams.<br />
Great Lakes Anglers<br />
Great Lakes fishing includes not only<br />
the Great Lakes, but also their tributaries—bodies<br />
<strong>of</strong> water that connect<br />
the Great Lakes—<strong>and</strong> the St. Lawrence<br />
River south <strong>of</strong> the bridge at Cornwall.<br />
The most popular <strong>of</strong> the Lakes among<br />
anglers was Lake Erie, attracting 37<br />
percent <strong>of</strong> all the Great Lakes anglers.<br />
They averaged 9 days <strong>of</strong> fishing in<br />
Lake Erie during <strong>2006</strong>. Lake Michigan<br />
ranked second in popularity, hosting<br />
33 percent <strong>of</strong> Great Lakes anglers who<br />
fished there for an average <strong>of</strong> 12 days.<br />
Lake Ontario attracted 15 percent <strong>of</strong><br />
the anglers, 218 thous<strong>and</strong>, who averaged<br />
6 fishing days. The tributaries<br />
to the Lakes drew 9 percent <strong>of</strong> Great<br />
Lakes anglers who averaged 9 days per<br />
angler. Lake Huron drew 7 percent, 93<br />
thous<strong>and</strong> anglers, who averaged 9 days<br />
<strong>of</strong> fishing.<br />
* Estimate based on a sample size <strong>of</strong> 10–29.<br />
... Sample size too small to report data reliably.<br />
Source: Table 26.<br />
14 <strong>2006</strong> <strong>National</strong> <strong>Survey</strong> <strong>of</strong> <strong>Fishing</strong>, <strong>Hunting</strong>, <strong>and</strong> <strong>Wildlife</strong>-<strong>Associated</strong> Recreation U.S. Fish & <strong>Wildlife</strong> Service
Sex <strong>and</strong> Age <strong>of</strong> Anglers<br />
Although more men than women<br />
fished in <strong>2006</strong>, a substantial number <strong>of</strong><br />
women fished as well. Twenty percent<br />
<strong>of</strong> all males 16 years <strong>and</strong> older went<br />
fishing, while 6 percent <strong>of</strong> females<br />
fished. Of the 30.0 million anglers who<br />
fished in the United States, 75 percent,<br />
22.3 million, were male <strong>and</strong> 25 percent,<br />
7.6 million, were female.<br />
Of the age categories, 7.5 million<br />
anglers, 25 percent <strong>of</strong> all anglers, were<br />
35 to 44 years old. Their participation<br />
rate was also the highest at 17<br />
percent. They were followed by 6.6<br />
million anglers 45 to 54 years old who<br />
composed 22 percent <strong>of</strong> all anglers <strong>and</strong><br />
had a participation rate <strong>of</strong> 15 percent.<br />
Next came the 25-to-34-year-old age<br />
group with 4.9 million participants<br />
who accounted for 16 percent <strong>of</strong> all<br />
anglers <strong>and</strong> had a participation rate <strong>of</strong><br />
13 percent. The 4.6 million 55-to-64-<br />
year-olds who fished accounted for 15<br />
percent <strong>of</strong> all anglers <strong>and</strong> had a participation<br />
rate <strong>of</strong> 14 percent. Anglers<br />
65 years old <strong>and</strong> older numbered 2.8<br />
million, 10 percent <strong>of</strong> total anglers, <strong>and</strong><br />
had a 7 percent participation rate. The<br />
2.4 million anglers 18 to 24 years old<br />
made up 8 percent <strong>of</strong> the angler population,<br />
<strong>and</strong> they had a participation rate<br />
<strong>of</strong> 10 percent. The 16- <strong>and</strong> 17-yearolds<br />
added 1.1 million individuals to<br />
the angler population. They made up<br />
4 percent <strong>of</strong> the total angler population<br />
<strong>and</strong> had a 13 percent participation rate.<br />
Anglers by Sex <strong>and</strong> Age<br />
Total, both sexes . . 30.0 million<br />
Male . . . . . . . . . . 22.3 million<br />
Female . . . . . . . . 7.6 million<br />
Percent <strong>of</strong> Males <strong>and</strong> Females Who Fished in the United States<br />
Males 20%<br />
Females<br />
Females<br />
25%<br />
16 <strong>and</strong> 17<br />
4%<br />
18 to 24<br />
8%<br />
25 to 34<br />
16%<br />
6%<br />
Percent <strong>of</strong> Anglers by Sex<br />
Percent <strong>of</strong> Anglers by Age<br />
Males<br />
75%<br />
65 <strong>and</strong> older<br />
10%<br />
55 to 64<br />
15%<br />
45 to 54<br />
22%<br />
35 to 44<br />
25%<br />
Percent <strong>of</strong> U.S. Population Who Fished by Age<br />
16 <strong>and</strong> 17 13%<br />
18 to 24<br />
10%<br />
Total, all ages . . . . . 30.0 million<br />
16 <strong>and</strong> 17 . . . . . . 1.1 million<br />
18 to 24 . . . . . . . . 2.4 million<br />
25 to 34 . . . . . . . . 4.9 million<br />
35 to 44 . . . . . . . . 7.5 million<br />
45 to 54 . . . . . . . . 6.6 million<br />
55 to 64 . . . . . . . . 4.6 million<br />
65 <strong>and</strong> older . . . . 2.8 million<br />
25 to 34<br />
35 to 44<br />
45 to 54<br />
55 to 64<br />
65 <strong>and</strong> older<br />
7%<br />
13%<br />
17%<br />
15%<br />
14%<br />
Source: Table 9.<br />
U.S. Fish & <strong>Wildlife</strong> Service <strong>2006</strong> <strong>National</strong> <strong>Survey</strong> <strong>of</strong> <strong>Fishing</strong>, <strong>Hunting</strong>, <strong>and</strong> <strong>Wildlife</strong>-<strong>Associated</strong> Recreation 15
Large MSA<br />
39%<br />
Percent <strong>of</strong> Anglers by Residence<br />
Percent <strong>of</strong> U.S. Population Who Fished by Residence<br />
(Total U.S. population that fished: 13%)<br />
Large MSA<br />
(1,000,000 or more)<br />
Medium MSA<br />
(250,000 to 999,999)<br />
Small MSA<br />
(249,999 or less)<br />
Outside MSA<br />
10%<br />
Outside MSA<br />
27%<br />
Small MSA<br />
14%<br />
Medium MSA<br />
20%<br />
13%<br />
18%<br />
21%<br />
Metropolitan <strong>and</strong> Nonmetropolitan<br />
Anglers<br />
While residents <strong>of</strong> metropolitan statistical<br />
areas (MSAs) 1 had lower participation<br />
rates in fishing than non-MSA<br />
residents, they still accounted for the<br />
majority <strong>of</strong> anglers. Eleven percent<br />
<strong>of</strong> all MSA residents fished in <strong>2006</strong>,<br />
but they composed 73 percent <strong>of</strong> all<br />
anglers. By comparison, non-MSA<br />
residents composed 27 percent <strong>of</strong> all<br />
anglers, but their participation rate was<br />
more than twice as high at 21 percent.<br />
Larger MSAs had lower participation<br />
rates in fishing than smaller MSAs but<br />
composed more <strong>of</strong> the angler population.<br />
Large MSAs with populations<br />
<strong>of</strong> 1,000,000 or more had the lowest<br />
participation rate at 10 percent, but<br />
they made up 39 percent <strong>of</strong> all anglers.<br />
Medium MSAs with a population <strong>of</strong><br />
250,000 to 999,999 had a 13 percent<br />
participation rate <strong>and</strong> represented 20<br />
percent <strong>of</strong> all anglers. Those MSAs<br />
with populations under 250,000 had<br />
a participation rate <strong>of</strong> 18 percent <strong>and</strong><br />
composed 14 percent <strong>of</strong> all anglers.<br />
Percent <strong>of</strong> U.S. Population Who Fished by Household Income<br />
Less than $10,000<br />
7%<br />
$10,000 to $19,999<br />
9%<br />
$20,000 to $24,999<br />
13%<br />
$25,000 to $29,999<br />
13%<br />
$30,000 to $34,999<br />
14%<br />
$35,000 to $39,999<br />
15%<br />
$40,000 to $49,999<br />
16%<br />
$50,000 to $74,999<br />
18%<br />
$75,000 to $99,999<br />
19%<br />
$100,000 or more<br />
18%<br />
Household Income <strong>of</strong> Anglers<br />
The participation rate in fishing tended<br />
to increase as household income<br />
increased. The participation rate is<br />
the percent <strong>of</strong> each income group that<br />
fished. The rate for those who reported<br />
incomes <strong>of</strong> $75,000 to $99,999 was<br />
the highest at 19 percent. Those with<br />
incomes <strong>of</strong> $50,000 to $74,999 <strong>and</strong><br />
$100,000 or more had a slightly lower<br />
rate at 18 percent. The participation<br />
rate declined as income decreased.<br />
Those with incomes $40,000 to<br />
$49,999 participated at a 16 percent<br />
rate, <strong>and</strong> it declined steadily to 15<br />
percent among those with incomes<br />
$35,000 to $39,999, 14 percent among<br />
those with incomes $30,000 to $34,999,<br />
<strong>and</strong> 13 percent among those with<br />
incomes $20,000 to $29,999. Those<br />
with incomes under $20,000 had the<br />
lowest participation rates at under 10<br />
percent.<br />
The majority <strong>of</strong> anglers had household<br />
incomes <strong>of</strong> $50,000 or more. Among<br />
anglers who reported income, 59<br />
percent were from households with<br />
incomes <strong>of</strong> $50,000 or more <strong>and</strong> 41<br />
percent were from households with<br />
incomes <strong>of</strong> less than $50,000.<br />
1<br />
See Appendix A for definition <strong>of</strong> metropolitan<br />
statistical area.<br />
16 <strong>2006</strong> <strong>National</strong> <strong>Survey</strong> <strong>of</strong> <strong>Fishing</strong>, <strong>Hunting</strong>, <strong>and</strong> <strong>Wildlife</strong>-<strong>Associated</strong> Recreation U.S. Fish & <strong>Wildlife</strong> Service
Education, Race, <strong>and</strong> Ethnicity<br />
People <strong>of</strong> all educational backgrounds<br />
had similar participation rates. Those<br />
with 11 years <strong>of</strong> education or less <strong>and</strong><br />
those with 5 years <strong>of</strong> college or more<br />
had participation rates <strong>of</strong> 12 percent.<br />
Those with 12 years <strong>of</strong> education <strong>and</strong><br />
those with 4 years <strong>of</strong> college had participation<br />
rates <strong>of</strong> 13 percent. Those with<br />
1 to 3 years <strong>of</strong> college had the highest<br />
participation rate at 14 percent.<br />
While the highest participation rate<br />
is among those with 1 to 3 years<br />
<strong>of</strong> college, those with 12 years <strong>of</strong><br />
education make up the largest share<br />
<strong>of</strong> anglers. Thirty-four percent or<br />
10.3 million anglers have 12 years <strong>of</strong><br />
education.<br />
<strong>Fishing</strong> was most popular among<br />
Whites <strong>and</strong> those identified as other<br />
races. Whites participated at a 15<br />
percent rate. Other races, which<br />
include Native Americans, Pacific<br />
Isl<strong>and</strong>ers, <strong>and</strong> those <strong>of</strong> mixed race,<br />
participated at a 16 percent rate.<br />
Blacks <strong>and</strong> Asians participated at<br />
comparatively lower rates at 6 percent<br />
<strong>and</strong> 3 percent, respectively. Of all<br />
anglers, 92 percent were White, 5<br />
percent were Black, 1 percent was<br />
Asian, <strong>and</strong> 2 percent were other races.<br />
Hispanics, who represent a growing<br />
percentage <strong>of</strong> the U.S. population,<br />
fished at a much lower rate than non-<br />
Hispanics. Five percent <strong>of</strong> Hispanics<br />
fished in <strong>2006</strong> compared to 14 percent<br />
11 years or less<br />
13%<br />
12 years<br />
1 to 3 years <strong>of</strong> college<br />
4 years <strong>of</strong> college<br />
5 years or more<br />
<strong>of</strong> college<br />
12 years<br />
34%<br />
Other 2%<br />
Asian 1%<br />
Black 5%<br />
Percent <strong>of</strong> Anglers by Education<br />
Percent <strong>of</strong> Anglers by Race<br />
<strong>of</strong> non-Hispanics. The 1.6 million<br />
Hispanics who fished in <strong>2006</strong> made up<br />
5 percent <strong>of</strong> all anglers.<br />
4 years <strong>of</strong> college<br />
17%<br />
Percent <strong>of</strong> U.S. Population Who Fished by Education<br />
11 years or less 12%<br />
5 years or more <strong>of</strong> college<br />
10%<br />
1 to 3 years <strong>of</strong> college<br />
25%<br />
White 92%<br />
12%<br />
13%<br />
13%<br />
14%<br />
Anglers by Education, Race,<br />
<strong>and</strong> Ethnicity<br />
(In millions)<br />
Total anglers . . . . . . . . . . . 30.0<br />
Education<br />
11 years or less . . . . . . . . 4.0<br />
12 years . . . . . . . . . . . . . 10.3<br />
1 to 3 years . . . . . . . . . . . 7.6<br />
4 years <strong>of</strong> college . . . . . . 5.1<br />
5 years or more <strong>of</strong> college 2.9<br />
Race<br />
White . . . . . . . . . . . . . . . 27.5<br />
Black . . . . . . . . . . . . . . . 1.5<br />
Asian . . . . . . . . . . . . . . . 0.3<br />
Other . . . . . . . . . . . . . . . . 0.6<br />
White<br />
Black<br />
Asian<br />
Other<br />
Percent <strong>of</strong> U.S. Population Who Fished by Race<br />
3%<br />
6%<br />
15%<br />
16%<br />
Ethnicity<br />
Hispanic . . . . . . . . . . . . . 1.6<br />
Non-Hispanic . . . . . . . . . 28.4<br />
Source: Table 9.<br />
Percent <strong>of</strong> U.S. Population Who Fished by Ethnicity<br />
Non-Hispanic 14%<br />
Hispanic<br />
5%<br />
U.S. Fish & <strong>Wildlife</strong> Service <strong>2006</strong> <strong>National</strong> <strong>Survey</strong> <strong>of</strong> <strong>Fishing</strong>, <strong>Hunting</strong>, <strong>and</strong> <strong>Wildlife</strong>-<strong>Associated</strong> Recreation 17
1996–<strong>2006</strong> Comparison <strong>of</strong> <strong>Fishing</strong><br />
Activity<br />
In <strong>2006</strong>, participation for all types <strong>of</strong><br />
fishing was down significantly from<br />
both 1996 <strong>and</strong> 2001. The majority<br />
<strong>of</strong> the downturn occurred over the<br />
five-year period from 2001 to <strong>2006</strong>.<br />
As a result, the percent changes from<br />
1996 to <strong>2006</strong> <strong>and</strong> 2001 to <strong>2006</strong> are<br />
similar. The total number <strong>of</strong> anglers<br />
fell 15 percent from 1996 to <strong>2006</strong> <strong>and</strong><br />
12 percent from 2001 to <strong>2006</strong>. Over<br />
the ten years from 1996 to <strong>2006</strong> <strong>and</strong><br />
the five years between 2001 <strong>and</strong> <strong>2006</strong>,<br />
fishing in the Great Lakes experienced<br />
the greatest downturn at 30 percent <strong>and</strong><br />
23 percent, respectively. <strong>Fishing</strong> in<br />
freshwater other than the Great Lakes<br />
fared the best with a decline <strong>of</strong> only 13<br />
percent between 1996 <strong>and</strong> <strong>2006</strong> <strong>and</strong><br />
a decline <strong>of</strong> only 10 percent between<br />
2001 to <strong>2006</strong>. The decline in saltwater<br />
fishing was between these two with an<br />
18 percent decline from 1996 to <strong>2006</strong><br />
<strong>and</strong> a 15 percent decline from 2001 to<br />
<strong>2006</strong>.<br />
The trend in fishing days was similar<br />
to that <strong>of</strong> total participants. For all<br />
types <strong>of</strong> fishing, there was a decline <strong>of</strong><br />
7 percent in the number <strong>of</strong> fishing days<br />
from 2001 to <strong>2006</strong>. As with anglers,<br />
the decline in days from 2001 to <strong>2006</strong><br />
was sharpest for Great Lakes fishing<br />
at 22 percent, which was followed by<br />
saltwater fishing at 6 percent. The<br />
decline among freshwater other than<br />
Great Lakes fishing was the least at 5<br />
percent. Overall, the decline in days<br />
from 2001 to <strong>2006</strong> was not as large as<br />
the decline in the number <strong>of</strong> anglers.<br />
This indicates that the average number<br />
<strong>of</strong> days fishing by anglers increased<br />
over the period.<br />
The trend in fishing expenditures is<br />
different from that <strong>of</strong> total participants.<br />
<strong>Fishing</strong>-related expenditures declined<br />
significantly from 1996 to <strong>2006</strong> but<br />
remained roughly the same from 2001<br />
to <strong>2006</strong>. Total fishing expenditures<br />
fell 13 percent from 1996 to <strong>2006</strong> <strong>and</strong><br />
increased 4 percent from 2001 to <strong>2006</strong>,<br />
but this is not a statistically significant<br />
change. None <strong>of</strong> the changes from<br />
2001 to <strong>2006</strong> were significant.<br />
Number <strong>of</strong> Anglers<br />
(Millions)<br />
Days <strong>of</strong> <strong>Fishing</strong><br />
(Millions)<br />
<strong>Fishing</strong> Expenditures<br />
(Billions <strong>of</strong> <strong>2006</strong> dollars)<br />
35.2<br />
34.1<br />
30.0<br />
625.9<br />
557.4<br />
516.8<br />
$48.6<br />
$40.6<br />
$42.0<br />
1996<br />
2001<br />
<strong>2006</strong><br />
1996<br />
2001<br />
<strong>2006</strong><br />
1996<br />
2001<br />
<strong>2006</strong><br />
18 <strong>2006</strong> <strong>National</strong> <strong>Survey</strong> <strong>of</strong> <strong>Fishing</strong>, <strong>Hunting</strong>, <strong>and</strong> <strong>Wildlife</strong>-<strong>Associated</strong> Recreation U.S. Fish & <strong>Wildlife</strong> Service
1996–<strong>2006</strong> <strong>Fishing</strong> Participants, Days, <strong>and</strong> Expenditures<br />
(U.S. population 16 years old <strong>and</strong> older. Numbers in thous<strong>and</strong>s)<br />
1996 <strong>2006</strong> 1996–<strong>2006</strong><br />
Number Percent Number Percent percent change<br />
Anglers, total . . . . . . . . . . . . . . . . . . . . . 35,246 100 29,952 100 –15<br />
All freshwater . . . . . . . . . . . . . . . . . . . 29,734 87 25,431 85 –14<br />
Freshwater, except Great Lakes . . 28,921 85 25,035 84 –13<br />
Great Lakes . . . . . . . . . . . . . . . . . . 2,039 7 1,420 5 –30<br />
Saltwater . . . . . . . . . . . . . . . . . . . . . . . 9,438 25 7,717 26 –18<br />
Days, total . . . . . . . . . . . . . . . . . . . . . . . 625,893 100 516,781 100 –17<br />
All freshwater . . . . . . . . . . . . . . . . . . . 515,115 82 433,337 84 –16<br />
Freshwater, except Great Lakes . . 485,474 78 419,942 81 –13<br />
Great Lakes . . . . . . . . . . . . . . . . . . 20,095 3 18,016 3 –10*<br />
Saltwater . . . . . . . . . . . . . . . . . . . . . . . 103,034 16 85,663 17 –17<br />
<strong>Fishing</strong>, total (<strong>2006</strong> dollars) . . . . . . . . . $48,565,444 100 $42,011,124 100 –13<br />
Trip-related . . . . . . . . . . . . . . . . . . . . . 19,763,326 41 17,878,560 43 –10*<br />
Equipment . . . . . . . . . . . . . . . . . . . . . 24,636,355 51 18,757,370 45 –24<br />
<strong>Fishing</strong> equipment . . . . . . . . . . . . . 6,821,115 14 5,332,401 13 –22<br />
Auxiliary equipment . . . . . . . . . . . 1,332,134 3 778,740 2 –42<br />
Special equipment . . . . . . . . . . . . . 16,483,106 34 12,646,229 30 –23*<br />
Other . . . . . . . . . . . . . . . . . . . . . . . . . . 4,165,763 9 5,375,195 13 29 *<br />
* Not different from zero at the 5 percent level <strong>of</strong> significance.<br />
2001–<strong>2006</strong> <strong>Fishing</strong> Participants, Days, <strong>and</strong> Expenditures<br />
(U.S. population 16 years old <strong>and</strong> older. Numbers in thous<strong>and</strong>s)<br />
2001 <strong>2006</strong> 2001–<strong>2006</strong><br />
Number Percent Number Percent percent change<br />
Anglers, total . . . . . . . . . . . . . . . . . . . . . 34,071 100 29,952 100 –12<br />
All freshwater . . . . . . . . . . . . . . . . . . . 28,439 83 25,431 85 –11<br />
Freshwater, except Great Lakes . . 27,913 82 25,035 84 –10<br />
Great Lakes . . . . . . . . . . . . . . . . . . 1,847 5 1,420 5 –23<br />
Saltwater . . . . . . . . . . . . . . . . . . . . . . 9,051 27 7,717 26 –15<br />
Days, total . . . . . . . . . . . . . . . . . . . . . . . 557,394 100 516,781 100 –7<br />
All freshwater . . . . . . . . . . . . . . . . . . . 466,984 84 433,337 84 –7<br />
Freshwater, except Great Lakes . . 443,247 80 419,942 81 –5*<br />
Great Lakes . . . . . . . . . . . . . . . . . . 23,138 4 18,016 3 –22*<br />
Saltwater . . . . . . . . . . . . . . . . . . . . . . 90,838 16 85,663 17 –6*<br />
<strong>Fishing</strong>, total (<strong>2006</strong> dollars) . . . . . . . . . $40,560,198 100 $42,011,124 100 4 *<br />
Trip-related . . . . . . . . . . . . . . . . . . . . . 16,682,925 41 17,878,560 43 7 *<br />
Equipment . . . . . . . . . . . . . . . . . . . . . 19,309,578 48 18,757,370 45 –3*<br />
<strong>Fishing</strong> equipment . . . . . . . . . . . . . 5,256,228 13 5,332,401 13 1 *<br />
Auxiliary equipment . . . . . . . . . . . 820,770 2 778,740 2 –5*<br />
Special equipment . . . . . . . . . . . . . 13,232,580 33 12,646,229 30 –4*<br />
Other . . . . . . . . . . . . . . . . . . . . . . . . . 4,567,694 11 5,375,195 13 18 *<br />
* Not different from zero at the 5 percent level <strong>of</strong> significance.<br />
U.S. Fish & <strong>Wildlife</strong> Service <strong>2006</strong> <strong>National</strong> <strong>Survey</strong> <strong>of</strong> <strong>Fishing</strong>, <strong>Hunting</strong>, <strong>and</strong> <strong>Wildlife</strong>-<strong>Associated</strong> Recreation 19
<strong>Hunting</strong>
<strong>Hunting</strong> Highlights<br />
In <strong>2006</strong>, 12.5 million people 16 years<br />
old <strong>and</strong> older enjoyed hunting a variety<br />
<strong>of</strong> animals within the United States.<br />
They hunted 220 million days <strong>and</strong> took<br />
185 million trips. <strong>Hunting</strong> expenditures<br />
totaled $22.9 billion.<br />
Big game hunting was the most popular<br />
type <strong>of</strong> hunting. An estimated 10.7<br />
million hunters pursued big game, such<br />
as deer <strong>and</strong> elk, on 164 million days.<br />
Big game related-expenditures on trips<br />
<strong>and</strong> equipment totaled $11.8 billion.<br />
There were 4.8 million hunters <strong>of</strong> small<br />
game including squirrels <strong>and</strong> rabbits.<br />
They hunted small game on 52 million<br />
days <strong>and</strong> spent $2.4 billion on small<br />
game hunting trips <strong>and</strong> equipment.<br />
Migratory bird hunters numbered 2.3<br />
million. They spent 20.0 million days<br />
hunting birds such as waterfowl <strong>and</strong><br />
dove. Migratory bird-related trip <strong>and</strong><br />
equipment expenditures totaled $1.3<br />
billion. About 1.1 million hunters<br />
sought other animals, such as raccoons<br />
<strong>and</strong> groundhogs, on 15 million days,<br />
<strong>and</strong> their expenditures on trips <strong>and</strong><br />
equipment were $208 million.<br />
14<br />
12<br />
10<br />
8<br />
6<br />
4<br />
2<br />
0<br />
<strong>Hunting</strong><br />
Million<br />
Total<br />
hunting<br />
Big<br />
game<br />
Small<br />
game<br />
Hunters<br />
Migratory Other<br />
bird animals<br />
220 million<br />
164<br />
Big game<br />
Small game<br />
Migratory bird<br />
Other animals<br />
20 16<br />
15 13<br />
Days Trips<br />
Note: Detail does not add to total because <strong>of</strong> multiple responses <strong>and</strong> nonresponse.<br />
52<br />
185 million<br />
115<br />
41<br />
Total <strong>Hunting</strong><br />
Hunters . . . . . . . . . . 12.5 million<br />
Big game . . . . . . 10.7 million<br />
Small game . . . . . 4.8 million<br />
Migratory bird . . 2.3 million<br />
Other animal . . . . 1.1 million<br />
Days . . . . . . . . . . . . 220 million<br />
Big game . . . . . . 164 million<br />
Small game . . . . . 52 million<br />
Migratory bird . . 20 million<br />
Other animal . . . . 15 million<br />
Trips . . . . . . . . . . . . 185 million<br />
Big game . . . . . . 115 million<br />
Small game . . . . . 41 million<br />
Migratory bird . . 16 million<br />
Other animal . . . . 13 million<br />
Expenditures . . . . . $22.9 billion<br />
Big game . . . . . . 11.8 billion<br />
Small game . . . . . 2.4 billion<br />
Migratory bird . . 1.3 billion<br />
Other animal . . . . 0.2 billion<br />
Nonspecific . . . . . 7.1 billion<br />
Source: Tables 1 <strong>and</strong> 17–21.<br />
22 <strong>2006</strong> <strong>National</strong> <strong>Survey</strong> <strong>of</strong> <strong>Fishing</strong>, <strong>Hunting</strong>, <strong>and</strong> <strong>Wildlife</strong>-<strong>Associated</strong> Recreation U.S. Fish & <strong>Wildlife</strong> Service
<strong>Hunting</strong> Expenditures<br />
Of the $22.9 billion spent by hunters<br />
in <strong>2006</strong>, 29 percent, $6.7 billion, was<br />
spent on trip-related expenses. Food<br />
<strong>and</strong> lodging totaled $2.8 billion, 42<br />
percent <strong>of</strong> all trip-related expenses.<br />
Transportation spending was $2.7<br />
billion, 40 percent <strong>of</strong> trip expenditures.<br />
Other trip expenses, such as guide fees,<br />
l<strong>and</strong> use fees, <strong>and</strong> equipment rental,<br />
were $1.2 billion or 18 percent <strong>of</strong> all<br />
trip-related expenses.<br />
Total equipment expenditures for<br />
hunting were $10.7 billion in <strong>2006</strong>,<br />
47 percent <strong>of</strong> all hunting expenses.<br />
<strong>Hunting</strong> equipment, such as guns<br />
<strong>and</strong> rifles, telescopic sights, <strong>and</strong><br />
ammunition, composed $5.4 billion<br />
or 50 percent <strong>of</strong> all equipment costs.<br />
Expenditures for auxiliary equipment,<br />
including camping equipment,<br />
binoculars, <strong>and</strong> special hunting<br />
clothing, accounted for $1.3 billion or<br />
12 percent <strong>of</strong> all equipment expenses.<br />
Special equipment, such as campers or<br />
all-terrain vehicles, amounted to $4.0<br />
billion or 38 percent <strong>of</strong> all equipment<br />
expenditures.<br />
L<strong>and</strong> leasing <strong>and</strong> ownership for hunting<br />
was a large expenditure category.<br />
Hunters spent $4.4 billion on l<strong>and</strong><br />
leasing <strong>and</strong> ownership, which was 19<br />
percent <strong>of</strong> all hunting-related expenditures.<br />
Expenditures for magazines,<br />
books, membership dues, contributions,<br />
licenses, stamps, tags, <strong>and</strong> permits<br />
totaled $1.1 billion or 5 percent.<br />
Total <strong>Hunting</strong> Expenditures<br />
Total hunting expenditures. . . . . . . . . . . . . . . . . . . . . . .<br />
Total trip-related expenditures . . . . . . . . . . . . . . . . . . .<br />
Food <strong>and</strong> lodging . . . . . . . . . . . . . . . . . . . . . . . . . . . . .<br />
Transportation . . . . . . . . . . . . . . . . . . . . . . . . . . . . . . .<br />
Other trip costs . . . . . . . . . . . . . . . . . . . . . . . . . . . . . . .<br />
Total equipment expenditures . . . . . . . . . . . . . . . . . . . .<br />
<strong>Hunting</strong> equipment . . . . . . . . . . . . . . . . . . . . . . . . . . . .<br />
Auxiliary equipment. . . . . . . . . . . . . . . . . . . . . . . . . . .<br />
Special equipment . . . . . . . . . . . . . . . . . . . . . . . . . . . .<br />
Total other hunting expenditures . . . . . . . . . . . . . . . . .<br />
Magazines, books . . . . . . . . . . . . . . . . . . . . . . . . . . . . .<br />
Membership dues <strong>and</strong> contributions . . . . . . . . . . . . . .<br />
L<strong>and</strong> leasing <strong>and</strong> ownership . . . . . . . . . . . . . . . . . . . . .<br />
Licenses, stamps, tags, <strong>and</strong> permits . . . . . . . . . . . . . . .<br />
Source: Table 17.<br />
Other animals<br />
$0.2 billion<br />
1%<br />
Migratory bird<br />
$1.3 billion<br />
6%<br />
<strong>Hunting</strong> Expenditures by Type <strong>of</strong> <strong>Hunting</strong><br />
(Total expenditures: $22.9 billion)<br />
Nonspecific<br />
$7.1 billion<br />
31%<br />
Big game<br />
$11.8 billion<br />
51%<br />
Small game<br />
$2.4 billion<br />
10%<br />
$22.9 billion<br />
$6.7 billion<br />
2.8 billion<br />
2.7 billion<br />
1.2 billion<br />
$10.7 billion<br />
5.4 billion<br />
1.3 billion<br />
4.0 billion<br />
$5.5 billion<br />
0.1 billion<br />
0.3 billion<br />
4.4 billion<br />
0.7 billion<br />
Percent <strong>of</strong> Total <strong>Hunting</strong> Expenditures<br />
(Total expenditures: $22.9 billion)<br />
Equipment<br />
47%<br />
Other<br />
24%<br />
Trip-related<br />
29%<br />
U.S. Fish & <strong>Wildlife</strong> Service <strong>2006</strong> <strong>National</strong> <strong>Survey</strong> <strong>of</strong> <strong>Fishing</strong>, <strong>Hunting</strong>, <strong>and</strong> <strong>Wildlife</strong>-<strong>Associated</strong> Recreation 23
Big Game <strong>Hunting</strong><br />
In <strong>2006</strong>, a majority <strong>of</strong> hunters, 10.7<br />
million, devoted 164 million days to<br />
hunting big game including deer, elk,<br />
bear, <strong>and</strong> wild turkey. They took 115<br />
million trips <strong>and</strong> spent an average <strong>of</strong> 15<br />
days hunting big game.<br />
Trip <strong>and</strong> equipment expenditures for<br />
big game hunting totaled $11.8 billion.<br />
Trip-related expenses were $4.6 billion.<br />
Of that amount, food <strong>and</strong> lodging<br />
accounted for $2.0 billion or 42 percent<br />
<strong>of</strong> all trip-related costs. Transportation<br />
costs reached $1.8 billion, 39 percent <strong>of</strong><br />
trip costs. Other trip-related expenses<br />
amounted to $868 million or 19 percent<br />
<strong>of</strong> trip costs.<br />
Sixty percent <strong>of</strong> big game-related<br />
expenditures was on equipment,<br />
which totaled $7.1 billion. <strong>Hunting</strong><br />
equipment, which includes firearms,<br />
ammunition, bows, <strong>and</strong> arrows,<br />
accounted for $3.0 billion or 42<br />
percent <strong>of</strong> all equipment. Purchases<br />
<strong>of</strong> auxiliary equipment, such as tents<br />
<strong>and</strong> binoculars, totaled $1.1 billion (15<br />
percent). Special equipment, such<br />
as campers <strong>and</strong> all-terrain vehicles,<br />
accounted for $3.0 billion (43 percent).<br />
Small Game <strong>Hunting</strong><br />
Small game, such as rabbits, squirrels,<br />
pheasants, quail, <strong>and</strong> grouse, was also<br />
popular with 4.8 million hunters who<br />
pursued small game on a total <strong>of</strong> 52<br />
million days. They took 41 million<br />
trips <strong>and</strong> averaged 11 days in the field<br />
hunting small game.<br />
These hunters spent $2.4 billion on<br />
trips <strong>and</strong> equipment for small game<br />
hunting. Trip-related expenditures<br />
totaled $1.2 billion. Spending on food<br />
<strong>and</strong> lodging was $510 million or 43<br />
percent <strong>of</strong> all trip expenditures. Transportation<br />
costs totaled $535 million or<br />
45 percent <strong>of</strong> small game trip expenses.<br />
Other trip-related expenditures were<br />
$151 million or 13 percent <strong>of</strong> all trip<br />
costs.<br />
Equipment expenditures for small game<br />
hunting were $1.2 billion. Of that<br />
amount, hunting equipment accounted<br />
for $776 million (66 percent), auxiliary<br />
equipment accounted for $62<br />
million (5 percent), <strong>and</strong> special equipment<br />
accounted for $331 million (28<br />
percent).<br />
Big Game<br />
Hunters . . . . . . . . . 10.7 million<br />
Days . . . . . . . . . . . 164 million<br />
Trips . . . . . . . . . . . 115 million<br />
Trip <strong>and</strong> equipment<br />
expenditures . . . . $11.8 billion<br />
Source: Tables 1 <strong>and</strong> 18.<br />
Equipment<br />
Trip-related<br />
Big Game <strong>Hunting</strong> Trip <strong>and</strong> Equipment Expenditures<br />
(Total expenditures: $11.8 billion)<br />
$4.6 billion<br />
$7.1 billion<br />
Small Game<br />
Hunters . . . . . . . . .<br />
Days . . . . . . . . . . .<br />
Trips . . . . . . . . . . .<br />
Trip <strong>and</strong> equipment<br />
expenditures . . . .<br />
Source: Tables 1 <strong>and</strong> 19<br />
4.8 million<br />
52 million<br />
41 million<br />
$2.4 billion<br />
Equipment<br />
Trip-related<br />
Small Game <strong>Hunting</strong> Trip <strong>and</strong> Equipment Expenditures<br />
(Total expenditures: $2.4 billion)<br />
$1.2 billion<br />
$1.2 billion<br />
24 <strong>2006</strong> <strong>National</strong> <strong>Survey</strong> <strong>of</strong> <strong>Fishing</strong>, <strong>Hunting</strong>, <strong>and</strong> <strong>Wildlife</strong>-<strong>Associated</strong> Recreation U.S. Fish & <strong>Wildlife</strong> Service
Migratory Bird <strong>Hunting</strong><br />
In <strong>2006</strong>, 2.3 million migratory bird<br />
hunters devoted 20 million days on 16<br />
million trips for hunting birds, such as<br />
doves, ducks, <strong>and</strong> geese. Hunters averaged<br />
9 days pursuing migratory birds<br />
for the year.<br />
Migratory bird-related spending for<br />
trips <strong>and</strong> equipment was $1.3 billion in<br />
<strong>2006</strong>. Of this amount, $691 million was<br />
spent on hunting trips. An estimated<br />
$261 million or 38 percent <strong>of</strong> all trip<br />
expenditures were on food <strong>and</strong> lodging,<br />
<strong>and</strong> $266 million (38 percent) were<br />
on transportation. Other trip expenses<br />
were $165 million (24 percent) <strong>of</strong><br />
the total trip-related expenditures for<br />
migratory bird hunters.<br />
Equipment purchases for migratory<br />
bird hunting totaled $658 million in<br />
<strong>2006</strong>. Of this amount, $416 million,<br />
or 63 percent, was spent on hunting<br />
equipment (firearms, ammunition,<br />
etc.). Spending on auxiliary equipment<br />
was $68 million (10 percent) <strong>and</strong><br />
$174 million (26 percent) was spent on<br />
special equipment.<br />
<strong>Hunting</strong> Other Animals<br />
Over 1.1 million hunters reported<br />
spending 15 million days on 13 million<br />
trips pursuing other animals, such<br />
as groundhogs, raccoons, foxes, <strong>and</strong><br />
coyotes. They averaged 13 days <strong>of</strong><br />
hunting.<br />
These hunters spent $208 million in<br />
<strong>2006</strong> on trips <strong>and</strong> equipment for the<br />
pursuit <strong>of</strong> other animals. Trip-related<br />
costs totaled $143 million. Of that,<br />
food <strong>and</strong> lodging was $52 million or<br />
36 percent <strong>of</strong> all trip costs; transportation<br />
was $84 million, 59 percent <strong>of</strong> trip<br />
expenses; <strong>and</strong> other trip expenses were<br />
$7 million, 5 percent <strong>of</strong> all trip costs.<br />
Equipment expenditures for hunting<br />
other animals totaled $65 million. For<br />
the pursuit <strong>of</strong> other animals, hunters<br />
spent $51 million on hunting equipment<br />
(firearms, ammunition, etc.) <strong>and</strong><br />
$15 million on auxiliary equipment.<br />
Comparative <strong>Hunting</strong> Highlights<br />
In <strong>2006</strong>, big game hunters pursued big<br />
game an average <strong>of</strong> 15 days <strong>and</strong> 11<br />
trips. Small game hunters pursued<br />
small game an average <strong>of</strong> 11 days <strong>and</strong><br />
9 trips. Migratory bird hunters hunted<br />
migratory birds an average <strong>of</strong> 9 days<br />
<strong>and</strong> 7 trips. Individuals hunting other<br />
animals did so an average <strong>of</strong> 13 days<br />
<strong>and</strong> 11 trips.<br />
Average spending on trips <strong>and</strong> equipment<br />
was about twice as high for big<br />
game hunting than for other types<br />
<strong>of</strong> hunting. For hunting big game,<br />
participants spent an average <strong>of</strong> $1,100<br />
for the year. By comparison, spending<br />
Migratory Bird<br />
Hunters . . . . . . . .<br />
Days . . . . . . . . . .<br />
Trips . . . . . . . . . .<br />
Trip <strong>and</strong> equipment<br />
expenditures . .<br />
Source: Tables 1 <strong>and</strong> 20.<br />
2.3 million<br />
20 million<br />
16 million<br />
$1.3 billion<br />
Equipment<br />
Trip-related<br />
Migratory Bird <strong>Hunting</strong> Trip <strong>and</strong> Equipment Expenditures<br />
(Total expenditures: $1.3 billion)<br />
$0.7 billion<br />
$0.7 billion<br />
Other Animals<br />
Hunters . . . . . . . .<br />
Days . . . . . . . . . .<br />
Trips . . . . . . . . . .<br />
Trip <strong>and</strong> equipment<br />
expenditures . .<br />
Source: Tables 1 <strong>and</strong> 21.<br />
1.1 million<br />
15 million<br />
13 million<br />
$208 million<br />
Equipment<br />
Trip-related<br />
Trip <strong>and</strong> Equipment Expenditures for <strong>Hunting</strong> Other Animals<br />
(Total expenditures: $208 million)<br />
$65 million<br />
$143 million<br />
U.S. Fish & <strong>Wildlife</strong> Service <strong>2006</strong> <strong>National</strong> <strong>Survey</strong> <strong>of</strong> <strong>Fishing</strong>, <strong>Hunting</strong>, <strong>and</strong> <strong>Wildlife</strong>-<strong>Associated</strong> Recreation 25
Days per hunter<br />
Trips per hunter<br />
Comparative <strong>Hunting</strong> by Type <strong>of</strong> <strong>Hunting</strong><br />
18<br />
15<br />
11<br />
9<br />
13<br />
15<br />
11<br />
9<br />
7<br />
11<br />
Total<br />
Big game<br />
Small game<br />
Migratory birds<br />
Other animals<br />
on small game hunting by participants<br />
averaged $493, spending on migratory<br />
bird hunting by participants averaged<br />
$588, <strong>and</strong> spending on other animal<br />
hunting averaged $184.<br />
During <strong>2006</strong>, trip expenditures for all<br />
hunting averaged $534 per hunter, a<br />
daily average <strong>of</strong> $30. In pursuit <strong>of</strong> big<br />
game, hunters averaged trip expenditures<br />
<strong>of</strong> $435, which was $28 per<br />
day. Hunters spent an average <strong>of</strong> $249<br />
while seeking small game ($23 per day)<br />
<strong>and</strong> spent an average <strong>of</strong> $301 ($35 per<br />
day) while pursuing migratory birds.<br />
Hunters averaged $126 ($9 per day)<br />
while pursuing other animals.<br />
Trip expenditures<br />
per hunter<br />
Trip expenditures<br />
per day<br />
$30<br />
$28<br />
$23<br />
$35<br />
$9<br />
$126<br />
$249<br />
$301<br />
$435<br />
$534<br />
<strong>Hunting</strong> for Selected Game<br />
(In millions)<br />
Type <strong>of</strong> hunting Hunters Days<br />
Big game, total . . . . . . . . . . . . . . . . . . . . . . . . . . . 10.7 164<br />
Deer . . . . . . . . . . . . . . . . . . . . . . . . . . . . . . . . . 10.1 132<br />
Wild turkey . . . . . . . . . . . . . . . . . . . . . . . . . . . . 2.6 26<br />
Elk . . . . . . . . . . . . . . . . . . . . . . . . . . . . . . . . . . 0.8 7<br />
Bear . . . . . . . . . . . . . . . . . . . . . . . . . . . . . . . . . 0.4 3<br />
Small game, total . . . . . . . . . . . . . . . . . . . . . . . . . 4.8 52<br />
Rabbit <strong>and</strong> hare . . . . . . . . . . . . . . . . . . . . . . . . 1.9 21<br />
Squirrel . . . . . . . . . . . . . . . . . . . . . . . . . . . . . . . 1.8 19<br />
Pheasant . . . . . . . . . . . . . . . . . . . . . . . . . . . . . . 1.6 12<br />
Grouse/prairie chicken . . . . . . . . . . . . . . . . . . . 0.8 7<br />
Quail . . . . . . . . . . . . . . . . . . . . . . . . . . . . . . . . . 1.0 8<br />
Migratory birds, total . . . . . . . . . . . . . . . . . . . . . 2.3 20<br />
Doves . . . . . . . . . . . . . . . . . . . . . . . . . . . . . . . . 1.2 6<br />
Ducks . . . . . . . . . . . . . . . . . . . . . . . . . . . . . . . . 1.1 12<br />
Geese . . . . . . . . . . . . . . . . . . . . . . . . . . . . . . . . 0.7 6<br />
<strong>Hunting</strong> for Selected Game<br />
Among big game species, deer was the<br />
most popular animal pursued, attracting<br />
10.1 million hunters on 132 million<br />
days. Wild turkey attracted 2.6 million<br />
hunters on 26 million days, while elk<br />
drew 799 thous<strong>and</strong> on 7 million days,<br />
<strong>and</strong> bear 399 thous<strong>and</strong> on 3 million<br />
days. In addition, 578 thous<strong>and</strong> hunters<br />
spent 6 million days hunting other big<br />
game animals.<br />
Among small game species, rabbit was<br />
the most popular quarry with nearly 2<br />
million small game hunters pursuing<br />
rabbits on 21 million days. Squirrels<br />
were hunted by 1.8 million participants<br />
on 19 million days, <strong>and</strong> pheasants<br />
attracted 1.6 million hunters on<br />
12 million days. Quail was flushed by<br />
1.0 million hunters on 8 million days,<br />
while grouse <strong>and</strong> prairie chicken were<br />
pursued by 800 thous<strong>and</strong> hunters on 7<br />
million days. In addition, 325 thous<strong>and</strong><br />
hunters spent 4 million days hunting<br />
other small game animals.<br />
Among those hunting migratory birds,<br />
1.1 million pursued duck on 12 million<br />
days. There were 1.2 million hunters<br />
who pursued dove on 6 million days.<br />
On 6 million days, 700 thous<strong>and</strong><br />
hunters hunted geese in <strong>2006</strong>. Other<br />
migratory bird species attracted 150<br />
thous<strong>and</strong> people who hunted on 1<br />
million days.<br />
Source: Table 7.<br />
26 <strong>2006</strong> <strong>National</strong> <strong>Survey</strong> <strong>of</strong> <strong>Fishing</strong>, <strong>Hunting</strong>, <strong>and</strong> <strong>Wildlife</strong>-<strong>Associated</strong> Recreation U.S. Fish & <strong>Wildlife</strong> Service
Participation by Geographic<br />
Regions<br />
Regionally, participation rates in<br />
hunting ranged from 2 percent in the<br />
Pacific Region to 12 percent in the<br />
West North Central Region. The East<br />
North Central, East South Central, West<br />
South Central, <strong>and</strong> Mountain Regions<br />
also had participation rates above the<br />
national average <strong>of</strong> 5 percent. The<br />
participation rates in the South Atlantic<br />
<strong>and</strong> New Engl<strong>and</strong> Regions were below<br />
the national average at 4 percent <strong>and</strong><br />
3 percent, respectively. The rate in<br />
the Middle Atlantic was equal to the<br />
average at 5 percent.<br />
<strong>Hunting</strong> in State <strong>of</strong> Residence <strong>and</strong><br />
in Other States<br />
A large majority <strong>of</strong> participants, 96<br />
percent or 12.0 million, hunted within<br />
their resident state. Only 1.8 million,<br />
15 percent, hunted in another state.<br />
Percentages do not add to 100 because<br />
those who hunted both in state <strong>and</strong> out<br />
<strong>of</strong> state were included in both categories.<br />
The overall resident/nonresident division<br />
is relatively constant across all<br />
types <strong>of</strong> hunting. About 10.3 million<br />
big game hunters, 96 percent <strong>of</strong> all<br />
big game hunters, hunted within their<br />
state <strong>of</strong> residence, while 12 percent, 1.3<br />
million people, traveled to another state<br />
to hunt big game. About 4.5 million<br />
small game hunters, 93 percent <strong>of</strong> all<br />
small game hunters, pursued game in<br />
their resident state. About 625 thous<strong>and</strong>,<br />
13 percent, ventured across state<br />
lines to hunt small game. Ninety-five<br />
percent <strong>of</strong> all migratory bird hunters,<br />
2.2 million participants, hunted within<br />
their resident state. Thirteen percent<br />
or 291 thous<strong>and</strong> hunted out <strong>of</strong> state.<br />
Among sportspersons who hunted other<br />
animals, 96 percent, 1.1 million, hunted<br />
in-state <strong>and</strong> 10 percent, 112 thous<strong>and</strong><br />
participants, hunted out <strong>of</strong> state.<br />
<strong>Hunting</strong> in State <strong>of</strong> Residence<br />
<strong>and</strong> in Other States<br />
(In millions)<br />
AK<br />
<strong>Hunting</strong> Participation<br />
(<strong>National</strong> participation rate: 5%)<br />
In state<br />
Out <strong>of</strong><br />
state<br />
All hunters . . . . . . 12.0 1.8<br />
Big game . . . . . . 10.3 1.3<br />
Small game . . . . 4.5 0.6<br />
Migratory bird . . 2.2 0.3<br />
Other animal . . . 1.1 0.1<br />
Source: Table 6.<br />
Pacific<br />
2%<br />
WA<br />
OR<br />
NV<br />
CA<br />
ID<br />
AZ<br />
UT<br />
Mountain<br />
6%<br />
MT<br />
WY<br />
NM<br />
CO<br />
West North<br />
Central<br />
12%<br />
ND<br />
SD<br />
NE<br />
KS<br />
OK<br />
MN<br />
IA<br />
MO<br />
AR<br />
WI<br />
IL<br />
East<br />
North<br />
Central<br />
7%<br />
IN<br />
MI<br />
KY<br />
TN<br />
OH<br />
WV<br />
SC<br />
PA<br />
VA<br />
NC<br />
NH<br />
VT<br />
New Engl<strong>and</strong><br />
3%<br />
ME<br />
MA<br />
NY<br />
RI<br />
CT<br />
NJ<br />
DE<br />
MD<br />
DC<br />
Middle<br />
Atlantic<br />
5%<br />
HI<br />
TX<br />
West South<br />
Central<br />
7%<br />
LA<br />
MS<br />
AL<br />
East South<br />
Central<br />
8%<br />
GA<br />
FL<br />
South Atlantic<br />
4%<br />
U.S. Fish & <strong>Wildlife</strong> Service <strong>2006</strong> <strong>National</strong> <strong>Survey</strong> <strong>of</strong> <strong>Fishing</strong>, <strong>Hunting</strong>, <strong>and</strong> <strong>Wildlife</strong>-<strong>Associated</strong> Recreation 27
<strong>Hunting</strong> on Public <strong>and</strong> Private<br />
L<strong>and</strong>s<br />
In <strong>2006</strong>, 12.5 million hunters 16 years<br />
old <strong>and</strong> older hunted on public l<strong>and</strong>,<br />
private l<strong>and</strong>, or both. Of this number,<br />
4.9 million or 39 percent hunted on<br />
publicly owned l<strong>and</strong>s compared to 10.2<br />
million or 82 percent who hunted on<br />
privately owned l<strong>and</strong>. Some hunters<br />
hunted exclusively on public l<strong>and</strong> <strong>and</strong><br />
others hunted exclusively on private<br />
l<strong>and</strong>—1.9 million, 15 percent <strong>of</strong> all<br />
hunters, used public l<strong>and</strong>s only, <strong>and</strong> 7.2<br />
million hunted only on private l<strong>and</strong>, 58<br />
percent <strong>of</strong> all hunters. Slightly over 3<br />
million hunters, 24 percent, hunted on<br />
both public <strong>and</strong> private l<strong>and</strong>s.<br />
During <strong>2006</strong>, 4.9 million hunters used<br />
public l<strong>and</strong>s on 54 million days, which<br />
represents 25 percent <strong>of</strong> all hunting<br />
days. Thirty-five percent <strong>of</strong> big game<br />
hunters pursued big game on public<br />
l<strong>and</strong> for 37 million days. Thirty-five<br />
percent <strong>of</strong> all small game hunters,<br />
1.7 million, pursued small game on<br />
public l<strong>and</strong> for 13 million days. Nearly<br />
800 thous<strong>and</strong> migratory bird hunters,<br />
35 percent, hunted migratory birds<br />
on public l<strong>and</strong>s for 6 million days.<br />
Twenty-eight percent, 311 thous<strong>and</strong>,<br />
Percent <strong>of</strong> All <strong>Hunting</strong>—in State <strong>of</strong> Residence <strong>and</strong> in Other States<br />
(Total: 12.5 million participants)<br />
In state <strong>of</strong> residence<br />
<strong>and</strong> other states<br />
10%<br />
In other states only<br />
4%<br />
In state <strong>of</strong> residence only<br />
85%<br />
<strong>of</strong> other animal hunters pursued their<br />
game on public l<strong>and</strong> for 3 million days.<br />
The percent <strong>of</strong> hunters on private l<strong>and</strong><br />
differs little among different types <strong>of</strong><br />
hunting. Eighty percent <strong>of</strong> big game<br />
hunters hunted on private l<strong>and</strong>, which<br />
compares to 79 percent seeking small<br />
game, 76 percent seeking migratory<br />
birds, <strong>and</strong> 82 percent seeking other<br />
animals.<br />
Of all days hunting, 75 percent or 164<br />
million were on private l<strong>and</strong>. The<br />
percent <strong>of</strong> hunting days on private l<strong>and</strong><br />
varied more among types <strong>of</strong> hunting<br />
than the percent <strong>of</strong> hunters. Seventythree<br />
percent <strong>of</strong> big game <strong>and</strong> small<br />
game hunting days, 68 percent <strong>of</strong><br />
migratory bird days, <strong>and</strong> 81 percent<br />
<strong>of</strong> other animal days were on private<br />
l<strong>and</strong>. Total hunting days pursuing these<br />
species on private l<strong>and</strong> were as follows:<br />
big game, 120 million; small game, 38<br />
million; migratory birds, 13 million;<br />
<strong>and</strong> other animals, 12 million.<br />
People <strong>Hunting</strong> on Public <strong>and</strong> Private L<strong>and</strong>s<br />
Undetermined<br />
0.4 million<br />
Public <strong>and</strong> private<br />
3.0 million<br />
Private only<br />
7.2 million<br />
Public only<br />
1.9 million<br />
28 <strong>2006</strong> <strong>National</strong> <strong>Survey</strong> <strong>of</strong> <strong>Fishing</strong>, <strong>Hunting</strong>, <strong>and</strong> <strong>Wildlife</strong>-<strong>Associated</strong> Recreation U.S. Fish & <strong>Wildlife</strong> Service
Sex <strong>and</strong> Age <strong>of</strong> Hunters<br />
Of the U.S. population 16 years old<br />
<strong>and</strong> older, 10 percent <strong>of</strong> males <strong>and</strong> 1<br />
percent <strong>of</strong> females enjoyed hunting in<br />
<strong>2006</strong>. Of the 12.5 million participants<br />
who hunted, 91 percent (11.4 million)<br />
were male <strong>and</strong> 9 percent (1.2 million)<br />
were female.<br />
Percent <strong>of</strong> Males <strong>and</strong> Females Who Hunted in the United States<br />
Males 10%<br />
Females 1%<br />
The participation rate in hunting tended<br />
to increase with age until individuals<br />
reached 35 to 44 years <strong>of</strong> age, <strong>and</strong><br />
thereafter it declined. During <strong>2006</strong>, 6<br />
percent or 501 thous<strong>and</strong> 16- <strong>and</strong> 17-<br />
year-olds hunted. The participation rate<br />
climbed from 4 percent <strong>of</strong> individuals<br />
18 to 24 years old to 7 percent <strong>of</strong> those<br />
35 to 44. After age 44 the rate declined<br />
to 6 percent <strong>of</strong> those 45 to 64 <strong>and</strong> 3<br />
percent <strong>of</strong> those 65 <strong>and</strong> over.<br />
Females<br />
9%<br />
Percent <strong>of</strong> Hunters by Sex<br />
Males<br />
91%<br />
The majority <strong>of</strong> hunters were 35 to 44<br />
years old. An estimated 3.1 million<br />
hunters, which was 25 percent <strong>of</strong><br />
all hunters, were 35 to 44 years old.<br />
Individuals aged 45 to 54 were close in<br />
total number <strong>of</strong> hunters at 2.9 million.<br />
Hunters by Sex <strong>and</strong> Age<br />
Total, both sexes . . 12.5 million<br />
Male . . . . . . . . . . 11.4 million<br />
Female . . . . . . . . 1.2 million<br />
Total, all ages . . . . . 12.5 million<br />
16 <strong>and</strong> 17 . . . . . . 0.5 million<br />
18 to 24 . . . . . . . . 1.0 million<br />
25 to 34 . . . . . . . . 2.1 million<br />
35 to 44 . . . . . . . . 3.1 million<br />
45 to 54 . . . . . . . . 2.9 million<br />
55 to 64 . . . . . . . . 1.9 million<br />
65 <strong>and</strong> older . . . . 1.2 million<br />
Source: Table 10.<br />
16 <strong>and</strong> 17<br />
4%<br />
18 to 24<br />
8%<br />
25 to 34<br />
16%<br />
35 to 44<br />
25%<br />
Percent <strong>of</strong> Hunters by Age<br />
65 <strong>and</strong> older<br />
9%<br />
55 to 64<br />
15%<br />
45 to 54<br />
23%<br />
Percent <strong>of</strong> U.S. Population Who Hunted by Age<br />
16 <strong>and</strong> 17 6%<br />
18 to 24<br />
4%<br />
25 to 34<br />
5%<br />
35 to 44<br />
7%<br />
45 to 54<br />
55 to 64<br />
6%<br />
6%<br />
65 <strong>and</strong> older<br />
3%<br />
U.S. Fish & <strong>Wildlife</strong> Service <strong>2006</strong> <strong>National</strong> <strong>Survey</strong> <strong>of</strong> <strong>Fishing</strong>, <strong>Hunting</strong>, <strong>and</strong> <strong>Wildlife</strong>-<strong>Associated</strong> Recreation 29
Large MSA<br />
28%<br />
Medium MSA<br />
17%<br />
Percent <strong>of</strong> Hunters by Residence<br />
Outside MSA<br />
38%<br />
Small MSA<br />
17%<br />
Metropolitan <strong>and</strong> Nonmetropolitan<br />
Hunters<br />
As was the case for fishing, participation<br />
rates for hunting were the lowest<br />
among residents <strong>of</strong> the largest metropolitan<br />
statistical areas (MSAs) 1 <strong>and</strong><br />
were the highest among non-MSA<br />
residents. Residents <strong>of</strong> MSAs with a<br />
population <strong>of</strong> 1 million or more hunted<br />
at a 3 percent rate, which compares to<br />
12 percent <strong>of</strong> those who resided outside<br />
MSAs. Furthermore, the smaller the<br />
MSA the higher was the participation<br />
rate. The rate among residents <strong>of</strong><br />
MSAs <strong>of</strong> 249,999 or less was 9 percent<br />
<strong>and</strong> among residents <strong>of</strong> MSAs with<br />
250,000 to 999,999 inhabitants, the rate<br />
was 5 percent.<br />
Percent <strong>of</strong> U.S. Population Who Hunted by Residence<br />
(Total U.S. population that hunted: 5%)<br />
Large MSA<br />
(1,000,000 or more)<br />
Medium MSA<br />
(250,000 to 999,999)<br />
3%<br />
5%<br />
Despite the lower participation rates<br />
among MSA residents, they still made<br />
up the majority <strong>of</strong> hunters. Sixty-two<br />
percent <strong>of</strong> hunters were MSA residents,<br />
28 percent were from the largest MSAs,<br />
<strong>and</strong> 34 percent were from smaller to<br />
mid-sized MSAs.<br />
Small MSA<br />
(249,999 or less)<br />
Outside MSA<br />
Percent <strong>of</strong> U.S. Population Who Hunted by Household Income<br />
Less than $10,000<br />
$10,000 to $19,999<br />
$20,000 to $24,999<br />
$25,000 to $29,999<br />
2%<br />
4%<br />
4%<br />
5%<br />
9%<br />
12%<br />
Household Income <strong>of</strong> Hunters<br />
The participation rate in hunting<br />
tended to increase as household income<br />
increased. Participation rates for those<br />
who reported incomes <strong>of</strong> $50,000 to<br />
$99,000 were the highest at 8 percent.<br />
Those with incomes <strong>of</strong> $40,000 to<br />
$49,999 <strong>and</strong> $100,000 or more had a<br />
slightly lower rate at 7 percent. Those<br />
with incomes <strong>of</strong> $35,000 to $39,999<br />
also had a participation rate <strong>of</strong> 7<br />
percent, <strong>and</strong> it declined to 5 percent<br />
among those with incomes $25,000 to<br />
$29,999, 4 percent among those with<br />
incomes $10,000 to $24,999, <strong>and</strong> 2<br />
percent among those with incomes <strong>of</strong><br />
under $10,000.<br />
$30,000 to $34,999<br />
$35,000 to $39,999<br />
$40,000 to $49,999<br />
$50,000 to $74,999<br />
$75,000 to $99,999<br />
6%<br />
7%<br />
7%<br />
8%<br />
8%<br />
The majority <strong>of</strong> hunters had household<br />
incomes <strong>of</strong> $50,000 or more.<br />
Among hunters who reported income,<br />
59 percent had household incomes<br />
<strong>of</strong> $50,000 or more <strong>and</strong> 41 percent<br />
had household incomes <strong>of</strong> less than<br />
$50,000. <strong>Fishing</strong> had the exact same<br />
percentages <strong>of</strong> participants with over<br />
<strong>and</strong> under $50,000 in household<br />
income.<br />
$100,000 or more<br />
7%<br />
1<br />
See Appendix A for definition <strong>of</strong> MSA.<br />
30 <strong>2006</strong> <strong>National</strong> <strong>Survey</strong> <strong>of</strong> <strong>Fishing</strong>, <strong>Hunting</strong>, <strong>and</strong> <strong>Wildlife</strong>-<strong>Associated</strong> Recreation U.S. Fish & <strong>Wildlife</strong> Service
Education <strong>and</strong> Race <strong>of</strong> Hunters<br />
Participation rates were highest among<br />
those with 12 years <strong>of</strong> education <strong>and</strong><br />
those with 1 to 3 years <strong>of</strong> college.<br />
Those with 11 years <strong>of</strong> education or<br />
less had a slightly lower participation<br />
rate at 5 percent, <strong>and</strong> those with 4 years<br />
<strong>of</strong> college or more participated at a 4<br />
percent rate.<br />
The largest category <strong>of</strong> education<br />
was 12 years, which accounted for 39<br />
percent <strong>of</strong> the hunting population. This<br />
was followed by those with 1 to 3 years<br />
<strong>of</strong> college at 26 percent. Those with<br />
11 years or less <strong>of</strong> education <strong>and</strong> those<br />
with 4 years <strong>of</strong> college each composed<br />
14 percent <strong>of</strong> hunters. Individuals with<br />
5 years or more <strong>of</strong> college made up 7<br />
percent <strong>of</strong> all hunters.<br />
While people <strong>of</strong> all races participate in<br />
hunting, the majority are White. Six<br />
percent <strong>of</strong> the nation’s White population,<br />
1 percent <strong>of</strong> the Black population,<br />
6 percent <strong>of</strong> those identified as other<br />
races, <strong>and</strong> less than 0.5 percent <strong>of</strong> the<br />
Asian population went hunting in <strong>2006</strong>.<br />
Hunters by Education, Race,<br />
<strong>and</strong> Ethnicity<br />
(In millions)<br />
Total hunters . . . . . . . . . . . 12.5<br />
11 years or less<br />
14%<br />
12 years<br />
1 to 3 years <strong>of</strong> college<br />
4 years <strong>of</strong> college<br />
5 years or more<br />
<strong>of</strong> college<br />
12 years<br />
39%<br />
Other 2%<br />
Black 2%<br />
Percent <strong>of</strong> Hunters by Education<br />
Percent <strong>of</strong> Hunters by Race<br />
5 years or more <strong>of</strong> college<br />
7%<br />
4 years <strong>of</strong> college<br />
14%<br />
1 to 3 years <strong>of</strong> college<br />
26%<br />
Percent <strong>of</strong> U.S. Population Who Hunted by Education<br />
11 years or less 5%<br />
4%<br />
4%<br />
White 96%<br />
6%<br />
6%<br />
Education<br />
11 years or less . . . . . . . . 1.7<br />
12 years . . . . . . . . . . . . . 4.9<br />
1 to 3 years <strong>of</strong> college . . 3.2<br />
4 years <strong>of</strong> college . . . . . . 1.8<br />
5 years or more <strong>of</strong> college 0.9<br />
Percent <strong>of</strong> U.S. Population Who Hunted by Race<br />
Race<br />
White . . . . . . . . . . . . . . . 12.0<br />
Black . . . . . . . . . . . . . . . 0.2<br />
Other . . . . . . . . . . . . . . . . 0.2<br />
Asian . . . . . . . . . . . . . . . 0.1<br />
White<br />
Black<br />
1%<br />
6%<br />
Ethnicity<br />
Hispanic . . . . . . . . . . . . . 0.4<br />
Non-Hispanic . . . . . . . . . 12.1<br />
Source: Table 10.<br />
Other<br />
Percent <strong>of</strong> U.S. Population Who Hunted by Ethnicity<br />
6%<br />
Non-Hispanic 6%<br />
Hispanic<br />
1%<br />
U.S. Fish & <strong>Wildlife</strong> Service <strong>2006</strong> <strong>National</strong> <strong>Survey</strong> <strong>of</strong> <strong>Fishing</strong>, <strong>Hunting</strong>, <strong>and</strong> <strong>Wildlife</strong>-<strong>Associated</strong> Recreation 31
1996–<strong>2006</strong> Comparison <strong>of</strong> <strong>Hunting</strong><br />
Activity<br />
The overall number <strong>of</strong> hunters in the<br />
United States declined from 1996 to<br />
<strong>2006</strong>, but the latest results for <strong>2006</strong><br />
indicate that the sharp downturn<br />
experienced in the 1990s may be<br />
abating. The downturn from 1996<br />
to 2001 was 7 percent, a statistically<br />
significant change. The downturn from<br />
2001 to <strong>2006</strong> was 4 percent <strong>and</strong> is not<br />
sig nificant.<br />
All types <strong>of</strong> hunting had significant<br />
declines in participation from 1996<br />
to <strong>2006</strong>; however, only some types<br />
had significant declines from 2001 to<br />
<strong>2006</strong>. Big game hunting has remained<br />
relatively stable over time. The decline<br />
<strong>of</strong> 2 percent from 2001 to <strong>2006</strong>, is<br />
not significant. However, some types<br />
<strong>of</strong> hunting have not remained stable.<br />
From 2001 to <strong>2006</strong>, the decline <strong>of</strong> 12<br />
percent for small game hunting <strong>and</strong> 22<br />
percent for migratory bird hunting are<br />
both significant.<br />
Among the different types <strong>of</strong> hunting,<br />
the trend in hunting days was similar<br />
to that <strong>of</strong> total participants. There was<br />
a 14 percent decline in the number <strong>of</strong><br />
hunting days for all types <strong>of</strong> hunting<br />
from 1996 to <strong>2006</strong> <strong>and</strong> a decline <strong>of</strong><br />
4 percent from 2001 to <strong>2006</strong>. The<br />
decline from 2001 to <strong>2006</strong> is not<br />
significant. Big game hunting days<br />
actually went up 7 percent from 2001<br />
to <strong>2006</strong>. Over the same period, small<br />
game hunting days declined 13 percent<br />
<strong>and</strong> migratory bird hunting declined 33<br />
percent.<br />
The trend in hunting expenditures is<br />
similar to that <strong>of</strong> total participants.<br />
While the number <strong>of</strong> hunters declined<br />
10 percent from 1996 to <strong>2006</strong>, huntingrelated<br />
expenditures declined 14<br />
percent. Additionally, from 2001 to<br />
<strong>2006</strong> the number <strong>of</strong> hunters declined 4<br />
percent (not significant), <strong>and</strong> huntingrelated<br />
expenditures declined 2 percent<br />
(not significant).<br />
No expenditure categories experienced<br />
notable changes from 2001 to <strong>2006</strong>.<br />
The stability <strong>of</strong> hunting expenditures<br />
across the board from 2001 to <strong>2006</strong> is<br />
noteworthy.<br />
Number <strong>of</strong> Hunters<br />
(Millions)<br />
Days <strong>of</strong> <strong>Hunting</strong><br />
(Millions)<br />
<strong>Hunting</strong> Expenditures<br />
(Billions <strong>of</strong> <strong>2006</strong> dollars)<br />
26.5<br />
14.0<br />
13.0<br />
12.5<br />
256.7<br />
228.4<br />
219.9<br />
23.5<br />
22.9<br />
1996<br />
2001<br />
<strong>2006</strong><br />
1996<br />
2001<br />
<strong>2006</strong><br />
1996<br />
2001<br />
<strong>2006</strong><br />
32 <strong>2006</strong> <strong>National</strong> <strong>Survey</strong> <strong>of</strong> <strong>Fishing</strong>, <strong>Hunting</strong>, <strong>and</strong> <strong>Wildlife</strong>-<strong>Associated</strong> Recreation U.S. Fish & <strong>Wildlife</strong> Service
1996–<strong>2006</strong> <strong>Hunting</strong> Participants, Days, <strong>and</strong> Expenditures<br />
(U.S. population 16 years old <strong>and</strong> older. Numbers in thous<strong>and</strong>s)<br />
1996 <strong>2006</strong> 1996–<strong>2006</strong><br />
Number Percent Number Percent percent change<br />
Hunters, total . . . . . . . . . . . . . . . . . . . . 13,975 100 12,510 100 –10<br />
Big game . . . . . . . . . . . . . . . . . . . . . 11,288 81 10,682 85 –5*<br />
Small game . . . . . . . . . . . . . . . . . . . . 6,945 50 4,797 38 –31<br />
Migratory bird . . . . . . . . . . . . . . . . . 3,073 22 2,293 18 –25<br />
Other animal . . . . . . . . . . . . . . . . . . . 1,521 11 1,128 9 –26<br />
Days, total . . . . . . . . . . . . . . . . . . . . . . 256,676 100 219,925 100 –14<br />
Big game . . . . . . . . . . . . . . . . . . . . . 153,784 60 164,061 75 7 *<br />
Small game . . . . . . . . . . . . . . . . . . . . 75,117 29 52,395 24 –30<br />
Migratory bird . . . . . . . . . . . . . . . . . 26,501 10 19,770 9 –25<br />
Other animal . . . . . . . . . . . . . . . . . . . 24,522 10 15,205 7 –38<br />
<strong>Hunting</strong>, total (<strong>2006</strong> dollars) . . . . . . . $26,486,173 100 $22,893,156 100 –14*<br />
Trip-related . . . . . . . . . . . . . . . . . . . . 6,624,069 25 6,678,614 29 1 *<br />
Equipment . . . . . . . . . . . . . . . . . . . . 14,484,381 55 10,731,501 47 –26<br />
<strong>Hunting</strong> equipment . . . . . . . . . . . 7,091,539 27 5,366,357 23 –24<br />
Auxiliary equipment . . . . . . . . . . 1,584,433 6 1,330,216 6 –16*<br />
Special equipment . . . . . . . . . . . . 5,808,408 22 4,034,928 18 –31*<br />
Other . . . . . . . . . . . . . . . . . . . . . . . . 5,377,723 20 5,483,041 24 2 *<br />
* Not different from zero at the 5 percent level <strong>of</strong> significance.<br />
2001–<strong>2006</strong> <strong>Hunting</strong> Participants, Days, <strong>and</strong> Expenditures<br />
(U.S. population 16 years old <strong>and</strong> older. Numbers in thous<strong>and</strong>s)<br />
2001 <strong>2006</strong> 2001–<strong>2006</strong><br />
Number Percent Number Percent percent change<br />
Hunters, total . . . . . . . . . . . . . . . . . . . . 13,034 100 12,510 100 –4*<br />
Big game . . . . . . . . . . . . . . . . . . . . . 10,911 84 10,682 85 –2*<br />
Small game . . . . . . . . . . . . . . . . . . . . 5,434 42 4,797 38 –12<br />
Migratory bird . . . . . . . . . . . . . . . . . 2,956 23 2,293 18 –22<br />
Other animal . . . . . . . . . . . . . . . . . . . 1,047 8 1,128 9 8 *<br />
Days, total . . . . . . . . . . . . . . . . . . . . . . 228,368 100 219,925 100 –4*<br />
Big game . . . . . . . . . . . . . . . . . . . . . 153,191 67 164,061 75 7 *<br />
Small game . . . . . . . . . . . . . . . . . . . . 60,142 26 52,395 24 –13*<br />
Migratory bird . . . . . . . . . . . . . . . . . 29,310 13 19,770 9 –33<br />
Other animal . . . . . . . . . . . . . . . . . . . 19,207 8 15,205 7 –21*<br />
<strong>Hunting</strong>, total (<strong>2006</strong> dollars) . . . . . . . $23,461,530 100 $22,893,156 100 –2*<br />
Trip-related . . . . . . . . . . . . . . . . . . . . 5,978,797 25 6,678,614 29 12 *<br />
Equipment . . . . . . . . . . . . . . . . . . . . 11,794,490 50 10,731,501 47 –9*<br />
<strong>Hunting</strong> equipment . . . . . . . . . . . 5,192,593 22 5,366,357 23 3 *<br />
Auxiliary equipment . . . . . . . . . . 1,369,198 6 1,330,216 6 –3*<br />
Special equipment . . . . . . . . . . . . 5,232,699 22 4,034,928 18 –23*<br />
Other . . . . . . . . . . . . . . . . . . . . . . . . 5,688,242 24 5,483,041 24 –4*<br />
* Not different from zero at the 5 percent level <strong>of</strong> significance.<br />
U.S. Fish & <strong>Wildlife</strong> Service <strong>2006</strong> <strong>National</strong> <strong>Survey</strong> <strong>of</strong> <strong>Fishing</strong>, <strong>Hunting</strong>, <strong>and</strong> <strong>Wildlife</strong>-<strong>Associated</strong> Recreation 33
<strong>Wildlife</strong> Watching
<strong>Wildlife</strong>-Watching Highlights<br />
Nearly a third <strong>of</strong> the U.S. population<br />
enjoyed wildlife watching in <strong>2006</strong>.<br />
<strong>Wildlife</strong> watching is defined here as<br />
closely observing, feeding, <strong>and</strong> photographing<br />
wildlife, visiting public parks<br />
around the home because <strong>of</strong> wildlife,<br />
<strong>and</strong> maintaining plantings <strong>and</strong> natural<br />
areas around the home for the benefit<br />
<strong>of</strong> wildlife. These activities are categorized<br />
as around the home (within a mile<br />
<strong>of</strong> home) or away from home (at least<br />
one mile from home).<br />
The <strong>2006</strong> <strong>Survey</strong> counts as wildlifewatching,<br />
recreational activities in<br />
which the primary objective was to<br />
watch wildlife, as defined above.<br />
Secondary or incidental participation,<br />
such as observing wildlife while doing<br />
something else, was not included in the<br />
<strong>Survey</strong>.<br />
During <strong>2006</strong>, 71 million U.S. residents,<br />
31 percent <strong>of</strong> the U.S. population 16<br />
years old <strong>and</strong> older, participated in<br />
wildlife-watching activities. People<br />
who took an interest in wildlife around<br />
their homes numbered 68 million,<br />
while those who took trips away from<br />
their homes to wildlife watch numbered<br />
23 million people.<br />
Wild Bird Observers<br />
Of all the wildlife in the United States,<br />
birds attracted the biggest following.<br />
Approximately 47.7 million people<br />
observed birds around the home <strong>and</strong><br />
on trips in <strong>2006</strong>. A large majority,<br />
88 percent (41.8 million), observed<br />
wild birds around the home, while 42<br />
percent, 19.9 million, took trips away<br />
from home to observe wild birds.<br />
Participants averaged a startling 115<br />
days <strong>of</strong> birding in <strong>2006</strong>, due to the<br />
124 days <strong>of</strong> around-the-home birders.<br />
Away-from-home birders averaged 14<br />
days.<br />
<strong>Wildlife</strong>-Watching Participants<br />
by Activity<br />
(In millions)<br />
Total wildlife-watching<br />
participants . . . . . . . . . . 71.1<br />
Away from home . . . . . . . 23.0<br />
Observers . . . . . . . . . . . 21.5<br />
Photographers . . . . . . . . 11.7<br />
Feeders . . . . . . . . . . . . . 7.1<br />
Around the home . . . . . . . 67.8<br />
Feeders . . . . . . . . . . . . . 55.5<br />
Observers . . . . . . . . . . . 44.5<br />
Photographers . . . . . . . . 18.8<br />
Maintainers <strong>of</strong> plantings<br />
or natural areas . . . . . . 14.5<br />
Visitors <strong>of</strong> public parks<br />
or areas . . . . . . . . . . . . 13.3<br />
Source: Table 39.<br />
<strong>Wildlife</strong>-Watching Participants<br />
(In millions)<br />
Total 71.1<br />
Around the home<br />
67.8<br />
Away from home<br />
23.0<br />
36 <strong>2006</strong> <strong>National</strong> <strong>Survey</strong> <strong>of</strong> <strong>Fishing</strong>, <strong>Hunting</strong>, <strong>and</strong> <strong>Wildlife</strong>-<strong>Associated</strong> Recreation U.S. Fish & <strong>Wildlife</strong> Service
<strong>Wildlife</strong>-Watching Expenditures<br />
Thirty-seven percent <strong>of</strong> all the dollars<br />
spent in <strong>2006</strong> for all wildlife-related<br />
recreation was due to wildlife watching.<br />
<strong>Wildlife</strong>-watching participants 16 years<br />
old <strong>and</strong> older spent $45.7 billion, an<br />
average <strong>of</strong> $816 per spender. Seventynine<br />
percent <strong>of</strong> all wildlife watchers<br />
spent money on their avocation.<br />
<strong>Wildlife</strong> watchers spent $12.9 billion<br />
on trips pursuing their activities. Food<br />
<strong>and</strong> lodging accounted for $7.5 billion<br />
(58 percent <strong>of</strong> all trip-related expenditures),<br />
transportation expenses totaled<br />
$4.5 billion (35 percent), <strong>and</strong> other trip<br />
costs, such as l<strong>and</strong> use fees <strong>and</strong> equipment<br />
rental, amounted to $903 million<br />
(7 percent) for the year.<br />
These recreationists purchased $23.2<br />
billion worth <strong>of</strong> equipment for wildlife<br />
watching. They spent $9.9 billion<br />
(43 percent <strong>of</strong> all equipment expenditures)<br />
on wildlife-watching equipment<br />
including binoculars, cameras, bird<br />
food, <strong>and</strong> special clothing. Expenditures<br />
for auxiliary equipment, such<br />
as tents <strong>and</strong> backpacking equipment,<br />
totaled $1.0 billion (4 percent) for the<br />
year. Participants spent $12.3 billion<br />
(53 percent) on special equipment,<br />
including <strong>of</strong>f-road vehicles, campers,<br />
<strong>and</strong> boats.<br />
Also for the year, wildlife watchers<br />
spent $6.6 billion on l<strong>and</strong> leasing <strong>and</strong><br />
owning; $1.6 billion on plantings for<br />
the benefit <strong>of</strong> wildlife; $1.1 billion on<br />
membership dues <strong>and</strong> contributions;<br />
<strong>and</strong> $360 million on magazines <strong>and</strong><br />
books.<br />
Total <strong>Wildlife</strong>-Watching Expenditures<br />
Total wildlife-watching expenditures . . . . . . . . . . . . . . . $45.7 billion<br />
Total trip-related . . . . . . . . . . . . . . . . . . . . . . . . . . . . . . . . $12.9 billion<br />
Food <strong>and</strong> lodging . . . . . . . . . . . . . . . . . . . . . . . . . . . . . . 7.5 billion<br />
Transportation . . . . . . . . . . . . . . . . . . . . . . . . . . . . . . . . 4.5 billion<br />
Other trip costs . . . . . . . . . . . . . . . . . . . . . . . . . . . . . . . . 0.9 billion<br />
Total equipment expenditures . . . . . . . . . . . . . . . . . . . . . $23.2 billion<br />
<strong>Wildlife</strong>-watching equipment . . . . . . . . . . . . . . . . . . . . . 9.9 billion<br />
Auxiliary equipment. . . . . . . . . . . . . . . . . . . . . . . . . . . . 1.0 billion<br />
Special equipment . . . . . . . . . . . . . . . . . . . . . . . . . . . . . 12.3 billion<br />
Total other expenditures . . . . . . . . . . . . . . . . . . . . . . . . . .<br />
L<strong>and</strong> leasing <strong>and</strong> owning . . . . . . . . . . . . . . . . . . . . . . . .<br />
Plantings . . . . . . . . . . . . . . . . . . . . . . . . . . . . . . . . . . . . .<br />
Membership dues <strong>and</strong> contributions . . . . . . . . . . . . . . .<br />
Magazines, books . . . . . . . . . . . . . . . . . . . . . . . . . . . . . .<br />
Source: Table 44.<br />
Equipment<br />
$23.2 billion<br />
51%<br />
<strong>Wildlife</strong>-Watching Expenditures<br />
(Total expenditures: $45.7 billion)<br />
Trip-Related Expenditures<br />
(Total expenditures: $12.9 billion)<br />
Other<br />
$9.6 billion<br />
21%<br />
Trip-related<br />
$12.9 billion<br />
28%<br />
$9.6 billion<br />
6.6 billion<br />
1.6 billion<br />
1.1 billion<br />
0.4 billion<br />
Other trip-related costs<br />
$0.9 billion<br />
7%<br />
Lodging<br />
$3.2 billion<br />
25%<br />
Transportation<br />
$4.5 billion<br />
35%<br />
Food<br />
$4.3 billion<br />
33%<br />
U.S. Fish & <strong>Wildlife</strong> Service <strong>2006</strong> <strong>National</strong> <strong>Survey</strong> <strong>of</strong> <strong>Fishing</strong>, <strong>Hunting</strong>, <strong>and</strong> <strong>Wildlife</strong>-<strong>Associated</strong> Recreation 37
Around-The-Home <strong>Wildlife</strong>-<br />
Watching Highlights<br />
In <strong>2006</strong> around-the-home participants<br />
16 years old <strong>and</strong> older numbered 67.8<br />
million—95 percent <strong>of</strong> all wildlifewatching<br />
recreationists. The most<br />
popular activity, feeding birds <strong>and</strong> other<br />
wildlife, accounted for 55.5 million<br />
wildlife watchers, 82 percent <strong>of</strong> all<br />
around-the-home participants. About<br />
44.5 million people observed wildlife,<br />
representing 66 percent <strong>of</strong> all aroundthe-home<br />
participants.<br />
79%<br />
Percent <strong>of</strong> Total Around-The-Home Participants by Activity<br />
(Total: 67.8 million participants)<br />
66%<br />
Approximately 18.8 million recreationists<br />
(28 percent <strong>of</strong> all around-the-home<br />
wildlife watchers) photographed<br />
wildlife. About 14.5 million maintained<br />
plantings or natural areas for the benefit<br />
<strong>of</strong> wildlife. They made up 21 percent<br />
<strong>of</strong> all around-the-home participants.<br />
Finally, 13.3 million people visited<br />
public areas within a mile <strong>of</strong> their<br />
homes for wildlife watching. They<br />
comprised 20 percent <strong>of</strong> all around-thehome<br />
participants.<br />
Feed<br />
wild<br />
birds<br />
Observe<br />
28%<br />
Feed<br />
other<br />
wildlife<br />
28%<br />
Photograph<br />
20%<br />
Visit<br />
public<br />
areas<br />
15%<br />
Maintain<br />
natural<br />
areas<br />
14%<br />
Maintain<br />
plantings<br />
Around-The-Home Participants<br />
(In millions)<br />
Total participants . . . . . . . 67.8<br />
Feed wild birds . . . . . . . . 53.4<br />
Observe wildlife . . . . . . . 44.5<br />
Feed other wildlife . . . . . 19.2<br />
Photograph wildlife . . . . 18.8<br />
Visit public areas . . . . . . 13.3<br />
Maintain natural areas . . 10.2<br />
Maintain plantings . . . . . 9.6<br />
Source: Table 41.<br />
38 <strong>2006</strong> <strong>National</strong> <strong>Survey</strong> <strong>of</strong> <strong>Fishing</strong>, <strong>Hunting</strong>, <strong>and</strong> <strong>Wildlife</strong>-<strong>Associated</strong> Recreation U.S. Fish & <strong>Wildlife</strong> Service
<strong>Wildlife</strong> Fed, Observed, or<br />
Photographed by Around-The-Home<br />
Participants<br />
Of the 55.5 million people feeding<br />
wildlife around their homes in <strong>2006</strong>,<br />
96 percent (53.4 million) fed wild birds<br />
while 35 percent (19.2 million) fed<br />
other wildlife.<br />
Approximately 44.5 million participants<br />
closely observed wildlife around<br />
their homes, <strong>of</strong> which 41.8 million<br />
observed birds. Observing mammals<br />
was undertaken by 36.6 million participants.<br />
Insects <strong>and</strong> spiders attracted<br />
the attention <strong>of</strong> 16.0 million people;<br />
12.8 million observed amphibians<br />
or reptiles; <strong>and</strong> 9.1 million people<br />
observed fish or other wildlife. The<br />
median days <strong>of</strong> around-the-home observation<br />
for all animals was a little over<br />
80 days in <strong>2006</strong>.<br />
About 18.8 million people photographed<br />
wildlife around their homes.<br />
The median number <strong>of</strong> days people<br />
took pictures <strong>of</strong> wildlife around their<br />
homes in <strong>2006</strong> was 5 days, although<br />
2.9 million people (15 percent) photographed<br />
wildlife 21 days or more.<br />
Insects <strong>and</strong><br />
spiders<br />
Reptiles <strong>and</strong><br />
amphibians<br />
Fish <strong>and</strong><br />
other wildlife<br />
Percent <strong>of</strong> Around-The-Home Observers<br />
by Type <strong>of</strong> <strong>Wildlife</strong> Observed<br />
(Total wildlife observers: 44.5 million)<br />
Birds 94%<br />
Mammals<br />
Percent <strong>of</strong> Around-The-Home Photographers<br />
by Days Spent Photographing <strong>Wildlife</strong><br />
(Total wildlife photographers: 18.8 million)<br />
1 day<br />
14%<br />
2 to 3 days<br />
29%<br />
20%<br />
29%<br />
36%<br />
21 days or more<br />
15%<br />
11 to 20 days<br />
11%<br />
6 to 10 days<br />
15%<br />
82%<br />
Around-The-Home <strong>Wildlife</strong><br />
Watchers by Geographic Region<br />
In <strong>2006</strong>, 229 million people 16 years<br />
old <strong>and</strong> older lived in the United States.<br />
Of those, 30 percent wildlife watched<br />
around their homes. The participation<br />
rates <strong>of</strong> these around-the-home participants<br />
varied by region.<br />
AK<br />
4 to 5 days<br />
13%<br />
Around-The-Home <strong>Wildlife</strong>-Watching Participation<br />
(<strong>National</strong> participation rate: 30%)<br />
The percentages <strong>of</strong> regional populations<br />
that wildlife watched around<br />
their homes ranged from 24 percent<br />
in the Pacific Region to 42 percent in<br />
the West North Central Region. The<br />
New Engl<strong>and</strong>, East North Central, West<br />
North Central, <strong>and</strong> East South Central<br />
Regions had participation rates above<br />
the national average <strong>of</strong> 30 percent.<br />
Pacific<br />
24%<br />
WA<br />
OR<br />
NV<br />
CA<br />
ID<br />
AZ<br />
UT<br />
Mountain<br />
29%<br />
MT<br />
WY<br />
NM<br />
CO<br />
West North<br />
Central<br />
42%<br />
ND<br />
SD<br />
NE<br />
KS<br />
OK<br />
MN<br />
IA<br />
MO<br />
AR<br />
WI<br />
IL<br />
East<br />
North<br />
Central<br />
33%<br />
IN<br />
MI<br />
KY<br />
TN<br />
OH<br />
WV<br />
SC<br />
PA<br />
VA<br />
NC<br />
NY<br />
New Engl<strong>and</strong><br />
38%<br />
NH<br />
VT<br />
ME<br />
MA<br />
RI<br />
CT<br />
NJ<br />
DE<br />
MD<br />
DC<br />
Middle<br />
Atlantic<br />
27%<br />
HI<br />
TX<br />
West South<br />
Central<br />
25%<br />
LA<br />
MS<br />
AL<br />
East South<br />
Central<br />
34%<br />
GA<br />
FL<br />
South Atlantic<br />
28%<br />
U.S. Fish & <strong>Wildlife</strong> Service <strong>2006</strong> <strong>National</strong> <strong>Survey</strong> <strong>of</strong> <strong>Fishing</strong>, <strong>Hunting</strong>, <strong>and</strong> <strong>Wildlife</strong>-<strong>Associated</strong> Recreation 39
Percent <strong>of</strong> U.S. Males <strong>and</strong> Females Who Participated<br />
Males 29%<br />
Females<br />
Percent <strong>of</strong> Around-The-Home <strong>Wildlife</strong> Watchers by Sex<br />
(Total participants: 67.8 million)<br />
Females<br />
54%<br />
Males<br />
46%<br />
31%<br />
Sex <strong>and</strong> Age <strong>of</strong> Around-The-Home<br />
<strong>Wildlife</strong> Watchers<br />
Females <strong>and</strong> males had similar participation<br />
rates for around-the-home<br />
wildlife watching. In <strong>2006</strong>, 31 percent<br />
<strong>of</strong> females <strong>and</strong> 29 percent <strong>of</strong> males<br />
enjoyed around-the-home activities.<br />
Of the 67.8 million around-the-home<br />
wildlife watchers, 54 percent (36.3<br />
million) were females <strong>and</strong> 46 percent<br />
(31.5 million) were males.<br />
People in the 55-to-64-year-old age<br />
group were most likely to participate<br />
at 40 percent (13.0 million). People<br />
in the 18-to-24-year-old age group<br />
were least likely to participate, with 13<br />
percent (3.0 million). The disparity in<br />
participation rates between people 16<br />
to 34 years old (17 percent) <strong>and</strong> those<br />
35 years old <strong>and</strong> older (35 percent) is<br />
striking.<br />
Percent <strong>of</strong> Around-The-Home <strong>Wildlife</strong> Watchers by Age<br />
(Total participants: 67.8 million)<br />
16 <strong>and</strong> 17<br />
2%<br />
18 to 24<br />
4%<br />
25 to 34<br />
11%<br />
35 to 44<br />
20%<br />
65 <strong>and</strong> older<br />
20%<br />
55 to 64<br />
19%<br />
45 to 54<br />
24%<br />
Percent <strong>of</strong> U.S. Population Who Participated by Age<br />
Around-The-Home Participants<br />
by Sex <strong>and</strong> Age<br />
Total, both sexes . . 67.8 million<br />
Male . . . . . . . . . . 31.5 million<br />
Female . . . . . . . . 36.3 million<br />
Total, all ages . . . . . 67.8 million<br />
16 <strong>and</strong> 17 . . . . . . 1.3 million<br />
18 to 24 . . . . . . . . 3.0 million<br />
25 to 34 . . . . . . . . 7.1 million<br />
35 to 44 . . . . . . . . 13.8 million<br />
45 to 54 . . . . . . . . 16.1 million<br />
55 to 64 . . . . . . . . 13.0 million<br />
65 <strong>and</strong> older . . . . 13.5 million<br />
Source: Table 46.<br />
16 <strong>and</strong> 17 16%<br />
18 to 24<br />
13%<br />
25 to 34<br />
19%<br />
35 to 44<br />
31%<br />
45 to 54<br />
36%<br />
55 to 64<br />
40%<br />
65 <strong>and</strong> older<br />
35%<br />
40 <strong>2006</strong> <strong>National</strong> <strong>Survey</strong> <strong>of</strong> <strong>Fishing</strong>, <strong>Hunting</strong>, <strong>and</strong> <strong>Wildlife</strong>-<strong>Associated</strong> Recreation U.S. Fish & <strong>Wildlife</strong> Service
Metropolitan <strong>and</strong> Nonmetropolitan<br />
Around-The-Home Participants<br />
Approximately 78 percent <strong>of</strong> aroundthe-home<br />
wildlife watchers lived in<br />
metropolitan areas, as defined by<br />
the U.S. Census Bureau. Metropolitan<br />
statistical areas, or MSAs (see<br />
Appendix A), with populations <strong>of</strong> 1<br />
million or more had a participation rate<br />
<strong>of</strong> 25 percent, lower than any smaller<br />
MSA or non-MSA. Nonetheless,<br />
recreationists from the most populous<br />
MSAs comprised 44 percent <strong>of</strong> all<br />
around-the-home wildlife watchers.<br />
In MSAs <strong>of</strong> 250,000 to 999,999, the<br />
participation rate was 32 percent <strong>and</strong><br />
they made up 22 percent <strong>of</strong> all aroundthe-home<br />
recreationists. About 12<br />
percent <strong>of</strong> around-the-home wildlife<br />
watchers lived in MSAs with a population<br />
less than 250,000. The population<br />
<strong>of</strong> these areas had a participation rate <strong>of</strong><br />
34 percent.<br />
The participation rate for nonmetropolitan<br />
populations was 38 percent, higher<br />
than for any MSA. Seventeen percent<br />
<strong>of</strong> the total U.S. population lived<br />
outside MSAs in <strong>2006</strong> <strong>and</strong> represented<br />
22 percent <strong>of</strong> all around-the-home<br />
wildlife watchers.<br />
Percent <strong>of</strong> U.S. Population Who Participated by Residence<br />
Large MSA<br />
(1,000,000 or more)<br />
Medium MSA<br />
(250,000 to 999,999)<br />
Small MSA<br />
(249,999 or less)<br />
Outside MSA<br />
Percent <strong>of</strong> Around-The-Home <strong>Wildlife</strong> Watchers by Residence<br />
(Total participants: 67.8 million)<br />
Large MSA<br />
44%<br />
25%<br />
32%<br />
Outside MSA<br />
22%<br />
Small MSA<br />
12%<br />
Medium MSA<br />
22%<br />
34%<br />
38%<br />
U.S. Fish & <strong>Wildlife</strong> Service <strong>2006</strong> <strong>National</strong> <strong>Survey</strong> <strong>of</strong> <strong>Fishing</strong>, <strong>Hunting</strong>, <strong>and</strong> <strong>Wildlife</strong>-<strong>Associated</strong> Recreation 41
Household Income <strong>of</strong> Around-The-<br />
Home Participants<br />
Participation rates ranged from 21<br />
percent among U.S. residents living in<br />
households earning less than $10,000<br />
per year to 40 percent among participants<br />
living in households earning<br />
$100,000 or more annually. These<br />
groups represented 3 percent <strong>and</strong> 17<br />
percent, respectively, <strong>of</strong> all around-thehome<br />
wildlife watchers.<br />
Participants in households earning<br />
$10,000 to $19,999 a year constituted<br />
5 percent <strong>of</strong> all around-the-home<br />
recreationists. The recreationists with<br />
incomes <strong>of</strong> $20,000 to $24,999 made<br />
up 4 percent <strong>of</strong> all around-the-home<br />
participants. People with incomes <strong>of</strong><br />
$25,000 to $29,999 accounted for 5<br />
percent. Those people with incomes<br />
<strong>of</strong> $30,000 to $34,999 constituted 4<br />
percent. Recreationists whose incomes<br />
totaled $35,000 to $39,999 represented<br />
5 percent. People from households<br />
with annual incomes <strong>of</strong> $40,000 to<br />
$49,999 constituted 9 percent <strong>of</strong> all<br />
around-the-home participants. Approximately<br />
19 percent <strong>of</strong> around-the-home<br />
participants had incomes <strong>of</strong> $50,000 to<br />
$74,999. Recreationists with incomes<br />
<strong>of</strong> $75,000 to $99,999 accounted for 12<br />
percent.<br />
Percent <strong>of</strong> U.S. Population Who Participated by Household Income<br />
Less than $10,000<br />
$10,000 to $19,999<br />
$20,000 to $24,999<br />
21%<br />
22%<br />
24%<br />
$25,000 to $29,999<br />
30%<br />
$30,000 to $34,999<br />
26%<br />
$35,000 to $39,999<br />
31%<br />
$40,000 to $49,999<br />
$50,000 to $74,999<br />
$75,000 to $99,999<br />
$100,000 or more<br />
36%<br />
38%<br />
37%<br />
40%<br />
42 <strong>2006</strong> <strong>National</strong> <strong>Survey</strong> <strong>of</strong> <strong>Fishing</strong>, <strong>Hunting</strong>, <strong>and</strong> <strong>Wildlife</strong>-<strong>Associated</strong> Recreation U.S. Fish & <strong>Wildlife</strong> Service
Education, Race, <strong>and</strong> Ethnicity <strong>of</strong><br />
Around-The-Home Participants<br />
Looking at the educational background<br />
<strong>of</strong> participants, the highest<br />
rate <strong>of</strong> participation was found among<br />
recreationists with 5 years or more <strong>of</strong><br />
college, 42 percent. They made up 15<br />
percent <strong>of</strong> all around-the-home wildlife<br />
watchers. The lowest participation rate,<br />
19 percent, was among people with less<br />
than 12 years <strong>of</strong> education—10 percent<br />
<strong>of</strong> all around-the-home participants.<br />
Recreationists with 12 years <strong>of</strong> education,<br />
31 percent <strong>of</strong> all around-the-home<br />
participants, had a participation rate<br />
<strong>of</strong> 27 percent. Participants with 1 to 3<br />
years <strong>of</strong> college had a participation rate<br />
<strong>of</strong> 32 percent, while those with 4 years<br />
<strong>of</strong> college had a participation rate <strong>of</strong> 34<br />
percent. Those groups represented 25<br />
percent <strong>and</strong> 20 percent <strong>of</strong> all aroundthe-home<br />
wildlife watchers, respectively.<br />
A wide range <strong>of</strong> participation rates was<br />
found among the different races <strong>and</strong><br />
ethnic groups. About 33 percent <strong>of</strong> the<br />
White population engaged in aroundthe-home<br />
wildlife watching, contrasted<br />
with 10 percent <strong>of</strong> the Black population,<br />
12 percent <strong>of</strong> the Asian population,<br />
<strong>and</strong> 29 percent <strong>of</strong> individuals<br />
comprising the “other” race category.<br />
Of the total number <strong>of</strong> around-thehome<br />
participants, 93 percent were<br />
White, 4 percent were Black, 2 percent<br />
were Asian, <strong>and</strong> 2 percent were all<br />
other races.<br />
Around-The-Home<br />
Participants by Education,<br />
Race, <strong>and</strong> Ethnicity<br />
(In millions)<br />
Total participants . . . . . . . 67.8<br />
Education Level<br />
11 years or less . . . . . . . . 6.6<br />
12 years . . . . . . . . . . . . . 20.9<br />
1 to 3 years <strong>of</strong> college . . 17.0<br />
4 years <strong>of</strong> college . . . . . . 13.2<br />
5 years or more <strong>of</strong> college 10.0<br />
Race<br />
White . . . . . . . . . . . . . . . 62.9<br />
Black . . . . . . . . . . . . . . . 2.5<br />
Asian . . . . . . . . . . . . . . . 1.3<br />
Other . . . . . . . . . . . . . . . . 1.1<br />
Ethnicity<br />
Hispanic . . . . . . . . . . . . . 3.6<br />
Non-Hispanic . . . . . . . . . 64.2<br />
Approximately 12 percent <strong>of</strong> the U.S.<br />
Hispanic population engaged in wildlife<br />
watching around their homes in<br />
comparison with 32 percent <strong>of</strong> the non-<br />
Hispanic population. The 64.2 million<br />
non-Hispanic participants comprised 95<br />
percent <strong>of</strong> all around-the-home wildlife<br />
watchers <strong>and</strong> the 3.6 million Hispanic<br />
participants made up 5 percent.<br />
Percent <strong>of</strong> Around-The-Home <strong>Wildlife</strong> Watchers by Education<br />
(Total: 67.8 million participants)<br />
11 years or less<br />
10%<br />
12 years<br />
31%<br />
5 years or more <strong>of</strong> college<br />
15%<br />
4 years <strong>of</strong> college<br />
20%<br />
1 to 3 years <strong>of</strong> college<br />
25%<br />
Percent <strong>of</strong> U.S. Population Who Participated by Education<br />
11 years or less 19%<br />
12 years<br />
1 to 3 years <strong>of</strong> college<br />
4 years <strong>of</strong> college<br />
5 years or more<br />
<strong>of</strong> college<br />
27%<br />
32%<br />
34%<br />
Percent <strong>of</strong> Around-The-Home <strong>Wildlife</strong> Watchers by Race<br />
(Total: 67.8 million participants)<br />
Percent <strong>of</strong> U.S. Population Who Participated by Ethnicity<br />
Hispanic<br />
Other 2%<br />
Asian 2%<br />
Black 4%<br />
Non-Hispanic 32%<br />
12%<br />
White 93%<br />
42%<br />
Source: Table 46.<br />
U.S. Fish & <strong>Wildlife</strong> Service <strong>2006</strong> <strong>National</strong> <strong>Survey</strong> <strong>of</strong> <strong>Fishing</strong>, <strong>Hunting</strong>, <strong>and</strong> <strong>Wildlife</strong>-<strong>Associated</strong> Recreation 43
Away-From-Home <strong>Wildlife</strong>-<br />
Watching Highlights<br />
In <strong>2006</strong>, 23 million people 16 years<br />
old <strong>and</strong> older took trips away from<br />
home to feed, observe, or photograph<br />
wildlife. They comprised 32 percent<br />
<strong>of</strong> all wildlife watchers. Most popular<br />
with away-from-home participants<br />
was closely observing wildlife. About<br />
21.5 million participants, 9 percent <strong>of</strong><br />
the U.S population, observed wildlife<br />
an average <strong>of</strong> 14 days in <strong>2006</strong>. Photographing<br />
wildlife was enjoyed by 11.7<br />
million people, 5 percent <strong>of</strong> the U.S.<br />
population. They averaged 9 days<br />
per photographer. Approximately 7.1<br />
million people fed wildlife an average<br />
<strong>of</strong> 11 days <strong>and</strong> comprised 3 percent <strong>of</strong><br />
the U.S. population.<br />
About 83 percent <strong>of</strong> all away-fromhome<br />
participants took trips within<br />
their resident state to participate in<br />
wildlife watching. Approximately 67<br />
percent took trips only in their resident<br />
state, 16 percent took trips both inside<br />
<strong>and</strong> outside their resident state, <strong>and</strong> 17<br />
percent took trips only to other states.<br />
Altogether, 33 percent <strong>of</strong> all awayfrom-home<br />
participants took at least<br />
some <strong>of</strong> their trips to other states.<br />
Percent <strong>of</strong> U.S. Population Who Participated by Type <strong>of</strong> Activity<br />
(Total: 23 million participants)<br />
Total 10%<br />
Observe<br />
9%<br />
Away-From-Home Participants<br />
(In millions)<br />
Total participants . . . . . . 23.0<br />
Observers . . . . . . . . . . . 21.5<br />
Photographers . . . . . . . . 11.7<br />
Feeders . . . . . . . . . . . . . 7.1<br />
Photograph<br />
Feed<br />
3%<br />
5%<br />
Total days . . . . . . . . . . . . . 352<br />
Observing . . . . . . . . . . . 291<br />
Photographing . . . . . . . 104<br />
Feeding . . . . . . . . . . . . . 77<br />
Percent <strong>of</strong> Away-From-Home <strong>Wildlife</strong> Watchers—<br />
in State <strong>of</strong> Residence <strong>and</strong> in Other States<br />
(Total participants: 23 million)<br />
Source: Table 40.<br />
In state <strong>of</strong> residence <strong>and</strong><br />
in other states<br />
16%<br />
In state <strong>of</strong> residence only<br />
67%<br />
In other states only<br />
17%<br />
44 <strong>2006</strong> <strong>National</strong> <strong>Survey</strong> <strong>of</strong> <strong>Fishing</strong>, <strong>Hunting</strong>, <strong>and</strong> <strong>Wildlife</strong>-<strong>Associated</strong> Recreation U.S. Fish & <strong>Wildlife</strong> Service
Away-From-Home Participants<br />
by Type <strong>of</strong> <strong>Wildlife</strong> Observed,<br />
Fed, or Photographed<br />
(In millions)<br />
Total participants . . . . . . . 23.0<br />
Birds, total . . . . . . . . . . . . . 20.0<br />
Waterfowl . . . . . . . . . . . . 15.4<br />
Birds <strong>of</strong> prey . . . . . . . . . . 14.0<br />
Songbirds . . . . . . . . . . . . 13.7<br />
Water birds . . . . . . . . . . . 11.5<br />
Other birds . . . . . . . . . . . 8.8<br />
L<strong>and</strong> mammals, total . . . . 16.2<br />
Small l<strong>and</strong> mammals . . . 13.4<br />
Large l<strong>and</strong> mammals . . . 12.8<br />
Fish . . . . . . . . . . . . . . . . . . 6.8<br />
<strong>Wildlife</strong> Observed, Fed, or<br />
Photographed by Away-From-Home<br />
Participants<br />
Wild birds attracted the most interest<br />
from wildlife watchers on their trips—<br />
20.0 million people or 87 percent <strong>of</strong><br />
all away-from-home participants. The<br />
most-watched birds, waterfowl (ducks<br />
<strong>and</strong> geese, primarily), were watched by<br />
15.4 million people. Next on the list <strong>of</strong><br />
most-watched were birds <strong>of</strong> prey which<br />
drew 14.0 million trip-takers, followed<br />
by songbirds with 13.7 million<br />
watchers. Herons, shore birds, <strong>and</strong><br />
other water birds attracted 11.5 million<br />
recreationists. Lastly, other birds, such<br />
as road runners <strong>and</strong> turkeys, attracted<br />
8.8 million wildlife watchers.<br />
L<strong>and</strong> mammals, such as deer, bears,<br />
<strong>and</strong> coyotes, were observed, fed, or<br />
photographed by 16.2 million people—<br />
70 percent <strong>of</strong> all away-from-home<br />
participants. Fish attracted the attention<br />
<strong>of</strong> 6.8 million people or 29 percent<br />
<strong>of</strong> all away-from-home recreationists.<br />
About 3.4 million people or 15 percent<br />
<strong>of</strong> all away-from-home participants<br />
observed, fed, or photographed marine<br />
mammals, such as whales, seals, <strong>and</strong><br />
dolphins. Other wildlife, such as butterflies,<br />
snakes, <strong>and</strong> turtles, appealed to<br />
10.4 million people or 45 percent <strong>of</strong> all<br />
away-from-home wildlife watchers.<br />
Marine mammals . . . . . . . 3.4<br />
Other (turtles,<br />
butterflies, etc.) . . . . . . . . 10.4<br />
Source: Table 42.<br />
Percent <strong>of</strong> Away-From-Home <strong>Wildlife</strong> Watchers Who<br />
Observed, Fed, or Photographed <strong>Wildlife</strong><br />
(Total: 23 million participants)<br />
Birds 87%<br />
L<strong>and</strong> mammals<br />
70%<br />
Fish<br />
29%<br />
Marine mammals<br />
15%<br />
Other (turtles,<br />
butterflies, etc.)<br />
45%<br />
U.S. Fish & <strong>Wildlife</strong> Service <strong>2006</strong> <strong>National</strong> <strong>Survey</strong> <strong>of</strong> <strong>Fishing</strong>, <strong>Hunting</strong>, <strong>and</strong> <strong>Wildlife</strong>-<strong>Associated</strong> Recreation 45
Area Visited by Away-From-Home<br />
Participants<br />
In <strong>2006</strong>, the most visited areas for<br />
Americans to observe, feed, or photograph<br />
wildlife were publicly owned.<br />
Approximately 80 percent <strong>of</strong> all<br />
trip-taking wildlife watchers used<br />
public areas while just 38 percent used<br />
private areas. About 27 percent <strong>of</strong> all<br />
away-from-home participants, 6.2<br />
million, visited both public <strong>and</strong> private<br />
areas. Approximately 12.2 million,<br />
53 percent, visited only public areas<br />
to engage in their activities while 2.5<br />
million, 11 percent, visited only private<br />
areas.<br />
Percent <strong>of</strong> Away-From-Home <strong>Wildlife</strong> Watchers<br />
by Public <strong>and</strong> Private L<strong>and</strong><br />
(Total participants: 23 million)<br />
Not reported<br />
9%<br />
Public only<br />
53%<br />
Public <strong>and</strong> private<br />
27%<br />
Private only<br />
11%<br />
Away-From-Home Participants<br />
by Public <strong>and</strong> Private L<strong>and</strong><br />
(In millions)<br />
Total participants . . . . . . . 23.0<br />
Public l<strong>and</strong> only . . . . . . . 12.2<br />
Private l<strong>and</strong> only . . . . . . . 2.5<br />
Public <strong>and</strong> private l<strong>and</strong> . . 6.2<br />
Not reported . . . . . . . . . . 2.1<br />
Source: Table 40.<br />
46 <strong>2006</strong> <strong>National</strong> <strong>Survey</strong> <strong>of</strong> <strong>Fishing</strong>, <strong>Hunting</strong>, <strong>and</strong> <strong>Wildlife</strong>-<strong>Associated</strong> Recreation U.S. Fish & <strong>Wildlife</strong> Service
Away-From-Home <strong>Wildlife</strong><br />
Watchers by Geographic Region<br />
In <strong>2006</strong>, 229 million people 16 years<br />
old <strong>and</strong> older lived in the United<br />
States—10 percent <strong>of</strong> whom took trips<br />
to wildlife watch.<br />
AK<br />
Away-From-Home <strong>Wildlife</strong>-Watching Participation<br />
(<strong>National</strong> participation rate: 10%)<br />
Away-from-home participation rates<br />
ranged from 7 percent in the South<br />
Atlantic Region to 14 percent in the<br />
West North Central Region. The<br />
regions that had participation rates<br />
higher than the national average were<br />
New Engl<strong>and</strong>, East North Central, West<br />
North Central, East South Central,<br />
Mountain, <strong>and</strong> Pacific.<br />
Pacific<br />
11%<br />
WA<br />
OR<br />
NV<br />
CA<br />
ID<br />
AZ<br />
UT<br />
Mountain<br />
13%<br />
MT<br />
WY<br />
NM<br />
CO<br />
West North<br />
Central<br />
14%<br />
ND<br />
SD<br />
NE<br />
KS<br />
OK<br />
MN<br />
IA<br />
MO<br />
AR<br />
WI<br />
IL<br />
East<br />
North<br />
Central<br />
11%<br />
IN<br />
MI<br />
KY<br />
TN<br />
OH<br />
WV<br />
SC<br />
PA<br />
VA<br />
NC<br />
NY<br />
New Engl<strong>and</strong><br />
12%<br />
NH<br />
VT<br />
ME<br />
MA<br />
RI<br />
CT<br />
NJ<br />
DE<br />
MD<br />
DC<br />
Middle<br />
Atlantic<br />
9%<br />
HI<br />
TX<br />
West South<br />
Central<br />
8%<br />
LA<br />
MS<br />
AL<br />
East South<br />
Central<br />
13%<br />
GA<br />
FL<br />
South Atlantic<br />
7%<br />
U.S. Fish & <strong>Wildlife</strong> Service <strong>2006</strong> <strong>National</strong> <strong>Survey</strong> <strong>of</strong> <strong>Fishing</strong>, <strong>Hunting</strong>, <strong>and</strong> <strong>Wildlife</strong>-<strong>Associated</strong> Recreation 47
Percent <strong>of</strong> U.S. Males <strong>and</strong> Females Who Participated<br />
Males 11%<br />
Females<br />
Percent <strong>of</strong> Away-From-Home <strong>Wildlife</strong> Watchers by Sex<br />
(Total participants: 23 million)<br />
Females<br />
49%<br />
9%<br />
Males<br />
51%<br />
Sex <strong>and</strong> Age <strong>of</strong> Away-From-Home<br />
<strong>Wildlife</strong> Watchers<br />
A similar number <strong>of</strong> males <strong>and</strong> females<br />
participated in away-from-home wildlife<br />
watching in <strong>2006</strong>. 51 percent (11.8<br />
million) <strong>of</strong> all participants were males<br />
<strong>and</strong> 49 percent (11.2 million) were<br />
females. 11 percent <strong>of</strong> males <strong>and</strong> 9<br />
percent <strong>of</strong> females in the U.S. enjoyed<br />
observing, feeding, or photographing<br />
wildlife away from home.<br />
The 35-to-44-year-old age group had<br />
the most away-from-home recreationists,<br />
6.0 million. This age group <strong>and</strong><br />
55-to-64-year-olds had the highest<br />
participation rate, 13 percent. Another<br />
age group that had a high participation<br />
rate was the 45-to-54-year-old age<br />
group, 12 percent. The 18-to-24-yearold<br />
age group had the lowest participation<br />
rate, at 5 percent.<br />
Percent <strong>of</strong> Away-From-Home <strong>Wildlife</strong> Watchers by Age<br />
(Total participants: 23 million)<br />
16 <strong>and</strong> 17<br />
3%<br />
18 to 24<br />
5%<br />
25 to 34<br />
13%<br />
35 to 44<br />
26%<br />
65 <strong>and</strong> older<br />
11%<br />
55 to 64<br />
19%<br />
45 to 54<br />
23%<br />
Percent <strong>of</strong> U.S. Population Who Participated by Age<br />
Away-From-Home Participants<br />
by Sex <strong>and</strong> Age<br />
Total, both sexes . . 23.0 million<br />
Male . . . . . . . . . . 11.8 million<br />
Female . . . . . . . . 11.2 million<br />
Total, all ages . . . . . 23.0 million<br />
16 <strong>and</strong> 17 . . . . . . 0.6 million<br />
18 to 24 . . . . . . . . 1.1 million<br />
25 to 34 . . . . . . . . 3.1 million<br />
35 to 44 . . . . . . . . 6.0 million<br />
45 to 54 . . . . . . . . 5.2 million<br />
55 to 64 . . . . . . . . 4.4 million<br />
65 <strong>and</strong> older . . . . 2.6 million<br />
Source: Table 45.<br />
16 <strong>and</strong> 17<br />
7%<br />
18 to 24<br />
5%<br />
25 to 34<br />
8%<br />
35 to 44<br />
13%<br />
45 to 54<br />
12%<br />
55 to 64<br />
13%<br />
65 <strong>and</strong> older<br />
7%<br />
48 <strong>2006</strong> <strong>National</strong> <strong>Survey</strong> <strong>of</strong> <strong>Fishing</strong>, <strong>Hunting</strong>, <strong>and</strong> <strong>Wildlife</strong>-<strong>Associated</strong> Recreation U.S. Fish & <strong>Wildlife</strong> Service
Metropolitan <strong>and</strong> Nonmetropolitan<br />
Away-From-Home Participants<br />
In <strong>2006</strong>, 9 percent <strong>of</strong> all people living<br />
in MSAs (see Appendix A for definition)<br />
took trips primarily to enjoy<br />
wildlife. MSA residents comprised 78<br />
percent <strong>of</strong> all away-from-home participants.<br />
In contrast, 13 percent <strong>of</strong> all<br />
people living outside an MSA watched<br />
wildlife away from home.<br />
As was the case with around-the-home<br />
wildlife watching, the biggest MSA<br />
had both the lowest participation rate<br />
<strong>and</strong> the highest number <strong>of</strong> participants.<br />
Residents <strong>of</strong> non-MSAs made up 22<br />
percent <strong>of</strong> both away-from-home <strong>and</strong><br />
around-the-home participants.<br />
Household Income <strong>of</strong> Away-From-<br />
Home Participants<br />
Participation rates ranged from 6<br />
percent for those in households earning<br />
less than $20,000 per year to 16<br />
percent for those in households earning<br />
$75,000 or more. There was a strong<br />
correlation between income <strong>and</strong> the<br />
likelihood to wildlife watch away from<br />
home, with an increase in one matched<br />
by an increase in the other. The income<br />
group that had the most participants<br />
was $50,000 to $74,999, with 4.7<br />
million recreationists.<br />
Median income was higher for awayfrom-home<br />
participants than for Americans<br />
as a whole, slightly over $60,000<br />
for recreationists compared to about<br />
$50,000 for the U.S. population.<br />
Percent <strong>of</strong> Away-From-Home <strong>Wildlife</strong> Watchers by Residence<br />
(Total participants: 23 million)<br />
Percent <strong>of</strong> U.S. Population Who Participated by Residence<br />
Large MSA<br />
(1,000,000 or more)<br />
Medium MSA<br />
(250,000 to 999,999)<br />
Small MSA<br />
(249,999 or less)<br />
Outside MSA<br />
Large MSA<br />
45%<br />
Outside MSA<br />
22%<br />
Small MSA<br />
12%<br />
Medium MSA<br />
21%<br />
10%<br />
Percent <strong>of</strong> U.S. Population Who Participated by Household Income<br />
Less than $10,000<br />
$10,000 to $19,999<br />
6%<br />
6%<br />
9%<br />
12%<br />
13%<br />
$20,000 to $24,999<br />
7%<br />
$25,000 to $29,999<br />
8%<br />
$30,000 to $34,999<br />
$35,000 to $39,999<br />
10%<br />
10%<br />
$40,000 to $49,999<br />
12%<br />
$50,000 to $74,999<br />
14%<br />
$75,000 to $99,999<br />
$100,000 or more<br />
16%<br />
16%<br />
U.S. Fish & <strong>Wildlife</strong> Service <strong>2006</strong> <strong>National</strong> <strong>Survey</strong> <strong>of</strong> <strong>Fishing</strong>, <strong>Hunting</strong>, <strong>and</strong> <strong>Wildlife</strong>-<strong>Associated</strong> Recreation 49
Education, Race, <strong>and</strong> Ethnicity <strong>of</strong><br />
Away-From-Home Participants<br />
As in the case <strong>of</strong> household income,<br />
educational achievement <strong>and</strong> participation<br />
in away-from-home wildlife<br />
watching have a direct correlation.<br />
About 4 percent <strong>of</strong> the U.S. population<br />
with 11 years <strong>of</strong> education or less<br />
participated, compared to 18 percent<br />
<strong>of</strong> the population with 5 years or more<br />
<strong>of</strong> college. The educational cohort with<br />
the most participants was 1 to 3 years<br />
<strong>of</strong> college, with 6.2 million recreationists.<br />
The educational cohort with the<br />
fewest recreationists was 11 years or<br />
less, with 1.4 million.<br />
The participation rates by race varied<br />
greatly. Approximately 11 percent <strong>of</strong><br />
Whites <strong>and</strong> 9 percent <strong>of</strong> other races<br />
except Blacks <strong>and</strong> Asians took trips to<br />
wildlife watch. In contrast, 3 percent <strong>of</strong><br />
Blacks <strong>and</strong> 4 percent <strong>of</strong> Asians participated.<br />
Of the total 23 million awayfrom-home<br />
participants, 94 percent<br />
were White, 3 percent were Black, 2<br />
percent were Asian, <strong>and</strong> 2 percent were<br />
other races.<br />
About 1.4 million recreationists were<br />
Hispanic, 6 percent <strong>of</strong> all participants.<br />
Approximately 5 percent <strong>of</strong> the U.S.<br />
Hispanic population took trips to<br />
engage in wildlife watching. Of the<br />
non-Hispanic population, 11 percent<br />
(21.6 million participants) took trips<br />
to wildlife watch. They comprised 94<br />
percent <strong>of</strong> all away-from-home wildlife<br />
watchers.<br />
Percent <strong>of</strong> Away-From-Home <strong>Wildlife</strong> Watchers by Education<br />
(Total participants: 23 million)<br />
11 years or less<br />
6%<br />
12 years<br />
27%<br />
5 years or more <strong>of</strong> college<br />
19%<br />
4 years <strong>of</strong> college<br />
21%<br />
1 to 3 years <strong>of</strong> college<br />
27%<br />
Percent <strong>of</strong> U.S. Population Who Participated by Education<br />
11 years or less 4%<br />
12 years<br />
8%<br />
1 to 3 years <strong>of</strong> college<br />
12%<br />
Away-From-Home<br />
Participants by Education,<br />
Race, <strong>and</strong> Ethnicity<br />
(In millions)<br />
Total participants . . . . . . . 23.0<br />
Education Level<br />
11 years or less . . . . . . . . 1.4<br />
12 years . . . . . . . . . . . . . 6.1<br />
1 to 3 years <strong>of</strong> college . . 6.2<br />
4 years <strong>of</strong> college . . . . . . 4.9<br />
5 years or more <strong>of</strong> college 4.4<br />
Race<br />
White . . . . . . . . . . . . . . . 21.5<br />
Black . . . . . . . . . . . . . . . 0.7<br />
Asian . . . . . . . . . . . . . . . 0.4<br />
Other . . . . . . . . . . . . . . . . 0.4<br />
Ethnicity<br />
Hispanic . . . . . . . . . . . . . 1.4<br />
Non-Hispanic . . . . . . . . . 21.6<br />
Source: Table 45.<br />
4 years <strong>of</strong> college<br />
5 years or more<br />
<strong>of</strong> college<br />
Percent <strong>of</strong> Away-From-Home <strong>Wildlife</strong> Watchers by Race<br />
(Total participants: 23 million)<br />
Other 2%<br />
Asian 2%<br />
Black 3%<br />
12%<br />
White 94%<br />
Percent <strong>of</strong> U.S. Population Who Participated by Ethnicity<br />
18%<br />
Non-Hispanic 11%<br />
Hispanic<br />
5%<br />
50 <strong>2006</strong> <strong>National</strong> <strong>Survey</strong> <strong>of</strong> <strong>Fishing</strong>, <strong>Hunting</strong>, <strong>and</strong> <strong>Wildlife</strong>-<strong>Associated</strong> Recreation U.S. Fish & <strong>Wildlife</strong> Service
1996–<strong>2006</strong> Comparison <strong>of</strong> <strong>Wildlife</strong>-<br />
Watching Participation<br />
The number <strong>of</strong> all wildlife watchers<br />
increased 5 percent from 1996 to 2001<br />
<strong>and</strong> 8 percent from 2001 to <strong>2006</strong>, with<br />
62.9 million participants in 1996, 66.1<br />
million in 2001, <strong>and</strong> 71.1 million in<br />
<strong>2006</strong>. Comparing the results from<br />
the last three <strong>Survey</strong>s finds differing<br />
trends for the two categories <strong>of</strong> wildlife<br />
watching: around the home <strong>and</strong> away<br />
from home.<br />
Around-the-home wildlife watching,<br />
the most popular type <strong>of</strong> wildlife<br />
watching, led the overall upward trend<br />
with a 12 percent increase from 1996<br />
to <strong>2006</strong>. The upward trend from 1996<br />
to <strong>2006</strong> was seen in all five types <strong>of</strong><br />
around-the-home wildlife watching:<br />
feeding, observing, photographing,<br />
maintaining plantings or natural areas,<br />
<strong>and</strong> visiting public areas. The number<br />
<strong>of</strong> around-the-home feeders increased<br />
3 percent (not a statistically significant<br />
change), from 54.1 million in 1996 to<br />
55.5 million in <strong>2006</strong>. The number <strong>of</strong><br />
observers increased 1 percent (although<br />
this is not significant at the 5 percent<br />
level) from 44.1 million in 1996 to 44.5<br />
million in <strong>2006</strong>. The number <strong>of</strong> photographers<br />
increased 17 percent, from 16.0<br />
million in 1996 to 18.8 million in <strong>2006</strong>.<br />
The number <strong>of</strong> people who maintained<br />
plantings or natural areas for the benefit<br />
<strong>of</strong> wildlife increased 8 percent (not<br />
a statistically significant difference)<br />
from 1996 to <strong>2006</strong>, 13.4 million to 14.5<br />
million. Finally, the number <strong>of</strong> visitors<br />
to public areas within a mile <strong>of</strong> home<br />
increased 21 percent, from 11.0 million<br />
to 13.3 million.<br />
Unlike around-the-home wildlife<br />
watching, away-from-home wildlife<br />
watching did not increase from 1996<br />
to <strong>2006</strong>. There was a 3 percent drop,<br />
which is not statistically significant.<br />
From 1996 to 2001, participation<br />
decreased 8 percent, from 23.7 million<br />
to 21.8 million. From 2001 to <strong>2006</strong>, the<br />
direction <strong>of</strong> the change in participation<br />
reversed, increasing 5 percent—from<br />
21.8 million to 23.0 million—although<br />
not enough to match the level <strong>of</strong><br />
participation in 1996. There are three<br />
categories <strong>of</strong> away-from-home wildlife<br />
watching: observing, photographing,<br />
<strong>and</strong> feeding. From 1996 to <strong>2006</strong>, the<br />
number <strong>of</strong> observers decreased 6<br />
percent (not a statistically significant<br />
difference), from 22.9 million to 21.5<br />
million. The number <strong>of</strong> photographers<br />
decreased 3 percent (not a statistically<br />
significant change), from 12.0 million<br />
to 11.7 million. Lastly, the number<br />
<strong>of</strong> feeders decreased a whopping<br />
29 percent, from 10.0 million to 7.1<br />
million.<br />
Days afield by away-from-home wildlife<br />
watchers increased 12 percent (not<br />
a statistically significant change) from<br />
1996 to <strong>2006</strong>, largely due to the efforts<br />
<strong>of</strong> photographers. Days afield in 2001<br />
were even higher than in 1996 or <strong>2006</strong>,<br />
372 million compared to 314 million<br />
or 352 million, respectively (although<br />
the differences are not statistically<br />
si gnificant).<br />
Expenditures for wildlife watching<br />
increased 21 percent from 1996 to<br />
<strong>2006</strong>. Interestingly, the reason for the<br />
increase from 2001 to <strong>2006</strong> was the<br />
rise in trip-related expenditures (a 38<br />
percent increase while equipment had<br />
a 14 percent decrease), whereas the<br />
reason for the increase from 1996 to<br />
2001 was equipment expenditures (a<br />
41 percent increase while trip-related<br />
expenditures underwent a 20 percent<br />
decrease).<br />
Number <strong>of</strong> <strong>Wildlife</strong> Watchers<br />
(In millions)<br />
62.9<br />
66.1<br />
71.1<br />
Days <strong>of</strong> Away-From-Home<br />
<strong>Wildlife</strong> Watching<br />
(In millions)<br />
314<br />
372<br />
352<br />
<strong>Wildlife</strong>-Watching Expenditures<br />
(Billions <strong>of</strong> <strong>2006</strong> dollars)<br />
37.7<br />
43.8<br />
45.7<br />
1996<br />
2001<br />
<strong>2006</strong><br />
1996<br />
2001<br />
<strong>2006</strong><br />
1996<br />
2001<br />
<strong>2006</strong><br />
U.S. Fish & <strong>Wildlife</strong> Service <strong>2006</strong> <strong>National</strong> <strong>Survey</strong> <strong>of</strong> <strong>Fishing</strong>, <strong>Hunting</strong>, <strong>and</strong> <strong>Wildlife</strong>-<strong>Associated</strong> Recreation 51
1996–<strong>2006</strong> <strong>Wildlife</strong>-Watching Participants, Days, <strong>and</strong> Expenditures<br />
(U.S. population 16 years old <strong>and</strong> older. Numbers in thous<strong>and</strong>s)<br />
1996 <strong>2006</strong> 1996–<strong>2006</strong><br />
Number Percent Number Percent percent change<br />
<strong>Wildlife</strong>-watching participants, total 62,868 100 71,132 100 13<br />
Around the home . . . . . . . . . . . . . . . 60,751 97 67,756 95 12<br />
Observers . . . . . . . . . . . . . . . . . . . 44,063 70 44,467 63 1 *<br />
Photographers . . . . . . . . . . . . . . . 16,021 25 18,763 26 17<br />
Feeders. . . . . . . . . . . . . . . . . . . . . 54,122 86 55,512 78 3 *<br />
Visitors <strong>of</strong> public parks or areas . 11,011 18 13,271 19 21<br />
Maintainers <strong>of</strong> plantings or natural areas 13,401 21 14,508 20 8 *<br />
Away from home . . . . . . . . . . . . . . . 23,652 38 22,977 32 –3*<br />
Observers . . . . . . . . . . . . . . . . . . . 22,878 36 21,546 30 –6*<br />
Photographers . . . . . . . . . . . . . . . 12,038 19 11,708 16 –3*<br />
Feeders. . . . . . . . . . . . . . . . . . . . . 9,976 16 7,084 10 –29<br />
Days, away from home. . . . . . . . . . . 313,790 100 352,070 100 12 *<br />
Observing . . . . . . . . . . . . . . . . . . 278,683 89 291,027 83 4 *<br />
Photographing . . . . . . . . . . . . . . . 79,342 25 103,872 30 31 *<br />
Feeding . . . . . . . . . . . . . . . . . . . . 89,606 29 77,329 22 –14*<br />
<strong>Wildlife</strong>-watching expenditures,<br />
total (<strong>2006</strong> dollars) . . . . . . . . . . . . . . $37,651,365 100 $45,654,960 100 21<br />
Trip-related . . . . . . . . . . . . . . . . . . . . $12,165,513 32 $12,875,152 28 6 *<br />
Equipment, total . . . . . . . . . . . . . . . . $21,451,842 57 $23,174,053 51 8 *<br />
<strong>Wildlife</strong>-watching equipment . . . $10,601,546 28 $9,869,727 22 –7*<br />
Auxiliary equipment . . . . . . . . . . $1,105,724 3 $1,033,060 2 –7*<br />
Special equipment . . . . . . . . . . . . $9,744,572 26 $12,271,266 27 26 *<br />
Other . . . . . . . . . . . . . . . . . . . . . . . . . $4,034,010 11 $9,605,755 21 138<br />
* Not different from zero at the 5 percent level <strong>of</strong> significance.<br />
52 <strong>2006</strong> <strong>National</strong> <strong>Survey</strong> <strong>of</strong> <strong>Fishing</strong>, <strong>Hunting</strong>, <strong>and</strong> <strong>Wildlife</strong>-<strong>Associated</strong> Recreation U.S. Fish & <strong>Wildlife</strong> Service
2001–<strong>2006</strong> <strong>Wildlife</strong>-Watching Participants, Days, <strong>and</strong> Expenditures<br />
(U.S. population 16 years old <strong>and</strong> older. Numbers in thous<strong>and</strong>s)<br />
2001 <strong>2006</strong> 2001–<strong>2006</strong><br />
Number Percent Number Percent percent change<br />
<strong>Wildlife</strong>-watching participants, total. . 66,105 100 71,132 100 8<br />
Around the home . . . . . . . . . . . . . . . . 62,928 95 67,756 95 8<br />
Observers . . . . . . . . . . . . . . . . . . . . 42,111 64 44,467 63 6<br />
Photographers . . . . . . . . . . . . . . . . 13,937 21 18,763 26 35<br />
Feeders. . . . . . . . . . . . . . . . . . . . . . 53,988 82 55,512 78 3 *<br />
Visitors <strong>of</strong> public parks or areas . . 10,981 17 13,271 19 21<br />
Maintainers <strong>of</strong> plantings or<br />
natural areas . . . . . . . . . . . . . . . . 13,072 20 14,508 20 11<br />
Away from home . . . . . . . . . . . . . . . . 21,823 33 22,977 32 5 *<br />
Observers . . . . . . . . . . . . . . . . . . . . 20,080 30 21,546 30 7 *<br />
Photographers . . . . . . . . . . . . . . . . 9,427 14 11,708 16 24<br />
Feeders. . . . . . . . . . . . . . . . . . . . . . 7,077 11 7,084 10 (Z)*<br />
Days, away from home. . . . . . . . . . . . 372,006 100 352,070 100 –5*<br />
Observing . . . . . . . . . . . . . . . . . . . 295,345 79 291,027 83 –1*<br />
Photographing . . . . . . . . . . . . . . . . 76,324 21 103,872 30 36 *<br />
Feeding . . . . . . . . . . . . . . . . . . . . . 103,307 28 77,329 22 –25*<br />
<strong>Wildlife</strong>-watching expenditures,<br />
total (<strong>2006</strong> dollars) . . . . . . . . . . . . . . $43,792,516 100 $45,654,960 100 4 *<br />
Trip-related . . . . . . . . . . . . . . . . . . . . . $9,305,180 21 $12,875,152 28 38<br />
Equipment, total . . . . . . . . . . . . . . . . . $26,835,136 61 $23,174,053 51 –14<br />
<strong>Wildlife</strong>-watching equipment . . . . $8,383,534 19 $9,869,727 22 18<br />
Auxiliary equipment . . . . . . . . . . . $817,266 2 $1,033,060 2 26 *<br />
Special equipment . . . . . . . . . . . . . $17,634,336 40 $12,271,266 27 –30*<br />
Other . . . . . . . . . . . . . . . . . . . . . . . . . . $7,652,201 17 $9,605,755 21 26 *<br />
* Not different from zero at the 5 percent level <strong>of</strong> significance.<br />
(Z) Less than 0.5 percent.<br />
U.S. Fish & <strong>Wildlife</strong> Service <strong>2006</strong> <strong>National</strong> <strong>Survey</strong> <strong>of</strong> <strong>Fishing</strong>, <strong>Hunting</strong>, <strong>and</strong> <strong>Wildlife</strong>-<strong>Associated</strong> Recreation 53
Tables
Guide to Statistical Tables<br />
Purpose <strong>and</strong> Coverage <strong>of</strong> Tables<br />
The statistical tables <strong>of</strong> this report were<br />
designed to meet a wide range <strong>of</strong> needs<br />
for those interested in wildlife-related<br />
recreation. Special terms used in these<br />
tables are defined in Appendix A.<br />
The tables are based on responses to<br />
the <strong>2006</strong> <strong>Survey</strong>, which was designed<br />
to collect data about participation in<br />
wi ldlife-related recreation. To have<br />
taken part in the <strong>Survey</strong>, a respondent<br />
must have been a U.S. resident (a<br />
resident <strong>of</strong> one <strong>of</strong> the 50 states or the<br />
District <strong>of</strong> Columbia). No one residing<br />
outside the United States (including<br />
U.S. citizens) was eligible for interviewing.<br />
Therefore, reported state <strong>and</strong><br />
national totals do not include participation<br />
by those who were not U.S.<br />
residents or who were U.S. citizens<br />
residing outside the United States.<br />
Comparability With Previous<br />
<strong>Survey</strong>s<br />
The numbers reported can be compared<br />
with those in the 1991, 1996, <strong>and</strong> 2001<br />
<strong>Survey</strong> Reports. The methodology used<br />
in <strong>2006</strong> was similar to that used in<br />
those <strong>Survey</strong>s. These results should not<br />
be directly compared to results from<br />
<strong>Survey</strong>s earlier than 1991 since there<br />
were major changes in methodology.<br />
These changes were made to improve<br />
accuracy in the information provided.<br />
Trends further back than 1991 are<br />
presented in Appendix C. These trends<br />
were developed using parts <strong>of</strong> the<br />
<strong>Survey</strong>s that were comparable.<br />
Coverage <strong>of</strong> an Individual Table<br />
Since the <strong>Survey</strong> covers many activities<br />
in various places by participants<br />
<strong>of</strong> different ages, all table titles,<br />
headnotes, stubs, <strong>and</strong> footnotes are<br />
designed to identify <strong>and</strong> articulate each<br />
item being reported in the table. For<br />
example, the title <strong>of</strong> Table 1 shows that<br />
data about anglers <strong>and</strong> hunters, their<br />
days <strong>of</strong> participation, <strong>and</strong> their number<br />
<strong>of</strong> trips are reported by type <strong>of</strong> activity.<br />
By contrast, the title <strong>of</strong> Table 3 indicates<br />
that it contains data on freshwater<br />
anglers <strong>and</strong> the days they fished for<br />
different species.<br />
Percentages Reported in the Tables<br />
Percentages are reported in the tables<br />
for the convenience <strong>of</strong> the user. When<br />
exclusive groups are being reported,<br />
the base <strong>of</strong> a percentage is apparent<br />
from its context because the percents<br />
add to 100 percent (plus or minus a<br />
rounding error). For example, Table 1<br />
reports the number <strong>of</strong> trips taken by big<br />
game hunters (62 percent), those taken<br />
by small game hunters (22 percent),<br />
those taken by migratory bird hunters<br />
(9 percent), <strong>and</strong> those taken by hunters<br />
pursuing other animals (7 percent).<br />
These comprise 100 percent because<br />
they are exclusive categories.<br />
Percents should not add to 100 when<br />
nonexclusive groups are being reported.<br />
Using Table 1 as an example again,<br />
note that adding the percentages associated<br />
with the total number <strong>of</strong> big game<br />
hunters (85 percent), total small game<br />
hunters (38 percent), total migratory<br />
bird hunters (18 percent), <strong>and</strong> total<br />
hunters <strong>of</strong> other animals (9 percent)<br />
will not yield total hunters (100<br />
percent) because respondents could<br />
hunt for more than one type <strong>of</strong> game.<br />
When the base <strong>of</strong> the percentage is not<br />
apparent in context, it is identified in a<br />
footnote. For example, Table 6 reports<br />
three percentages with different bases:<br />
one for the number <strong>of</strong> hunters, one for<br />
the number <strong>of</strong> trips, <strong>and</strong> one for days <strong>of</strong><br />
hunting. Footnotes are used to clarify<br />
the bases <strong>of</strong> the reported percentages.<br />
Footnotes to the Tables<br />
Footnotes are used to clarify the information<br />
or items that are being reported<br />
in a table. Symbols in the body <strong>of</strong> a<br />
table indicate important footnotes.<br />
The following symbols are used in the<br />
tables to refer to the same footnote each<br />
time they appear:<br />
* Estimate based on a sample size <strong>of</strong><br />
10-29.<br />
... Sample size too small to report<br />
data reliably.<br />
W Less than .5 dollars.<br />
Z Less than .5 percent.<br />
X Not applicable.<br />
NA Not available.<br />
Estimates based upon fewer than ten<br />
responses are regarded as being based<br />
on a sample size that is too small for<br />
reliable reporting. An estimate based<br />
upon at least 10 but fewer than 30<br />
responses is treated as an estimate<br />
based on a small sample size. Other<br />
footnotes appear, as necessary, to<br />
qualify or clarify the estimates reported<br />
in the tables. In addition, these two<br />
important footnotes appear frequently:<br />
• Detail does not add to total because<br />
<strong>of</strong> multiple responses.<br />
• Detail does not add to total<br />
because <strong>of</strong> multiple responses <strong>and</strong><br />
no nresponse.<br />
“Multiple responses” is a term used to<br />
reflect the fact that individuals or their<br />
characteristics fall into more than one<br />
category. Using Table 2 as an example,<br />
those who fished in saltwater <strong>and</strong> freshwater<br />
appear in both <strong>of</strong> these totals. Yet<br />
each angler is represented only once in<br />
the “Total, all fishing” column. Similarly,<br />
in Table 6, those who hunt for<br />
big game <strong>and</strong> small game are counted<br />
only once as a hunter in the “Total, all<br />
hunting” column. Therefore, totals will<br />
be smaller than the sum <strong>of</strong> subcategories<br />
when multiple responses exist.<br />
“Nonresponse” exists because the<br />
<strong>Survey</strong> questions were answered<br />
voluntarily, <strong>and</strong> some respondents did<br />
not or could not answer all the questions.<br />
The effect <strong>of</strong> nonresponse is<br />
illustrated in Table 31, where the total<br />
for anglers who use boats is greater<br />
than the sum <strong>of</strong> anglers fishing from a<br />
motorboat <strong>and</strong> anglers fishing from a<br />
non-motor boat. This occurs because<br />
some respondents did not answer the<br />
motorboat/non-motorboat question. As<br />
a result, it is known how many anglers<br />
used a boat due to an earlier question<br />
but not known if it was a motorboat or<br />
non-motorboat. In this case, totals are<br />
greater than the sum <strong>of</strong> subcategories<br />
when nonresponses have occurred.<br />
56 <strong>2006</strong> <strong>National</strong> <strong>Survey</strong> <strong>of</strong> <strong>Fishing</strong>, <strong>Hunting</strong>, <strong>and</strong> <strong>Wildlife</strong>-<strong>Associated</strong> Recreation U.S. Fish & <strong>Wildlife</strong> Service
Table 1. Anglers <strong>and</strong> Hunters 16 Years Old <strong>and</strong> Older, Days <strong>of</strong> Participation, <strong>and</strong> Trips by Type <strong>of</strong><br />
<strong>Fishing</strong> <strong>and</strong> <strong>Hunting</strong>: <strong>2006</strong><br />
(Population 16 years old <strong>and</strong> older. Numbers in thous<strong>and</strong>s)<br />
Type <strong>of</strong> fishing <strong>and</strong> hunting<br />
Participants Days <strong>of</strong> participation Trips<br />
Number Percent Number Percent Number Percent<br />
Total sportspersons ........................ 33,916 100 736,707 100 588,891 100<br />
FISHING<br />
Total, all fishing ........................... 29,952 100 516,781 100 403,492 100<br />
Total, all freshwater ....................... 25,431 85 433,337 84 336,528 83<br />
Freshwater, except Great Lakes............ 25,035 84 419,942 81 323,265 80<br />
Great Lakes ........................... 1,420 5 18,016 3 13,264 3<br />
Saltwater................................ 7,717 26 85,663 17 66,963 17<br />
HUNTING<br />
Total, all hunting .......................... 12,510 100 219,925 100 185,399 100<br />
Big game ............................... 10,682 85 164,061 75 115,255 62<br />
Small game.............................. 4,797 38 52,395 24 40,856 22<br />
Migratory bird ........................... 2,293 18 19,770 9 16,390 9<br />
Other animals ............................ 1,128 9 15,205 7 12,898 7<br />
Note: Detail does not add to total because <strong>of</strong> multiple responses.<br />
Table 2. Anglers, Trips, <strong>and</strong> Days <strong>of</strong> <strong>Fishing</strong> by Type <strong>of</strong> <strong>Fishing</strong>: <strong>2006</strong><br />
(Population 16 years old <strong>and</strong> older. Numbers in thous<strong>and</strong>s)<br />
Freshwater<br />
Anglers, trips, <strong>and</strong> days<br />
<strong>of</strong> fishing<br />
Total, all fishing<br />
Total,<br />
all freshwater<br />
Freshwater, except<br />
Great Lakes<br />
Great Lakes<br />
Saltwater<br />
Number Percent Number Percent Number Percent Number Percent Number Percent<br />
ANGLERS<br />
Total in U.S. ............... 29,952 100 25,431 100 25,035 100 1,420 100 7,717 100<br />
In state <strong>of</strong> residence........ 27,641 92 23,639 93 23,266 93 1,182 83 6,089 79<br />
In other states............. 6,494 22 4,749 19 4,604 18 306 22 2,185 28<br />
TRIPS<br />
Total in U.S. ............... 403,492 100 336,528 100 323,265 100 13,264 100 66,963 100<br />
In state <strong>of</strong> residence........ 376,511 93 316,575 94 304,611 94 11,964 90 59,937 90<br />
In other states............. 26,980 7 19,953 6 18,653 6 1,300 10 7,027 10<br />
DAYS OF FISHING<br />
Total in U.S. ............... 516,781 100 433,337 100 419,942 100 18,016 100 85,663 100<br />
In state <strong>of</strong> residence........ 470,594 91 400,883 93 382,512 91 15,545 86 73,365 86<br />
In other states............. 52,380 10 40,697 9 37,869 9 2,366 13 12,451 15<br />
Average days per angler ...... 17 (X) 17 (X) 17 (X) 13 (X) 11 (X)<br />
(X) Not applicable.<br />
Note: Detail for participants does not add to total because <strong>of</strong> multiple responses. Percents shown are based on the respective ‘‘Total in U.S.’’ rows.<br />
U.S. Fish & <strong>Wildlife</strong> Service <strong>2006</strong> <strong>National</strong> <strong>Survey</strong> <strong>of</strong> <strong>Fishing</strong>, <strong>Hunting</strong>, <strong>and</strong> <strong>Wildlife</strong>-<strong>Associated</strong> Recreation 57
Table 3. Freshwater Anglers <strong>and</strong> Days <strong>of</strong> <strong>Fishing</strong> by Type <strong>of</strong> Fish: <strong>2006</strong><br />
(Population 16 years old <strong>and</strong> older. Numbers in thous<strong>and</strong>s. Excludes Great Lakes fishing)<br />
Type <strong>of</strong> fish<br />
Anglers<br />
Days <strong>of</strong> fishing<br />
Number Percent Number Percent<br />
Average days<br />
per angler<br />
Total, all types <strong>of</strong> fish............................ 25,035 100 419,942 100 17<br />
Black bass (largemouth, smallmouth, etc.) .......... 10,013 40 161,005 38 16<br />
White bass, striped bass <strong>and</strong> striped bass hybrids .... 4,751 19 65,211 16 14<br />
Panfish....................................... 7,534 30 101,569 24 13<br />
Crappie ...................................... 6,210 25 90,732 22 15<br />
Catfish <strong>and</strong> bullheads ........................... 6,954 28 98,190 23 14<br />
Walleye ...................................... 2,672 11 39,117 9 15<br />
Sauger ....................................... 244 1 2,875 1 12<br />
Northern pike, pickerel, muskie, muskie hybrids ..... 1,788 7 24,762 6 14<br />
Trout ........................................ 6,750 27 75,485 18 11<br />
Salmon ...................................... 937 4 8,643 2 9<br />
Steelhead..................................... 434 2 4,307 1 10<br />
Anything 1 .................................... 4,000 16 35,507 8 9<br />
Another type <strong>of</strong> freshwater fish................... 1,640 7 22,328 5 14<br />
1 Respondent fished for no specific species <strong>and</strong> identified ‘‘Anything’’ from a list <strong>of</strong> categories <strong>of</strong> fish.<br />
Note: Detail does not add to total because <strong>of</strong> multiple responses.<br />
Table 4. Great Lakes Anglers <strong>and</strong> Days <strong>of</strong> <strong>Fishing</strong> by Type <strong>of</strong> Fish: <strong>2006</strong><br />
(Population 16 years old <strong>and</strong> older. Numbers in thous<strong>and</strong>s)<br />
Type <strong>of</strong> fish<br />
Anglers<br />
Days <strong>of</strong> fishing<br />
Number Percent Number Percent<br />
Average days<br />
per angler<br />
Total, all types <strong>of</strong> fish............................ 1,420 100 18,016 100 13<br />
Black bass (largemouth, smallmouth, etc.) .......... 298 21 2,919 16 10<br />
Walleye, sauger................................ 480 34 4,890 27 10<br />
Northern pike, pickerel, muskie, muskie hybrids ..... *111 *8 *1,818 *10 *16<br />
Perch ........................................ 461 32 5,549 31 12<br />
Salmon ...................................... 418 29 5,659 31 14<br />
Steelhead..................................... 201 14 1,893 11 9<br />
Lake trout .................................... 328 23 4,427 25 13<br />
Other trout.................................... 170 12 2,231 12 13<br />
Anything 1 .................................... 214 15 1,628 9 8<br />
Another type <strong>of</strong> Great Lakes fish ................. *61 *4 *560 *3 *9<br />
* Estimate based on a sample size <strong>of</strong> 10–29.<br />
1 Respondent fished for no specific species <strong>and</strong> identified ‘‘Anything’’ from a list <strong>of</strong> categories <strong>of</strong> fish.<br />
Note: Detail does not add to total because <strong>of</strong> multiple responses.<br />
58 <strong>2006</strong> <strong>National</strong> <strong>Survey</strong> <strong>of</strong> <strong>Fishing</strong>, <strong>Hunting</strong>, <strong>and</strong> <strong>Wildlife</strong>-<strong>Associated</strong> Recreation U.S. Fish & <strong>Wildlife</strong> Service
Table 5. Saltwater Anglers <strong>and</strong> Days <strong>of</strong> <strong>Fishing</strong> by Type <strong>of</strong> Fish: <strong>2006</strong><br />
(Population 16 years old <strong>and</strong> older. Numbers in thous<strong>and</strong>s)<br />
Type <strong>of</strong> fish<br />
Anglers<br />
Days <strong>of</strong> fishing<br />
Number Percent Number Percent<br />
Average days<br />
per angler<br />
Total, all types <strong>of</strong> fish............................ 7,717 100 85,663 100 11<br />
Salmon ...................................... 582 8 3,379 4 6<br />
Striped bass................................... 1,424 18 15,411 18 11<br />
Flatfish (flounder, halibut) ....................... 2,069 27 20,478 24 10<br />
Bluefish...................................... 993 13 9,880 12 10<br />
Red drum (redfish) ............................. 1,831 24 20,247 24 11<br />
Sea trout (weakfish) ............................ 1,470 19 18,184 21 12<br />
Mackerel ..................................... 490 6 5,326 6 11<br />
Shellfish ..................................... 606 8 3,701 4 6<br />
Anything 1 .................................... 2,424 31 20,774 24 9<br />
Another type <strong>of</strong> saltwater fish .................... 2,547 33 28,591 33 11<br />
1 Respondent fished for no specific species <strong>and</strong> identified ‘‘Anything’’ from a list <strong>of</strong> categories <strong>of</strong> fish.<br />
Note: Detail does not add to total because <strong>of</strong> multiple responses.<br />
Table 6. Hunters, Trips, <strong>and</strong> Days <strong>of</strong> <strong>Hunting</strong> by Type <strong>of</strong> <strong>Hunting</strong>: <strong>2006</strong><br />
(Population 16 years old <strong>and</strong> older. Numbers in thous<strong>and</strong>s)<br />
Hunters, trips, <strong>and</strong> days<br />
<strong>of</strong> hunting<br />
Total, all hunting Big game Small game Migratory bird Other animals<br />
Number Percent Number Percent Number Percent Number Percent Number Percent<br />
HUNTERS<br />
Total in U.S. ............... 12,510 100 10,682 100 4,797 100 2,293 100 1,128 100<br />
In state <strong>of</strong> residence........ 11,971 96 10,258 96 4,473 93 2,179 95 1,078 96<br />
In other states............. 1,826 15 1,279 12 625 13 291 13 112 10<br />
TRIPS<br />
Total in U.S. ............... 185,399 100 115,255 100 40,856 100 16,390 100 12,898 100<br />
In state <strong>of</strong> residence........ 175,360 95 109,172 95 38,520 94 15,348 94 12,319 96<br />
In other states............. 10,039 5 6,083 5 2,336 6 1,042 6 579 4<br />
DAYS OF HUNTING<br />
Total in U.S. ............... 219,925 100 164,061 100 52,395 100 19,770 100 15,205 100<br />
In state <strong>of</strong> residence........ 203,319 92 151,978 93 48,650 93 17,561 89 14,386 95<br />
In other states............. 18,023 8 12,661 8 4,001 8 2,309 12 867 6<br />
Average days per hunter ...... 18 (X) 15 (X) 11 (X) 9 (X) 13 (X)<br />
(X) Not applicable.<br />
Note: Detail does not add to total because <strong>of</strong> multiple responses. Percents shown are based on the respective ‘‘Total in U.S.’’ rows.<br />
U.S. Fish & <strong>Wildlife</strong> Service <strong>2006</strong> <strong>National</strong> <strong>Survey</strong> <strong>of</strong> <strong>Fishing</strong>, <strong>Hunting</strong>, <strong>and</strong> <strong>Wildlife</strong>-<strong>Associated</strong> Recreation 59
Table 7. Hunters <strong>and</strong> Days <strong>of</strong> <strong>Hunting</strong> by Type <strong>of</strong> Game: <strong>2006</strong><br />
(Population 16 years old <strong>and</strong> older. Numbers in thous<strong>and</strong>s)<br />
Type <strong>of</strong> game<br />
Hunters<br />
Days <strong>of</strong> hunting<br />
Number Percent Number Percent<br />
Average days<br />
per hunter<br />
Total, all big game .............................. 10,682 100 164,061 100 15<br />
Deer. ........................................ 10,062 94 132,194 81 13<br />
Elk.......................................... 799 7 6,675 4 8<br />
Bear. ........................................ 399 4 3,471 2 9<br />
Wild turkey ................................... 2,569 24 25,828 16 10<br />
Other big game................................ 578 5 6,324 4 11<br />
Total, all small game ............................ 4,797 100 52,395 100 11<br />
Rabbit, hare................................... 1,923 40 20,513 39 11<br />
Quail ........................................ 1,046 22 7,688 15 7<br />
Grouse/prairie chicken .......................... 800 17 6,960 13 9<br />
Squirrel ...................................... 1,845 38 18,534 35 10<br />
Pheasant ..................................... 1,632 34 11,940 23 7<br />
Other small game .............................. 325 7 4,499 9 14<br />
Total, all migratory birds ........................ 2,293 100 19,770 100 9<br />
Waterfowl (geese <strong>and</strong>/or ducks)................... 1,306 57 13,071 66 10<br />
Geese...................................... 700 31 6,008 30 9<br />
Ducks ..................................... 1,147 50 12,173 62 11<br />
Doves ....................................... 1,238 54 5,893 30 5<br />
Other migratory bird............................ 150 7 1,052 5 7<br />
Total, all other animals (fox, raccoon, groundhog,<br />
etc.) .......................................... 1,128 100 15,205 100 13<br />
Note: Detail does not add to total because <strong>of</strong> multiple responses.<br />
60 <strong>2006</strong> <strong>National</strong> <strong>Survey</strong> <strong>of</strong> <strong>Fishing</strong>, <strong>Hunting</strong>, <strong>and</strong> <strong>Wildlife</strong>-<strong>Associated</strong> Recreation U.S. Fish & <strong>Wildlife</strong> Service
Table 8. Selected Characteristics <strong>of</strong> Anglers <strong>and</strong> Hunters: <strong>2006</strong><br />
(Population 16 years old <strong>and</strong> older. Numbers in thous<strong>and</strong>s)<br />
Characteristic<br />
U.S. population Sportspersons (fished or hunted) Fished only<br />
Number Percent Number<br />
Percent who<br />
participated Percent Number<br />
Percent who<br />
participated<br />
Percent<br />
Total persons ..................... 229,245 100 33,916 15 100 21,406 9 100<br />
Population Density <strong>of</strong> Residence<br />
Urban. ......................... 176,740 77 20,053 11 59 14,378 8 67<br />
Rural .......................... 52,504 23 13,863 26 41 7,028 13 33<br />
Population Size <strong>of</strong> Residence<br />
Metropolitan statistical area (MSA) . . . 190,425 83 24,178 13 71 16,393 9 77<br />
1,000,000 or more .............. 120,356 53 12,732 11 38 9,181 8 43<br />
250,000 to 999,999. ............. 46,506 20 6,569 14 19 4,427 10 21<br />
Less than ..................... 23,562 10 4,878 21 14 2,785 12 13<br />
Outside MSA .................... 38,820 17 9,738 25 29 5,014 13 23<br />
Census Geographic Division<br />
New Engl<strong>and</strong> .................... 11,233 5 1,353 12 4 979 9 5<br />
Middle Atlantic .................. 31,518 14 3,214 10 9 1,694 5 8<br />
East North Central ................ 35,609 16 5,975 17 18 3,599 10 17<br />
West North Central. ............... 15,458 7 3,836 25 11 2,056 13 10<br />
South Atlantic ................... 43,965 19 6,633 15 20 4,749 11 22<br />
East South Central ................ 13,722 6 2,689 20 8 1,588 12 7<br />
West South Central. ............... 25,407 11 4,499 18 13 2,689 11 13<br />
Mountain ....................... 15,651 7 2,372 15 7 1,504 10 7<br />
Pacific ......................... 36,681 16 3,345 9 10 2,548 7 12<br />
Age<br />
16to17years ................... 8,272 4 1,284 16 4 782 9 4<br />
18to24years ................... 23,292 10 2,655 11 8 1,687 7 8<br />
25to34years ................... 37,468 16 5,441 15 16 3,384 9 16<br />
35 to 44 years ................... 45,112 20 8,382 19 25 5,308 12 25<br />
45to54years ................... 44,209 19 7,608 17 22 4,738 11 22<br />
55 to 64 years ................... 32,867 14 5,229 16 15 3,377 10 16<br />
65 years <strong>and</strong> older ................ 38,024 17 3,317 9 10 2,131 6 10<br />
Sex<br />
Male, total ...................... 110,273 48 25,855 23 76 14,504 13 68<br />
16 to 17 years ................. 4,307 2 987 23 3 587 14 3<br />
18 to 24 years ................. 11,638 5 1,929 17 6 1,090 9 5<br />
25 to 34 years ................. 18,278 8 4,119 23 12 2,245 12 10<br />
35 to 44 years ................. 21,946 10 6,342 29 19 3,552 16 17<br />
45 to 54 years ................. 21,352 9 5,709 27 17 3,124 15 15<br />
55 to 64 years ................. 16,157 7 4,113 25 12 2,402 15 11<br />
65 years <strong>and</strong> older .............. 16,594 7 2,657 16 8 1,505 9 7<br />
Female, total .................... 118,972 52 8,061 7 24 6,902 6 32<br />
16 to 17 years ................. 3,965 2 297 7 1 196 5 1<br />
18 to 24 years ................. 11,655 5 726 6 2 597 5 3<br />
25 to 34 years ................. 19,189 8 1,323 7 4 1,139 6 5<br />
35 to 44 years ................. 23,166 10 2,040 9 6 1,755 8 8<br />
45 to 54 years ................. 22,857 10 1,899 8 6 1,614 7 8<br />
55 to 64 years ................. 16,710 7 1,116 7 3 975 6 5<br />
65 years <strong>and</strong> older .............. 21,430 9 659 3 2 626 3 3<br />
Ethnicity<br />
Hispanic ........................ 29,218 13 1,732 6 5 1,308 4 6<br />
Non-Hispanic .................... 200,027 87 32,184 16 95 20,098 10 94<br />
Race<br />
White .......................... 189,255 83 31,316 17 92 19,287 10 90<br />
Black .......................... 25,925 11 1,577 6 5 1,383 5 6<br />
Asian .......................... 10,104 4 344 3 1 294 3 1<br />
All others ....................... 3,960 2 680 17 2 442 11 2<br />
Annual Household Income<br />
Less than $10,000 ................ 10,673 5 807 8 2 584 5 3<br />
$10,000 to $19,999. ............... 15,373 7 1,590 10 5 1,010 7 5<br />
$20,000 to $24,999. ............... 11,374 5 1,555 14 5 1,069 9 5<br />
$25,000 to $29,999. ............... 10,524 5 1,503 14 4 936 9 4<br />
$30,000 to $34,999. ............... 11,161 5 1,759 16 5 1,022 9 5<br />
$35,000 to $39,999. ............... 10,349 5 1,794 17 5 1,124 11 5<br />
$40,000 to $49,999. ............... 17,699 8 3,167 18 9 1,958 11 9<br />
$50,000 to $74,999. ............... 33,434 15 6,811 20 20 4,057 12 19<br />
$75,000 to $99,999. ............... 21,519 9 4,676 22 14 2,937 14 14<br />
$100,000 or more. ................ 29,159 13 5,671 19 17 3,694 13 17<br />
Not reported. .................... 57,981 25 4,583 8 14 3,015 5 14<br />
Education<br />
11 years or less .................. 34,621 15 4,587 13 14 2,862 8 13<br />
12 years ........................ 78,073 34 11,837 15 35 6,941 9 32<br />
1 to 3 years college ............... 53,019 23 8,595 16 25 5,360 10 25<br />
4 years college ................... 39,506 17 5,652 14 17 3,902 10 18<br />
5 years or more college ............ 24,025 10 3,245 14 10 2,342 10 11<br />
See footnotes at end <strong>of</strong> table.<br />
U.S. Fish & <strong>Wildlife</strong> Service <strong>2006</strong> <strong>National</strong> <strong>Survey</strong> <strong>of</strong> <strong>Fishing</strong>, <strong>Hunting</strong>, <strong>and</strong> <strong>Wildlife</strong>-<strong>Associated</strong> Recreation 61
Table 8. Selected Characteristics <strong>of</strong> Anglers <strong>and</strong> Hunters: <strong>2006</strong>—Continued<br />
(Population 16 years old <strong>and</strong> older. Numbers in thous<strong>and</strong>s)<br />
Characteristic<br />
Number<br />
Hunted only<br />
Percent who<br />
participated Percent Number<br />
Fished <strong>and</strong> hunted<br />
Percent who<br />
participated<br />
Percent<br />
Total persons ..................... 3,964 2 100 8,546 4 100<br />
Population Density <strong>of</strong> Residence<br />
Urban. ......................... 1,750 1 44 3,925 2 46<br />
Rural .......................... 2,213 4 56 4,621 9 54<br />
Population Size <strong>of</strong> Residence<br />
Metropolitan statistical area (MSA) . . . 2,364 1 60 5,422 3 63<br />
1,000,000 or more .............. 996 1 25 2,554 2 30<br />
250,000 to 999,999. ............. 680 1 17 1,462 3 17<br />
Less than 249,999. .............. 687 3 17 1,405 6 16<br />
Outside MSA .................... 1,600 4 40 3,124 8 37<br />
Census Geographic Division<br />
New Engl<strong>and</strong> .................... 107 1 3 267 2 3<br />
Middle Atlantic .................. 664 2 17 856 3 10<br />
East North Central ................ 785 2 20 1,591 4 19<br />
West North Central. ............... 552 4 14 1,228 8 14<br />
South Atlantic ................... 516 1 13 1,368 3 16<br />
East South Central ................ 253 2 6 848 6 10<br />
West South Central. ............... 547 2 14 1,263 5 15<br />
Mountain ....................... 288 2 7 580 4 7<br />
Pacific ......................... 252 1 6 546 1 6<br />
Age<br />
16 to 17 years ................... 181 2 5 321 4 4<br />
18 to 24 years ................... 249 1 6 719 3 8<br />
25 to 34 years ................... 584 2 15 1,474 4 17<br />
35 to 44 years ................... 906 2 23 2,168 5 25<br />
45 to 54 years ................... 960 2 24 1,910 4 22<br />
55 to 64 years ................... 613 2 15 1,239 4 15<br />
65 years <strong>and</strong> older ................ 470 1 12 716 2 8<br />
Sex<br />
Male, total ...................... 3,518 3 89 7,833 7 92<br />
16 to 17 years ................. 134 3 3 266 6 3<br />
18 to 24 years ................. 219 2 6 621 5 7<br />
25 to 34 years ................. 512 3 13 1,362 7 16<br />
35 to 44 years ................. 814 4 21 1,976 9 23<br />
45 to 54 years ................. 850 4 21 1,735 8 20<br />
55 to 64 years ................. 536 3 14 1,174 7 14<br />
65 years <strong>and</strong> older .............. 453 3 11 699 4 8<br />
Female, total .................... 445 (Z) 11 713 1 8<br />
16 to 17 years ................. *47 *1 *1 *54 *1 *1<br />
18 to 24 years ................. *30 *(Z) *1 98 1 1<br />
25 to 34 years ................. *72 *(Z) *2 112 1 1<br />
35 to 44 years ................. 92 (Z) 2 193 1 2<br />
45 to 54 years ................. 110 (Z) 3 175 1 2<br />
55 to 64 years ................. *76 *(Z) *2 *65 *(Z) *1<br />
65 years <strong>and</strong> older .............. ... ... ... *16 *(Z) *(Z)<br />
Ethnicity<br />
Hispanic ........................ 157 1 4 268 1 3<br />
Non-Hispanic .................... 3,807 2 96 8,278 4 97<br />
Race<br />
White .......................... 3,825 2 97 8,203 4 96<br />
Black .......................... *62 *(Z) *2 132 1 2<br />
Asian .......................... *20 *(Z) *1 *30 *(Z) *(Z)<br />
All others ....................... *56 *1 *1 181 5 2<br />
Annual Household Income<br />
Less than $10,000 ................ *73 *1 *2 150 1 2<br />
$10,000 to $19,999. ............... 209 1 5 371 2 4<br />
$20,000 to $24,999. ............... 127 1 3 359 3 4<br />
$25,000 to $29,999. ............... 184 2 5 382 4 4<br />
$30,000 to $34,999. ............... 249 2 6 487 4 6<br />
$35,000 to $39,999. ............... 252 2 6 418 4 5<br />
$40,000 to $49,999. ............... 401 2 10 808 5 9<br />
$50,000 to $74,999. ............... 830 2 21 1,924 6 23<br />
$75,000 to $99,999. ............... 602 3 15 1,137 5 13<br />
$100,000 or more. ................ 504 2 13 1,473 5 17<br />
Not reported. .................... 532 1 13 1,036 2 12<br />
Education<br />
11 years or less .................. 547 2 14 1,178 3 14<br />
12 years ........................ 1,571 2 40 3,325 4 39<br />
1 to 3 years college ............... 1,004 2 25 2,231 4 26<br />
4 years college ................... 538 1 14 1,213 3 14<br />
5 years or more college ............ 304 1 8 599 2 7<br />
* Estimate based on a sample size <strong>of</strong> 10–29. ... Sample size too small to report data reliably. (Z) Less than 0.5 percent.<br />
Note: Percent who participated shows the percent <strong>of</strong> each row’s population who participated in the activity named by the column. Percent columns show the percent <strong>of</strong> each column’s<br />
participants who are described by the row heading.<br />
62 <strong>2006</strong> <strong>National</strong> <strong>Survey</strong> <strong>of</strong> <strong>Fishing</strong>, <strong>Hunting</strong>, <strong>and</strong> <strong>Wildlife</strong>-<strong>Associated</strong> Recreation U.S. Fish & <strong>Wildlife</strong> Service
Table 9. Selected Characteristics <strong>of</strong> Anglers by Type <strong>of</strong> <strong>Fishing</strong>: <strong>2006</strong><br />
(Population 16 years old <strong>and</strong> older. Numbers in thous<strong>and</strong>s)<br />
Characteristic<br />
U.S. population Total, all fishing Total freshwater<br />
Number Percent Number<br />
Percent who<br />
participated Percent Number<br />
Percent who<br />
participated<br />
Percent<br />
Total persons ..................... 229,245 100 29,952 13 100 25,431 11 100<br />
Population Density <strong>of</strong> Residence<br />
Urban. ......................... 176,740 77 18,303 10 61 14,814 8 58<br />
Rural .......................... 52,504 23 11,649 22 39 10,617 20 42<br />
Population Size <strong>of</strong> Residence<br />
Metropolitan statistical area (MSA) . . . 190,425 83 21,815 11 73 17,936 9 71<br />
1,000,000 or more .............. 120,356 53 11,735 10 39 9,250 8 36<br />
250,000 to 999,999. ............. 46,506 20 5,889 13 20 4,925 11 19<br />
Less than 249,999. .............. 23,562 10 4,190 18 14 3,761 16 15<br />
Outside MSA .................... 38,820 17 8,138 21 27 7,496 19 29<br />
Census Geographic Division<br />
New Engl<strong>and</strong> .................... 11,233 5 1,246 11 4 937 8 4<br />
Middle Atlantic .................. 31,518 14 2,550 8 9 1,848 6 7<br />
East North Central ................ 35,609 16 5,190 15 17 4,818 14 19<br />
West North Central. ............... 15,458 7 3,284 21 11 3,248 21 13<br />
South Atlantic ................... 43,965 19 6,116 14 20 4,661 11 18<br />
East South Central ................ 13,722 6 2,436 18 8 2,315 17 9<br />
West South Central. ............... 25,407 11 3,952 16 13 3,251 13 13<br />
Mountain ....................... 15,651 7 2,084 13 7 2,028 13 8<br />
Pacific ......................... 36,681 16 3,094 8 10 2,326 6 9<br />
Age<br />
16to17years ................... 8,272 4 1,103 13 4 992 12 4<br />
18to24years ................... 23,292 10 2,406 10 8 2,158 9 8<br />
25to34years ................... 37,468 16 4,857 13 16 4,190 11 16<br />
35 to 44 years ................... 45,112 20 7,476 17 25 6,266 14 25<br />
45to54years ................... 44,209 19 6,647 15 22 5,612 13 22<br />
55 to 64 years ................... 32,867 14 4,616 14 15 3,818 12 15<br />
65 years <strong>and</strong> older ................ 38,024 17 2,847 7 10 2,395 6 9<br />
Sex<br />
Male. .......................... 110,273 48 22,337 20 75 19,053 17 75<br />
Female ......................... 118,972 52 7,615 6 25 6,378 5 25<br />
Ethnicity<br />
Hispanic ........................ 29,218 13 1,576 5 5 1,158 4 5<br />
Non-Hispanic .................... 200,027 87 28,377 14 95 24,274 12 95<br />
Race<br />
White .......................... 189,255 83 27,490 15 92 23,416 12 92<br />
Black .......................... 25,925 11 1,515 6 5 1,265 5 5<br />
Asian .......................... 10,104 4 324 3 1 241 2 1<br />
All others ....................... 3,960 2 624 16 2 510 13 2<br />
Annual Household Income<br />
Less than $10,000 ................ 10,673 5 733 7 2 642 6 3<br />
$10,000 to $19,999. ............... 15,373 7 1,380 9 5 1,260 8 5<br />
$20,000 to $24,999. ............... 11,374 5 1,427 13 5 1,203 11 5<br />
$25,000 to $29,999. ............... 10,524 5 1,319 13 4 1,192 11 5<br />
$30,000 to $34,999. ............... 11,161 5 1,510 14 5 1,385 12 5<br />
$35,000 to $39,999. ............... 10,349 5 1,543 15 5 1,375 13 5<br />
$40,000 to $49,999. ............... 17,699 8 2,766 16 9 2,339 13 9<br />
$50,000 to $74,999. ............... 33,434 15 5,981 18 20 5,222 16 21<br />
$75,000 to $99,999. ............... 21,519 9 4,074 19 14 3,344 16 13<br />
$100,000 or more. ................ 29,159 13 5,167 18 17 4,063 14 16<br />
Not reported. .................... 57,981 25 4,051 7 14 3,406 6 13<br />
Education<br />
11 years or less .................. 34,621 15 4,040 12 13 3,588 10 14<br />
12 years ........................ 78,073 34 10,266 13 34 8,833 11 35<br />
1 to 3 years college ............... 53,019 23 7,590 14 25 6,439 12 25<br />
4 years college ................... 39,506 17 5,115 13 17 4,146 10 16<br />
5 years or more college ............ 24,025 10 2,941 12 10 2,425 10 10<br />
See footnotes at end <strong>of</strong> table.<br />
U.S. Fish & <strong>Wildlife</strong> Service <strong>2006</strong> <strong>National</strong> <strong>Survey</strong> <strong>of</strong> <strong>Fishing</strong>, <strong>Hunting</strong>, <strong>and</strong> <strong>Wildlife</strong>-<strong>Associated</strong> Recreation 63
Table 9. Selected Characteristics <strong>of</strong> Anglers by Type <strong>of</strong> <strong>Fishing</strong>: <strong>2006</strong>—Continued<br />
(Population 16 years old <strong>and</strong> older. Numbers in thous<strong>and</strong>s)<br />
Characteristic<br />
Freshwater, except Great Lakes<br />
Number<br />
Freshwater<br />
Percent<br />
who<br />
participated<br />
Percent Number<br />
Great Lakes<br />
Percent<br />
who<br />
participated<br />
Percent Number<br />
Saltwater<br />
Percent<br />
who<br />
participated<br />
Percent<br />
Total persons ..................... 25,035 11 100 1,420 1 100 7,717 3 100<br />
Population Density <strong>of</strong> Residence<br />
Urban. ......................... 14,545 8 58 952 1 67 5,739 3 74<br />
Rural .......................... 10,490 20 42 468 1 33 1,979 4 26<br />
Population Size <strong>of</strong> Residence<br />
Metropolitan statistical area (MSA) . . . 17,606 9 70 1,133 1 80 6,664 3 86<br />
1,000,000 or more .............. 9,037 8 36 718 1 51 4,063 3 53<br />
250,000 to 999,999. ............. 4,840 10 19 269 1 19 1,734 4 22<br />
Less than 249,999. .............. 3,729 16 15 146 1 10 866 4 11<br />
Outside MSA ................... 7,429 19 30 287 1 20 1,053 3 14<br />
Census Geographic Division<br />
New Engl<strong>and</strong> .................... 935 8 4 *11 *(Z) *1 588 5 8<br />
Middle Atlantic .................. 1,770 6 7 297 1 21 901 3 12<br />
East North Central ................ 4,515 13 18 981 3 69 212 1 3<br />
West North Central. ............... 3,244 21 13 *67 *(Z) *5 80 1 1<br />
South Atlantic ................... 4,660 11 19 *20 *(Z) *1 2,784 6 36<br />
East South Central ................ 2,313 17 9 ... ... ... 315 2 4<br />
West South Central. ............... 3,251 13 13 ... ... ... 1,391 5 18<br />
Mountain ....................... 2,028 13 8 ... ... ... 167 1 2<br />
Pacific ......................... 2,318 6 9 ... ... ... 1,280 3 17<br />
Age<br />
16 to 17 years ................... 981 12 4 ... ... ... 185 2 2<br />
18 to 24 years ................... 2,133 9 9 *103 *(Z) *7 542 2 7<br />
25 to 34 years ................... 4,119 11 16 234 1 16 1,352 4 18<br />
35 to 44 years ................... 6,184 14 25 377 1 27 2,010 4 26<br />
45 to 54 years ................... 5,515 12 22 268 1 19 1,751 4 23<br />
55 to 64 years ................... 3,730 11 15 301 1 21 1,214 4 16<br />
65 years <strong>and</strong> older ................ 2,373 6 9 *94 *(Z) *7 664 2 9<br />
Sex<br />
Male. .......................... 18,723 17 75 1,198 1 84 5,992 5 78<br />
Female ......................... 6,312 5 25 222 (Z) 16 1,726 1 22<br />
Ethnicity<br />
Hispanic ........................ 1,140 4 5 ... ... ... 699 2 9<br />
Non-Hispanic .................... 23,895 12 95 1,395 1 98 7,018 4 91<br />
Race<br />
White .......................... 23,054 12 92 1,290 1 91 6,897 4 89<br />
Black .......................... 1,230 5 5 *69 *(Z) *5 478 2 6<br />
Asian .......................... 241 2 1 ... ... ... 171 2 2<br />
All others ....................... 510 13 2 ... ... ... 171 4 2<br />
Annual Household Income<br />
Less than $10,000 ................ 621 6 2 ... ... ... 102 1 1<br />
$10,000 to $19,999. ............... 1,242 8 5 ... ... ... 195 1 3<br />
$20,000 to $24,999. ............... 1,192 10 5 ... ... ... 295 3 4<br />
$25,000 to $29,999. ............... 1,169 11 5 *46 *(Z) *3 246 2 3<br />
$30,000 to $34,999. ............... 1,373 12 5 *43 *(Z) *3 212 2 3<br />
$35,000 to $39,999. ............... 1,350 13 5 *91 *1 *6 346 3 4<br />
$40,000 to $49,999. ............... 2,313 13 9 148 1 10 676 4 9<br />
$50,000 to $74,999. ............... 5,136 15 21 345 1 24 1,397 4 18<br />
$75,000 to $99,999. ............... 3,287 15 13 226 1 16 1,311 6 17<br />
$100,000 or more. ................ 4,005 14 16 218 1 15 1,904 7 25<br />
Not reported. .................... 3,349 6 13 188 (Z) 13 1,034 2 13<br />
Education<br />
11 years or less .................. 3,503 10 14 *174 *1 *12 757 2 10<br />
12 years ........................ 8,723 11 35 432 1 30 2,409 3 31<br />
1 to 3 years college ............... 6,340 12 25 367 1 26 2,071 4 27<br />
4 years college ................... 4,065 10 16 287 1 20 1,574 4 20<br />
5 years or more college ............ 2,403 10 10 160 1 11 906 4 12<br />
* Estimate based on a sample size <strong>of</strong> 10–29. ... Sample size too small to report data reliably. (Z) Less than 0.5 percent.<br />
Note: Percent who participated shows the percent <strong>of</strong> each row’s population who participated in the activity named by the column (the percent <strong>of</strong> those living in urban areas who<br />
fished in the Great Lakes, etc.). Percent columns show the percent <strong>of</strong> each column’s participants who are described by the row heading (the percent <strong>of</strong> those Great Lakes<br />
anglers who lived in urban areas, etc.).<br />
64 <strong>2006</strong> <strong>National</strong> <strong>Survey</strong> <strong>of</strong> <strong>Fishing</strong>, <strong>Hunting</strong>, <strong>and</strong> <strong>Wildlife</strong>-<strong>Associated</strong> Recreation U.S. Fish & <strong>Wildlife</strong> Service
Table 10. Selected Characteristics <strong>of</strong> Hunters by Type <strong>of</strong> <strong>Hunting</strong>: <strong>2006</strong><br />
(Population 16 years old <strong>and</strong> older. Numbers in thous<strong>and</strong>s)<br />
Characteristic<br />
U.S. population Total, all hunting Big game<br />
Number Percent Number<br />
Percent who<br />
participated Percent Number<br />
Percent who<br />
participated<br />
Percent<br />
Total persons ..................... 229,245 100 12,510 5 100 10,682 5 100<br />
Population Density <strong>of</strong> Residence<br />
Urban. ......................... 176,740 77 5,675 3 45 4,598 3 43<br />
Rural .......................... 52,504 23 6,835 13 55 6,085 12 57<br />
Population Size <strong>of</strong> Residence<br />
Metropolitan statistical area (MSA) . . . 190,425 83 7,785 4 62 6,478 3 61<br />
1,000,000 or more .............. 120,356 53 3,551 3 28 2,936 2 27<br />
250,000 to 999,999. ............. 46,506 20 2,143 5 17 1,774 4 17<br />
Less than 249,999. .............. 23,562 10 2,092 9 17 1,768 8 17<br />
Outside MSA .................... 38,820 17 4,724 12 38 4,205 11 39<br />
Census Geographic Division<br />
New Engl<strong>and</strong> .................... 11,233 5 374 3 3 340 3 3<br />
Middle Atlantic .................. 31,518 14 1,520 5 12 1,447 5 14<br />
East North Central ................ 35,609 16 2,376 7 19 2,134 6 20<br />
West North Central. ............... 15,458 7 1,779 12 14 1,359 9 13<br />
South Atlantic ................... 43,965 19 1,884 4 15 1,620 4 15<br />
East South Central ................ 13,722 6 1,101 8 9 986 7 9<br />
West South Central. ............... 25,407 11 1,810 7 14 1,511 6 14<br />
Mountain ....................... 15,651 7 868 6 7 669 4 6<br />
Pacific ......................... 36,681 16 798 2 6 616 2 6<br />
Age<br />
16to17years ................... 8,272 4 501 6 4 438 5 4<br />
18to24years ................... 23,292 10 968 4 8 815 4 8<br />
25to34years ................... 37,468 16 2,058 5 16 1,864 5 17<br />
35 to 44 years ................... 45,112 20 3,074 7 25 2,660 6 25<br />
45to54years ................... 44,209 19 2,870 6 23 2,404 5 23<br />
55 to 64 years ................... 32,867 14 1,852 6 15 1,527 5 14<br />
65 years <strong>and</strong> older ................ 38,024 17 1,186 3 9 973 3 9<br />
Sex<br />
Male. .......................... 110,273 48 11,351 10 91 9,670 9 91<br />
Female ......................... 118,972 52 1,159 1 9 1,013 1 9<br />
Ethnicity<br />
Hispanic ........................ 29,218 13 424 1 3 337 1 3<br />
Non-Hispanic .................... 200,027 87 12,085 6 97 10,345 5 97<br />
Race<br />
White .......................... 189,255 83 12,028 6 96 10,281 5 96<br />
Black .......................... 25,925 11 194 1 2 158 1 1<br />
Asian .......................... 10,104 4 50 (Z) (Z) *37 *(Z) *(Z)<br />
All others ....................... 3,960 2 238 6 2 207 5 2<br />
Annual Household Income<br />
Less than $10,000 ................ 10,673 5 223 2 2 192 2 2<br />
$10,000 to $19,999. ............... 15,373 7 580 4 5 522 3 5<br />
$20,000 to $24,999. ............... 11,374 5 486 4 4 437 4 4<br />
$25,000 to $29,999. ............... 10,524 5 567 5 5 492 5 5<br />
$30,000 to $34,999. ............... 11,161 5 737 7 6 659 6 6<br />
$35,000 to $39,999. ............... 10,349 5 670 6 5 568 5 5<br />
$40,000 to $49,999. ............... 17,699 8 1,209 7 10 1,042 6 10<br />
$50,000 to $74,999. ............... 33,434 15 2,754 8 22 2,418 7 23<br />
$75,000 to $99,999. ............... 21,519 9 1,739 8 14 1,435 7 13<br />
$100,000 or more. ................ 29,159 13 1,977 7 16 1,544 5 14<br />
Not reported. .................... 57,981 25 1,568 3 13 1,375 2 13<br />
Education<br />
11 years or less .................. 34,621 15 1,724 5 14 1,543 4 14<br />
12 years ........................ 78,073 34 4,896 6 39 4,335 6 41<br />
1 to 3 years college ............... 53,019 23 3,235 6 26 2,784 5 26<br />
4 years college ................... 39,506 17 1,750 4 14 1,346 3 13<br />
5 years or more college ............ 24,025 10 904 4 7 674 3 6<br />
See footnotes at end <strong>of</strong> table.<br />
U.S. Fish & <strong>Wildlife</strong> Service <strong>2006</strong> <strong>National</strong> <strong>Survey</strong> <strong>of</strong> <strong>Fishing</strong>, <strong>Hunting</strong>, <strong>and</strong> <strong>Wildlife</strong>-<strong>Associated</strong> Recreation 65
Table 10. Selected Characteristics <strong>of</strong> Hunters by Type <strong>of</strong> <strong>Hunting</strong>: <strong>2006</strong>—Continued<br />
(Population 16 years old <strong>and</strong> older. Numbers in thous<strong>and</strong>s)<br />
Small game Migratory bird Other animals<br />
Characteristic<br />
Number<br />
Percent<br />
who<br />
participated<br />
Percent Number<br />
Percent<br />
who<br />
participated<br />
Percent Number<br />
Percent<br />
who<br />
participated<br />
Percent<br />
Total persons ..................... 4,797 2 100 2,293 1 100 1,128 (Z) 100<br />
Population Density <strong>of</strong> Residence<br />
Urban. ......................... 2,186 1 46 1,268 1 55 370 (Z) 33<br />
Rural .......................... 2,611 5 54 1,025 2 45 758 1 67<br />
Population Size <strong>of</strong> Residence<br />
Metropolitan statistical area (MSA) . . . 2,942 2 61 1,570 1 68 594 (Z) 53<br />
1,000,000 or more .............. 1,347 1 28 767 1 33 281 (Z) 25<br />
250,000 to 999,999. ............. 832 2 17 423 1 18 153 (Z) 14<br />
Less than 249,999. .............. 762 3 16 380 2 17 160 1 14<br />
Outside MSA .................... 1,855 5 39 723 2 32 534 1 47<br />
Census Geographic Division<br />
New Engl<strong>and</strong> .................... 129 1 3 52 (Z) 2 28 (Z) 2<br />
Middle Atlantic .................. 520 2 11 *116 *(Z) *5 191 1 17<br />
East North Central ................ 886 2 18 284 1 12 146 (Z) 13<br />
West North Central. ............... 865 6 18 279 2 12 150 1 13<br />
South Atlantic ................... 731 2 15 320 1 14 164 (Z) 15<br />
East South Central ................ 405 3 8 214 2 9 98 1 9<br />
West South Central. ............... 638 3 13 641 3 28 211 1 19<br />
Mountain ....................... 343 2 7 165 1 7 65 (Z) 6<br />
Pacific ......................... 279 1 6 223 1 10 75 (Z) 7<br />
Age<br />
16 to 17 years ................... 144 2 3 75 1 3 *38 *(Z) *3<br />
18 to 24 years ................... 419 2 9 182 1 8 150 1 13<br />
25 to 34 years ................... 811 2 17 436 1 19 252 1 22<br />
35 to 44 years ................... 1,204 3 25 642 1 28 249 1 22<br />
45 to 54 years ................... 1,151 3 24 458 1 20 190 (Z) 17<br />
55 to 64 years ................... 635 2 13 359 1 16 147 (Z) 13<br />
65 years <strong>and</strong> older ................ 431 1 9 141 (Z) 6 103 (Z) 9<br />
Sex<br />
Male. .......................... 4,520 4 94 2,162 2 94 1,059 1 94<br />
Female ......................... 277 (Z) 6 131 (Z) 6 69 (Z) 6<br />
Ethnicity<br />
Hispanic ........................ 203 1 4 118 (Z) 5 *36 *(Z) *3<br />
Non-Hispanic .................... 4,594 2 96 2,176 1 95 1,092 1 97<br />
Race<br />
White .......................... 4,596 2 96 2,239 1 98 1,079 1 96<br />
Black .......................... 105 (Z) 2 ... ... ... ... ... ...<br />
Asian .......................... *26 *(Z) *1 ... ... ... ... ... ...<br />
All others ....................... *70 *2 *1 *37 *1 *2 *24 *1 *2<br />
Annual Household Income<br />
Less than $10,000 ................ 77 1 2 *27 *(Z) *1 ... ... ...<br />
$10,000 to $19,999. ............... 206 1 4 *57 *(Z) *2 *70 *(Z) *6<br />
$20,000 to $24,999. ............... 166 1 3 *73 *1 *3 *26 *(Z) *2<br />
$25,000 to $29,999. ............... 207 2 4 *53 *1 *2 *69 *1 *6<br />
$30,000 to $34,999. ............... 328 3 7 134 1 6 *65 *1 *6<br />
$35,000 to $39,999. ............... 245 2 5 103 1 4 *75 *1 *7<br />
$40,000 to $49,999. ............... 465 3 10 204 1 9 131 1 12<br />
$50,000 to $74,999. ............... 996 3 21 503 2 22 258 1 23<br />
$75,000 to $99,999. ............... 710 3 15 419 2 18 151 1 13<br />
$100,000 or more. ................ 858 3 18 514 2 22 165 1 15<br />
Not reported. .................... 539 1 11 207 (Z) 9 110 (Z) 10<br />
Education<br />
11 years or less .................. 603 2 13 200 1 9 164 (Z) 15<br />
12 years ........................ 1,789 2 37 733 1 32 460 1 41<br />
1 to 3 years college ............... 1,242 2 26 644 1 28 340 1 30<br />
4 years college ................... 741 2 15 455 1 20 103 (Z) 9<br />
5 years or more college ............ 421 2 9 261 1 11 61 (Z) 5<br />
* Estimate based on a sample size <strong>of</strong> 10–29. ... Sample size too small to report data reliably. (Z) Less than 0.5 percent.<br />
Note: Percent who participated shows the percent <strong>of</strong> each row’s population who participated in the activity named by the column (the percent <strong>of</strong> those living in urban areas who<br />
hunted big game, etc.). Percent columns show the percent <strong>of</strong> each column’s participants who are described by the row heading (the percent <strong>of</strong> big game hunters who lived in<br />
urban areas, etc.).<br />
66 <strong>2006</strong> <strong>National</strong> <strong>Survey</strong> <strong>of</strong> <strong>Fishing</strong>, <strong>Hunting</strong>, <strong>and</strong> <strong>Wildlife</strong>-<strong>Associated</strong> Recreation U.S. Fish & <strong>Wildlife</strong> Service
Table 11. Summary <strong>of</strong> Expenditures for <strong>Fishing</strong> <strong>and</strong> <strong>Hunting</strong>: <strong>2006</strong><br />
(Population 16 years old <strong>and</strong> older)<br />
Expenditures<br />
Spenders<br />
Expenditure item<br />
Amount<br />
(thous<strong>and</strong>s<br />
<strong>of</strong> dollars)<br />
Average per<br />
sportsperson<br />
(dollars)<br />
Number<br />
(thous<strong>and</strong>s)<br />
Percent <strong>of</strong><br />
sportspersons<br />
Average per<br />
spender<br />
(dollars)<br />
Total, all items.................................. 76,650,027 2,260 32,567 96 2,354<br />
TRIP-RELATED EXPENDITURES<br />
Total trip-related................................ 24,557,174 724 30,201 89 813<br />
Food <strong>and</strong> lodging, total .......................... 9,093,769 268 26,381 78 345<br />
Food ........................................ 6,504,319 192 26,242 77 248<br />
Lodging...................................... 2,589,450 76 6,465 19 401<br />
Transportation, total ............................ 7,658,755 226 26,611 78 288<br />
Public ....................................... 738,243 22 1,509 4 489<br />
Private ....................................... 6,920,512 204 26,239 77 264<br />
Other trip costs 1 ................................ 7,804,650 230 23,416 69 333<br />
EQUIPMENT EXPENDITURES<br />
<strong>Fishing</strong> equipment ............................... 5,365,933 158 19,337 57 277<br />
<strong>Hunting</strong> equipment ............................... 5,716,758 169 10,107 30 566<br />
Auxiliary equipment 2 ............................. 2,969,992 88 9,749 29 305<br />
Special equipment 3 ............................... 26,910,442 793 3,203 9 8,402<br />
OTHER EXPENDITURES<br />
Books, magazines ................................ 304,181 9 6,759 20 45<br />
Membership dues <strong>and</strong> contributions ................. 593,242 17 4,481 13 132<br />
L<strong>and</strong> leasing <strong>and</strong> ownership........................ 8,986,342 265 2,226 7 4,038<br />
Licenses, stamps, tags, <strong>and</strong> permits.................. 1,245,963 37 22,607 67 55<br />
1 Other trip costs include guide fees, pack trip or package fees, public <strong>and</strong> private l<strong>and</strong> use fees, equipment rental, boating costs (which include launching, mooring,<br />
storage, maintenance, insurance, pumpout fees, <strong>and</strong> fuel), bait, ice, <strong>and</strong> heating <strong>and</strong> cooking fuel.<br />
2 Auxiliary equipment includes camping equipment, binoculars, special fishing <strong>and</strong> hunting clothing, etc.<br />
3 Special equipment includes boats, campers, cabins, trail bikes, etc.<br />
Note: Detail does not add to total because <strong>of</strong> multiple responses. Detail in subsequent tables may not add to totals shown here because <strong>of</strong> nonresponse to individual<br />
questions.<br />
U.S. Fish & <strong>Wildlife</strong> Service <strong>2006</strong> <strong>National</strong> <strong>Survey</strong> <strong>of</strong> <strong>Fishing</strong>, <strong>Hunting</strong>, <strong>and</strong> <strong>Wildlife</strong>-<strong>Associated</strong> Recreation 67
Table 12. Expenditures for <strong>Fishing</strong>: <strong>2006</strong><br />
(Population 16 years old <strong>and</strong> older)<br />
Expenditures<br />
Spenders<br />
Expenditure item<br />
Amount<br />
(thous<strong>and</strong>s<br />
<strong>of</strong> dollars)<br />
Average per<br />
angler<br />
(dollars)<br />
Number<br />
(thous<strong>and</strong>s)<br />
Percent <strong>of</strong><br />
anglers<br />
Average per<br />
spender<br />
(dollars)<br />
Total, all items ........................................ 42,011,124 1,403 28,307 95 1,484<br />
TRIP-RELATED EXPENDITURES<br />
Total trip-related ...................................... 17,878,560 597 26,318 88 679<br />
Food <strong>and</strong> lodging, total ................................. 6,302,524 210 22,572 75 279<br />
Food ............................................... 4,327,090 144 22,415 75 193<br />
Lodging ............................................ 1,975,434 66 5,304 18 372<br />
Transportation, total ................................... 4,961,830 166 22,361 75 222<br />
Public .............................................. 523,856 17 1,163 4 451<br />
Private.............................................. 4,437,974 148 21,979 73 202<br />
Other trip costs, total .................................. 6,614,205 221 22,275 74 297<br />
Guide fees, pack trip or package fees..................... 832,476 28 2,307 8 361<br />
Public l<strong>and</strong> use fees ................................... 176,803 6 3,339 11 53<br />
Private l<strong>and</strong> use fees .................................. 143,543 5 1,041 3 138<br />
Equipment rental ..................................... 377,334 13 1,645 5 229<br />
Boating costs 1 ........................................ 3,408,623 114 7,405 25 460<br />
Bait ................................................ 1,183,332 40 18,224 61 65<br />
Ice................................................. 378,190 13 11,168 37 34<br />
Heating <strong>and</strong> cooking fuel .............................. 113,904 4 3,195 11 36<br />
EQUIPMENT EXPENDITURES<br />
<strong>Fishing</strong> equipment, total ................................ 5,332,401 178 19,082 64 279<br />
Rods, reels, poles, <strong>and</strong> rodmaking components ............. 2,288,572 76 10,666 36 215<br />
Lines <strong>and</strong> leaders ..................................... 543,186 18 11,886 40 46<br />
Artificial lures, flies, baits, <strong>and</strong> dressing for flies or lines..... 906,951 30 13,624 45 67<br />
Hooks, sinkers, swivels, <strong>and</strong> other items attached to a line,<br />
except lures <strong>and</strong> baits ................................ 387,836 13 13,885 46 28<br />
Tackle boxes......................................... 127,197 4 3,819 13 33<br />
Creels, stringers, fish bags, l<strong>and</strong>ing nets, <strong>and</strong> gaff hooks ..... 107,108 4 3,154 11 34<br />
Minnow traps, seines, <strong>and</strong> bait containers ................. 61,267 2 2,481 8 25<br />
Depth finders, fish finders, <strong>and</strong> other electronic fishing<br />
devices ............................................ 514,423 17 1,140 4 451<br />
Ice fishing equipment ................................. 105,335 4 663 2 159<br />
Other fishing equipment ............................... 290,524 10 3,069 10 95<br />
Auxiliary equipment, total .............................. 778,740 26 3,837 13 203<br />
Camping equipment ................................... 404,240 13 1,756 6 230<br />
Binoculars, field glasses, telescopes, etc. .................. 42,639 1 414 1 103<br />
Special fishing clothing, rubber boots, waders, <strong>and</strong> foul<br />
weather gear ........................................ 239,687 8 1,971 7 122<br />
Processing <strong>and</strong> taxidermy costs.......................... 42,183 1 188 1 225<br />
Other............................................... 49,992 2 392 1 128<br />
Special equipment 2 ..................................... 12,646,229 422 1,818 6 6,957<br />
OTHER EXPENDITURES<br />
Magazines, books....................................... 115,019 4 2,944 10 39<br />
Membership dues <strong>and</strong> contributions ........................ 157,728 5 1,423 5 111<br />
L<strong>and</strong> leasing <strong>and</strong> ownership .............................. 4,598,988 154 768 3 5,987<br />
Licenses, stamps, tags, <strong>and</strong> permits, total.................... 503,460 17 16,259 54 31<br />
Licenses ............................................ 460,266 15 15,650 52 29<br />
Stamps, tags, <strong>and</strong> permits .............................. 43,194 1 3,011 10 14<br />
1 Boating costs include launching, mooring, storage, maintenance, insurance, pumpout fees, <strong>and</strong> fuel.<br />
2 Special equipment includes boats, campers, cabins, trail bikes, etc.<br />
Note: Detail does not add to total because <strong>of</strong> multiple responses. Detail in tables 13 to 16 may not add to totals shown here because <strong>of</strong> multiple responses <strong>and</strong><br />
nonresponse.<br />
68 <strong>2006</strong> <strong>National</strong> <strong>Survey</strong> <strong>of</strong> <strong>Fishing</strong>, <strong>Hunting</strong>, <strong>and</strong> <strong>Wildlife</strong>-<strong>Associated</strong> Recreation U.S. Fish & <strong>Wildlife</strong> Service
Table 13. Trip <strong>and</strong> Equipment Expenditures for Freshwater <strong>Fishing</strong>: <strong>2006</strong><br />
(Population 16 years old <strong>and</strong> older)<br />
Expenditures<br />
Spenders<br />
Expenditure item<br />
Amount<br />
(thous<strong>and</strong>s<br />
<strong>of</strong> dollars)<br />
Average per<br />
angler<br />
(dollars)<br />
Number<br />
(thous<strong>and</strong>s)<br />
Percent <strong>of</strong><br />
anglers<br />
Average per<br />
spender<br />
(dollars)<br />
Total, all items ........................................ 26,348,217 1,036 23,414 92 1,125<br />
TRIP-RELATED EXPENDITURES<br />
Total trip-related ...................................... 12,587,930 495 22,713 89 554<br />
Food <strong>and</strong> lodging, total ................................. 4,609,923 181 19,364 76 238<br />
Food ............................................... 3,287,225 129 19,246 76 171<br />
Lodging ............................................ 1,322,697 52 4,278 17 309<br />
Transportation, total ................................... 3,905,885 154 19,204 76 203<br />
Public .............................................. 304,895 12 771 3 395<br />
Private.............................................. 3,600,990 142 18,901 74 191<br />
Other trip costs, total .................................. 4,072,123 160 18,877 74 216<br />
Guide fees, pack trip or package fees..................... 308,275 12 1,235 5 250<br />
Public l<strong>and</strong> use fees ................................... 147,629 6 2,862 11 52<br />
Private l<strong>and</strong> use fees .................................. 84,679 3 817 3 104<br />
Equipment rental ..................................... 221,286 9 1,176 5 188<br />
Boating costs 1 ........................................ 2,094,418 82 6,005 24 349<br />
Bait ................................................ 844,211 33 15,646 62 54<br />
Ice................................................. 269,037 11 9,131 36 29<br />
Heating <strong>and</strong> cooking fuel .............................. 102,587 4 2,878 11 36<br />
EQUIPMENT EXPENDITURES<br />
<strong>Fishing</strong> equipment, total ................................ 3,575,227 141 15,286 60 234<br />
Rods, reels, poles, <strong>and</strong> rodmaking components ............. 1,531,910 60 8,214 32 187<br />
Lines <strong>and</strong> leaders ..................................... 377,652 15 9,107 36 41<br />
Artificial lures, flies, baits, <strong>and</strong> dressing for flies or lines. .... 679,266 27 10,854 43 63<br />
Hooks, sinkers, swivels, <strong>and</strong> other items attached to a line,<br />
except lures <strong>and</strong> baits ................................ 273,047 11 10,823 43 25<br />
Tackle boxes......................................... 92,173 4 2,854 11 32<br />
Creels, stringers, fish bags, l<strong>and</strong>ing nets, <strong>and</strong> gaff hooks ..... 64,423 3 2,228 9 29<br />
Minnow traps, seines, <strong>and</strong> bait containers ................. 38,202 2 1,741 7 22<br />
Depth finders, fish finders, <strong>and</strong> other electronic fishing<br />
devices ............................................ 280,597 11 806 3 348<br />
Ice fishing equipment ................................. 100,437 4 635 2 158<br />
Other fishing equipment ............................... 137,522 5 2,055 8 67<br />
Auxiliary equipment, total .............................. 621,657 24 3,085 12 201<br />
Camping equipment ................................... 342,465 13 1,522 6 225<br />
Binoculars, field glasses, telescopes, etc. .................. 27,233 1 250 1 109<br />
Special fishing clothing, rubber boots, waders, <strong>and</strong> foul<br />
weather gear ........................................ 183,947 7 1,536 6 120<br />
Processing <strong>and</strong> taxidermy costs.......................... 34,127 1 156 1 219<br />
Other............................................... 33,884 1 287 1 118<br />
Special equipment 2 ..................................... 9,563,402 376 1,444 6 6,622<br />
1 Boating costs include launching, mooring, storage, maintenance, insurance, pumpout fees, <strong>and</strong> fuel.<br />
2 Special equipment includes boats, campers, cabins, trail bikes, etc.<br />
Note: Detail does not add to total because <strong>of</strong> multiple responses.<br />
U.S. Fish & <strong>Wildlife</strong> Service <strong>2006</strong> <strong>National</strong> <strong>Survey</strong> <strong>of</strong> <strong>Fishing</strong>, <strong>Hunting</strong>, <strong>and</strong> <strong>Wildlife</strong>-<strong>Associated</strong> Recreation 69
Table 14. Trip <strong>and</strong> Equipment Expenditures for Freshwater <strong>Fishing</strong>, Except Great Lakes: <strong>2006</strong><br />
(Population 16 years old <strong>and</strong> over)<br />
Expenditures<br />
Spenders<br />
Expenditure item<br />
Amount<br />
(thous<strong>and</strong>s<br />
<strong>of</strong> dollars)<br />
Average per<br />
angler<br />
(dollars)<br />
Number<br />
(thous<strong>and</strong>s)<br />
Percent <strong>of</strong><br />
anglers<br />
Average per<br />
spender<br />
(dollars)<br />
Total, all items ........................................ 24,581,671 982 22,898 91 1,074<br />
TRIP-RELATED EXPENDITURES<br />
Total trip-related ...................................... 11,521,818 460 22,193 89 519<br />
Food <strong>and</strong> lodging, total ................................. 4,235,176 169 18,902 76 224<br />
Food ............................................... 3,038,376 121 18,789 75 162<br />
Lodging ............................................ 1,196,800 48 4,055 16 295<br />
Transportation, total ................................... 3,667,944 147 18,737 75 196<br />
Public .............................................. 281,318 11 728 3 386<br />
Private.............................................. 3,386,626 135 18,442 74 184<br />
Other trip costs, total .................................. 3,618,698 145 18,380 73 197<br />
Guide fees, pack trip or package fees..................... 272,634 11 1,075 4 254<br />
Public l<strong>and</strong> use fees ................................... 140,129 6 2,793 11 50<br />
Private l<strong>and</strong> use fees .................................. 67,391 3 763 3 88<br />
Equipment rental ..................................... 209,491 8 1,086 4 193<br />
Boating costs 1 ........................................ 1,798,118 72 5,697 23 316<br />
Bait ................................................ 785,113 31 15,260 61 51<br />
Ice................................................. 250,365 10 8,842 35 28<br />
Heating <strong>and</strong> cooking fuel .............................. 95,458 4 2,825 11 34<br />
EQUIPMENT EXPENDITURES<br />
<strong>Fishing</strong> equipment, total ................................ 3,361,439 134 14,803 59 227<br />
Rods, reels, poles, <strong>and</strong> rodmaking components ............. 1,447,041 58 7,922 32 183<br />
Lines <strong>and</strong> leaders ..................................... 349,449 14 8,798 35 40<br />
Artificial lures, flies, baits, <strong>and</strong> dressing for flies or lines..... 648,870 26 10,454 42 62<br />
Hooks, sinkers, swivels, <strong>and</strong> other items attached to a line,<br />
except lures <strong>and</strong> baits ................................ 257,959 10 10,464 42 25<br />
Tackle boxes......................................... 89,756 4 2,762 11 32<br />
Creels, stringers, fish bags, l<strong>and</strong>ing nets, <strong>and</strong> gaff hooks ..... 60,014 2 2,131 9 28<br />
Minnow traps, seines, <strong>and</strong> bait containers ................. 37,016 1 1,658 7 22<br />
Depth finders, fish finders, <strong>and</strong> other electronic fishing<br />
devices ............................................ 259,122 10 746 3 347<br />
Ice fishing equipment ................................. 81,329 3 566 2 144<br />
Other fishing equipment ............................... 130,885 5 1,951 8 67<br />
Auxiliary equipment, total .............................. 600,558 24 2,956 12 203<br />
Camping equipment ................................... 337,021 13 1,472 6 229<br />
Binoculars, field glasses, telescopes, etc. .................. 26,365 1 243 1 109<br />
Special fishing clothing, rubber boots, waders, <strong>and</strong> foul<br />
weather gear ........................................ 174,772 7 1,466 6 119<br />
Processing <strong>and</strong> taxidermy costs.......................... 32,581 1 133 1 244<br />
Other............................................... 29,820 1 276 1 108<br />
Special equipment 2 ..................................... 9,097,856 363 1,409 6 6,457<br />
1 Boating costs include launching, mooring, storage, maintenance, insurance, pumpout fees, <strong>and</strong> fuel.<br />
2 Special equipment includes boats, campers, cabins, trail bikes, etc.<br />
Note: Detail does not add to total because <strong>of</strong> multiple responses.<br />
70 <strong>2006</strong> <strong>National</strong> <strong>Survey</strong> <strong>of</strong> <strong>Fishing</strong>, <strong>Hunting</strong>, <strong>and</strong> <strong>Wildlife</strong>-<strong>Associated</strong> Recreation U.S. Fish & <strong>Wildlife</strong> Service
Table 15. Trip <strong>and</strong> Equipment Expenditures for Great Lakes <strong>Fishing</strong>: <strong>2006</strong><br />
(Population 16 years old <strong>and</strong> older)<br />
Expenditures<br />
Spenders<br />
Expenditure item<br />
Amount<br />
(thous<strong>and</strong>s<br />
<strong>of</strong> dollars)<br />
Average per<br />
angler<br />
(dollars)<br />
Number<br />
(thous<strong>and</strong>s)<br />
Percent <strong>of</strong><br />
anglers<br />
Average per<br />
spender<br />
(dollars)<br />
Total, all items ........................................ 1,507,656 1,062 1,346 95 1,120<br />
TRIP-RELATED EXPENDITURES<br />
Total trip-related ...................................... 1,066,113 751 1,315 93 811<br />
Food <strong>and</strong> lodging, total ................................. 374,747 264 1,102 78 340<br />
Food ............................................... 248,849 175 1,092 77 228<br />
Lodging ............................................ 125,897 89 305 21 413<br />
Transportation, total ................................... 237,941 168 1,168 82 204<br />
Public .............................................. *23,577 *17 *85 *6 *277<br />
Private.............................................. 214,365 151 1,116 79 192<br />
Other trip costs, total .................................. 453,424 319 1,131 80 401<br />
Guide fees, pack trip or package fees..................... 35,641 25 172 12 207<br />
Public l<strong>and</strong> use fees ................................... 7,501 5 91 6 82<br />
Private l<strong>and</strong> use fees .................................. *17,288 *12 *58 *4 *299<br />
Equipment rental ..................................... *11,795 *8 *93 *7 *127<br />
Boating costs 1 ........................................ 296,300 209 476 34 622<br />
Bait ................................................ 59,098 42 856 60 69<br />
Ice................................................. 18,671 13 544 38 34<br />
Heating <strong>and</strong> cooking fuel .............................. 7,129 5 89 6 80<br />
EQUIPMENT EXPENDITURES<br />
<strong>Fishing</strong> equipment, total ................................ 165,403 116 521 37 317<br />
Rods, reels, poles, <strong>and</strong> rodmaking components ............. 54,602 38 259 18 210<br />
Lines <strong>and</strong> leaders ..................................... 23,081 16 246 17 94<br />
Artificial lures, flies, baits, <strong>and</strong> dressing for flies or lines. .... 23,673 17 358 25 66<br />
Hooks, sinkers, swivels, <strong>and</strong> other items attached to a line,<br />
except lures <strong>and</strong> baits ................................ 13,639 10 316 22 43<br />
Tackle boxes......................................... *1,827 *1 *67 *5 *27<br />
Creels, stringers, fish bags, l<strong>and</strong>ing nets, <strong>and</strong> gaff hooks ..... *4,110 *3 *84 *6 *49<br />
Minnow traps, seines, <strong>and</strong> bait containers ................. *1,049 *1 *75 *5 *14<br />
Depth finders, fish finders, <strong>and</strong> other electronic fishing<br />
devices ............................................ *20,140 *14 *51 *4 *392<br />
Ice fishing equipment ................................. ... ... ... ... ...<br />
Other fishing equipment ............................... *6,420 *5 *96 *7 *67<br />
Auxiliary equipment, total .............................. 18,386 13 117 8 157<br />
Camping equipment ................................... ... ... ... ... ...<br />
Binoculars, field glasses, telescopes, etc. .................. ... ... ... ... ...<br />
Special fishing clothing, rubber boots, waders, <strong>and</strong> foul<br />
weather gear ........................................ *8,427 *6 *63 *4 *134<br />
Processing <strong>and</strong> taxidermy costs.......................... ... ... ... ... ...<br />
Other............................................... ... ... ... ... ...<br />
Special equipment 2 ..................................... *257,754 *182 *16 *1 *15,675<br />
* Estimate based on a sample size <strong>of</strong> 10–29. ... Sample size too small to report data reliably.<br />
1 Boating costs include launching, mooring, storage, maintenance, insurance, pumpout fees, <strong>and</strong> fuel.<br />
2 Special equipment includes boats, campers, cabins, trail bikes, etc.<br />
Note: Detail does not add to total because <strong>of</strong> multiple responses.<br />
U.S. Fish & <strong>Wildlife</strong> Service <strong>2006</strong> <strong>National</strong> <strong>Survey</strong> <strong>of</strong> <strong>Fishing</strong>, <strong>Hunting</strong>, <strong>and</strong> <strong>Wildlife</strong>-<strong>Associated</strong> Recreation 71
Table 16. Trip <strong>and</strong> Equipment Expenditures for Saltwater <strong>Fishing</strong>: <strong>2006</strong><br />
(Population 16 years old <strong>and</strong> older)<br />
Expenditures<br />
Spenders<br />
Expenditure item<br />
Amount<br />
(thous<strong>and</strong>s<br />
<strong>of</strong> dollars<br />
Average per<br />
angler<br />
(dollars)<br />
Number<br />
(thous<strong>and</strong>s)<br />
Percent <strong>of</strong><br />
anglers<br />
Average per<br />
spender<br />
(dollars)<br />
Total, all items ........................................ 8,879,948 1,151 6,836 89 1,299<br />
TRIP-RELATED EXPENDITURES<br />
Total trip-related ...................................... 5,290,630 686 6,730 87 786<br />
Food <strong>and</strong> lodging, total ................................. 1,692,602 219 5,895 76 287<br />
Food ............................................... 1,039,865 135 5,803 75 179<br />
Lodging ............................................ 652,737 85 1,372 18 476<br />
Transportation, total ................................... 1,055,945 137 5,551 72 190<br />
Public .............................................. 218,961 28 446 6 491<br />
Private.............................................. 836,984 108 5,304 69 158<br />
Other trip costs, total .................................. 2,542,083 329 5,821 75 437<br />
Guide fees, pack trip or package fees..................... 524,202 68 1,236 16 424<br />
Public l<strong>and</strong> use fees ................................... 29,173 4 635 8 46<br />
Private l<strong>and</strong> use fees .................................. 58,864 8 251 3 235<br />
Equipment rental ..................................... 156,048 20 559 7 279<br />
Boating costs 1 ........................................ 1,314,205 170 1,845 24 712<br />
Bait ................................................ 339,122 44 4,228 55 80<br />
Ice................................................. 109,153 14 3,200 41 34<br />
Heating <strong>and</strong> cooking fuel .............................. 11,317 1 436 6 26<br />
EQUIPMENT EXPENDITURES<br />
<strong>Fishing</strong> equipment, total ................................ 1,266,978 164 3,163 41 401<br />
Rods, reels, poles, <strong>and</strong> rodmaking components ............. 530,540 69 1,644 21 323<br />
Lines <strong>and</strong> leaders ..................................... 121,970 16 2,045 26 60<br />
Artificial lures, flies, baits, <strong>and</strong> dressing for flies or lines..... 156,892 20 1,886 24 83<br />
Hooks, sinkers, swivels, <strong>and</strong> other items attached to a line,<br />
except lures <strong>and</strong> baits ................................ 84,690 11 2,230 29 38<br />
Tackle boxes......................................... 20,389 3 541 7 38<br />
Creels, stringers, fish bags, l<strong>and</strong>ing nets, <strong>and</strong> gaff hooks ..... 33,666 4 640 8 53<br />
Minnow traps, seines, <strong>and</strong> bait containers ................. 16,382 2 467 6 35<br />
Depth finders, fish finders, <strong>and</strong> other electronic fishing<br />
devices ............................................ 178,220 23 218 3 817<br />
Other fishing equipment ............................... 124,229 16 703 9 177<br />
Auxiliary equipment, total .............................. 108,267 14 551 7 197<br />
Camping equipment ................................... 37,924 5 148 2 256<br />
Binoculars, field glasses, telescopes, etc. .................. 13,918 2 134 2 104<br />
Special fishing clothing, rubber boots, waders, <strong>and</strong> foul<br />
weather gear ........................................ 35,647 5 308 4 116<br />
Processing <strong>and</strong> taxidermy costs.......................... *7,173 *1 *27 *(Z) *264<br />
Other............................................... 13,605 2 67 1 202<br />
Special equipment 2 ..................................... 2,214,073 287 262 3 8,454<br />
* Estimate based on a sample size <strong>of</strong> 10–29. (Z) Less than 0.5 percent.<br />
1 Boating costs include launching, mooring, storage, maintenance, insurance, pumpout fees, <strong>and</strong> fuel.<br />
2 Special equipment includes boats, campers, cabins, trail bikes, etc.<br />
Note: Detail does not add to total because <strong>of</strong> multiple responses.<br />
72 <strong>2006</strong> <strong>National</strong> <strong>Survey</strong> <strong>of</strong> <strong>Fishing</strong>, <strong>Hunting</strong>, <strong>and</strong> <strong>Wildlife</strong>-<strong>Associated</strong> Recreation U.S. Fish & <strong>Wildlife</strong> Service
Table 17. Expenditures for <strong>Hunting</strong>: <strong>2006</strong><br />
(Population 16 years old <strong>and</strong> older)<br />
Expenditures<br />
Spenders<br />
Expenditure item<br />
Amount<br />
(thous<strong>and</strong>s<br />
<strong>of</strong> dollars)<br />
Average per<br />
hunter<br />
(dollars)<br />
Number<br />
(thous<strong>and</strong>s)<br />
Percent<br />
<strong>of</strong> hunters<br />
Average per<br />
spender<br />
(dollars)<br />
Total, all items ........................................ 22,893,156 1,830 12,153 97 1,884<br />
TRIP-RELATED EXPENDITURES<br />
Total trip-related ...................................... 6,678,614 534 10,828 87 617<br />
Food <strong>and</strong> lodging, total ................................. 2,791,245 223 9,567 76 292<br />
Food ............................................... 2,177,229 174 9,533 76 228<br />
Lodging ............................................ 614,016 49 1,599 13 384<br />
Transportation, total ................................... 2,696,924 216 10,064 80 268<br />
Public .............................................. 214,387 17 401 3 535<br />
Private.............................................. 2,482,537 198 9,982 80 249<br />
Other trip costs, total .................................. 1,190,445 95 3,416 27 348<br />
Guide fees, pack trip or package fees..................... 416,529 33 557 4 748<br />
Public l<strong>and</strong> use fees ................................... 47,268 4 564 5 84<br />
Private l<strong>and</strong> use fees .................................. 396,810 32 711 6 558<br />
Equipment rental ..................................... 80,729 6 313 2 258<br />
Boating costs 1 ........................................ 102,255 8 459 4 223<br />
Heating <strong>and</strong> cooking fuel .............................. 146,853 12 2,132 17 69<br />
EQUIPMENT EXPENDITURES<br />
<strong>Hunting</strong> equipment, total ............................... 5,366,357 429 9,287 74 578<br />
Guns <strong>and</strong> rifles....................................... 2,452,285 196 2,992 24 820<br />
Rifles ............................................ 1,119,900 90 1,625 13 689<br />
Shotguns .......................................... 765,423 61 1,320 11 580<br />
Muzzleloaders, primitive firearms...................... 184,157 15 531 4 347<br />
Pistols, h<strong>and</strong>guns ................................... 382,805 31 636 5 602<br />
Bows, arrows, archery equipment ........................ 674,117 54 1,940 16 348<br />
Telescopic sights ..................................... 404,866 32 1,471 12 275<br />
Decoys <strong>and</strong> game calls ................................ 187,141 15 2,074 17 90<br />
Ammunition ......................................... 696,451 56 7,995 64 87<br />
H<strong>and</strong> loading equipment ............................... 140,072 11 929 7 151<br />
<strong>Hunting</strong> dogs <strong>and</strong> associated costs ....................... 493,659 39 780 6 633<br />
Other............................................... 317,765 25 2,312 18 137<br />
Auxiliary equipment, total .............................. 1,330,216 106 4,196 34 317<br />
Camping equipment ................................... 141,920 11 538 4 264<br />
Binoculars, field glasses, telescopes, etc. .................. 203,606 16 968 8 210<br />
Special hunting clothing, rubber boots, waders, <strong>and</strong> foul<br />
weather gear ........................................ 459,823 37 2,743 22 168<br />
Processing <strong>and</strong> taxidermy costs.......................... 485,153 39 1,496 12 324<br />
Other............................................... 39,714 3 290 2 137<br />
Special equipment 2 ..................................... 4,034,928 323 505 4 7,993<br />
OTHER EXPENDITURES<br />
Magazines, books....................................... 83,524 7 1,767 14 47<br />
Membership dues <strong>and</strong> contributions ........................ 269,660 22 1,707 14 158<br />
L<strong>and</strong> leasing <strong>and</strong> ownership .............................. 4,387,354 351 1,606 13 2,732<br />
Licenses, stamps, tags, <strong>and</strong> permits, total.................... 742,503 59 9,862 79 75<br />
Licenses ............................................ 619,511 50 9,506 76 65<br />
Federal duck stamps .................................. 22,934 2 1,529 12 15<br />
Other stamps, tags, <strong>and</strong> permits ......................... 100,058 8 2,689 21 37<br />
1 Boating costs include launching, mooring, storage, maintenance, insurance, pumpout fees, <strong>and</strong> fuel.<br />
2 Special equipment includes boats, campers, cabins, trail bikes, etc.<br />
Note: Detail does not add to total because <strong>of</strong> multiple responses. Detail in tables 18 to 21 may not add to totals shown here because <strong>of</strong> multiple responses <strong>and</strong><br />
nonresponse.<br />
U.S. Fish & <strong>Wildlife</strong> Service <strong>2006</strong> <strong>National</strong> <strong>Survey</strong> <strong>of</strong> <strong>Fishing</strong>, <strong>Hunting</strong>, <strong>and</strong> <strong>Wildlife</strong>-<strong>Associated</strong> Recreation 73
Table 18. Trip <strong>and</strong> Equipment Expenditures for Big Game <strong>Hunting</strong>: <strong>2006</strong><br />
(Population 16 years old <strong>and</strong> older)<br />
Expenditures<br />
Spenders<br />
Expenditure item<br />
Amount<br />
(thous<strong>and</strong>s<br />
<strong>of</strong> dollars)<br />
Average per<br />
hunter<br />
(dollars)<br />
Number<br />
(thous<strong>and</strong>s)<br />
Percent<br />
<strong>of</strong> hunters<br />
Average per<br />
spender<br />
(dollars)<br />
Total, all items ........................................ 11,754,122 1,100 9,813 92 1,198<br />
TRIP-RELATED EXPENDITURES<br />
Total trip-related ...................................... 4,648,341 435 9,192 86 506<br />
Food <strong>and</strong> lodging, total ................................. 1,967,680 184 8,066 76 244<br />
Food ............................................... 1,555,229 146 8,039 75 193<br />
Lodging ............................................ 412,451 39 1,205 11 342<br />
Transportation, total ................................... 1,812,575 170 8,481 79 214<br />
Public .............................................. 119,956 11 263 2 457<br />
Private.............................................. 1,692,619 158 8,410 79 201<br />
Other trip costs, total .................................. 868,086 81 2,689 25 323<br />
Guide fees, pack trip or package fees..................... 333,018 31 356 3 936<br />
Public l<strong>and</strong> use fees ................................... 28,061 3 387 4 73<br />
Private l<strong>and</strong> use fees .................................. 291,460 27 514 5 567<br />
Equipment rental ..................................... 47,420 4 198 2 239<br />
Boating costs 1 ........................................ 47,671 4 197 2 242<br />
Heating <strong>and</strong> cooking fuel .............................. 120,456 11 1,886 18 64<br />
EQUIPMENT EXPENDITURES<br />
<strong>Hunting</strong> equipment, total ............................... 2,986,381 280 6,583 62 454<br />
Firearms ............................................ 1,308,890 123 1,802 17 726<br />
Rifles ............................................ 809,254 76 1,117 10 724<br />
Shotguns .......................................... 192,840 18 406 4 475<br />
Muzzleloaders ..................................... 179,833 17 516 5 348<br />
Pistols, h<strong>and</strong>guns ................................... 126,964 12 166 2 767<br />
Bows, arrows, archery equipment ........................ 628,426 59 1,795 17 350<br />
Telescopic sights ..................................... 307,014 29 1,102 10 279<br />
Decoys <strong>and</strong> game calls ................................ 72,923 7 1,239 12 59<br />
Ammunition ......................................... 311,362 29 4,757 45 65<br />
H<strong>and</strong> loading equipment ............................... 78,053 7 677 6 115<br />
<strong>Hunting</strong> dogs <strong>and</strong> associated costs ....................... 77,271 7 109 1 709<br />
Other............................................... 202,442 19 1,526 14 133<br />
Auxiliary equipment, total .............................. 1,073,737 101 3,443 32 312<br />
Camping equipment ................................... 119,309 11 445 4 268<br />
Binoculars, field glasses, telescopes, etc. .................. 166,775 16 808 8 207<br />
Special hunting clothing, rubber boots, waders, <strong>and</strong> foul<br />
weather gear ........................................ 337,850 32 2,035 19 166<br />
Processing <strong>and</strong> taxidermy costs.......................... 422,181 40 1,353 13 312<br />
Other............................................... 27,621 3 175 2 158<br />
Special equipment 2 ..................................... 3,045,663 285 390 4 7,809<br />
1 Boating costs include launching, mooring, storage, maintenance, insurance, pumpout fees, <strong>and</strong> fuel.<br />
2 Special equipment includes boats, campers, cabins, trail bikes, etc.<br />
Note: Detail does not add to total because <strong>of</strong> multiple responses.<br />
74 <strong>2006</strong> <strong>National</strong> <strong>Survey</strong> <strong>of</strong> <strong>Fishing</strong>, <strong>Hunting</strong>, <strong>and</strong> <strong>Wildlife</strong>-<strong>Associated</strong> Recreation U.S. Fish & <strong>Wildlife</strong> Service
Table 19. Trip <strong>and</strong> Equipment Expenditures for Small Game <strong>Hunting</strong>: <strong>2006</strong><br />
(Population 16 years old <strong>and</strong> older)<br />
Expenditures<br />
Spenders<br />
Expenditure item<br />
Amount<br />
(thous<strong>and</strong>s<br />
<strong>of</strong> dollars)<br />
Average per<br />
hunter<br />
(dollars)<br />
Number<br />
(thous<strong>and</strong>s)<br />
Percent<br />
<strong>of</strong> hunters<br />
Average per<br />
spender<br />
(dollars)<br />
Total, all items ........................................ 2,365,778 493 4,027 84 587<br />
TRIP-RELATED EXPENDITURES<br />
Total trip-related ...................................... 1,196,318 249 3,783 79 316<br />
Food <strong>and</strong> lodging, total ................................. 510,922 107 3,211 67 159<br />
Food ............................................... 371,352 77 3,193 67 116<br />
Lodging ............................................ 139,569 29 427 9 327<br />
Transportation, total ................................... 534,603 111 3,364 70 159<br />
Public .............................................. 75,173 16 128 3 588<br />
Private.............................................. 459,430 96 3,290 69 140<br />
Other trip costs, total .................................. 150,793 31 850 18 177<br />
Guide fees, pack trip or package fees..................... 56,869 12 171 4 333<br />
Public l<strong>and</strong> use fees ................................... 7,362 2 174 4 42<br />
Private l<strong>and</strong> use fees .................................. 38,405 8 148 3 260<br />
Equipment rental ..................................... *19,811 *4 *87 *2 *227<br />
Boating costs 1 ........................................ 10,513 2 71 1 148<br />
Heating <strong>and</strong> cooking fuel .............................. 17,833 4 428 9 42<br />
EQUIPMENT EXPENDITURES<br />
<strong>Hunting</strong> equipment, total ............................... 776,420 162 2,032 42 382<br />
Firearms ............................................ 364,087 76 597 12 610<br />
Rifles ............................................ 123,341 26 217 5 569<br />
Shotguns .......................................... 203,440 42 369 8 552<br />
Muzzleloaders ..................................... ... ... ... ... ...<br />
Pistols, h<strong>and</strong>guns ................................... 36,270 8 72 2 503<br />
Bows, arrows, archery equipment ........................ *5,698 *1 *24 *1 *237<br />
Telescopic sights ..................................... 35,948 7 146 3 247<br />
Decoys <strong>and</strong> game calls ................................ 11,737 2 190 4 62<br />
Ammunition ......................................... 93,878 20 1,461 30 64<br />
H<strong>and</strong> loading equipment ............................... 25,228 5 100 2 253<br />
<strong>Hunting</strong> dogs <strong>and</strong> associated costs ....................... 219,403 46 355 7 617<br />
Other............................................... 20,442 4 210 4 97<br />
Auxiliary equipment, total .............................. 61,988 13 332 7 187<br />
Camping equipment ................................... *9,229 *2 *30 *1 *308<br />
Binoculars, field glasses, telescopes, etc. .................. *6,418 *1 *46 *1 *141<br />
Special hunting clothing, rubber boots, waders, <strong>and</strong> foul<br />
weather gear ........................................ 23,340 5 227 5 103<br />
Processing <strong>and</strong> taxidermy costs.......................... *17,161 *4 *24 *1 *703<br />
Other............................................... *5,840 *1 *51 *1 *115<br />
Special equipment 2 ..................................... *331,052 *69 *30 *1 *11,193<br />
* Estimate based on a sample size <strong>of</strong> 10–29. ... Sample size too small to report data reliably.<br />
1 Boating costs include launching, mooring, storage, maintenance, insurance, pumpout fees, <strong>and</strong> fuel.<br />
2 Special equipment includes boats, campers, cabins, trail bikes, etc.<br />
Note: Detail does not add to total because <strong>of</strong> multiple responses.<br />
U.S. Fish & <strong>Wildlife</strong> Service <strong>2006</strong> <strong>National</strong> <strong>Survey</strong> <strong>of</strong> <strong>Fishing</strong>, <strong>Hunting</strong>, <strong>and</strong> <strong>Wildlife</strong>-<strong>Associated</strong> Recreation 75
Table 20. Trip <strong>and</strong> Equipment Expenditures for Migratory Bird <strong>Hunting</strong>: <strong>2006</strong><br />
(Population 16 years old <strong>and</strong> older)<br />
Expenditures<br />
Spenders<br />
Expenditure item<br />
Amount<br />
(thous<strong>and</strong>s<br />
<strong>of</strong> dollars)<br />
Average per<br />
hunter<br />
(dollars)<br />
Number<br />
(thous<strong>and</strong>s)<br />
Percent<br />
<strong>of</strong> hunters<br />
Average per<br />
spender<br />
(dollars)<br />
Total, all items ........................................ 1,349,148 588 2,001 87 674<br />
TRIP-RELATED EXPENDITURES<br />
Total trip-related ...................................... 691,288 301 1,895 83 365<br />
Food <strong>and</strong> lodging, total ................................. 260,690 114 1,650 72 158<br />
Food ............................................... 203,473 89 1,650 72 123<br />
Lodging ............................................ 57,217 25 202 9 283<br />
Transportation, total ................................... *265,875 *116 *1,716 *75 *155<br />
Public .............................................. *14,771 *6 *57 *2 *258<br />
Private.............................................. *251,104 *110 *1,699 *74 *148<br />
Other trip costs, total .................................. 164,723 72 577 25 285<br />
Guide fees, pack trip or package fees..................... 25,267 11 89 4 284<br />
Public l<strong>and</strong> use fees ................................... 11,452 5 120 5 96<br />
Private l<strong>and</strong> use fees .................................. 65,155 28 92 4 707<br />
Equipment rental ..................................... *12,396 *5 *39 *2 *319<br />
Boating costs 1 ........................................ 43,721 19 250 11 175<br />
Heating <strong>and</strong> cooking fuel .............................. 6,732 3 153 7 44<br />
EQUIPMENT EXPENDITURES<br />
<strong>Hunting</strong> equipment, total ............................... 416,107 181 1,029 45 404<br />
Firearms ............................................ 156,615 68 221 10 709<br />
Rifles ............................................ ... ... ... ... ...<br />
Shotguns .......................................... 143,235 62 216 9 662<br />
Muzzleloaders ..................................... ... ... ... ... ...<br />
Pistols, h<strong>and</strong>guns ................................... ... ... ... ... ...<br />
Bows, arrows, archery equipment ........................ ... ... ... ... ...<br />
Telescopic sights ..................................... ... ... ... ... ...<br />
Decoys <strong>and</strong> game calls ................................ 72,570 32 361 16 201<br />
Ammunition ......................................... 88,432 39 745 33 119<br />
H<strong>and</strong> loading equipment ............................... *1,640 *1 *24 *1 *69<br />
<strong>Hunting</strong> dogs <strong>and</strong> associated costs ....................... 79,707 35 153 7 521<br />
Other............................................... 17,072 7 127 6 135<br />
Auxiliary equipment, total .............................. 67,708 30 247 11 274<br />
Camping equipment ................................... ... ... ... ... ...<br />
Binoculars, field glasses, telescopes, etc. .................. *7,429 *3 *26 *1 *291<br />
Special hunting clothing, rubber boots, waders, <strong>and</strong> foul<br />
weather gear ........................................ 37,940 17 180 8 211<br />
Processing <strong>and</strong> taxidermy costs.......................... *19,274 *8 *59 *3 *326<br />
Other............................................... ... ... ... ... ...<br />
Special equipment 2 ..................................... *174,045 *76 *51 *2 *3,394<br />
* Estimate based on a sample size <strong>of</strong> 10–29. ... Sample size too small to report data reliably.<br />
1 Boating costs include launching, mooring, storage, maintenance, insurance, pumpout fees, <strong>and</strong> fuel.<br />
2 Special equipment includes boats, campers, cabins, trail bikes, etc.<br />
Note: Detail does not add to total because <strong>of</strong> multiple responses.<br />
76 <strong>2006</strong> <strong>National</strong> <strong>Survey</strong> <strong>of</strong> <strong>Fishing</strong>, <strong>Hunting</strong>, <strong>and</strong> <strong>Wildlife</strong>-<strong>Associated</strong> Recreation U.S. Fish & <strong>Wildlife</strong> Service
Table 21. Trip <strong>and</strong> Equipment Expenditures for <strong>Hunting</strong> Other Animals: <strong>2006</strong><br />
(Population 16 years old <strong>and</strong> older)<br />
Expenditures<br />
Spenders<br />
Expenditure item<br />
Amount<br />
(thous<strong>and</strong>s<br />
<strong>of</strong> dollars)<br />
Average per<br />
hunter<br />
(dollars)<br />
Number<br />
(thous<strong>and</strong>s)<br />
Percent<br />
<strong>of</strong> hunters<br />
Average per<br />
spender<br />
(dollars)<br />
Total, all items ........................................ 207,856 184 799 71 260<br />
TRIP-RELATED EXPENDITURES<br />
Total trip-related ...................................... 142,667 126 775 69 184<br />
Food <strong>and</strong> lodging, total ................................. 51,953 46 592 52 88<br />
Food ............................................... 47,175 42 592 52 80<br />
Lodging ............................................ *4,778 *4 *34 *3 *139<br />
Transportation, total ................................... *83,871 *74 *627 *56 *134<br />
Public .............................................. ... ... ... ... ...<br />
Private.............................................. ... ... ... ... ...<br />
Other trip costs, total .................................. 6,842 6 127 11 54<br />
Guide fees, pack trip or package fees..................... ... ... ... ... ...<br />
Public l<strong>and</strong> use fees ................................... ... ... ... ... ...<br />
Private l<strong>and</strong> use fees .................................. ... ... ... ... ...<br />
Equipment rental ..................................... ... ... ... ... ...<br />
Boating costs 1 ........................................ ... ... ... ... ...<br />
Heating <strong>and</strong> cooking fuel .............................. *1,832 *2 *74 *7 *25<br />
EQUIPMENT EXPENDITURES<br />
<strong>Hunting</strong> equipment, total ............................... 50,527 45 154 14 328<br />
Firearms ............................................ *27,563 *24 *36 *3 *762<br />
Rifles ............................................ *18,167 *16 *18 *2 *1,002<br />
Shotguns .......................................... ... ... ... ... ...<br />
Muzzleloaders ..................................... ... ... ... ... ...<br />
Pistols, h<strong>and</strong>guns ................................... ... ... ... ... ...<br />
Bows, arrows, archery equipment ........................ ... ... ... ... ...<br />
Telescopic sights ..................................... *2,067 *2 *12 *1 *166<br />
Decoys <strong>and</strong> game calls ................................ *1,909 *2 *44 *4 *44<br />
Ammunition ......................................... 4,497 4 90 8 50<br />
H<strong>and</strong> loading equipment ............................... *1,295 *1 *10 *1 *128<br />
<strong>Hunting</strong> dogs <strong>and</strong> associated costs ....................... ... ... ... ... ...<br />
Other............................................... *2,192 *2 *15 *1 *142<br />
Auxiliary equipment, total .............................. *14,662 *13 *41 *4 *355<br />
Camping equipment ................................... ... ... ... ... ...<br />
Binoculars, field glasses, telescopes, etc. .................. ... ... ... ... ...<br />
Special hunting clothing, rubber boots, waders, <strong>and</strong> foul<br />
weather gear ........................................ ... ... ... ... ...<br />
Processing <strong>and</strong> taxidermy costs.......................... ... ... ... ... ...<br />
Other............................................... ... ... ... ... ...<br />
Special equipment 2 ..................................... ... ... ... ... ...<br />
* Estimate based on a sample size <strong>of</strong> 10–29. ... Sample size too small to report data reliably.<br />
1 Boating costs include launching, mooring, storage, maintenance, insurance, pumpout fees, <strong>and</strong> fuel.<br />
2 Special equipment includes boats, campers, cabins, trail bikes, etc.<br />
Note: Detail does not add to total because <strong>of</strong> multiple responses.<br />
U.S. Fish & <strong>Wildlife</strong> Service <strong>2006</strong> <strong>National</strong> <strong>Survey</strong> <strong>of</strong> <strong>Fishing</strong>, <strong>Hunting</strong>, <strong>and</strong> <strong>Wildlife</strong>-<strong>Associated</strong> Recreation 77
Table 22. Special Equipment Expenditures for <strong>Fishing</strong> <strong>and</strong> <strong>Hunting</strong>: <strong>2006</strong><br />
(Population 16 years old <strong>and</strong> older)<br />
Expenditures<br />
Spenders<br />
Special equipment item<br />
Amount<br />
(thous<strong>and</strong>s<br />
<strong>of</strong> dollars)<br />
Average per<br />
sportsperson<br />
(dollars)<br />
Number<br />
(thous<strong>and</strong>s)<br />
Percent <strong>of</strong><br />
sportspersons<br />
Average per<br />
spender<br />
(dollars)<br />
Total, all items ........................................ 26,910,442 793 3,203 9 8,402<br />
Motorboat (other than bass boat) ........................ 4,555,033 134 505 1 9,013<br />
Bass boat ........................................... 1,748,529 52 222 1 7,885<br />
Canoe, other non-motorboat ............................ 174,122 5 365 1 477<br />
Boat motor, trailer or hitch, <strong>and</strong> other boat accessories....... 1,004,204 30 996 3 1,009<br />
Travel or tent trailer, pickup, camper, van, motor home,<br />
recreational vehicle (RV), house trailer .................. 13,838,464 408 952 3 14,537<br />
Cabin .............................................. *1,897,951 *56 *31 *(Z) *61,573<br />
Trail bike, dune buggy, 4x4 vehicle, 4-wheeler, snowmobile . . 3,396,880 100 666 2 5,099<br />
Other............................................... 295,259 9 234 1 1,263<br />
* Estimate based on a sample size <strong>of</strong> 10–29. (Z) Less than 0.5 percent.<br />
Note: Detail does not add to total because <strong>of</strong> multiple responses.<br />
Table 23. Anglers <strong>and</strong> Hunters Who Purchased Licenses or Were Exempt: <strong>2006</strong><br />
(Population 16 years old <strong>and</strong> older. Numbers in thous<strong>and</strong>s)<br />
Sportspersons<br />
Anglers<br />
Hunters<br />
Number Percent Number Percent<br />
Total sportspersons .................................... 29,952 100 12,510 100<br />
Total license purchasers 1 ................................ 19,498 65 10,054 80<br />
Sportspersons purchasing licenses:<br />
In state <strong>of</strong> residence................................. 18,070 60 9,591 77<br />
In other states...................................... 3,435 11 1,286 10<br />
Total exempt from purchasing licenses .................... 4,725 16 2,288 18<br />
Sportspersons exempt from license purchase:<br />
In state <strong>of</strong> residence................................. 4,371 15 2,138 17<br />
In other states...................................... 562 2 239 2<br />
Other 2 ............................................... 7,456 25 1,233 10<br />
Not reported .......................................... 543 2 133 1<br />
1 Includes persons who had licenses bought for them. Does not include persons who purchased licenses <strong>and</strong> did not fish or hunt in <strong>2006</strong>.<br />
2 Includes persons engaged in activities requiring no licenses or exemptions <strong>and</strong> those who failed to buy a license for activities requiring a license.<br />
Note: Detail does not add to total because <strong>of</strong> multiple responses <strong>and</strong> nonresponse. Respondents could have been licensed in one state <strong>and</strong> exempt in another.<br />
78 <strong>2006</strong> <strong>National</strong> <strong>Survey</strong> <strong>of</strong> <strong>Fishing</strong>, <strong>Hunting</strong>, <strong>and</strong> <strong>Wildlife</strong>-<strong>Associated</strong> Recreation U.S. Fish & <strong>Wildlife</strong> Service
Table 24. Selected Characteristics <strong>of</strong> Anglers <strong>and</strong> Hunters Who Purchased Licenses: <strong>2006</strong><br />
(Population 16 years old <strong>and</strong> older. Numbers in thous<strong>and</strong>s)<br />
Anglers<br />
Hunters<br />
Characteristic<br />
Total<br />
Purchased a<br />
license 1<br />
Did not purchase<br />
a license 2 Total Purchased a<br />
license 1<br />
Did not purchase<br />
a license 2<br />
Number Percent Number Percent Number Percent Number Percent Number Percent Number Percent<br />
Total persons ..................... 29,952 100 19,498 65 10,455 35 12,510 100 10,054 80 2,455 20<br />
Population Density <strong>of</strong> Residence<br />
Urban. ......................... 18,303 100 11,695 64 6,608 36 5,675 100 4,628 82 1,047 18<br />
Rural .......................... 11,649 100 7,803 67 3,846 33 6,835 100 5,426 79 1,409 21<br />
Population Size <strong>of</strong> Residence<br />
Metropolitan statistical area (MSA) . . . 21,815 100 14,050 64 7,764 36 7,785 100 6,298 81 1,487 19<br />
1,000,000 or more .............. 11,735 100 7,264 62 4,472 38 3,551 100 2,798 79 752 21<br />
250,000 to 999,999. ............. 5,889 100 3,830 65 2,059 35 2,143 100 1,673 78 470 22<br />
Less than 249,999. .............. 4,190 100 2,957 71 1,234 29 2,092 100 1,827 87 265 13<br />
Outside MSA .................... 8,138 100 5,447 67 2,690 33 4,724 100 3,756 80 968 20<br />
Census Geographic Division<br />
New Engl<strong>and</strong> .................... 1,246 100 722 58 524 42 374 100 329 88 45 12<br />
Middle Atlantic .................. 2,550 100 1,456 57 1,094 43 1,520 100 1,351 89 168 11<br />
East North Central ................ 5,190 100 3,702 71 1,488 29 2,376 100 2,057 87 318 13<br />
West North Central. ............... 3,284 100 2,489 76 795 24 1,779 100 1,435 81 344 19<br />
South Atlantic ................... 6,116 100 3,290 54 2,827 46 1,884 100 1,300 69 584 31<br />
East South Central ................ 2,436 100 1,453 60 983 40 1,101 100 807 73 294 27<br />
West South Central. ............... 3,952 100 2,376 60 1,576 40 1,810 100 1,348 74 462 26<br />
Mountain ....................... 2,084 100 1,635 78 449 22 868 100 769 89 99 11<br />
Pacific ......................... 3,094 100 2,375 77 719 23 798 100 658 83 139 17<br />
Age<br />
16 to 17 years ................... 1,103 100 565 51 538 49 501 100 400 80 101 20<br />
18 to 24 years ................... 2,406 100 1,499 62 907 38 968 100 777 80 191 20<br />
25 to 34 years ................... 4,857 100 3,407 70 1,450 30 2,058 100 1,717 83 341 17<br />
35 to 44 years ................... 7,476 100 4,844 65 2,632 35 3,074 100 2,526 82 548 18<br />
45 to 54 years ................... 6,647 100 4,635 70 2,013 30 2,870 100 2,384 83 485 17<br />
55 to 64 years ................... 4,616 100 3,295 71 1,322 29 1,852 100 1,540 83 312 17<br />
65 years <strong>and</strong> older ................ 2,847 100 1,253 44 1,594 56 1,186 100 710 60 476 40<br />
Sex<br />
Male. .......................... 22,337 100 15,170 68 7,167 32 11,351 100 9,223 81 2,128 19<br />
Female ......................... 7,615 100 4,328 57 3,287 43 1,159 100 832 72 327 28<br />
Ethnicity<br />
Hispanic ........................ 1,576 100 889 56 686 44 424 100 299 71 *125 *29<br />
Non-Hispanic .................... 28,377 100 18,608 66 9,769 34 12,085 100 9,755 81 2,330 19<br />
Race<br />
White .......................... 27,490 100 18,144 66 9,346 34 12,028 100 9,716 81 2,313 19<br />
Black .......................... 1,515 100 823 54 692 46 194 100 124 64 *70 *36<br />
Asian .......................... 324 100 194 60 130 40 50 100 *47 *95 ... ...<br />
All others ....................... 624 100 337 54 287 46 238 100 168 71 70 29<br />
Annual Household Income<br />
Less than $10,000 ................ 733 100 395 54 338 46 223 100 161 72 62 28<br />
$10,000 to $19,999. ............... 1,380 100 849 62 531 38 580 100 411 71 168 29<br />
$20,000 to $24,999. ............... 1,427 100 804 56 623 44 486 100 356 73 130 27<br />
$25,000 to $29,999. ............... 1,319 100 831 63 488 37 567 100 446 79 120 21<br />
$30,000 to $34,999. ............... 1,510 100 1,006 67 503 33 737 100 609 83 128 17<br />
$35,999 to $39,999. ............... 1,543 100 1,068 69 475 31 670 100 525 78 145 22<br />
$40,000 to $49,999. ............... 2,766 100 1,903 69 863 31 1,209 100 968 80 241 20<br />
$50,000 to $74,999. ............... 5,981 100 4,020 67 1,961 33 2,754 100 2,245 82 509 18<br />
$75,000 to $99,999. ............... 4,074 100 2,782 68 1,293 32 1,739 100 1,437 83 302 17<br />
$100,000 or more. ................ 5,167 100 3,328 64 1,839 36 1,977 100 1,646 83 331 17<br />
Not reported. .................... 4,051 100 2,511 62 1,540 38 1,568 100 1,248 80 319 20<br />
Education<br />
11 years or less .................. 4,040 100 2,307 57 1,733 43 1,724 100 1,336 77 389 23<br />
12 years ........................ 10,266 100 6,938 68 3,329 32 4,896 100 3,930 80 966 20<br />
1 to 3 years college ............... 7,590 100 5,074 67 2,516 33 3,235 100 2,626 81 609 19<br />
4 years college ................... 5,115 100 3,293 64 1,822 36 1,750 100 1,431 82 319 18<br />
5 or more years college ............ 2,941 100 1,887 64 1,054 36 904 100 732 81 172 19<br />
Days <strong>of</strong> Participation<br />
1to5days...................... 12,362 100 6,688 54 5,674 46 4,198 100 3,144 75 1,054 25<br />
6 to 10 days ..................... 5,609 100 3,816 68 1,793 32 2,589 100 2,125 82 464 18<br />
11 to 25 days .................... 6,102 100 4,431 73 1,671 27 3,052 100 2,534 83 518 17<br />
26 days or more .................. 5,743 100 4,479 78 1,264 22 2,638 100 2,244 85 395 15<br />
* Estimate based on a sample size <strong>of</strong> 10–29. ... Sample size too small to report data reliably.<br />
1 Includes persons who purchased a license in <strong>2006</strong> in any state. Respondents could have been licensed in one state <strong>and</strong> exempt in another.<br />
2 Includes those persons who did not purchase a license in any state in <strong>2006</strong> <strong>and</strong> those who did not specify a license purchase in <strong>2006</strong>.<br />
U.S. Fish & <strong>Wildlife</strong> Service <strong>2006</strong> <strong>National</strong> <strong>Survey</strong> <strong>of</strong> <strong>Fishing</strong>, <strong>Hunting</strong>, <strong>and</strong> <strong>Wildlife</strong>-<strong>Associated</strong> Recreation 79
Table 25. Freshwater Anglers <strong>and</strong> Days <strong>of</strong> <strong>Fishing</strong> by Type <strong>of</strong> Water: <strong>2006</strong><br />
(Population 16 years old <strong>and</strong> older. Numbers in thous<strong>and</strong>s. Excludes Great Lakes fishing)<br />
Type <strong>of</strong> water<br />
Anglers<br />
Days <strong>of</strong> fishing<br />
Number Percent Number Percent<br />
Total, all types <strong>of</strong> water................................. 25,035 100 419,942 100<br />
Lakes, reservoirs, <strong>and</strong> ponds ............................ 21,129 84 304,452 72<br />
Rivers <strong>and</strong> streams.................................... 11,253 45 135,950 32<br />
Note: Detail does not add to total because <strong>of</strong> multiple responses <strong>and</strong> nonresponse.<br />
Table 26. Great Lakes Anglers <strong>and</strong> Days <strong>of</strong> <strong>Fishing</strong> by Great Lake: <strong>2006</strong><br />
(Population 16 years old <strong>and</strong> older. Numbers in thous<strong>and</strong>s)<br />
Great Lake<br />
Anglers<br />
Days <strong>of</strong> fishing<br />
Number Percent Number Percent<br />
Total, all Great Lakes .................................. 1,420 100 18,016 100<br />
Lake Ontario, including the Niagara River................. 218 15 1,245 7<br />
Lake Erie, including the Detroit River .................... 526 37 4,651 26<br />
Lake Huron, including St. Mary’s River System ............ *93 *7 *811 *5<br />
Lake Michigan ....................................... 474 33 5,647 31<br />
Lake Superior........................................ *89 *6 *2,123 *12<br />
Lake St. Clair, including the St. Clair River ............... ... ... ... ...<br />
St. Lawrence River ................................... ... ... ... ...<br />
Tributaries to the Great Lakes........................... 134 9 1,204 7<br />
* Estimate based on a sample size <strong>of</strong> 10–29. ... Sample size too small to report data reliably.<br />
Note: Detail does not add to total because <strong>of</strong> multiple responses <strong>and</strong> nonresponse.<br />
Table 27. Hunters <strong>and</strong> Days <strong>of</strong> <strong>Hunting</strong> on Public <strong>and</strong> Private L<strong>and</strong> by Type <strong>of</strong> <strong>Hunting</strong>: <strong>2006</strong><br />
(Population 16 years old <strong>and</strong> older. Numbers in thous<strong>and</strong>s)<br />
Hunters <strong>and</strong> days <strong>of</strong> hunting<br />
Total, all hunting Big game Small game Migratory bird Other animals<br />
Number Percent Number Percent Number Percent Number Percent Number Percent<br />
HUNTERS<br />
Total, all l<strong>and</strong> ................ 12,510 100 10,682 100 4,797 100 2,293 100 1,128 100<br />
Public l<strong>and</strong>, total ........... 4,901 39 3,784 35 1,681 35 798 35 311 28<br />
Public l<strong>and</strong> only ........... 1,888 15 1,717 16 824 17 412 18 149 13<br />
Public <strong>and</strong> private l<strong>and</strong> ..... 3,013 24 2,066 19 857 18 386 17 162 14<br />
Private l<strong>and</strong>, total........... 10,206 82 8,571 80 3,795 79 1,740 76 928 82<br />
Private l<strong>and</strong> only .......... 7,193 58 6,504 61 2,939 61 1,354 59 766 68<br />
Private <strong>and</strong> public l<strong>and</strong> ..... 3,013 24 2,066 19 857 18 386 17 162 14<br />
DAYS OF HUNTING<br />
Total, all l<strong>and</strong> ................ 219,925 100 164,061 100 52,395 100 19,770 100 15,205 100<br />
Public l<strong>and</strong> 1 ................ 54,433 25 37,301 23 12,532 24 5,722 29 2,820 19<br />
Private l<strong>and</strong> 2 ................ 164,319 75 120,092 73 38,080 73 13,441 68 12,248 81<br />
1 Days <strong>of</strong> hunting on public l<strong>and</strong> includes both days spent solely on public l<strong>and</strong> <strong>and</strong> those spent on public <strong>and</strong> private l<strong>and</strong>.<br />
2 Days <strong>of</strong> hunting on private l<strong>and</strong> includes both days spent solely on private l<strong>and</strong> <strong>and</strong> those spent on private <strong>and</strong> public l<strong>and</strong>.<br />
Note: Detail does not add to total because <strong>of</strong> multiple responses <strong>and</strong> nonresponse.<br />
80 <strong>2006</strong> <strong>National</strong> <strong>Survey</strong> <strong>of</strong> <strong>Fishing</strong>, <strong>Hunting</strong>, <strong>and</strong> <strong>Wildlife</strong>-<strong>Associated</strong> Recreation U.S. Fish & <strong>Wildlife</strong> Service
Table 28. Hunters <strong>and</strong> Days <strong>of</strong> <strong>Hunting</strong> on Public L<strong>and</strong> by Selected Characteristic: <strong>2006</strong><br />
(Population 16 years old <strong>and</strong> older. Numbers in thous<strong>and</strong>s)<br />
Hunters<br />
Days <strong>of</strong> hunting<br />
Characteristic<br />
Total<br />
hunters,<br />
public <strong>and</strong><br />
private l<strong>and</strong><br />
Number<br />
Hunters on public l<strong>and</strong> 1<br />
Percent <strong>of</strong><br />
total hunters<br />
Percent <strong>of</strong><br />
hunters<br />
using<br />
public l<strong>and</strong><br />
Total days,<br />
public <strong>and</strong><br />
private l<strong>and</strong><br />
Number<br />
Days on public l<strong>and</strong> 2<br />
Percent <strong>of</strong><br />
total days<br />
Percent <strong>of</strong><br />
days on<br />
public l<strong>and</strong><br />
Total persons ..................... 12,510 4,901 39 100 219,925 54,433 25 100<br />
Population Density <strong>of</strong> Residence<br />
Urban. ......................... 5,675 2,572 45 52 80,603 25,563 32 47<br />
Rural .......................... 6,835 2,328 34 48 139,323 28,870 21 53<br />
Population Size <strong>of</strong> Residence<br />
Metropolitan statistical area (MSA) . . . 7,785 3,120 40 64 128,551 32,555 25 60<br />
1,000,000 or more .............. 3,551 1,391 39 28 58,281 14,289 25 26<br />
250,000 to 999,999 ............. 2,143 911 43 19 36,109 9,233 26 17<br />
Less than 249,999. .............. 2,092 818 39 17 34,162 9,033 26 17<br />
Outside MSA ................... 4,724 1,780 38 36 91,374 21,878 24 40<br />
Census Geographic Division<br />
New Engl<strong>and</strong> ................... 374 159 43 3 6,653 1,680 25 3<br />
Middle Atlantic .................. 1,520 699 46 14 28,755 7,680 27 14<br />
East North Central ................ 2,376 869 37 18 41,709 8,469 20 16<br />
West North Central. ............... 1,779 623 35 13 27,062 6,328 23 12<br />
South Atlantic ................... 1,884 571 30 12 35,332 6,642 19 12<br />
East South Central ................ 1,101 350 32 7 25,685 3,910 15 7<br />
West South Central. ............... 1,810 398 22 8 34,237 5,487 16 10<br />
Mountain ....................... 868 681 78 14 9,869 6,959 71 13<br />
Pacific ......................... 798 551 69 11 10,625 7,278 69 13<br />
Age<br />
16 to 17 years ................... 501 188 38 4 6,277 1,646 26 3<br />
18 to 24 years ................... 968 382 39 8 18,312 3,960 22 7<br />
25 to 34 years ................... 2,058 959 47 20 36,459 10,047 28 18<br />
35 to 44 years ................... 3,074 1,294 42 26 54,330 13,105 24 24<br />
45 to 54 years ................... 2,870 1,035 36 21 51,817 12,382 24 23<br />
55 to 64 years ................... 1,852 685 37 14 31,946 8,257 26 15<br />
65 years <strong>and</strong> older ................ 1,186 357 30 7 20,784 5,036 24 9<br />
Sex<br />
Male. .......................... 11,351 4,568 40 93 208,244 51,674 25 95<br />
Female ......................... 1,159 333 29 7 11,681 2,759 24 5<br />
Ethnicity<br />
Hispanic ........................ 424 138 32 3 4,432 1,864 42 3<br />
Non-Hispanic .................... 12,085 4,763 39 97 215,494 52,569 24 97<br />
Race<br />
White .......................... 12,028 4,710 39 96 211,524 52,234 25 96<br />
Black .......................... 194 *33 *17 *1 3,281 *211 *6 *(Z)<br />
Asian .......................... 50 *32 *65 *1 608 *417 *69 *1<br />
All others ....................... 238 125 53 3 4,513 1,570 35 3<br />
Annual Household Income<br />
Less than $10,000 ................ 223 75 34 2 3,766 990 26 2<br />
$10,000 to $19,999. ............... 580 204 35 4 9,134 1,992 22 4<br />
$20,000 to $24,999 ............... 486 136 28 3 9,397 1,742 19 3<br />
$25,000 to $29,999. ............... 567 211 37 4 9,214 2,538 28 5<br />
$30,000 to $34,999 ............... 737 279 38 6 14,270 3,516 25 6<br />
$35,000 to $39,999. ............... 670 239 36 5 12,997 2,315 18 4<br />
$40,000 to $49,999 ............... 1,209 504 42 10 22,075 6,477 29 12<br />
$50,000 to $74,999 ............... 2,754 1,129 41 23 48,999 11,742 24 22<br />
$75,000 to $99,999 ............... 1,739 714 41 15 29,112 7,368 25 14<br />
$100,000 or more ................ 1,977 784 40 16 33,008 8,395 25 15<br />
Not reported. .................... 1,568 626 40 13 27,953 7,356 26 14<br />
Education<br />
11 years or less .................. 1,724 616 36 13 31,126 6,435 21 12<br />
12 years ........................ 4,896 1,846 38 38 93,320 22,212 24 41<br />
1 to 3 years college ............... 3,235 1,341 41 27 56,700 16,334 29 30<br />
4 years college ................... 1,750 697 40 14 26,887 6,165 23 11<br />
5 or more years college ............ 904 400 44 8 11,893 3,287 28 6<br />
* Estimate based on a sample size <strong>of</strong> 10–29. (Z) Less than 0.5 percent.<br />
1 Hunters on public l<strong>and</strong> include those who hunted on both public <strong>and</strong> private l<strong>and</strong>.<br />
2 Days <strong>of</strong> hunting on public l<strong>and</strong> includes both days spent solely on public l<strong>and</strong> <strong>and</strong> those spent on public <strong>and</strong> private l<strong>and</strong>.<br />
Note: Percent <strong>of</strong> total hunters <strong>and</strong> percent <strong>of</strong> total days are based on the total hunters <strong>and</strong> total days columns for each row. Percent <strong>of</strong> hunters using public l<strong>and</strong> <strong>and</strong> percent <strong>of</strong> days on<br />
public l<strong>and</strong> are based on the total number <strong>of</strong> hunters on public l<strong>and</strong> <strong>and</strong> total number <strong>of</strong> days on public l<strong>and</strong>, respectively.<br />
U.S. Fish & <strong>Wildlife</strong> Service <strong>2006</strong> <strong>National</strong> <strong>Survey</strong> <strong>of</strong> <strong>Fishing</strong>, <strong>Hunting</strong>, <strong>and</strong> <strong>Wildlife</strong>-<strong>Associated</strong> Recreation 81
Table 29. Hunters <strong>and</strong> Days <strong>of</strong> <strong>Hunting</strong> on Private L<strong>and</strong> by Selected Characteristic: <strong>2006</strong><br />
(Population 16 years old <strong>and</strong> older. Numbers in thous<strong>and</strong>s)<br />
Hunters<br />
Days <strong>of</strong> hunting<br />
Characteristic<br />
Total<br />
hunters,<br />
public <strong>and</strong><br />
private l<strong>and</strong><br />
Number<br />
Hunters on private l<strong>and</strong> 1<br />
Percent <strong>of</strong><br />
total hunters<br />
Percent <strong>of</strong><br />
hunters<br />
using<br />
private l<strong>and</strong><br />
Total days,<br />
public <strong>and</strong><br />
private l<strong>and</strong><br />
Number<br />
Days on private l<strong>and</strong> 2<br />
Percent <strong>of</strong><br />
total days<br />
Percent <strong>of</strong><br />
days on<br />
private l<strong>and</strong><br />
Total persons ........................ 12,510 10,206 82 100 219,925 164,319 75 100<br />
Population Density <strong>of</strong> Residence<br />
Urban. ............................ 5,675 4,311 76 42 80,603 54,671 68 33<br />
Rural ............................. 6,835 5,895 86 58 139,323 109,649 79 67<br />
Population Size <strong>of</strong> Residence<br />
Metropolitan statistical area (MSA) ...... 7,785 6,234 80 61 128,551 93,046 72 57<br />
1,000,000 or more ................. 3,551 2,818 79 28 58,281 44,195 76 27<br />
250,000 to 999,999 ................ 2,143 1,709 80 17 36,109 23,816 66 14<br />
Less than 249,999. ................. 2,092 1,707 82 17 34,162 25,035 73 15<br />
Outside MSA ...................... 4,724 3,972 84 39 91,374 71,273 78 43<br />
Census Geographic Division<br />
New Engl<strong>and</strong> ...................... 374 314 84 3 6,653 4,689 70 3<br />
Middle Atlantic ..................... 1,520 1,208 79 12 28,755 20,411 71 12<br />
East North Central .................. 2,376 2,039 86 20 41,709 32,062 77 20<br />
West North Central .................. 1,779 1,608 90 16 27,062 22,150 82 13<br />
South Atlantic ...................... 1,884 1,655 88 16 35,332 27,688 78 17<br />
East South Central .................. 1,101 1,020 93 10 25,685 21,755 85 13<br />
West South Central .................. 1,810 1,573 87 15 34,237 28,236 82 17<br />
Mountain .......................... 868 355 41 3 9,869 3,050 31 2<br />
Pacific ............................ 798 436 55 4 10,625 4,278 40 3<br />
Age<br />
16 to 17 years ...................... 501 392 78 4 6,277 4,592 73 3<br />
18 to 24 years ...................... 968 787 81 8 18,312 14,092 77 9<br />
25 to 34 years ...................... 2,058 1,697 82 17 36,459 27,087 74 16<br />
35 to 44 years ...................... 3,074 2,501 81 25 54,330 39,891 73 24<br />
45 to 54 years ...................... 2,870 2,326 81 23 51,817 39,447 76 24<br />
55 to 64 years ...................... 1,852 1,502 81 15 31,946 23,618 74 14<br />
65 years <strong>and</strong> older ................... 1,186 1,002 84 10 20,784 15,593 75 9<br />
Sex<br />
Male. ............................. 11,351 9,288 82 91 208,244 155,560 75 95<br />
Female ............................ 1,159 919 79 9 11,681 8,759 75 5<br />
Ethnicity<br />
Hispanic ........................... 424 312 74 3 4,432 2,584 58 2<br />
Non-Hispanic ....................... 12,085 9,894 82 97 215,494 161,735 75 98<br />
Race<br />
White ............................. 12,028 9,835 82 96 211,524 158,186 75 96<br />
Black ............................. 194 167 86 2 3,281 2,695 82 2<br />
Asian ............................. 50 *22 *43 *(Z) 608 *265 *44 *(Z)<br />
All others .......................... 238 182 77 2 4,513 3,173 70 2<br />
Annual Household Income<br />
Less than $10,000 ................... 223 185 83 2 3,766 2,581 69 2<br />
$10,000 to $19,999. .................. 580 438 75 4 9,134 6,470 71 4<br />
$20,000 to $24,999 .................. 486 421 87 4 9,397 7,787 83 5<br />
$25,000 to $29,999. .................. 567 430 76 4 9,214 6,967 76 4<br />
$30,000 to $34,999 .................. 737 611 83 6 14,270 10,451 73 6<br />
$35,000 to $39,999. .................. 670 528 79 5 12,997 9,891 76 6<br />
$40,000 to $49,999 .................. 1,209 964 80 9 22,075 15,836 72 10<br />
$50,000 to $74,999 .................. 2,754 2,281 83 22 48,999 36,530 75 22<br />
$75,000 to $99,999 .................. 1,739 1,377 79 13 29,112 22,090 76 13<br />
$100,000 or more ................... 1,977 1,675 85 16 33,008 25,437 77 15<br />
Not reported. ....................... 1,568 1,297 83 13 27,953 20,280 73 12<br />
Education<br />
11 years or less ..................... 1,724 1,413 82 14 31,126 24,345 78 15<br />
12 years ........................... 4,896 3,928 80 38 93,320 68,000 73 41<br />
1 to 3 years college .................. 3,235 2,621 81 26 56,700 41,903 74 26<br />
4 years college ...................... 1,750 1,503 86 15 26,887 20,780 77 13<br />
5 or more years college ............... 904 741 82 7 11,893 9,291 78 6<br />
* Estimate based on a sample size <strong>of</strong> 10–29. (Z) Less than 0.5 percent.<br />
1 Hunters on private l<strong>and</strong> include those who hunted on both private <strong>and</strong> public l<strong>and</strong>.<br />
2 Days <strong>of</strong> hunting on private l<strong>and</strong> includes both days spent solely on private l<strong>and</strong> <strong>and</strong> those spent on private <strong>and</strong> public l<strong>and</strong>.<br />
Note: Percent <strong>of</strong> total hunters <strong>and</strong> percent <strong>of</strong> total days are based on the total hunters <strong>and</strong> total days columns for each row. Percent <strong>of</strong> hunters using private l<strong>and</strong> <strong>and</strong> percent <strong>of</strong> days<br />
on private l<strong>and</strong> are based on the total number <strong>of</strong> hunters on private l<strong>and</strong> <strong>and</strong> total number <strong>of</strong> days on private l<strong>and</strong>, respectively.<br />
82 <strong>2006</strong> <strong>National</strong> <strong>Survey</strong> <strong>of</strong> <strong>Fishing</strong>, <strong>Hunting</strong>, <strong>and</strong> <strong>Wildlife</strong>-<strong>Associated</strong> Recreation U.S. Fish & <strong>Wildlife</strong> Service
Table 30. Anglers <strong>Fishing</strong> From Boats <strong>and</strong> Days <strong>of</strong> Participation by Type <strong>of</strong> <strong>Fishing</strong>: <strong>2006</strong><br />
(Population 16 years old <strong>and</strong> older. Numbers in thous<strong>and</strong>s)<br />
Participants <strong>and</strong> days<br />
<strong>of</strong> fishing<br />
Total, all fishing<br />
Freshwater, excludes<br />
Great Lakes<br />
Great Lakes<br />
Saltwater<br />
Number Percent Number Percent Number Percent Number Percent<br />
Total anglers ...................... 29,952 100 25,035 100 1,420 100 7,717 100<br />
Anglers fishing from boats.......... 17,035 57 13,073 52 1,054 74 5,304 69<br />
Total days <strong>of</strong> fishing ................ 516,781 100 419,942 100 18,016 100 85,663 100<br />
Days fishing from boats ............ 246,038 48 185,074 44 10,728 60 50,236 59<br />
Note: Detail does not add to total because <strong>of</strong> multiple responses <strong>and</strong> nonresponses.<br />
Table 31. Anglers <strong>Fishing</strong> From Motorboats <strong>and</strong> Non-Motorboats: <strong>2006</strong><br />
(Population 16 years old <strong>and</strong> older. Numbers in thous<strong>and</strong>s)<br />
Anglers Number Percent<br />
Anglers who use boats, total .................................................. 17,035 100<br />
Anglers fishing most <strong>of</strong>ten from a motorboat .................................... 12,475 73<br />
Anglers fishing most <strong>of</strong>ten from a non-motorboat ................................ 3,743 22<br />
Note: Detail does not add to total because <strong>of</strong> nonresponses.<br />
U.S. Fish & <strong>Wildlife</strong> Service <strong>2006</strong> <strong>National</strong> <strong>Survey</strong> <strong>of</strong> <strong>Fishing</strong>, <strong>Hunting</strong>, <strong>and</strong> <strong>Wildlife</strong>-<strong>Associated</strong> Recreation 83
Table 32. Boats <strong>and</strong> Boat Launches Used by Anglers <strong>and</strong> Completion <strong>of</strong> Boating Safety Courses: <strong>2006</strong><br />
(Population 16 years old <strong>and</strong> older. Numbers in thous<strong>and</strong>s)<br />
Boating facts Number Percent<br />
LENGTH OF BOAT USED MOST OFTEN<br />
Total anglers using boats ..................................................... 17,035 100<br />
Less than 13 feet........................................................... 2,342 14<br />
13 to 16 feet .............................................................. 4,697 28<br />
17 to 19 feet .............................................................. 3,435 20<br />
20 to 25 feet .............................................................. 3,163 19<br />
26 to 30 feet .............................................................. 719 4<br />
31 to 40 feet .............................................................. 454 3<br />
41 feet or more ............................................................ 493 3<br />
DISTANCE TO BOAT LAUNCH USED MOST OFTEN<br />
Total anglers using boats ..................................................... 17,035 100<br />
Less than 1 mile ........................................................... 343 2<br />
1 to 5 miles ............................................................... 1,366 8<br />
6 to 10 miles .............................................................. 1,068 6<br />
11 to 20 miles ............................................................. 1,413 8<br />
21 to 30 miles ............................................................. 911 5<br />
31 to 40 miles ............................................................. 609 4<br />
41 to 50 miles ............................................................. 619 4<br />
51 to 75 miles ............................................................. 665 4<br />
76 to 100 miles ............................................................ 514 3<br />
101 miles or more.......................................................... 1,415 8<br />
Did not use a boat launch...................................................... 7,882 46<br />
COMPLETED A BOATING SAFETY COURSE<br />
Total anglers using boats ..................................................... 17,035 100<br />
Completed course .......................................................... 3,489 20<br />
Did not complete or attempt course ............................................ 13,040 77<br />
Note: Detail does not add to total because <strong>of</strong> nonresponses.<br />
Table 33. Anglers <strong>Fishing</strong> Most Often From Boats Alone or With Others: <strong>2006</strong><br />
(Population 16 years old <strong>and</strong> older. Numbers in thous<strong>and</strong>s)<br />
Anglers <strong>and</strong> their boating companions Number Percent<br />
Total anglers using boats ..................................................... 17,035 100<br />
Fished most <strong>of</strong>ten alone ..................................................... 1,854 11<br />
Fished most <strong>of</strong>ten with friends................................................ 7,819 46<br />
Fished most <strong>of</strong>ten with spouse/partner.......................................... 5,042 30<br />
Fished most <strong>of</strong>ten with children............................................... 3,746 22<br />
Fished most <strong>of</strong>ten with parents................................................ 1,594 9<br />
Fished most <strong>of</strong>ten with other family ........................................... 3,897 23<br />
Fished most <strong>of</strong>ten with other ................................................. 611 4<br />
Note: Detail does not add to total because <strong>of</strong> multiple responses <strong>and</strong> nonresponses. Adds to more than the total because anglers fished with people in more thanone<br />
category.<br />
84 <strong>2006</strong> <strong>National</strong> <strong>Survey</strong> <strong>of</strong> <strong>Fishing</strong>, <strong>Hunting</strong>, <strong>and</strong> <strong>Wildlife</strong>-<strong>Associated</strong> Recreation U.S. Fish & <strong>Wildlife</strong> Service
Table 34. Information Used by Anglers <strong>Fishing</strong> From Boats: <strong>2006</strong><br />
Information sources <strong>and</strong> types Number Percent<br />
TYPES OF INFORMATION<br />
Total anglers using boats ..................................................... 17,035 100<br />
Directions to boat launch .................................................... 1,228 7<br />
Directions to fishing sites .................................................... 1,980 12<br />
Boating rules <strong>and</strong> regulations ................................................. 1,595 9<br />
<strong>Fishing</strong> rules <strong>and</strong> regulations ................................................. 2,686 16<br />
Water attributes (e.g., depth).................................................. 1,960 12<br />
Fish species ............................................................... 4,697 28<br />
Weather conditions ......................................................... 4,029 24<br />
Other .................................................................... 522 3<br />
None..................................................................... 838 5<br />
SOURCES OF INFORMATION<br />
Total anglers using boats ..................................................... 17,035 100<br />
Published boating guide ..................................................... 1,086 6<br />
Internet................................................................... 2,795 16<br />
TV or radio ............................................................... 1,922 11<br />
Call-in service center ....................................................... 211 1<br />
State fish <strong>and</strong> game agency .................................................. 1,416 8<br />
Magazines <strong>and</strong> newspapers................................................... 1,471 9<br />
Boating, fishing, outdoor shows............................................... 365 2<br />
Friends, family, other anglers/boaters........................................... 4,620 27<br />
Bait <strong>and</strong> tackle shop ........................................................ 1,867 11<br />
Other .................................................................... 1,119 7<br />
None..................................................................... 6,619 39<br />
Note: Detail does not add to total because <strong>of</strong> multiple responses <strong>and</strong> nonresponses.<br />
Table 35. Participation in Ice <strong>Fishing</strong> <strong>and</strong> Fly-<strong>Fishing</strong>: <strong>2006</strong><br />
(Population 16 years old <strong>and</strong> older. Numbers in thous<strong>and</strong>s)<br />
Anglers <strong>and</strong> days Number Percent<br />
Total anglers................................................................ 29,952 100<br />
Ice anglers ............................................................... 1,723 6<br />
Fly-anglers................................................................ 3,012 10<br />
Total days <strong>of</strong> fishing ......................................................... 516,781 100<br />
Days <strong>of</strong> ice fishing ......................................................... 14,036 3<br />
Days <strong>of</strong> fly-fishing ......................................................... 30,259 6<br />
Note: Detail does not add to total because <strong>of</strong> multiple responses.<br />
Table 36. Participation in Catch-<strong>and</strong>-Release <strong>Fishing</strong>: <strong>2006</strong><br />
Anglers Number Percent<br />
Total anglers................................................................ 29,952 100<br />
Anglers who caught fish ..................................................... 26,265 88<br />
Anglers who caught fish they legally could have kept ............................. 24,133 81<br />
Anglers who released some fish they legally could have kept ....................... 20,190 67<br />
Anglers who released all fish they legally could have kept ......................... 6,114 20<br />
Percent <strong>of</strong> fish caught that were released ......................................... 50 (X)<br />
(X) Not applicable.<br />
Note: Detail does not add to total because <strong>of</strong> multiple responses <strong>and</strong> nonresponse.<br />
U.S. Fish & <strong>Wildlife</strong> Service <strong>2006</strong> <strong>National</strong> <strong>Survey</strong> <strong>of</strong> <strong>Fishing</strong>, <strong>Hunting</strong>, <strong>and</strong> <strong>Wildlife</strong>-<strong>Associated</strong> Recreation 85
Table 37. Hunters Using Bows <strong>and</strong> Arrows, Muzzleloaders, or Other Firearms: <strong>2006</strong><br />
Hunters Number Percent<br />
Total hunters ............................................................... 12,510 100<br />
Hunters using bow <strong>and</strong> arrow................................................. 3,501 28<br />
Hunters using muzzleloader .................................................. 2,484 20<br />
Hunters using other firearm (e.g., shotgun, rifle) ................................. 11,633 93<br />
Total days <strong>of</strong> hunting ........................................................ 219,925 100<br />
With bow <strong>and</strong> arrow ........................................................ 50,027 23<br />
With muzzleloader ......................................................... 16,787 8<br />
With other firearm (e.g., shotgun, rifle)......................................... 147,176 67<br />
Note: Detail does not add to total because <strong>of</strong> multiple responses <strong>and</strong> nonresponse.<br />
Table 38. L<strong>and</strong> Owned or Leased for the Primary Purpose <strong>of</strong> <strong>Fishing</strong> or <strong>Hunting</strong>: <strong>2006</strong><br />
(Population 16 years <strong>of</strong> age or older. Numbers in thous<strong>and</strong>s)<br />
<strong>Fishing</strong> <strong>and</strong> hunting Number Percent<br />
LAND OWNERSHIP<br />
Sportspersons Owning L<strong>and</strong><br />
Total sportspersons ......................................................... 2,132 100<br />
Anglers .................................................................. 967 45<br />
Hunters .................................................................. 1,336 63<br />
Acres Owned<br />
Total acres owned .......................................................... 167,733 100<br />
Acres for fishing .......................................................... 33,395 20<br />
Acres for hunting .......................................................... 134,338 80<br />
Expenditures for L<strong>and</strong> Owned<br />
Total expenditures .......................................................... 7,923,079 100<br />
For fishing ............................................................... 4,276,492 54<br />
For hunting............................................................... 3,646,587 46<br />
LAND LEASING<br />
Sportspersons Leasing L<strong>and</strong><br />
Total sportspersons ......................................................... 1,055 100<br />
Anglers .................................................................. 229 22<br />
Hunters .................................................................. 860 82<br />
Acres Leased<br />
Total acres leased ........................................................... 226,416 100<br />
Acres for fishing .......................................................... 9,647 4<br />
Acres for hunters .......................................................... 216,769 96<br />
Expenditures for L<strong>and</strong> Leased<br />
Total expenditures .......................................................... 1,063,263 100<br />
For fishing ............................................................... 322,496 30<br />
For hunting............................................................... 740,767 70<br />
Note: Detail does not add to total because <strong>of</strong> multiple responses.<br />
86 <strong>2006</strong> <strong>National</strong> <strong>Survey</strong> <strong>of</strong> <strong>Fishing</strong>, <strong>Hunting</strong>, <strong>and</strong> <strong>Wildlife</strong>-<strong>Associated</strong> Recreation U.S. Fish & <strong>Wildlife</strong> Service
Table 39. <strong>Wildlife</strong>-Watching Participants by Type <strong>of</strong> Activity: <strong>2006</strong><br />
(Population 16 years old <strong>and</strong> older. Numbers in thous<strong>and</strong>s)<br />
Activity<br />
Number<br />
Percent<br />
Activity<br />
Number<br />
Percent<br />
Total participants ..................... 71,132 100<br />
Away from home .................... 22,977 32<br />
Observe wildlife................... 21,546 30<br />
Photograph wildlife ................ 11,708 16<br />
Feed wildlife...................... 7,084 10<br />
1 Includes visits only to parks or publicly held areas within one mile <strong>of</strong> home.<br />
Around the home .................... 67,756 95<br />
Observe wildlife................... 44,467 63<br />
Photograph wildlife ................ 18,763 26<br />
Feed wildlife...................... 55,512 78<br />
Visit public parks or areas 1 ......... 13,271 19<br />
Maintain plantings or natural areas . . 14,508 20<br />
Note: Detail does not add to total because <strong>of</strong> multiple responses.<br />
Table 40. Participants, Area Visited, Trips, <strong>and</strong> Days <strong>of</strong> Participation in <strong>Wildlife</strong> Watching Away From<br />
Home: <strong>2006</strong><br />
(Population 16 years old <strong>and</strong> older. Numbers in thous<strong>and</strong>s)<br />
Participants, area visited, trips, <strong>and</strong> days <strong>of</strong> participation<br />
Number<br />
Percent<br />
PARTICIPANTS<br />
Total participants................................................................ 22,977<br />
100<br />
Observe wildlife ............................................................... 21,546<br />
94<br />
Photograph wildlife............................................................. 11,708<br />
51<br />
Feed wildlife .................................................................. 7,084<br />
31<br />
AREA VISITED<br />
Total, all areas .................................................................. 22,977<br />
100<br />
Public only .................................................................... 12,199<br />
53<br />
Private only ................................................................... 2,534<br />
11<br />
Public <strong>and</strong> private .............................................................. 6,175<br />
27<br />
Not reported ................................................................... 2,069<br />
9<br />
TRIPS<br />
Total trips....................................................................... 232,643<br />
100<br />
Average days per trip . . . . . . . . . . . . . . . . . . . . . . . . . . . . . . . . . . . . . . . . . . . . . . . . . . . . . . . . . . . . .<br />
2<br />
(X)<br />
DAYS<br />
Total days....................................................................... 352,070<br />
100<br />
Observing wildlife.............................................................. 291,027<br />
83<br />
Photographing wildlife .......................................................... 103,872<br />
30<br />
Feeding wildlife................................................................ 77,329<br />
22<br />
Average days per participant . . . . . . . . . . . . . . . . . . . . . . . . . . . . . . . . . . . . . . . . . . . . . . . . . . . . . . .<br />
15<br />
(X)<br />
Observing wildlife . . . . . . . . . . . . . . . . . . . . . . . . . . . . . . . . . . . . . . . . . . . . . . . . . . . . . . . . . . . . . .<br />
14<br />
(X)<br />
Photographing wildlife . . . . . . . . . . . . . . . . . . . . . . . . . . . . . . . . . . . . . . . . . . . . . . . . . . . . . . . . . .<br />
9<br />
(X)<br />
Feeding wildlife . . . . . . . . . . . . . . . . . . . . . . . . . . . . . . . . . . . . . . . . . . . . . . . . . . . . . . . . . . . . . . . .<br />
11<br />
(X)<br />
(X) Not applicable.<br />
Note: Detail does not add to total because <strong>of</strong> multiple responses.<br />
U.S. Fish & <strong>Wildlife</strong> Service <strong>2006</strong> <strong>National</strong> <strong>Survey</strong> <strong>of</strong> <strong>Fishing</strong>, <strong>Hunting</strong>, <strong>and</strong> <strong>Wildlife</strong>-<strong>Associated</strong> Recreation 87
Table 41. Participation in <strong>Wildlife</strong>-Watching Activities Around the Home: <strong>2006</strong><br />
(Population 16 years old <strong>and</strong> older. Numbers in thous<strong>and</strong>s)<br />
Activity<br />
Number<br />
Percent<br />
Activity<br />
Number<br />
Percent<br />
Total around the home .......... 67,756 100<br />
Observe wildlife............... 44,467 66<br />
Photograph wildlife ............ 18,763 28<br />
Feed wildlife.................. 55,512 82<br />
Visit public parks or other public<br />
areas 1 ....................... 13,271 20<br />
Maintain natural areas ......... 10,248 15<br />
Maintain plantings ............. 9,587 14<br />
OBSERVE WILDLIFE<br />
Participants observing:<br />
Total, all wildlife.............. 44,467 100<br />
Birds....................... 41,821 94<br />
L<strong>and</strong> mammals, all .......... 36,644 82<br />
Large mammals........... 21,295 48<br />
Small mammals ........... 33,934 76<br />
Amphibians or reptiles ...... 12,750 29<br />
Insects or spiders ............ 15,983 36<br />
Fish or other wildlife ........ 9,067 20<br />
Participants observing:<br />
Total, 1 day or more .......... 44,467 100<br />
1 to 10 days ................ 9,402 21<br />
11 to 20 days ............... 3,332 7<br />
21 to 50 days .............. 5,437 12<br />
51 to 100 days .............. 6,516 15<br />
101 to 200 days ............. 6,486 15<br />
201 days or more............ 12,434 28<br />
VISIT PUBLIC PARKS OR<br />
AREAS 1<br />
Participants visiting:<br />
Total, 1 day or more .......... 13,271 100<br />
1 to 5 days ................. 6,406 48<br />
6 to 10 days ................ 2,073 16<br />
11 days or more ............. 4,595 35<br />
PHOTOGRAPH WILDLIFE<br />
Participants photographing:<br />
Total, 1 day or more .......... 18,763 100<br />
1day ...................... 2,671 14<br />
2 to 3 days ................. 5,451 29<br />
4 to 5 days ................. 2,446 13<br />
6 to 10 days ................ 2,846 15<br />
11 to 20 days ............... 1,972 11<br />
21 days or more............. 2,866 15<br />
FEED WILDLIFE<br />
Participants feeding:<br />
Total, all wildlife.............. 55,512 100<br />
Wild birds .................. 53,350 96<br />
Other wildlife ............... 19,177 35<br />
MAINTAIN NATURAL AREAS<br />
Participants maintaining:<br />
Total, all acreages............. 10,248 100<br />
1 acre or less ............... 6,379 62<br />
2 to 10 acres................ 2,625 26<br />
11 to 50 acres............... 820 8<br />
More than 50 acres ......... 369 4<br />
MAINTAIN PLANTINGS<br />
Participants maintaining<br />
plantings ..................... 9,587 100<br />
Participants spending:<br />
Lessthan$25................. 3,975 41<br />
$25to$75.................... 2,283 24<br />
Morethan$75 ................ 2,833 30<br />
Average expenditure per<br />
participant for plantings ......... $171 (X)<br />
(X) Not applicable.<br />
1<br />
Includes visits only to parks or publicly held areas within 1 mile <strong>of</strong> home.<br />
Note: Detail does not add to total because <strong>of</strong> multiple responses <strong>and</strong> nonresponse.<br />
88 <strong>2006</strong> <strong>National</strong> <strong>Survey</strong> <strong>of</strong> <strong>Fishing</strong>, <strong>Hunting</strong>, <strong>and</strong> <strong>Wildlife</strong>-<strong>Associated</strong> Recreation U.S. Fish & <strong>Wildlife</strong> Service
Table 42. Away-From-Home <strong>Wildlife</strong> Watchers by <strong>Wildlife</strong> Observed, Photographed, or Fed <strong>and</strong> Place:<br />
<strong>2006</strong><br />
(Population 16 years old <strong>and</strong> older. Numbers in thous<strong>and</strong>s)<br />
<strong>Wildlife</strong> observed, photographed,<br />
or fed<br />
Participation by place<br />
Total participants<br />
Total In state <strong>of</strong> residence In other states<br />
Number Percent Number Percent Number Percent Number Percent<br />
Total, all wildlife .................. 22,977 100 22,977 100 19,095 83 7,530 33<br />
Total birds ....................... 20,025 87 20,025 100 17,071 85 6,938 35<br />
Songbirds (cardinals, robins, etc.) . . . 13,715 60 13,715 100 11,874 87 4,500 33<br />
Birds <strong>of</strong> prey (hawks, eagles, etc.) . . . 14,018 61 14,018 100 11,544 82 5,129 37<br />
Waterfowl (ducks, geese, etc.) ....... 15,362 67 15,362 100 13,098 85 5,129 33<br />
Other water birds (shorebirds,<br />
herons, cranes, etc.) .............. 11,535 50 11,535 100 9,073 79 4,277 37<br />
Other birds (pheasants, turkeys, road<br />
runners, etc.) .................... 8,805 38 8,805 100 7,326 83 2,657 30<br />
Total l<strong>and</strong> mammals ............... 16,192 70 16,192 100 13,630 84 5,611 35<br />
Large l<strong>and</strong> mammals (deer, bear, etc.) 12,761 56 12,761 100 10,478 82 4,340 34<br />
Small l<strong>and</strong> mammals (squirrel, prairie<br />
dog, etc.) ...................... 13,446 59 13,446 100 11,274 84 4,693 35<br />
Fish (salmon, shark, etc.) ............. 6,754 29 6,754 100 5,276 78 2,412 36<br />
Marine mammals (whales, dolphins,<br />
etc.) ............................. 3,384 15 3,384 100 2,126 63 1,471 43<br />
Other wildlife (turtles, butterflies, etc.) . . 10,358 45 10,358 100 8,697 84 3,430 33<br />
Note: Detail does not add to total because <strong>of</strong> multiple responses. Column showing percent <strong>of</strong> total participants is based on the ‘‘Total, all wildlife’’ number. Participation<br />
by place percent columns are based on the total number <strong>of</strong> participants for each type <strong>of</strong> wildlife.<br />
Table 43. Wild Bird Observers <strong>and</strong> Days <strong>of</strong> Observation: <strong>2006</strong><br />
(Population 16 years old <strong>and</strong> older. Numbers in thous<strong>and</strong>s)<br />
Observers <strong>and</strong> days <strong>of</strong> observation Number Percent<br />
OBSERVERS<br />
Total bird observers ......................................................... 47,693 100<br />
Around-the-home observers .................................................. 41,821 88<br />
Away-from-home observers .................................................. 19,860 42<br />
DAYS<br />
Total days observing birds .................................................... 5,473,398 100<br />
Around the home........................................................... 5,202,536 95<br />
Away from home........................................................... 270,861 5<br />
Note: Detail does not add to total because <strong>of</strong> multiple responses.<br />
U.S. Fish & <strong>Wildlife</strong> Service <strong>2006</strong> <strong>National</strong> <strong>Survey</strong> <strong>of</strong> <strong>Fishing</strong>, <strong>Hunting</strong>, <strong>and</strong> <strong>Wildlife</strong>-<strong>Associated</strong> Recreation 89
Table 44. Expenditures for <strong>Wildlife</strong> Watching: <strong>2006</strong><br />
(Population 16 years old <strong>and</strong> older)<br />
Spenders<br />
Expenditure item<br />
Expenditures<br />
(thous<strong>and</strong>s<br />
<strong>of</strong> dollars)<br />
Number<br />
(thous<strong>and</strong>s)<br />
Percent <strong>of</strong><br />
wildlife-watching<br />
participants 1<br />
Average per spender<br />
(dollars)<br />
Total, all items 2 ........................................ 45,654,960 55,979 79 816<br />
TRIP-RELATED EXPENDITURES<br />
Total trip-related ...................................... 12,875,152 19,443 85 662<br />
Food <strong>and</strong> lodging, total ................................ 7,516,281 16,415 71 458<br />
Food ............................................... 4,298,403 16,261 71 264<br />
Lodging ............................................ 3,217,878 6,624 29 486<br />
Transportation, total ................................... 4,456,013 18,329 80 243<br />
Public ............................................. 1,566,963 2,902 13 540<br />
Private ............................................. 2,889,050 17,447 76 166<br />
Other trip costs, total .................................. 902,858 7,681 33 118<br />
Guide fees, pack trip or package fees..................... 250,047 1,570 7 159<br />
Public l<strong>and</strong> use fees ................................... 140,508 4,331 19 32<br />
Private l<strong>and</strong> use fees .................................. 66,145 1,173 5 56<br />
Equipment rental ..................................... 148,706 1,274 6 117<br />
Boating costs 3 ....................................... 224,981 1,474 6 153<br />
Heating <strong>and</strong> cooking fuel .............................. 72,470 1,885 8 38<br />
EQUIPMENT AND OTHER EXPENSES<br />
Total ................................................. 32,779,808 52,178 73 628<br />
<strong>Wildlife</strong>-watching equipment, total ....................... 9,869,727 49,040 69 201<br />
Binoculars, spotting scopes ............................. 656,462 5,269 7 125<br />
Cameras, video cameras, special lenses, <strong>and</strong> other<br />
photographic equipment .............................. 3,078,089 6,832 10 451<br />
Film <strong>and</strong> developing .................................. 767,465 9,842 14 78<br />
Bird food, total ...................................... 3,350,132 39,944 56 84<br />
Commercially prepared <strong>and</strong> packaged wild bird food ...... 2,707,601 37,332 52 73<br />
Other bulk foods used to feed wild birds ............... 642,531 11,448 16 56<br />
Feed for other wildlife ................................ 664,554 10,341 15 64<br />
Nest boxes, bird houses, feeders, baths ................... 789,918 16,481 23 48<br />
Day packs, carrying cases, <strong>and</strong> special clothing ............ 451,524 3,388 5 133<br />
Other wildlife-watching equipment (such as field guides <strong>and</strong><br />
maps) ............................................. 111,582 3,755 5 30<br />
Auxiliary equipment, total .............................. 1,033,060 4,848 7 213<br />
Tents, tarps ......................................... 243,670 2,336 3 104<br />
Frame packs <strong>and</strong> backpacking equipment ................. 140,371 1,138 2 123<br />
Other camping equipment ............................. 368,281 2,298 3 160<br />
Other auxiliary equipment (such as blinds) ................ 280,739 801 1 350<br />
Special equipment, total ................................ 12,271,266 1,914 3 6,411<br />
Off-the-road vehicle .................................. 3,819,030 586 1 6,520<br />
Travel or tent trailer, pickup, camper, van, motor home, house<br />
trailer, recreational vehicle (RV) ........................ 5,329,261 567 1 9,402<br />
Boats, boat accessories ................................ 1,824,071 779 1 2,341<br />
Cabins ............................................. ... ... ... ...<br />
Other .............................................. *851,940 *205 *(Z) *4,154<br />
Magazines, books ...................................... 359,681 9,490 13 38<br />
L<strong>and</strong> leasing <strong>and</strong> ownership .............................. 6,551,517 871 1 7,524<br />
Membership dues <strong>and</strong> contributions ........................ 1,052,496 7,932 11 133<br />
Plantings .............................................. 1,642,061 6,543 9 251<br />
* Estimate based on a sample size <strong>of</strong> 10–29. ... Sample size too small to report data reliably. (Z) Less than 0.5 percent.<br />
1 Percent <strong>of</strong> wildlife-watching participants column is based on away-from-home participants for trip-related expenditures. For equipment <strong>and</strong> other expenditures the<br />
percent <strong>of</strong> wildlife-watching participants is based on total participants.<br />
2 Information on trip-related expenditures was collected for away-from-home participants only. Equipment <strong>and</strong> other expenditures are based on information collected from<br />
both away-from-home <strong>and</strong> around-the-home participants.<br />
3 Boating costs include launching, mooring, storage, maintenance, insurance, pumpout fees, <strong>and</strong> fuel.<br />
Note: Detail does not add to total because <strong>of</strong> multiple responses <strong>and</strong> nonresponse.<br />
90 <strong>2006</strong> <strong>National</strong> <strong>Survey</strong> <strong>of</strong> <strong>Fishing</strong>, <strong>Hunting</strong>, <strong>and</strong> <strong>Wildlife</strong>-<strong>Associated</strong> Recreation U.S. Fish & <strong>Wildlife</strong> Service
Table 45. Selected Characteristics <strong>of</strong> Participants in <strong>Wildlife</strong>-Watching Activities Away From Home: <strong>2006</strong><br />
(Population 16 years old <strong>and</strong> older. Numbers in thous<strong>and</strong>s)<br />
Characteristic<br />
U.S. population Total wildlife-watching participants Total away-from-home participants<br />
Number Percent Number<br />
Percent who<br />
participated Percent Number<br />
Percent who<br />
participated<br />
Percent<br />
Total persons ...................... 229,245 100 71,132 31 100 22,977 10 100<br />
Population Density <strong>of</strong> Residence<br />
Urban .......................... 176,740 77 46,641 26 66 15,483 9 67<br />
Rural. .......................... 52,504 23 24,491 47 34 7,494 14 33<br />
Population Size <strong>of</strong> Residence<br />
Metropolitan statistical area (MSA) ..... 190,425 83 55,477 29 78 17,892 9 78<br />
1,000,000 or more ............... 120,356 53 31,523 26 44 10,294 9 45<br />
250,000 to 999,999 .............. 46,506 20 15,483 33 22 4,870 10 21<br />
Less than 249,999 ................ 23,562 10 8,471 36 12 2,729 12 12<br />
Outside MSA .................... 38,820 17 15,655 40 22 5,085 13 22<br />
Census Geographic Division<br />
New Engl<strong>and</strong> .................... 11,233 5 4,489 40 6 1,340 12 6<br />
Middle Atlantic ................... 31,518 14 8,723 28 12 2,729 9 12<br />
East North Central ................. 35,609 16 12,215 34 17 3,792 11 17<br />
West North Central. ................ 15,458 7 6,741 44 9 2,163 14 9<br />
South Atlantic .................... 43,965 19 12,862 29 18 3,208 7 14<br />
East South Central ................. 13,722 6 4,931 36 7 1,758 13 8<br />
West South Central ................ 25,407 11 6,764 27 10 2,127 8 9<br />
Mountain ....................... 15,651 7 4,968 32 7 2,004 13 9<br />
Pacific. ......................... 36,681 16 9,439 26 13 3,856 11 17<br />
Age<br />
16to17years.................... 8,272 4 1,441 17 2 583 7 3<br />
18to24years.................... 23,292 10 3,279 14 5 1,083 5 5<br />
25to34years.................... 37,468 16 7,813 21 11 3,053 8 13<br />
35 to 44 years .................... 45,112 20 14,881 33 21 6,045 13 26<br />
45 to 54 years .................... 44,209 19 16,542 37 23 5,225 12 23<br />
55 to 64 years .................... 32,867 14 13,544 41 19 4,437 13 19<br />
65 years <strong>and</strong> older ................. 38,024 17 13,633 36 19 2,551 7 11<br />
Sex<br />
Male, total ...................... 110,273 48 33,397 30 47 11,819 11 51<br />
16to17years................... 4,307 2 756 18 1 231 5 1<br />
18 to 24 years .................. 11,638 5 1,517 13 2 470 4 2<br />
25 to 34 years. .................. 18,278 8 3,561 19 5 1,469 8 6<br />
35 to 44 years. .................. 21,946 10 7,291 33 10 3,350 15 15<br />
45to54years .................. 21,352 9 8,242 39 12 2,716 13 12<br />
55 to 64 years. .................. 16,157 7 6,203 38 9 2,320 14 10<br />
65 years <strong>and</strong> older ............... 16,594 7 5,827 35 8 1,262 8 5<br />
Female, total ..................... 118,972 52 37,735 32 53 11,159 9 49<br />
16to17years................... 3,965 2 684 17 1 352 9 2<br />
18 to 24 years. .................. 11,655 5 1,762 15 2 613 5 3<br />
25to34years................... 19,189 8 4,252 22 6 1,584 8 7<br />
35 to 44 years. .................. 23,166 10 7,590 33 11 2,695 12 12<br />
45to54years .................. 22,857 10 8,300 36 12 2,509 11 11<br />
55 to 64 years. .................. 16,710 7 7,341 44 10 2,117 13 9<br />
65 years <strong>and</strong> older. ............... 21,430 9 7,806 36 11 1,289 6 6<br />
Ethnicity<br />
Hispanic ........................ 29,218 13 4,055 14 6 1,422 5 6<br />
Non-Hispanic ..................... 200,027 87 67,077 34 94 21,556 11 94<br />
Race<br />
White .......................... 189,255 83 65,961 35 93 21,525 11 94<br />
Black .......................... 25,925 11 2,630 10 4 686 3 3<br />
Asian .......................... 10,104 4 1,276 13 2 414 4 2<br />
All others ....................... 3,960 2 1,264 32 2 353 9 2<br />
Annual Household Income<br />
Less than $10,000 ................. 10,673 5 2,284 21 3 623 6 3<br />
$10,000 to $19,999. ................ 15,373 7 3,820 25 5 919 6 4<br />
$20,000 to $24,999 ................ 11,374 5 2,616 23 4 776 7 3<br />
$25,000 to $29,999. ................ 10,524 5 3,233 31 5 881 8 4<br />
$30,000 to $34,999 ................ 11,161 5 3,115 28 4 1,115 10 5<br />
$35,000 to $39,999. ................ 10,349 5 3,430 33 5 1,030 10 4<br />
$40,000 to $49,999 ................ 17,699 8 6,623 37 9 2,145 12 9<br />
$50,000 to $74,999. ................ 33,434 15 13,345 40 19 4,716 14 21<br />
$75,000 to $99,999 ................ 21,519 9 8,623 40 12 3,449 16 15<br />
$100,000 or more ................. 29,159 13 12,433 43 17 4,620 16 20<br />
Not reported. ..................... 57,981 25 11,609 20 16 2,704 5 12<br />
Education<br />
11 years or less ................... 34,621 15 6,920 20 10 1,406 4 6<br />
12 years. ........................ 78,073 34 21,818 28 31 6,102 8 27<br />
1 to 3 years college ................ 53,019 23 18,022 34 25 6,155 12 27<br />
4 years college .................... 39,506 17 13,781 35 19 4,905 12 21<br />
5 or more years college. ............. 24,025 10 10,591 44 15 4,409 18 19<br />
See footnotes at end <strong>of</strong> table.<br />
U.S. Fish & <strong>Wildlife</strong> Service <strong>2006</strong> <strong>National</strong> <strong>Survey</strong> <strong>of</strong> <strong>Fishing</strong>, <strong>Hunting</strong>, <strong>and</strong> <strong>Wildlife</strong>-<strong>Associated</strong> Recreation 91
Table 45. Selected Characteristics <strong>of</strong> Participants in <strong>Wildlife</strong>-Watching Activities Away From Home:<br />
<strong>2006</strong>—Continued<br />
(Population 16 years old <strong>and</strong> older. Numbers in thous<strong>and</strong>s)<br />
Away-from-home participants<br />
Characteristic<br />
Number<br />
Observe Photograph Feed<br />
Percent<br />
who<br />
participated Percent Number<br />
Percent<br />
who<br />
participated Percent Number<br />
Percent<br />
who<br />
participated<br />
Percent<br />
Total persons ...................... 21,546 9 100 11,708 5 100 7,084 3 100<br />
Population Density <strong>of</strong> Residence<br />
Urban .......................... 14,594 8 68 7,787 4 67 4,877 3 69<br />
Rural. .......................... 6,952 13 32 3,922 7 33 2,206 4 31<br />
Population Size <strong>of</strong> Residence<br />
Metropolitan statistical area (MSA) ..... 16,792 9 78 9,285 5 79 5,535 3 78<br />
1,000,000 or more ............... 9,632 8 45 5,498 5 47 3,401 3 48<br />
250,000 to 999,999 .............. 4,596 10 21 2,497 5 21 1,334 3 19<br />
Less than 249,999 ............... 2,563 11 12 1,290 5 11 800 3 11<br />
Outside MSA ..................... 4,754 12 22 2,423 6 21 1,548 4 22<br />
Census Geographic Division<br />
New Engl<strong>and</strong> ..................... 1,245 11 6 677 6 6 327 3 5<br />
Middle Atlantic ................... 2,517 8 12 1,552 5 13 873 3 12<br />
East North Central ................. 3,637 10 17 1,830 5 16 1,267 4 18<br />
West North Central. ................ 2,075 13 10 1,057 7 9 686 4 10<br />
South Atlantic .................... 2,936 7 14 1,627 4 14 1,250 3 18<br />
East South Central ................. 1,652 12 8 769 6 7 612 4 9<br />
West South Central. ................ 1,915 8 9 961 4 8 919 4 13<br />
Mountain ........................ 1,899 12 9 1,088 7 9 409 3 6<br />
Pacific ......................... 3,669 10 17 2,147 6 18 739 2 10<br />
Age<br />
16 to 17 years .................... 524 6 2 *289 *3 *2 *125 *2 *2<br />
18 to 24 years .................... 955 4 4 554 2 5 346 1 5<br />
25 to 34 years .................... 2,725 7 13 1,512 4 13 871 2 12<br />
35 to 44 years .................... 5,787 13 27 3,043 7 26 2,092 5 30<br />
45 to 54 years .................... 4,802 11 22 2,793 6 24 1,479 3 21<br />
55 to 64 years .................... 4,291 13 20 2,361 7 20 1,321 4 19<br />
65 years <strong>and</strong> older ................. 2,462 6 11 1,156 3 10 848 2 12<br />
Sex<br />
Male, total ...................... 10,983 10 51 5,795 5 49 3,348 3 47<br />
16 to 17 years. .................. *217 *5 *1 *97 *2 *1 ... ... ...<br />
18 to 24 years .................. 420 4 2 *169 *1 *1 *159 *1 *2<br />
25 to 34 years. .................. 1,300 7 6 760 4 6 339 2 5<br />
35 to 44 years. .................. 3,172 14 15 1,582 7 14 986 4 14<br />
45 to 54 years .................. 2,449 11 11 1,367 6 12 761 4 11<br />
55 to 64 years. .................. 2,212 14 10 1,183 7 10 565 3 8<br />
65 years <strong>and</strong> older ............... 1,214 7 6 637 4 5 491 3 7<br />
Female, total ..................... 10,562 9 49 5,914 5 51 3,735 3 53<br />
16 to 17 years .................. *307 *8 *1 *192 *5 *2 ... ... ...<br />
18 to 24 years .................. 535 5 2 385 3 3 *187 *2 *3<br />
25 to 34 years. .................. 1,425 7 7 752 4 6 533 3 8<br />
35 to 44 years .................. 2,614 11 12 1,461 6 12 1,106 5 16<br />
45 to 54 years .................. 2,354 10 11 1,426 6 12 719 3 10<br />
55 to 64 years. .................. 2,079 12 10 1,179 7 10 756 5 11<br />
65 years <strong>and</strong> older. ............... 1,248 6 6 519 2 4 358 2 5<br />
Ethnicity<br />
Hispanic ........................ 1,252 4 6 775 3 7 503 2 7<br />
Non-Hispanic ..................... 20,293 10 94 10,933 5 93 6,581 3 93<br />
Race<br />
White .......................... 20,239 11 94 10,901 6 93 6,496 3 92<br />
Black .......................... 622 2 3 366 1 3 *183 *1 *3<br />
Asian .......................... 392 4 2 *213 *2 *2 *232 *2 *3<br />
All others ....................... 293 7 1 228 6 2 *173 *4 *2<br />
Annual Household Income<br />
Less than $10,000 ................. 611 6 3 *235 *2 *2 *214 *2 *3<br />
$10,000 to $19,999. ................ 835 5 4 373 2 3 303 2 4<br />
$20,000 to $24,999 ................ 719 6 3 373 3 3 357 3 5<br />
$25,000 to $29,999. ................ 805 8 4 421 4 4 265 3 4<br />
$30,000 to $34,999 ................ 1,011 9 5 586 5 5 525 5 7<br />
$35,000 to $39,999. ................ 995 10 5 476 5 4 359 3 5<br />
$40,000 to $49,999 ................ 1,946 11 9 1,066 6 9 669 4 9<br />
$50,000 to $74,999 ................ 4,414 13 20 2,277 7 19 1,288 4 18<br />
$75,000 to $99,999 ................ 3,296 15 15 1,804 8 15 1,176 5 17<br />
$100,000 or more ................. 4,318 15 20 2,803 10 24 1,064 4 15<br />
Not reported. ..................... 2,596 4 12 1,295 2 11 863 1 12<br />
Education<br />
11 years or less ................... 1,266 4 6 669 2 6 499 1 7<br />
12 years. ........................ 5,581 7 26 2,651 3 23 2,057 3 29<br />
1 to 3 years college ................ 5,808 11 27 3,236 6 28 2,084 4 29<br />
4 years college .................... 4,667 12 22 2,574 7 22 1,297 3 18<br />
5 or more years college. ............. 4,224 18 20 2,579 11 22 1,147 5 16<br />
* Estimate based on a sample size <strong>of</strong> 10–29. ... Sample size too small to report data reliably.<br />
Note: Detail does not add to total because <strong>of</strong> multiple responses. Percent who participated columns show the percent <strong>of</strong> each row’s population who participated in the activity named by the column.<br />
Percent columns show the percent <strong>of</strong> each column’s participants who are described by the row heading.<br />
92 <strong>2006</strong> <strong>National</strong> <strong>Survey</strong> <strong>of</strong> <strong>Fishing</strong>, <strong>Hunting</strong>, <strong>and</strong> <strong>Wildlife</strong>-<strong>Associated</strong> Recreation U.S. Fish & <strong>Wildlife</strong> Service
Table 46. Selected Characteristics <strong>of</strong> Participants in <strong>Wildlife</strong>-Watching Activities Around the Home: <strong>2006</strong><br />
(Population 16 years old <strong>and</strong> older. Numbers in thous<strong>and</strong>s)<br />
Characteristic<br />
U.S. population Total wildlife-watching participants Total around-the-home participants<br />
Number Percent Number<br />
Percent who<br />
participated Percent Number<br />
Percent who<br />
participated<br />
Percent<br />
Total persons ...................... 229,245 100 71,132 31 100 67,756 30 100<br />
Population Density <strong>of</strong> Residence<br />
Urban .......................... 176,740 77 46,641 26 66 44,064 25 65<br />
Rural .......................... 52,504 23 24,491 47 34 23,692 45 35<br />
Population Size <strong>of</strong> Residence<br />
Metropolitan statistical area (MSA) ..... 190,425 83 55,477 29 78 52,820 28 78<br />
1,000,000 or more ............... 120,356 53 31,523 26 44 30,000 25 44<br />
250,000 to 999,999 ............... 46,506 20 15,483 33 22 14,763 32 22<br />
Less than 249,999 ............... 23,562 10 8,471 36 12 8,057 34 12<br />
Outside MSA .................... 38,820 17 15,655 40 22 14,936 38 22<br />
Census Geographic Division<br />
New Engl<strong>and</strong> .................... 11,233 5 4,489 40 6 4,310 38 6<br />
Middle Atlantic ................... 31,518 14 8,723 28 12 8,451 27 12<br />
East North Central ................. 35,609 16 12,215 34 17 11,845 33 17<br />
West North Central. ................ 15,458 7 6,741 44 9 6,447 42 10<br />
South Atlantic .................... 43,965 19 12,862 29 18 12,432 28 18<br />
East South Central ................. 13,722 6 4,931 36 7 4,683 34 7<br />
West South Central. ................ 25,407 11 6,764 27 10 6,319 25 9<br />
Mountain ........................ 15,651 7 4,968 32 7 4,605 29 7<br />
Pacific ......................... 36,681 16 9,439 26 13 8,664 24 13<br />
Age<br />
16 to 17 years .................... 8,272 4 1,441 17 2 1,285 16 2<br />
18 to 24 years .................... 23,292 10 3,279 14 5 2,969 13 4<br />
25 to 34 years .................... 37,468 16 7,813 21 11 7,149 19 11<br />
35 to 44 years .................... 45,112 20 14,881 33 21 13,800 31 20<br />
45to54years.................... 44,209 19 16,542 37 23 16,051 36 24<br />
55 to 64 years .................... 32,867 14 13,544 41 19 13,042 40 19<br />
65 years <strong>and</strong> older ................. 38,024 17 13,633 36 19 13,460 35 20<br />
Sex<br />
Male, total ...................... 110,273 48 33,397 30 47 31,456 29 46<br />
16 to 17 years. .................. 4,307 2 756 18 1 692 16 1<br />
18to24years................... 11,638 5 1,517 13 2 1,369 12 2<br />
25 to 34 years .................. 18,278 8 3,561 19 5 3,258 18 5<br />
35 to 44 years. .................. 21,946 10 7,291 33 10 6,632 30 10<br />
45to54years .................. 21,352 9 8,242 39 12 7,947 37 12<br />
55 to 64 years. .................. 16,157 7 6,203 38 9 5,816 36 9<br />
65 years <strong>and</strong> older ............... 16,594 7 5,827 35 8 5,742 35 8<br />
Female, total ..................... 118,972 52 37,735 32 53 36,300 31 54<br />
16to17years .................. 3,965 2 684 17 1 593 15 1<br />
18to24years................... 11,655 5 1,762 15 2 1,600 14 2<br />
25 to 34 years. .................. 19,189 8 4,252 22 6 3,891 20 6<br />
35 to 44 years. .................. 23,166 10 7,590 33 11 7,169 31 11<br />
45to54years .................. 22,857 10 8,300 36 12 8,104 35 12<br />
55 to 64 years. .................. 16,710 7 7,341 44 10 7,226 43 11<br />
65 years <strong>and</strong> older. ............... 21,430 9 7,806 36 11 7,718 36 11<br />
Ethnicity<br />
Hispanic ........................ 29,218 13 4,055 14 6 3,604 12 5<br />
Non-Hispanic ..................... 200,027 87 67,077 34 94 64,152 32 95<br />
Race<br />
White .......................... 189,255 83 65,961 35 93 62,872 33 93<br />
Black .......................... 25,925 11 2,630 10 4 2,482 10 4<br />
Asian .......................... 10,104 4 1,276 13 2 1,259 12 2<br />
All others ....................... 3,960 2 1,264 32 2 1,144 29 2<br />
Annual Household Income<br />
Less than $10,000 ................. 10,673 5 2,284 21 3 2,218 21 3<br />
$10,000 to $19,999. ................ 15,373 7 3,820 25 5 3,724 24 5<br />
$20,000 to $24,999 ................ 11,374 5 2,616 23 4 2,538 22 4<br />
$25,000 to $29,999. ................ 10,524 5 3,233 31 5 3,107 30 5<br />
$30,000 to $34,999 ................ 11,161 5 3,115 28 4 2,893 26 4<br />
$35,000 to $39,999. ................ 10,349 5 3,430 33 5 3,189 31 5<br />
$40,000 to $49,999 ................ 17,699 8 6,623 37 9 6,415 36 9<br />
$50,000 to $74,999. ................ 33,434 15 13,345 40 19 12,599 38 19<br />
$75,000 to $99,999 ................ 21,519 9 8,623 40 12 7,996 37 12<br />
$100,000 or more ................. 29,159 13 12,433 43 17 11,757 40 17<br />
Not reported. ..................... 57,981 25 11,609 20 16 11,322 20 17<br />
Education<br />
11 years or less ................... 34,621 15 6,920 20 10 6,621 19 10<br />
12 years. ........................ 78,073 34 21,818 28 31 20,876 27 31<br />
1 to 3 years college ................ 53,019 23 18,022 34 25 17,018 32 25<br />
4 years college .................... 39,506 17 13,781 35 19 13,246 34 20<br />
5 or more years college. ............. 24,025 10 10,591 44 15 9,995 42 15<br />
See footnotes at end <strong>of</strong> table.<br />
U.S. Fish & <strong>Wildlife</strong> Service <strong>2006</strong> <strong>National</strong> <strong>Survey</strong> <strong>of</strong> <strong>Fishing</strong>, <strong>Hunting</strong>, <strong>and</strong> <strong>Wildlife</strong>-<strong>Associated</strong> Recreation 93
Table 46. Selected Characteristics <strong>of</strong> Participants in <strong>Wildlife</strong>-Watching Activities Around the Home:<br />
<strong>2006</strong>—Continued<br />
(Population 16 years old <strong>and</strong> older. Numbers in thous<strong>and</strong>s)<br />
Around-the-home participants<br />
Characteristic<br />
Number<br />
Observe Photograph Feed wild birds<br />
Percent<br />
who<br />
participated Percent Number<br />
Percent<br />
who<br />
participated Percent Number<br />
Percent<br />
who<br />
participated<br />
Percent<br />
Total persons ...................... 44,467 19 100 18,763 8 100 53,350 23 100<br />
Population Density <strong>of</strong> Residence<br />
Urban .......................... 28,296 16 64 11,622 7 62 33,540 19 63<br />
Rural. .......................... 16,171 31 36 7,141 14 38 19,810 38 37<br />
Population Size <strong>of</strong> Residence<br />
Metropolitan statistical area (MSA) ..... 34,307 18 77 14,639 8 78 40,866 21 77<br />
1,000,000 or more ............... 18,989 16 43 8,688 7 46 22,590 19 42<br />
250,000 to 999,999 .............. 9,743 21 22 3,909 8 21 11,606 25 22<br />
Less than 249,999 ............... 5,575 24 13 2,041 9 11 6,670 28 13<br />
Outside MSA ..................... 10,159 26 23 4,125 11 22 12,484 32 23<br />
Census Geographic Division<br />
New Engl<strong>and</strong> ..................... 3,080 27 7 1,275 11 7 3,337 30 6<br />
Middle Atlantic ................... 5,375 17 12 2,127 7 11 6,668 21 12<br />
East North Central ................. 7,459 21 17 3,380 9 18 9,631 27 18<br />
West North Central. ................ 4,472 29 10 1,597 10 9 5,190 34 10<br />
South Atlantic .................... 7,854 18 18 3,402 8 18 10,100 23 19<br />
East South Central ................. 3,225 23 7 1,074 8 6 3,956 29 7<br />
West South Central. ................ 3,995 16 9 2,041 8 11 5,387 21 10<br />
Mountain ....................... 3,093 20 7 1,312 8 7 3,096 20 6<br />
Pacific ......................... 5,915 16 13 2,554 7 14 5,986 16 11<br />
Age<br />
16 to 17 years .................... 682 8 2 443 5 2 844 10 2<br />
18 to 24 years .................... 1,655 7 4 739 3 4 2,104 9 4<br />
25 to 34 years .................... 4,300 11 10 2,236 6 12 4,938 13 9<br />
35 to 44 years .................... 9,019 20 20 4,512 10 24 10,337 23 19<br />
45 to 54 years .................... 10,600 24 24 4,905 11 26 12,771 29 24<br />
55 to 64 years .................... 9,230 28 21 3,548 11 19 10,769 33 20<br />
65 years <strong>and</strong> older ................. 8,982 24 20 2,381 6 13 11,587 30 22<br />
Sex<br />
Male, total ...................... 20,272 18 46 9,033 8 48 24,001 22 45<br />
16 to 17 years. .................. 291 7 1 *230 *5 *1 456 11 1<br />
18 to 24 years. .................. 758 7 2 406 3 2 1,009 9 2<br />
25 to 34 years .................. 2,022 11 5 1,018 6 5 2,087 11 4<br />
35 to 44 years. .................. 4,333 20 10 2,185 10 12 4,892 22 9<br />
45 to 54 years .................. 5,093 24 11 2,479 12 13 5,998 28 11<br />
55 to 64 years .................. 4,027 25 9 1,539 10 8 4,686 29 9<br />
65 years <strong>and</strong> older ............... 3,747 23 8 1,176 7 6 4,873 29 9<br />
Female, total ..................... 24,195 20 54 9,731 8 52 29,350 25 55<br />
16 to 17 years .................. 390 10 1 *212 *5 *1 388 10 1<br />
18 to 24 years. .................. 897 8 2 333 3 2 1,095 9 2<br />
25 to 34 years .................. 2,278 12 5 1,219 6 6 2,851 15 5<br />
35 to 44 years .................. 4,686 20 11 2,327 10 12 5,445 24 10<br />
45 to 54 years .................. 5,506 24 12 2,425 11 13 6,773 30 13<br />
55 to 64 years .................. 5,202 31 12 2,009 12 11 6,083 36 11<br />
65 years <strong>and</strong> older. ............... 5,235 24 12 1,206 6 6 6,714 31 13<br />
Ethnicity<br />
Hispanic ........................ 2,042 7 5 708 2 4 2,459 8 5<br />
Non-Hispanic ..................... 42,425 21 95 18,055 9 96 50,891 25 95<br />
Race<br />
White .......................... 41,544 22 93 17,560 9 94 49,559 26 93<br />
Black .......................... 1,511 6 3 546 2 3 1,931 7 4<br />
Asian .......................... 662 7 1 402 4 2 953 9 2<br />
All others ....................... 749 19 2 255 6 1 907 23 2<br />
Annual Household Income<br />
Less than $10,000 ................. 1,397 13 3 391 4 2 1,791 17 3<br />
$10,000 to $19,999. ................ 2,192 14 5 705 5 4 3,135 20 6<br />
$20,000 to $24,999. ................ 1,644 14 4 437 4 2 2,168 19 4<br />
$25,000 to $29,999. ................ 1,832 17 4 778 7 4 2,368 22 4<br />
$30,000 to $34,999 ................ 2,058 18 5 659 6 4 2,235 20 4<br />
$35,000 to $39,999. ................ 2,106 20 5 714 7 4 2,475 24 5<br />
$40,000 to $49,999 ................ 4,023 23 9 1,643 9 9 5,062 29 9<br />
$50,000 to $74,999 ................ 8,349 25 19 3,961 12 21 10,264 31 19<br />
$75,000 to $99,999 ................ 5,192 24 12 2,606 12 14 6,327 29 12<br />
$100,000 or more ................. 8,133 28 18 4,078 14 22 8,758 30 16<br />
Not reported. ..................... 7,540 13 17 2,793 5 15 8,767 15 16<br />
Education<br />
11 years or less ................... 4,015 12 9 1,057 3 6 5,246 15 10<br />
12 years. ........................ 12,827 16 29 4,986 6 27 17,099 22 32<br />
1 to 3 years college ................ 11,316 21 25 5,092 10 27 13,556 26 25<br />
4 years college .................... 9,046 23 20 4,250 11 23 9,915 25 19<br />
5 or more years college. ............. 7,262 30 16 3,378 14 18 7,534 31 14<br />
* Estimate based on a sample size <strong>of</strong> 10–29.<br />
Note: Detail does not add to total because <strong>of</strong> multiple responses <strong>and</strong> nonresponse. Percent who participated columns show the percent <strong>of</strong> each row’s population who participated in the activity named<br />
by the column. Percent columns show the percent <strong>of</strong> each column’s participants who are described by the row heading.<br />
94 <strong>2006</strong> <strong>National</strong> <strong>Survey</strong> <strong>of</strong> <strong>Fishing</strong>, <strong>Hunting</strong>, <strong>and</strong> <strong>Wildlife</strong>-<strong>Associated</strong> Recreation U.S. Fish & <strong>Wildlife</strong> Service
Table 47. L<strong>and</strong> Owned or Leased for the Primary Purpose <strong>of</strong> <strong>Wildlife</strong> Watching: <strong>2006</strong><br />
(Population 16 years <strong>of</strong> age or older. Numbers in thous<strong>and</strong>s)<br />
<strong>Wildlife</strong> watching Number Average per person<br />
L<strong>and</strong> Ownership for <strong>Wildlife</strong> Watching<br />
Participants owning l<strong>and</strong>..................................................... 1,121 (X)<br />
Acres owned .............................................................. 38,276 34<br />
Expenditures for owned l<strong>and</strong> ................................................. 6,235,351 5,562<br />
L<strong>and</strong> Leasing for <strong>Wildlife</strong> Watching<br />
Participants leasing l<strong>and</strong> ..................................................... *192 (X)<br />
Acres leased............................................................... *11,878 *62<br />
Expenditures for leased l<strong>and</strong>.................................................. *316,166 *1,646<br />
* Estimate based on a sample size <strong>of</strong> 10–29. (X) Not applicable.<br />
Note: Detail does not add to total because <strong>of</strong> multiple responses <strong>and</strong> nonresponse.<br />
Table 48. Participation <strong>of</strong> <strong>Wildlife</strong>-Watching Participants in <strong>Fishing</strong> <strong>and</strong> <strong>Hunting</strong>: <strong>2006</strong><br />
(Population 16 years old <strong>and</strong> older. Numbers in thous<strong>and</strong>s)<br />
Type <strong>of</strong> fishing <strong>and</strong> hunting<br />
Total Away from home Around the home<br />
Number Percent Number Percent Number Percent<br />
Total participants ......................... 71,132 100 22,977 100 67,756 100<br />
Nonsportspersons ......................... 53,496 75 14,386 63 52,395 77<br />
Sportspersons ............................ 17,636 25 8,591 37 15,361 23<br />
Anglers ............................... 15,621 22 7,596 33 13,657 20<br />
Hunters ............................... 7,149 10 3,705 16 6,195 9<br />
Note: Detail does not add to total because <strong>of</strong> multiple responses <strong>and</strong> nonresponse.<br />
Table 49. Participation <strong>of</strong> Sportspersons in <strong>Wildlife</strong>-Watching Activities: <strong>2006</strong><br />
(Population 16 years old <strong>and</strong> older. Numbers in thous<strong>and</strong>s)<br />
<strong>Wildlife</strong>-watching activity<br />
Sportspersons Anglers Hunters<br />
Number Percent Number Percent Number Percent<br />
Total sportspersons ........................ 33,916 100 29,952 100 12,510 100<br />
Sportspersons who:<br />
Did not engage in wildlife-watching activities. . 16,280 48 14,332 48 5,361 43<br />
Engaged in wildlife-watching activities ....... 17,636 52 15,621 52 7,149 57<br />
Away from home ....................... 8,591 25 7,596 25 3,705 30<br />
Around the home ....................... 15,361 45 13,657 46 6,195 50<br />
Note: Detail does not add to total because <strong>of</strong> multiple responses <strong>and</strong> nonresponse.<br />
U.S. Fish & <strong>Wildlife</strong> Service <strong>2006</strong> <strong>National</strong> <strong>Survey</strong> <strong>of</strong> <strong>Fishing</strong>, <strong>Hunting</strong>, <strong>and</strong> <strong>Wildlife</strong>-<strong>Associated</strong> Recreation 95
Table 50. Participation in <strong>Wildlife</strong>-<strong>Associated</strong> Recreation by State Residents Inside <strong>and</strong> Outside Their<br />
Resident State: <strong>2006</strong><br />
(Population 16 years old <strong>and</strong> older. Numbers in thous<strong>and</strong>s)<br />
Participant’s state<br />
<strong>of</strong> residence<br />
Population<br />
Total participants Sportspersons <strong>Wildlife</strong>-watching participants<br />
Number<br />
Percent <strong>of</strong><br />
population<br />
Number<br />
Percent <strong>of</strong><br />
population<br />
Number<br />
Percent <strong>of</strong><br />
population<br />
United States, total .... 229,245 87,465 38 33,916 15 71,132 31<br />
Alabama ................ 3,550 1,417 40 707 20 1,006 28<br />
Alaska. ................. 499 288 58 149 30 207 42<br />
Arizona ................ 4,585 1,233 27 418 9 988 22<br />
Arkansas ............... 2,156 1,082 50 551 26 859 40<br />
California .............. 27,299 6,804 25 1,783 7 5,799 21<br />
Colorado ................ 3,605 1,735 48 593 16 1,459 40<br />
Connecticut.............. 2,735 1,223 45 297 11 1,102 40<br />
Delaware................ 669 256 38 85 13 212 32<br />
Florida ................. 14,233 4,626 33 2,004 14 3,520 25<br />
Georgia ................ 6,910 2,415 35 1,161 17 1,819 26<br />
Hawaii ................. 1,014 227 22 100 10 160 16<br />
Idaho. .................. 1,102 564 51 259 24 432 39<br />
Illinois ................. 9,767 2,886 30 1,109 11 2,355 24<br />
Indiana ................. 4,799 2,279 47 822 17 1,825 38<br />
Iowa ................... 2,339 1,306 56 518 22 1,111 48<br />
Kansas ................. 2,110 979 46 425 20 787 37<br />
Kentucky ............... 3,260 1,667 51 670 21 1,341 41<br />
Louisiana ............... 3,433 1,106 32 678 20 712 21<br />
Maine .................. 1,074 717 67 266 25 600 56<br />
Maryl<strong>and</strong> ............... 4,333 1,549 36 521 12 1,334 31<br />
Massachusetts ........... 5,032 1,931 38 472 9 1,725 34<br />
Michigan ............... 7,804 3,651 47 1,371 18 2,947 38<br />
Minnesota .............. 4,021 2,480 62 1,280 32 1,946 48<br />
Mississippi .............. 2,214 896 40 537 24 618 28<br />
Missouri ................ 4,521 2,496 55 1,096 24 2,059 46<br />
Montana ................ 753 510 68 232 31 412 55<br />
Nebraska................ 1,359 552 41 234 17 438 32<br />
Nevada ................. 1,895 530 28 182 10 420 22<br />
New Hampshire .......... 1,044 527 51 141 14 471 45<br />
New Jersey .............. 6,734 1,826 27 562 8 1,537 23<br />
New Mexico............. 1,500 601 40 224 15 490 33<br />
NewYork............... 14,990 4,103 27 1,236 8 3,548 24<br />
North Carolina .......... 6,719 2,816 42 1,038 15 2,267 34<br />
North Dakota ........... 507 232 46 145 29 134 26<br />
Ohio ................... 8,889 4,022 45 1,488 17 3,379 38<br />
Oklahoma .............. 2,743 1,372 50 602 22 1,082 39<br />
Oregon ................. 2,889 1,531 53 550 19 1,266 44<br />
Pennsylvania............. 9,793 4,165 43 1,415 14 3,638 37<br />
Rhode Isl<strong>and</strong> ............ 842 355 42 86 10 312 37<br />
South Carolina ........... 3,315 1,283 39 595 18 943 28<br />
South Dakota ............ 601 327 54 136 23 266 44<br />
Tennessee ............... 4,699 2,287 49 775 16 1,966 42<br />
Texas. .................. 17,076 5,481 32 2,668 16 4,111 24<br />
Utah ................... 1,808 764 42 351 19 574 32<br />
Vermont ................ 506 311 62 91 18 279 55<br />
Virginia................. 5,893 2,500 42 857 15 2,126 36<br />
Washington.............. 4,980 2,315 46 764 15 2,007 40<br />
West Virginia ............ 1,458 735 50 364 25 585 40<br />
Wisconsin ............... 4,350 2,217 51 1,185 27 1,710 39<br />
Wyoming ............... 405 229 57 113 28 194 48<br />
Note: Detail does not add to total because <strong>of</strong> multiple responses. U.S. totals include responses from participants residing in the District <strong>of</strong> Columbia, as described in<br />
Appendix D.<br />
96 <strong>2006</strong> <strong>National</strong> <strong>Survey</strong> <strong>of</strong> <strong>Fishing</strong>, <strong>Hunting</strong>, <strong>and</strong> <strong>Wildlife</strong>-<strong>Associated</strong> Recreation U.S. Fish & <strong>Wildlife</strong> Service
Table 51. Participation in <strong>Wildlife</strong>-<strong>Associated</strong> Recreation in Each State by Both Residents <strong>and</strong><br />
Nonresidents <strong>of</strong> the State: <strong>2006</strong><br />
(Population 16 years old <strong>and</strong> older. Numbers in thous<strong>and</strong>s)<br />
State where activity<br />
took place<br />
Total participants Sportspersons <strong>Wildlife</strong>-watching participants<br />
Number Percent Number Percent Number Percent<br />
United States, total .... 87,465 100 33,916 39 71,132 81<br />
Alabama ................ 1,719 100 962 56 1,161 68<br />
Alaska.................. 691 100 315 46 496 72<br />
Arizona ................ 1,546 100 493 32 1,277 83<br />
Arkansas ............... 1,419 100 790 56 1,011 71<br />
California .............. 7,385 100 1,814 25 6,270 85<br />
Colorado ................ 2,234 100 813 36 1,819 81<br />
Connecticut.............. 1,332 100 309 23 1,170 88<br />
Delaware................ 395 100 189 48 285 72<br />
Florida ................. 5,886 100 2,815 48 4,240 72<br />
Georgia ................ 2,773 100 1,308 47 1,987 72<br />
Hawaii ................. 366 100 162 44 262 72<br />
Idaho................... 1,005 100 440 44 754 75<br />
Illinois ................. 3,126 100 1,004 32 2,566 82<br />
Indiana ................. 2,610 100 886 34 2,042 78<br />
Iowa ................... 1,455 100 552 38 1,205 83<br />
Kansas ................. 1,107 100 544 49 816 74<br />
Kentucky ............... 1,906 100 820 43 1,475 77<br />
Louisiana ............... 1,221 100 769 63 738 60<br />
Maine .................. 1,007 100 411 41 801 80<br />
Maryl<strong>and</strong> ............... 1,867 100 707 38 1,491 80<br />
Massachusetts ........... 2,205 100 532 24 1,919 87<br />
Michigan ............... 4,217 100 1,685 40 3,227 77<br />
Minnesota .............. 2,970 100 1,571 53 2,093 70<br />
Mississippi .............. 1,138 100 656 58 731 64<br />
Missouri ................ 2,876 100 1,300 45 2,248 78<br />
Montana ................ 950 100 378 40 755 79<br />
Nebraska................ 650 100 259 40 490 75<br />
Nevada ................. 788 100 177 22 686 87<br />
New Hampshire .......... 839 100 258 31 710 85<br />
New Jersey .............. 2,100 100 696 33 1,713 82<br />
New Mexico............. 947 100 316 33 787 83<br />
NewYork............... 4,595 100 1,428 31 3,852 84<br />
North Carolina .......... 3,412 100 1,361 40 2,641 77<br />
North Dakota ........... 279 100 190 68 148 53<br />
Ohio ................... 4,247 100 1,488 35 3,489 82<br />
Oklahoma .............. 1,472 100 684 46 1,110 75<br />
Oregon ................. 1,837 100 661 36 1,484 81<br />
Pennsylvania............. 4,663 100 1,520 33 3,947 85<br />
Rhode Isl<strong>and</strong> ............ 527 100 163 31 436 83<br />
South Carolina ........... 1,653 100 893 54 1,115 67<br />
South Dakota ............ 572 100 251 44 432 75<br />
Tennessee ............... 2,824 100 969 34 2,362 84<br />
Texas................... 6,029 100 2,940 49 4,225 70<br />
Utah ................... 1,132 100 437 39 877 77<br />
Vermont ................ 545 100 150 27 468 86<br />
Virginia................. 2,866 100 1,045 36 2,312 81<br />
Washington.............. 2,739 100 818 30 2,331 85<br />
West Virginia ............ 994 100 488 49 743 75<br />
Wisconsin ............... 2,913 100 1,582 54 2,039 70<br />
Wyoming ............... 762 100 264 35 643 84<br />
Note: Detail does not add to total because <strong>of</strong> multiple responses. U.S. totals include responses from participants residing in the District <strong>of</strong> Columbia, as described in<br />
Appendix D.<br />
U.S. Fish & <strong>Wildlife</strong> Service <strong>2006</strong> <strong>National</strong> <strong>Survey</strong> <strong>of</strong> <strong>Fishing</strong>, <strong>Hunting</strong>, <strong>and</strong> <strong>Wildlife</strong>-<strong>Associated</strong> Recreation 97
Table 52. Expenditures for <strong>Wildlife</strong>-Related Recreation by State Where Spending Took Place: <strong>2006</strong><br />
(Population 16 years old <strong>and</strong> older. Expenditures in thous<strong>and</strong>s <strong>of</strong> dollars)<br />
State where spending<br />
took place<br />
Total, wildlife-associated expenditures<br />
<strong>Fishing</strong> <strong>and</strong> hunting expenditures<br />
Total Trip-related Equipment Other Total Trip-related Equipment Other<br />
United States, total .... 122,304,987 37,432,326 64,137,178 20,735,483 76,650,027 24,557,174 40,963,125 11,129,728<br />
Alabama ................ 2,188,366 808,343 1,149,125 230,899 1,738,363 656,678 890,573 191,111<br />
Alaska. ................. 1,255,021 922,526 270,541 61,954 673,969 410,924 233,737 29,308<br />
Arizona ................ 2,060,295 714,360 1,151,984 193,951 1,221,988 338,103 862,688 21,197<br />
Arkansas ............... 2,093,535 569,231 1,089,988 434,316 1,486,462 454,352 775,713 256,397<br />
California .............. 7,975,145 3,431,669 4,055,460 488,016 3,795,562 1,434,117 2,123,820 237,625<br />
Colorado ................ 2,972,516 1,126,076 1,722,970 123,470 1,584,779 588,649 905,502 90,628<br />
Connecticut.............. 873,137 189,759 596,284 87,095 363,187 136,733 201,185 25,269<br />
Delaware................ 298,979 75,302 203,737 19,940 168,146 62,174 93,523 12,449<br />
Florida ................. 8,115,284 3,017,044 4,189,608 908,633 5,033,788 2,129,102 2,459,456 445,231<br />
Georgia ................ 3,542,304 754,626 2,139,230 648,448 1,926,988 607,904 893,170 425,913<br />
Hawaii ................. 373,778 268,563 98,427 6,787 163,363 83,464 77,922 1,977<br />
Idaho. .................. 921,985 467,679 385,120 69,186 656,601 274,211 322,363 60,027<br />
Illinois ................. 2,393,450 616,175 1,461,258 316,017 1,259,594 410,199 680,337 169,058<br />
Indiana ................. 2,200,587 451,791 1,501,804 246,992 1,266,667 308,177 830,209 128,282<br />
Iowa ................... 1,033,723 305,785 595,413 132,525 715,716 251,373 396,223 68,120<br />
Kansas ................. 838,316 301,936 478,352 58,028 682,131 249,158 388,057 44,916<br />
Kentucky ............... 1,870,689 437,134 1,226,197 207,358 1,328,630 321,021 852,162 155,446<br />
Louisiana ............... 2,023,585 604,540 989,792 429,252 1,711,155 542,718 801,384 367,053<br />
Maine .................. 1,499,097 355,461 951,465 192,172 633,454 176,998 358,414 98,041<br />
Maryl<strong>and</strong> ............... 1,575,094 425,438 1,042,077 107,580 938,880 354,981 516,067 67,832<br />
Massachusetts ........... 1,614,739 482,766 930,257 201,716 859,776 333,987 436,249 89,539<br />
Michigan ............... 5,134,320 1,185,544 2,783,944 1,164,833 3,511,799 846,356 2,003,686 661,757<br />
Minnesota .............. 4,298,979 1,297,727 2,182,729 818,522 3,600,090 1,026,234 1,811,891 761,964<br />
Mississippi .............. 1,071,563 323,568 491,271 256,724 895,717 254,981 404,718 236,018<br />
Missouri ................ 3,376,385 912,363 1,685,842 778,180 2,507,310 692,431 1,275,031 539,848<br />
Montana ................ 1,129,300 585,233 471,741 72,326 752,849 282,608 417,110 53,131<br />
Nebraska................ 639,982 129,760 412,621 97,601 498,071 107,019 304,273 86,780<br />
Nevada ................. 916,183 259,899 529,124 127,159 553,954 100,964 419,308 33,682<br />
New Hampshire .......... 559,942 222,382 224,050 113,510 286,023 106,246 148,584 31,193<br />
New Jersey .............. 1,663,140 690,158 804,007 168,975 1,125,691 543,858 538,907 42,926<br />
New Mexico............. 822,115 429,743 282,632 109,741 524,941 221,465 200,679 102,797<br />
NewYork............... 3,526,906 1,481,998 1,553,726 491,181 1,959,277 786,275 918,420 254,582<br />
North Carolina .......... 2,711,328 1,029,862 1,449,506 231,959 1,794,425 782,956 860,848 150,621<br />
North Dakota ........... 269,150 116,473 137,318 15,359 246,238 111,521 120,339 14,377<br />
Ohio ................... 3,157,972 914,655 1,859,639 383,678 1,970,269 707,402 1,121,338 141,529<br />
Oklahoma .............. 1,424,671 571,611 768,708 84,352 1,096,011 436,744 591,140 68,127<br />
Oregon ................. 1,995,580 637,590 1,213,970 144,020 1,219,166 375,165 771,151 72,850<br />
Pennsylvania............. 5,402,046 897,758 3,912,745 591,543 3,959,365 572,767 2,983,892 402,705<br />
Rhode Isl<strong>and</strong> ............ 381,086 180,041 126,323 74,722 166,840 82,634 77,439 6,767<br />
South Carolina ........... 2,455,112 843,694 1,324,978 286,441 1,904,335 647,890 1,043,543 212,902<br />
South Dakota ............ 549,769 305,618 166,547 77,604 366,466 175,688 119,571 71,207<br />
Tennessee ............... 2,329,427 727,111 1,314,601 287,716 1,337,066 399,871 881,063 56,132<br />
Texas. .................. 9,167,954 2,862,119 4,695,522 1,610,312 6,228,935 2,437,922 2,915,351 875,662<br />
Utah ................... 1,288,534 577,456 658,473 52,605 724,091 255,433 431,781 36,877<br />
Vermont ................ 383,376 119,682 206,143 57,551 260,504 61,463 175,682 23,358<br />
Virginia................. 2,353,483 768,146 1,412,796 172,540 1,393,293 520,125 785,935 87,233<br />
Washington.............. 3,055,034 870,765 1,599,076 585,192 1,552,723 429,113 1,004,370 119,240<br />
West Virginia ............ 904,973 369,037 435,423 100,513 663,372 232,902 358,355 72,115<br />
Wisconsin ............... 3,918,727 1,282,746 1,433,705 1,202,276 3,174,037 1,022,580 1,148,520 1,002,937<br />
Wyoming ............... 1,078,978 473,584 231,797 373,598 684,109 173,595 167,057 343,457<br />
See footnotes at end <strong>of</strong> table.<br />
98 <strong>2006</strong> <strong>National</strong> <strong>Survey</strong> <strong>of</strong> <strong>Fishing</strong>, <strong>Hunting</strong>, <strong>and</strong> <strong>Wildlife</strong>-<strong>Associated</strong> Recreation U.S. Fish & <strong>Wildlife</strong> Service
Table 52. Expenditures for <strong>Wildlife</strong>-Related Recreation by State Where Spending Took Place:<br />
<strong>2006</strong>—Continued<br />
(Population 16 years old <strong>and</strong> older. Expenditures in thous<strong>and</strong>s <strong>of</strong> dollars)<br />
State where spending<br />
took place<br />
<strong>Wildlife</strong>-watching expenditures<br />
Total Trip-related Equipment Other<br />
United States, total .... 45,654,960 12,875,152 23,174,053 9,605,755<br />
Alabama ................ 450,004 151,665 258,551 39,788<br />
Alaska.................. 581,051 511,602 36,803 32,646<br />
Arizona ................ 838,307 376,256 289,296 172,754<br />
Arkansas ............... 607,073 114,879 314,275 177,919<br />
California .............. 4,179,583 1,997,551 1,931,640 250,391<br />
Colorado ................ 1,387,737 537,427 817,468 32,842<br />
Connecticut.............. 509,950 53,025 395,098 61,826<br />
Delaware................ 130,832 13,128 110,214 7,490<br />
Florida ................. 3,081,496 887,942 1,730,152 463,402<br />
Georgia ................ 1,615,316 146,722 1,246,059 222,534<br />
Hawaii ................. 210,414 185,100 20,505 4,810<br />
Idaho................... 265,383 193,468 62,756 9,159<br />
Illinois ................. 1,133,856 205,976 780,921 146,959<br />
Indiana ................. 933,920 143,615 671,595 118,710<br />
Iowa ................... 318,006 54,411 199,190 64,405<br />
Kansas ................. 156,185 52,778 90,294 13,113<br />
Kentucky ............... 542,059 116,113 374,034 51,912<br />
Louisiana ............... 312,430 61,822 188,409 62,199<br />
Maine .................. 865,643 178,462 593,051 94,130<br />
Maryl<strong>and</strong> ............... 636,214 70,457 526,010 39,748<br />
Massachusetts ........... 754,963 148,779 494,008 112,177<br />
Michigan ............... 1,622,521 339,188 780,258 503,076<br />
Minnesota .............. 698,889 271,493 370,838 56,558<br />
Mississippi .............. 175,846 68,587 86,553 20,706<br />
Missouri ................ 869,075 219,932 410,810 238,332<br />
Montana ................ 376,451 302,625 54,631 19,195<br />
Nebraska................ 141,910 22,741 108,348 10,821<br />
Nevada ................. 362,229 158,935 109,816 93,478<br />
New Hampshire .......... 273,920 116,136 75,466 82,318<br />
New Jersey .............. 537,449 146,300 265,100 126,049<br />
New Mexico............. 297,174 208,278 81,952 6,944<br />
NewYork............... 1,567,629 695,724 635,306 236,599<br />
North Carolina .......... 916,903 246,906 588,658 81,338<br />
North Dakota ........... 22,913 4,952 16,979 981<br />
Ohio ................... 1,187,703 207,253 738,301 242,149<br />
Oklahoma .............. 328,660 134,868 177,568 16,225<br />
Oregon ................. 776,414 262,425 442,818 71,170<br />
Pennsylvania............. 1,442,681 324,990 928,853 188,838<br />
Rhode Isl<strong>and</strong> ............ 214,247 97,407 48,884 67,955<br />
South Carolina ........... 550,777 195,804 281,434 73,539<br />
South Dakota ............ 183,304 129,930 46,977 6,397<br />
Tennessee ............... 992,362 327,240 433,538 231,585<br />
Texas................... 2,939,018 424,197 1,780,171 734,650<br />
Utah ................... 564,443 322,023 226,692 15,728<br />
Vermont ................ 122,872 58,219 30,461 34,192<br />
Virginia................. 960,190 248,021 626,861 85,307<br />
Washington.............. 1,502,311 441,652 594,706 465,953<br />
WestVirginia............ 241,601 136,136 77,068 28,397<br />
Wisconsin ............... 744,689 260,166 285,185 199,339<br />
Wyoming ............... 394,869 299,988 64,740 30,140<br />
Note: U.S. totals include responses from participants residing in the District <strong>of</strong> Columbia, as described in Appendix D.<br />
U.S. Fish & <strong>Wildlife</strong> Service <strong>2006</strong> <strong>National</strong> <strong>Survey</strong> <strong>of</strong> <strong>Fishing</strong>, <strong>Hunting</strong>, <strong>and</strong> <strong>Wildlife</strong>-<strong>Associated</strong> Recreation 99
Table 53. Expenditures for <strong>Wildlife</strong>-Related Recreation in the United States by State Residents Both<br />
Inside <strong>and</strong> Outside Their Resident State: <strong>2006</strong><br />
(Population 16 years old <strong>and</strong> older. Expenditures in thous<strong>and</strong>s <strong>of</strong> dollars)<br />
Participant’s state<br />
<strong>of</strong> residence<br />
Total, wildlife-associated expenditures<br />
<strong>Fishing</strong> <strong>and</strong> hunting expenditures<br />
Total Trip-related Equipment Other Total Trip-related Equipment Other<br />
United States, total .... 122,304,987 37,432,326 64,137,178 20,735,483 76,650,027 24,557,174 40,963,125 11,129,728<br />
Alabama ................ 2,255,226 772,709 1,235,088 247,428 1,761,377 574,577 978,331 208,468<br />
Alaska. ................. 540,041 189,194 283,616 67,231 378,136 123,618 234,027 20,492<br />
Arizona ................ 1,540,698 641,998 688,826 209,873 751,401 340,002 386,602 24,797<br />
Arkansas ............... 1,859,935 489,260 1,017,376 353,300 1,409,243 419,162 708,673 281,409<br />
California .............. 8,579,974 3,936,108 4,043,232 600,633 4,205,307 1,709,474 2,159,640 336,193<br />
Colorado ................ 3,060,175 732,853 2,237,327 89,996 1,906,666 428,910 1,419,958 57,798<br />
Connecticut.............. 1,322,903 470,021 709,848 143,034 593,185 229,313 289,015 74,856<br />
Delaware................ 348,875 79,278 245,131 24,466 230,913 66,788 147,619 16,506<br />
Florida ................. 8,112,073 2,269,467 5,088,990 753,616 4,873,738 1,813,946 2,793,699 266,093<br />
Georgia ................ 3,299,332 938,235 1,810,276 550,821 1,770,640 648,315 785,999 336,326<br />
Hawaii ................. 204,819 88,963 105,457 10,399 150,183 58,958 86,009 5,216<br />
Idaho. .................. 712,613 291,841 394,010 26,763 574,757 204,490 347,687 22,580<br />
Illinois ................. 3,215,834 1,243,245 1,545,352 427,237 1,849,948 811,769 758,090 280,089<br />
Indiana ................. 2,503,372 632,387 1,511,393 359,593 1,386,090 397,631 854,455 134,005<br />
Iowa ................... 1,163,782 412,287 611,904 139,591 766,110 307,745 382,914 75,451<br />
Kansas ................. 968,297 342,207 526,232 99,857 732,552 250,370 397,050 85,132<br />
Kentucky ............... 2,214,149 568,398 1,398,295 247,456 1,511,349 404,563 896,015 210,771<br />
Louisiana ............... 2,023,533 681,610 982,745 359,178 1,602,652 563,293 742,381 296,979<br />
Maine .................. 1,294,577 210,134 939,026 145,417 509,721 104,794 330,541 74,387<br />
Maryl<strong>and</strong> ............... 1,774,605 461,259 1,077,278 236,068 1,047,831 357,994 498,646 191,191<br />
Massachusetts ........... 2,104,733 750,211 1,071,689 282,833 1,219,207 500,231 559,117 159,859<br />
Michigan ............... 5,217,263 1,257,235 2,717,390 1,242,638 3,426,954 734,358 1,937,535 755,061<br />
Minnesota .............. 4,234,352 1,461,945 2,199,914 572,493 3,347,027 1,003,011 1,827,919 516,097<br />
Mississippi .............. 1,066,440 305,415 518,683 242,343 862,477 227,648 414,384 220,445<br />
Missouri ................ 3,295,807 1,046,714 1,638,191 610,903 2,319,214 681,454 1,263,739 374,021<br />
Montana ................ 706,261 197,835 456,323 52,103 575,137 140,374 401,804 32,959<br />
Nebraska................ 650,718 185,410 357,208 108,100 481,102 129,617 254,246 97,239<br />
Nevada ................. 1,211,480 269,099 701,029 241,352 747,551 161,046 437,208 149,296<br />
New Hampshire .......... 423,652 137,114 195,939 90,600 240,420 75,850 140,439 24,131<br />
New Jersey .............. 2,228,739 804,376 848,027 576,336 1,579,731 609,125 598,493 372,113<br />
New Mexico............. 620,544 250,443 313,245 56,856 442,930 168,583 224,982 49,366<br />
NewYork............... 3,573,499 1,716,521 1,416,605 440,373 1,980,373 829,483 924,444 226,446<br />
North Carolina .......... 2,978,628 968,663 1,853,454 156,511 1,968,476 643,695 1,237,884 86,897<br />
North Dakota ........... 242,194 90,275 129,784 22,136 214,095 81,985 111,012 21,099<br />
Ohio ................... 3,283,714 1,232,008 1,682,263 369,442 2,048,073 866,372 1,055,519 126,182<br />
Oklahoma .............. 1,555,383 733,541 737,371 84,470 1,066,297 441,877 556,996 67,424<br />
Oregon ................. 1,780,370 548,422 1,067,345 164,603 1,092,075 371,058 644,947 76,070<br />
Pennsylvania............. 5,820,210 1,320,252 3,900,497 599,461 4,111,971 732,446 2,973,474 406,051<br />
Rhode Isl<strong>and</strong> ............ 317,522 104,760 135,065 77,697 145,186 60,360 77,258 7,567<br />
South Carolina ........... 1,979,808 678,069 1,030,559 271,180 1,577,952 510,605 865,819 201,527<br />
South Dakota ............ 372,940 118,874 185,715 68,352 274,717 72,105 140,709 61,903<br />
Tennessee ............... 2,131,393 721,629 1,027,766 381,998 1,315,528 479,122 690,289 146,116<br />
Texas. .................. 9,392,329 3,328,265 4,528,521 1,535,543 5,931,052 2,405,596 2,724,050 801,406<br />
Utah ................... 1,029,777 400,054 527,986 101,737 837,788 283,653 457,760 96,375<br />
Vermont ................ 243,048 81,443 112,006 49,598 151,374 55,755 73,812 21,808<br />
Virginia................. 2,086,183 726,811 1,194,427 164,945 1,340,347 571,819 685,043 83,485<br />
Washington.............. 3,207,376 792,578 1,794,271 620,527 1,772,537 477,898 1,162,017 132,622<br />
West Virginia ............ 904,338 339,516 415,640 149,183 717,308 256,041 341,988 119,280<br />
Wisconsin ............... 3,342,135 1,034,065 1,289,386 1,018,684 2,697,864 845,439 1,011,982 840,443<br />
Wyoming ............... 705,660 142,014 253,757 309,889 567,607 87,542 185,844 294,221<br />
See footnotes at end <strong>of</strong> table.<br />
100 <strong>2006</strong> <strong>National</strong> <strong>Survey</strong> <strong>of</strong> <strong>Fishing</strong>, <strong>Hunting</strong>, <strong>and</strong> <strong>Wildlife</strong>-<strong>Associated</strong> Recreation U.S. Fish & <strong>Wildlife</strong> Service
Table 53. Expenditures for <strong>Wildlife</strong>-Related Recreation in the United States by State Residents Both<br />
Inside <strong>and</strong> Outside Their Resident State: <strong>2006</strong>—Continued<br />
(Population 16 years old <strong>and</strong> older. Expenditures in thous<strong>and</strong>s <strong>of</strong> dollars)<br />
Participant’s state<br />
<strong>of</strong> residence<br />
<strong>Wildlife</strong>-watching expenditures<br />
Total Trip-related Equipment Other<br />
United States, total .... 45,654,960 12,875,152 23,174,053 9,605,755<br />
Alabama ................ 493,849 198,132 256,757 *38,960<br />
Alaska.................. 161,904 65,576 49,589 46,739<br />
Arizona ................ 789,297 301,997 302,224 185,076<br />
Arkansas ............... 450,692 70,098 308,703 *71,891<br />
California .............. 4,374,667 2,226,634 1,883,592 264,441<br />
Colorado ................ 1,153,510 303,943 817,369 32,198<br />
Connecticut.............. 729,718 240,708 420,832 68,177<br />
Delaware................ 117,962 12,490 97,511 7,960<br />
Florida ................. 3,238,334 455,521 2,295,291 487,522<br />
Georgia ................ 1,528,691 289,920 1,024,277 214,495<br />
Hawaii ................. 54,636 30,005 19,448 5,183<br />
Idaho................... 137,856 87,351 46,323 *4,183<br />
Illinois ................. 1,365,886 431,477 787,262 147,148<br />
Indiana ................. 1,117,282 234,756 656,938 225,588<br />
Iowa ................... 397,672 104,542 228,990 64,140<br />
Kansas ................. 235,745 91,838 129,182 14,725<br />
Kentucky ............... 702,800 163,835 502,280 36,685<br />
Louisiana ............... 420,881 118,317 240,365 62,199<br />
Maine .................. 784,855 105,340 608,486 71,030<br />
Maryl<strong>and</strong> ............... 726,774 103,265 578,632 44,877<br />
Massachusetts ........... 885,526 249,979 512,572 122,975<br />
Michigan ............... 1,790,310 522,877 779,856 487,577<br />
Minnesota .............. 887,325 458,934 371,995 56,396<br />
Mississippi .............. 203,964 77,767 104,299 *21,898<br />
Missouri ................ 976,593 365,259 374,452 236,882<br />
Montana ................ 131,125 57,461 54,520 19,144<br />
Nebraska................ 169,616 55,793 102,961 10,861<br />
Nevada ................. 463,929 108,053 263,821 92,056<br />
New Hampshire .......... 183,232 61,263 55,500 66,469<br />
New Jersey .............. 649,008 195,252 249,533 204,222<br />
New Mexico............. 177,613 81,860 88,263 7,490<br />
NewYork............... 1,593,127 887,039 492,160 213,928<br />
North Carolina .......... 1,010,152 324,968 615,570 69,614<br />
North Dakota ........... 28,099 8,290 18,772 *1,037<br />
Ohio ................... 1,235,640 365,635 626,744 243,261<br />
Oklahoma .............. 489,086 291,664 180,375 17,047<br />
Oregon ................. 688,295 177,364 422,399 88,532<br />
Pennsylvania............. 1,708,239 587,806 927,023 193,410<br />
Rhode Isl<strong>and</strong> ............ 172,336 44,400 57,806 70,130<br />
South Carolina ........... 401,857 167,464 164,740 69,653<br />
South Dakota ............ 98,224 46,769 45,006 6,449<br />
Tennessee ............... 815,865 242,507 337,477 235,882<br />
Texas................... 3,461,277 922,669 1,804,471 734,137<br />
Utah ................... 191,989 116,401 70,227 5,361<br />
Vermont ................ 91,674 25,689 38,195 27,790<br />
Virginia................. 745,837 154,992 509,385 81,460<br />
Washington.............. 1,434,839 314,680 632,254 487,905<br />
WestVirginia............ 187,030 83,475 73,652 *29,903<br />
Wisconsin ............... 644,271 188,626 277,404 178,241<br />
Wyoming ............... 138,052 54,472 67,913 15,668<br />
* Estimate based on a sample size <strong>of</strong> 10–29.<br />
Note: U.S. totals include responses from participants residing in the District <strong>of</strong> Columbia, as described in Appendix D.<br />
U.S. Fish & <strong>Wildlife</strong> Service <strong>2006</strong> <strong>National</strong> <strong>Survey</strong> <strong>of</strong> <strong>Fishing</strong>, <strong>Hunting</strong>, <strong>and</strong> <strong>Wildlife</strong>-<strong>Associated</strong> Recreation 101
Table 54. Anglers <strong>and</strong> Hunters by Sportsperson’s State <strong>of</strong> Residence: <strong>2006</strong><br />
(Population 16 years old <strong>and</strong> older. Numbers in thous<strong>and</strong>s)<br />
Sportsperson’s state<br />
<strong>of</strong> residence<br />
Population<br />
Fished or hunted Fished only Hunted only Fished <strong>and</strong> hunted<br />
Number<br />
Percent <strong>of</strong><br />
population<br />
Number<br />
Percent <strong>of</strong><br />
population<br />
Number<br />
Percent <strong>of</strong><br />
population<br />
Number<br />
Percent <strong>of</strong><br />
population<br />
United States, total .... 229,245 33,916 15 21,406 9 3,964 2 8,546 4<br />
Alabama ................ 3,550 707 20 395 11 79 2 233 7<br />
Alaska. ................. 499 149 30 94 19 *11 *2 44 9<br />
Arizona ................ 4,585 418 9 290 6 48 1 81 2<br />
Arkansas ............... 2,156 551 26 244 11 88 4 220 10<br />
California .............. 27,299 1,783 7 1,465 5 *94 *(Z) 223 1<br />
Colorado ................ 3,605 593 16 460 13 *39 *1 94 3<br />
Connecticut.............. 2,735 297 11 257 9 ... ... 34 1<br />
Delaware................ 669 85 13 64 10 *9 *1 12 2<br />
Florida ................. 14,233 2,004 14 1,678 12 *54 *(Z) 271 2<br />
Georgia ................ 6,910 1,161 17 805 12 *101 *1 255 4<br />
Hawaii ................. 1,014 100 10 81 8 ... ... *14 *1<br />
Idaho. .................. 1,102 259 24 136 12 *36 *3 88 8<br />
Illinois ................. 9,767 1,109 11 837 9 *74 *1 198 2<br />
Indiana ................. 4,799 822 17 569 12 83 2 171 4<br />
Iowa ................... 2,339 518 22 308 13 70 3 141 6<br />
Kansas ................. 2,110 425 20 233 11 56 3 136 6<br />
Kentucky ............... 3,260 670 21 410 13 *49 *1 212 7<br />
Louisiana ............... 3,433 678 20 403 12 *81 *2 195 6<br />
Maine .................. 1,074 266 25 120 11 40 4 106 10<br />
Maryl<strong>and</strong> ............... 4,333 521 12 370 9 46 1 105 2<br />
Massachusetts ........... 5,032 472 9 406 8 *20 *(Z) 46 1<br />
Michigan ............... 7,804 1,371 18 650 8 272 3 449 6<br />
Minnesota .............. 4,021 1,280 32 745 19 *138 *3 398 10<br />
Mississippi .............. 2,214 537 24 293 13 *58 *3 186 8<br />
Missouri ................ 4,521 1,096 24 536 12 165 4 394 9<br />
Montana ................ 753 232 31 86 11 53 7 92 12<br />
Nebraska................ 1,359 234 17 129 10 42 3 63 5<br />
Nevada ................. 1,895 182 10 122 6 26 1 34 2<br />
New Hampshire .......... 1,044 141 14 89 9 *17 *2 35 3<br />
New Jersey .............. 6,734 562 8 478 7 *32 *(Z) 53 1<br />
New Mexico............. 1,500 224 15 152 10 34 2 38 3<br />
NewYork............... 14,990 1,236 8 734 5 207 1 295 2<br />
North Carolina .......... 6,719 1,038 15 734 11 *74 *1 230 3<br />
North Dakota ........... 507 145 29 59 12 40 8 47 9<br />
Ohio ................... 8,889 1,488 17 1,011 11 195 2 282 3<br />
Oklahoma .............. 2,743 602 22 370 13 *55 *2 177 6<br />
Oregon ................. 2,889 550 19 331 11 67 2 152 5<br />
Pennsylvania............. 9,793 1,415 14 482 5 425 4 508 5<br />
Rhode Isl<strong>and</strong> ............ 842 86 10 73 9 ... ... *10 *1<br />
South Carolina ........... 3,315 595 18 429 13 *48 *1 119 4<br />
South Dakota ............ 601 136 23 46 8 41 7 50 8<br />
Tennessee ............... 4,699 775 16 491 10 *67 *1 217 5<br />
Texas. .................. 17,076 2,668 16 1,672 10 324 2 672 4<br />
Utah ................... 1,808 351 19 197 11 38 2 116 6<br />
Vermont ................ 506 91 18 34 7 20 4 37 7<br />
Virginia................. 5,893 857 15 497 8 127 2 233 4<br />
Washington.............. 4,980 764 15 577 12 74 1 113 2<br />
West Virginia ............ 1,458 364 25 165 11 58 4 141 10<br />
Wisconsin ............... 4,350 1,185 27 534 12 160 4 492 11<br />
Wyoming ............... 405 113 28 61 15 *15 *4 37 9<br />
* Estimate based on a sample size <strong>of</strong> 10–29. ... Sample size too small to report data reliably. (Z) Less than 0.5 percent.<br />
Note: U.S. totals include responses from participants residing in the District <strong>of</strong> Columbia, as described in Appendix D.<br />
102 <strong>2006</strong> <strong>National</strong> <strong>Survey</strong> <strong>of</strong> <strong>Fishing</strong>, <strong>Hunting</strong>, <strong>and</strong> <strong>Wildlife</strong>-<strong>Associated</strong> Recreation U.S. Fish & <strong>Wildlife</strong> Service
Table 55. Anglers <strong>and</strong> Hunters by State Where <strong>Fishing</strong> or <strong>Hunting</strong> Took Place: <strong>2006</strong><br />
(Population 16 years old <strong>and</strong> older. Numbers in thous<strong>and</strong>s)<br />
Anglers<br />
Hunters<br />
State where fishing<br />
or hunting took place<br />
Total anglers,<br />
residents <strong>and</strong><br />
nonresidents<br />
State residents<br />
Nonresidents<br />
Total hunters,<br />
residents <strong>and</strong><br />
nonresidents<br />
State residents<br />
Nonresidents<br />
Number Percent Number Percent Number Percent Number Percent Number Percent Number Percent<br />
United States, total .... 29,952 100 27,641 92 6,494 22 12,510 100 11,971 96 1,826 15<br />
Alabama ................ 806 100 600 74 206 26 391 100 310 79 81 21<br />
Alaska.................. 293 100 137 47 156 53 71 100 53 75 ... ...<br />
Arizona ................ 422 100 330 78 92 22 159 100 126 79 *33 *21<br />
Arkansas ............... 655 100 430 66 225 34 354 100 301 85 *53 *15<br />
California .............. 1,730 100 1,578 91 152 9 281 100 274 97 ... ...<br />
Colorado ................ 660 100 490 74 171 26 259 100 126 49 134 51<br />
Connecticut.............. 302 100 251 83 51 17 38 100 36 96 ... ...<br />
Delaware................ 159 100 66 41 *94 *59 42 100 19 46 ... ...<br />
Florida ................. 2,767 100 1,881 68 885 32 236 100 214 91 *22 *9<br />
Georgia ................ 1,107 100 971 88 136 12 481 100 344 72 136 28<br />
Hawaii ................. 157 100 92 58 *65 *42 18 100 18 98 ... ...<br />
Idaho................... 350 100 206 59 144 41 187 100 122 65 65 35<br />
Illinois ................. 873 100 795 91 78 9 316 100 258 82 *58 *18<br />
Indiana ................. 768 100 663 86 106 14 272 100 237 87 *35 *13<br />
Iowa ................... 438 100 397 91 *40 *9 251 100 208 83 *44 *17<br />
Kansas ................. 404 100 319 79 85 21 271 100 183 68 88 32<br />
Kentucky ............... 721 100 580 80 141 20 291 100 241 83 *50 *17<br />
Louisiana ............... 702 100 590 84 112 16 270 100 241 89 ... ...<br />
Maine .................. 351 100 220 63 131 37 175 100 146 83 *29 *17<br />
Maryl<strong>and</strong> ............... 645 100 403 62 242 38 161 100 133 83 *28 *17<br />
Massachusetts ........... 497 100 398 80 99 20 73 100 57 79 *16 *21<br />
Michigan ............... 1,394 100 1,077 77 318 23 753 100 721 96 *32 *4<br />
Minnesota .............. 1,427 100 1,108 78 319 22 535 100 509 95 *26 *5<br />
Mississippi .............. 546 100 465 85 80 15 304 100 238 78 *66 *22<br />
Missouri ................ 1,076 100 871 81 206 19 608 100 540 89 69 11<br />
Montana ................ 291 100 172 59 119 41 197 100 145 74 *52 *26<br />
Nebraska................ 198 100 169 85 *29 *15 118 100 102 86 ... ...<br />
Nevada ................. 142 100 114 81 *27 *19 63 100 54 85 ... ...<br />
New Hampshire .......... 230 100 108 47 122 53 61 100 51 85 *9 *15<br />
New Jersey .............. 654 100 458 70 197 30 89 100 72 81 ... ...<br />
New Mexico............. 248 100 164 66 *84 *34 99 100 66 67 *32 *33<br />
NewYork............... 1,153 100 932 81 221 19 566 100 491 87 75 13<br />
North Carolina .......... 1,263 100 868 69 395 31 304 100 277 91 *27 *9<br />
North Dakota ........... 106 100 88 84 ... ... 128 100 86 67 *42 *33<br />
Ohio ................... 1,256 100 1,145 91 112 9 500 100 467 93 ... ...<br />
Oklahoma .............. 611 100 525 86 86 14 251 100 224 89 *27 *11<br />
Oregon ................. 576 100 455 79 122 21 237 100 218 92 ... ...<br />
Pennsylvania............. 994 100 830 83 164 17 1,044 100 933 89 111 11<br />
Rhode Isl<strong>and</strong> ............ 158 100 76 48 82 52 14 100 12 84 ... ...<br />
South Carolina ........... 810 100 527 65 283 35 208 100 159 77 *49 *23<br />
South Dakota ............ 135 100 89 66 45 34 171 100 89 52 81 48<br />
Tennessee ............... 871 100 658 75 214 25 329 100 265 81 *64 *19<br />
Texas................... 2,527 100 2,308 91 218 9 1,101 100 979 89 123 11<br />
Utah ................... 375 100 288 77 87 23 166 100 144 86 *23 *14<br />
Vermont ................ 114 100 64 56 50 44 73 100 56 76 *17 *24<br />
Virginia................. 858 100 640 75 218 25 413 100 353 86 *60 *14<br />
Washington.............. 736 100 641 87 95 13 182 100 179 98 ... ...<br />
WestVirginia............ 376 100 291 77 86 23 269 100 194 72 *75 *28<br />
Wisconsin ............... 1,394 100 1,014 73 381 27 697 100 649 93 *48 *7<br />
Wyoming ............... 203 100 96 47 107 53 102 100 50 49 52 51<br />
* Estimate based on a sample size <strong>of</strong> 10–29. ... Sample size too small to report data reliably.<br />
Note: For the U.S. row, detail does not add to total because <strong>of</strong> multiple responses. U.S. totals include responses from participants residing in the District <strong>of</strong> Columbia, as<br />
described in Appendix D.<br />
U.S. Fish & <strong>Wildlife</strong> Service <strong>2006</strong> <strong>National</strong> <strong>Survey</strong> <strong>of</strong> <strong>Fishing</strong>, <strong>Hunting</strong>, <strong>and</strong> <strong>Wildlife</strong>-<strong>Associated</strong> Recreation 103
Table 56. Hunters by Type <strong>of</strong> <strong>Hunting</strong> <strong>and</strong> State Where <strong>Hunting</strong> Took Place: <strong>2006</strong><br />
(Population 16 years old <strong>and</strong> older. Numbers in thous<strong>and</strong>s)<br />
State where hunting<br />
took place<br />
Total, all hunting Big game Small game Migratory bird Other animals<br />
Number Percent Number Percent Number Percent Number Percent Number Percent<br />
United States, total .... 12,510 100 10,682 85 4,797 38 2,293 18 1,128 9<br />
Alabama ................ 391 100 352 90 126 32 73 19 ... ...<br />
Alaska. ................. 71 100 63 88 *4 *6 *11 *15 *9 *12<br />
Arizona ................ 159 100 96 61 68 43 *36 *23 ... ...<br />
Arkansas ............... 354 100 282 80 114 32 113 32 ... ...<br />
California .............. 281 100 153 54 153 54 150 53 ... ...<br />
Colorado ................ 259 100 208 80 *58 *22 *44 *17 ... ...<br />
Connecticut.............. 38 100 *21 *57 *15 *39 ... ... ... ...<br />
Delaware................ 42 100 37 87 *6 *15 12 29 ... ...<br />
Florida ................. 236 100 191 81 *96 *41 *42 *18 ... ...<br />
Georgia ................ 481 100 410 85 184 38 117 24 ... ...<br />
Hawaii ................. 18 100 *15 *81 ... ... ... ... ... ...<br />
Idaho. .................. 187 100 160 86 55 30 *42 *22 ... ...<br />
Illinois ................. 316 100 216 69 146 46 90 29 ... ...<br />
Indiana ................. 272 100 233 85 109 40 *30 *11 *19 *7<br />
Iowa ................... 251 100 175 70 144 57 *22 *9 *36 *14<br />
Kansas ................. 271 100 142 52 185 68 55 20 *17 *6<br />
Kentucky ............... 291 100 242 83 104 36 *34 *12 *28 *10<br />
Louisiana ............... 270 100 204 76 126 47 100 37 *32 *12<br />
Maine .................. 175 100 165 95 59 34 *16 *9 ... ...<br />
Maryl<strong>and</strong> ............... 161 100 129 80 *42 *26 46 28 ... ...<br />
Massachusetts ........... 73 100 58 80 *30 *41 *14 *19 ... ...<br />
Michigan ............... 753 100 715 95 228 30 *60 *8 ... ...<br />
Minnesota .............. 535 100 416 78 190 35 *55 *10 ... ...<br />
Mississippi .............. 304 100 285 94 103 34 *57 *19 ... ...<br />
Missouri ................ 608 100 502 83 237 39 87 14 *39 *6<br />
Montana ................ 197 100 182 92 44 22 *16 *8 ... ...<br />
Nebraska................ 118 100 67 57 63 54 44 37 *26 *22<br />
Nevada ................. 63 100 35 56 26 41 ... ... *16 *25<br />
New Hampshire .......... 61 100 53 88 *15 *25 *10 *16 *8 *13<br />
New Jersey .............. 89 100 73 82 *38 *42 ... ... ... ...<br />
New Mexico............. 99 100 81 81 *23 *23 *8 *9 ... ...<br />
NewYork............... 566 100 537 95 164 29 ... ... *49 *9<br />
North Carolina .......... 304 100 234 77 107 35 *40 *13 ... ...<br />
North Dakota ........... 128 100 77 60 77 60 24 18 *15 *11<br />
Ohio ................... 500 100 432 86 213 43 ... ... *74 *15<br />
Oklahoma .............. 251 100 193 77 79 32 *65 *26 *42 *17<br />
Oregon ................. 237 100 191 80 *58 *24 *29 *12 ... ...<br />
Pennsylvania............. 1,044 100 1,000 96 354 34 *71 *7 *148 *14<br />
Rhode Isl<strong>and</strong> ............ 14 100 *11 *82 *5 *37 ... ... ... ...<br />
South Carolina ........... 208 100 180 86 *56 *27 *42 *20 ... ...<br />
South Dakota ............ 171 100 67 39 133 78 29 17 *11 *7<br />
Tennessee ............... 329 100 281 85 130 39 *80 *24 *42 *13<br />
Texas. .................. 1,101 100 890 81 359 33 435 40 *118 *11<br />
Utah ................... 166 100 125 75 71 42 *26 *16 *15 *9<br />
Vermont ................ 73 100 65 90 23 31 *10 *13 *7 *9<br />
Virginia................. 413 100 362 88 142 34 *64 *16 *78 *19<br />
Washington.............. 182 100 164 90 *42 *23 *20 *11 ... ...<br />
West Virginia ............ 269 100 256 95 128 48 ... ... ... ...<br />
Wisconsin ............... 697 100 639 92 222 32 *75 *11 ... ...<br />
Wyoming ............... 102 100 88 86 *25 *24 ... ... ... ...<br />
* Estimate based on a sample size <strong>of</strong> 10–29. ... Sample size too small to report data reliably.<br />
Note: Detail does not add to total because <strong>of</strong> multiple responses. U.S. totals include responses from participants residing in the District <strong>of</strong> Columbia, as described in<br />
Appendix D.<br />
104 <strong>2006</strong> <strong>National</strong> <strong>Survey</strong> <strong>of</strong> <strong>Fishing</strong>, <strong>Hunting</strong>, <strong>and</strong> <strong>Wildlife</strong>-<strong>Associated</strong> Recreation U.S. Fish & <strong>Wildlife</strong> Service
Table 57. Days <strong>of</strong> <strong>Hunting</strong> by State Where <strong>Hunting</strong> Took Place <strong>and</strong> Hunter’s State <strong>of</strong> Residence: <strong>2006</strong><br />
(Population 16 years old <strong>and</strong> older. Numbers in thous<strong>and</strong>s)<br />
Days <strong>of</strong> hunting in state<br />
Days <strong>of</strong> hunting by state residents<br />
State<br />
Total days,<br />
residents <strong>and</strong><br />
nonresidents<br />
Days by state<br />
residents<br />
Days by<br />
nonresidents<br />
Total days, in state<br />
<strong>of</strong> residence <strong>and</strong><br />
other states<br />
Days in state<br />
<strong>of</strong> residence<br />
Days in other<br />
states<br />
Number Percent Number Percent Number Percent Number Percent Number Percent Number Percent<br />
United States, total .... 219,925 100 203,319 92 18,023 8 219,925 100 203,319 92 18,023 8<br />
Alabama ................ 8,649 100 7,609 88 1,039 12 8,036 100 7,609 95 *427 *5<br />
Alaska.................. 854 100 758 89 ... ... 859 100 758 88 *101 *12<br />
Arizona ................ 1,509 100 1,388 92 *121 *8 1,538 100 1,388 90 *151 *10<br />
Arkansas ............... 7,882 100 7,219 92 *662 *8 7,636 100 7,219 95 *417 *5<br />
California .............. 3,376 100 3,339 99 ... ... 4,226 100 3,339 79 *887 *21<br />
Colorado ................ 2,376 100 1,224 52 1,152 48 1,421 100 1,224 86 *197 *14<br />
Connecticut.............. 509 100 500 98 ... ... 693 100 500 72 *193 *28<br />
Delaware................ 654 100 462 71 ... ... 513 100 462 90 *50 *10<br />
Florida ................. 3,769 100 3,699 98 *70 *2 5,955 100 3,699 62 2,256 38<br />
Georgia ................ 8,228 100 6,783 82 1,445 18 7,248 100 6,783 94 *466 *6<br />
Hawaii ................. 420 100 *418 *99 ... ... 421 100 *418 *99 ... ...<br />
Idaho................... 2,117 100 1,125 53 993 47 1,187 100 1,125 95 ... ...<br />
Illinois ................. 4,688 100 4,238 90 *451 *10 4,658 100 4,238 91 *420 *9<br />
Indiana ................. 4,808 100 4,184 87 *624 *13 4,652 100 4,184 90 *468 *10<br />
Iowa ................... 3,849 100 3,627 94 *222 *6 3,745 100 3,627 97 *118 *3<br />
Kansas ................. 3,017 100 2,574 85 442 15 2,721 100 2,574 95 *147 *5<br />
Kentucky ............... 5,429 100 4,886 90 *543 *10 5,119 100 4,886 95 *233 *5<br />
Louisiana ............... 5,979 100 5,847 98 ... ... 7,278 100 5,847 80 *1,431 *20<br />
Maine .................. 2,283 100 2,004 88 *279 *12 2,043 100 2,004 98 ... ...<br />
Maryl<strong>and</strong> ............... 2,262 100 1,813 80 *449 *20 2,228 100 1,813 81 415 19<br />
Massachusetts ........... 1,149 100 1,083 94 *66 *6 1,821 100 1,083 59 *739 *41<br />
Michigan ............... 11,905 100 11,735 99 *170 *1 11,756 100 11,735 100 ... ...<br />
Minnesota .............. 6,492 100 6,346 98 *145 *2 6,966 100 6,346 91 *619 *9<br />
Mississippi .............. 6,835 100 6,050 89 *786 *11 6,259 100 6,050 97 *209 *3<br />
Missouri ................ 9,714 100 9,171 94 544 6 9,720 100 9,171 94 *550 *6<br />
Montana ................ 2,142 100 1,783 83 *359 *17 1,828 100 1,783 98 ... ...<br />
Nebraska................ 1,611 100 1,559 97 ... ... 1,652 100 1,559 94 *93 *6<br />
Nevada ................. 615 100 578 94 ... ... 692 100 578 84 *114 *16<br />
New Hampshire .......... 1,057 100 969 92 *88 *8 1,100 100 969 88 *131 *12<br />
New Jersey .............. 1,457 100 1,343 92 ... ... 1,645 100 1,343 82 *302 *18<br />
New Mexico............. 852 100 685 80 *167 *20 743 100 685 92 *58 *8<br />
NewYork............... 10,289 100 9,462 92 826 8 9,747 100 9,462 97 *284 *3<br />
North Carolina .......... 4,880 100 4,653 95 *228 *5 5,484 100 4,653 85 831 15<br />
North Dakota ........... 1,344 100 1,081 80 *263 *20 1,125 100 1,081 96 *44 *4<br />
Ohio ................... 10,633 100 10,419 98 ... ... 10,758 100 10,419 97 *338 *3<br />
Oklahoma .............. 5,534 100 5,339 96 *194 *4 5,569 100 5,339 96 *230 *4<br />
Oregon ................. 2,729 100 2,658 97 ... ... 2,768 100 2,658 96 ... ...<br />
Pennsylvania............. 16,863 100 16,157 96 706 4 17,404 100 16,157 93 *1,247 *7<br />
Rhode Isl<strong>and</strong> ............ 155 100 140 90 ... ... 184 100 140 76 *43 *24<br />
South Carolina ........... 4,318 100 3,893 90 *424 *10 4,031 100 3,893 97 *138 *3<br />
South Dakota ............ 1,719 100 1,190 69 530 31 1,208 100 1,190 98 ... ...<br />
Tennessee ............... 5,729 100 5,343 93 *386 *7 6,340 100 5,343 84 *997 *16<br />
Texas................... 14,050 100 13,400 95 650 5 13,896 100 13,400 96 ... ...<br />
Utah ................... 1,715 100 1,624 95 *91 *5 1,921 100 1,624 85 *297 *15<br />
Vermont ................ 1,111 100 922 83 *190 *17 1,073 100 922 86 *152 *14<br />
Virginia................. 6,771 100 6,280 93 *491 *7 6,752 100 6,280 93 *473 *7<br />
Washington.............. 2,126 100 2,124 100 ... ... 2,409 100 2,124 88 *285 *12<br />
WestVirginia............ 3,939 100 3,376 86 *563 *14 3,691 100 3,376 91 ... ...<br />
Wisconsin ............... 10,059 100 9,679 96 *380 *4 10,016 100 9,679 97 *337 *3<br />
Wyoming ............... 904 100 580 64 325 36 605 100 580 96 ... ...<br />
* Estimate based on a sample size <strong>of</strong> 10–29. ... Sample size too small to report data reliably.<br />
Note: U.S. totals include responses from participants residing in the District <strong>of</strong> Columbia, as described in Appendix D.<br />
U.S. Fish & <strong>Wildlife</strong> Service <strong>2006</strong> <strong>National</strong> <strong>Survey</strong> <strong>of</strong> <strong>Fishing</strong>, <strong>Hunting</strong>, <strong>and</strong> <strong>Wildlife</strong>-<strong>Associated</strong> Recreation 105
Table 58. Days <strong>of</strong> <strong>Hunting</strong> by Type <strong>of</strong> <strong>Hunting</strong> <strong>and</strong> State Where <strong>Hunting</strong> Took Place: <strong>2006</strong><br />
(Population 16 years old <strong>and</strong> older. Numbers in thous<strong>and</strong>s)<br />
State where hunting<br />
took place<br />
Total,<br />
all hunting<br />
Big game Small game Migratory bird Other animals<br />
Number Percent Number Percent Number Percent Number Percent Number Percent<br />
United States, total .... 219,925 100 164,061 75 52,395 24 19,770 9 15,205 7<br />
Alabama ................ 8,649 100 7,685 89 1,311 15 401 5 ... ...<br />
Alaska. ................. 854 100 639 75 *109 *13 *64 *7 *182 *21<br />
Arizona ................ 1,509 100 849 56 535 35 *187 *12 ... ...<br />
Arkansas ............... 7,882 100 5,554 70 1,958 25 1,656 21 ... ...<br />
California .............. 3,376 100 1,837 54 1,438 43 1,140 34 ... ...<br />
Colorado ................ 2,376 100 1,718 72 *400 *17 *302 *13 ... ...<br />
Connecticut.............. 509 100 *280 *55 *212 *42 ... ... ... ...<br />
Delaware................ 654 100 520 80 *79 *12 *103 *16 ... ...<br />
Florida ................. 3,769 100 2,875 76 *1,054 *28 *217 *6 ... ...<br />
Georgia ................ 8,228 100 6,959 85 1,549 19 664 8 ... ...<br />
Hawaii ................. 420 100 *386 *92 ... ... ... ... ... ...<br />
Idaho. .................. 2,117 100 1,422 67 398 19 *229 *11 ... ...<br />
Illinois ................. 4,688 100 2,728 58 1,600 34 1,111 24 ... ...<br />
Indiana ................. 4,808 100 3,469 72 1,163 24 *444 *9 *391 *8<br />
Iowa ................... 3,849 100 2,333 61 1,427 37 *182 *5 *529 *14<br />
Kansas ................. 3,017 100 1,239 41 1,528 51 481 16 *199 *7<br />
Kentucky ............... 5,429 100 3,832 71 1,385 26 *285 *5 *530 *10<br />
Louisiana ............... 5,979 100 4,013 67 1,447 24 1,419 24 *487 *8<br />
Maine .................. 2,283 100 1,854 81 436 19 *117 *5 ... ...<br />
Maryl<strong>and</strong> ............... 2,262 100 1,811 80 *264 *12 381 17 ... ...<br />
Massachusetts ........... 1,149 100 936 82 *189 *16 *102 *9 ... ...<br />
Michigan ............... 11,905 100 10,357 87 2,109 18 *357 *3 ... ...<br />
Minnesota .............. 6,492 100 4,406 68 1,925 30 *527 *8 ... ...<br />
Mississippi .............. 6,835 100 5,849 86 1,115 16 *381 *6 ... ...<br />
Missouri ................ 9,714 100 6,973 72 2,078 21 892 9 *844 *9<br />
Montana ................ 2,142 100 1,906 89 316 15 *69 *3 ... ...<br />
Nebraska................ 1,611 100 572 36 653 41 396 25 *298 *19<br />
Nevada ................. 615 100 313 51 224 37 ... ... *88 *14<br />
New Hampshire .......... 1,057 100 805 76 *157 *15 *151 *14 *98 *9<br />
New Jersey .............. 1,457 100 1,259 86 *315 *22 ... ... ... ...<br />
New Mexico............. 852 100 580 68 *228 *27 *49 *6 ... ...<br />
NewYork............... 10,289 100 8,564 83 3,519 34 ... ... *373 *4<br />
North Carolina .......... 4,880 100 3,275 67 1,462 30 *130 *3 ... ...<br />
North Dakota ........... 1,344 100 561 42 644 48 *187 *14 *85 *6<br />
Ohio ................... 10,633 100 6,796 64 2,908 27 ... ... *1,586 *15<br />
Oklahoma .............. 5,534 100 3,982 72 595 11 *451 *8 *1,039 *19<br />
Oregon ................. 2,729 100 2,201 81 *382 *14 *294 *11 ... ...<br />
Pennsylvania............. 16,863 100 13,609 81 3,379 20 *434 *3 *1,469 *9<br />
Rhode Isl<strong>and</strong> ............ 155 100 *95 *61 *55 *35 ... ... ... ...<br />
South Carolina ........... 4,318 100 3,870 90 *883 *20 *425 *10 ... ...<br />
South Dakota ............ 1,719 100 543 32 1,028 60 200 12 *184 *11<br />
Tennessee ............... 5,729 100 3,882 68 1,426 25 *550 *10 *323 *6<br />
Texas. .................. 14,050 100 10,650 76 2,925 21 2,461 18 *1,340 *10<br />
Utah ................... 1,715 100 1,059 62 651 38 *189 *11 *106 *6<br />
Vermont ................ 1,111 100 827 74 315 28 *94 *8 *70 *6<br />
Virginia................. 6,771 100 5,072 75 1,008 15 *270 *4 *1,557 *23<br />
Washington.............. 2,126 100 1,835 86 *332 *16 *166 *8 ... ...<br />
West Virginia ............ 3,939 100 3,190 81 1,241 32 ... ... ... ...<br />
Wisconsin ............... 10,059 100 7,950 79 2,059 20 *756 *8 ... ...<br />
Wyoming ............... 904 100 726 80 *198 *22 ... ... ... ...<br />
* Estimate based on a sample size <strong>of</strong> 10–29. ... Sample size too small to report data reliably.<br />
Note: Detail does not add to total because <strong>of</strong> multiple responses. U.S. totals include responses from participants residing in the District <strong>of</strong> Columbia, as described in<br />
Appendix D.<br />
106 <strong>2006</strong> <strong>National</strong> <strong>Survey</strong> <strong>of</strong> <strong>Fishing</strong>, <strong>Hunting</strong>, <strong>and</strong> <strong>Wildlife</strong>-<strong>Associated</strong> Recreation U.S. Fish & <strong>Wildlife</strong> Service
Table 59. Expenditures for <strong>Hunting</strong> by State Where Spending Took Place: <strong>2006</strong><br />
(Population 16 years old <strong>and</strong> older. Expenditures in thous<strong>and</strong>s <strong>of</strong> dollars)<br />
State where spending<br />
took place<br />
Total<br />
expenditures<br />
Trip-related expenditures Expenditures for equipment Expenditures<br />
for<br />
Total triprelated<br />
Food <strong>and</strong><br />
lodging<br />
Transportation<br />
Other<br />
trip costs<br />
Total<br />
equipment<br />
<strong>Hunting</strong><br />
equipment<br />
Auxiliary<br />
equipment<br />
Special<br />
equipment<br />
other<br />
items 1<br />
United States, total .... 22,893,156 6,678,614 2,791,245 2,696,924 1,190,445 10,731,501 5,366,357 1,330,216 4,034,928 5,483,041<br />
Alabama ................ 678,024 239,398 82,577 84,777 72,045 315,894 151,297 40,510 *124,087 122,731<br />
Alaska.................. 125,112 48,905 9,745 29,166 9,994 67,897 24,831 19,083 ... 8,310<br />
Arizona ................ 322,739 92,363 33,599 39,386 19,377 219,641 61,155 17,977 ... 10,735<br />
Arkansas ............... 788,575 182,192 81,047 73,257 27,889 375,236 191,180 55,862 *128,194 231,147<br />
California .............. 813,239 230,873 88,210 104,256 38,407 428,493 152,902 38,964 ... 153,873<br />
Colorado ................ 444,061 288,325 97,329 76,786 114,210 91,574 71,900 19,674 ... 64,162<br />
Connecticut.............. 68,530 5,991 *1,782 3,558 *651 50,160 20,660 *4,162 ... 12,379<br />
Delaware................ 41,381 13,638 5,477 4,832 *3,329 24,802 16,019 6,487 ... 2,941<br />
Florida ................. 377,394 155,116 43,013 59,561 52,543 173,749 125,342 28,308 ... 48,528<br />
Georgia ................ 677,762 237,162 96,620 84,652 55,890 209,233 121,722 30,372 ... 231,367<br />
Hawaii ................. 21,098 10,736 5,410 4,469 *858 9,780 8,837 *943 ... 583<br />
Idaho................... 259,718 100,218 37,974 40,986 21,259 121,708 54,161 *11,431 ... 37,792<br />
Illinois ................. 381,937 130,466 47,128 47,761 35,578 129,180 77,291 39,188 ... 122,290<br />
Indiana ................. 223,023 65,553 26,628 31,871 7,054 103,456 85,542 17,914 ... 54,015<br />
Iowa ................... 288,324 110,756 43,895 49,582 *17,279 131,184 99,548 23,535 ... 46,384<br />
Kansas ................. 248,674 121,162 52,847 58,116 10,199 95,175 78,056 15,970 ... 32,337<br />
Kentucky ............... 423,439 83,591 38,019 41,503 4,069 208,270 143,802 29,785 ... 131,578<br />
Louisiana ............... 525,505 205,355 83,297 73,628 48,429 206,072 114,697 23,285 ... 114,078<br />
Maine .................. 241,301 58,997 29,704 25,774 3,519 110,898 33,779 15,174 ... 71,406<br />
Maryl<strong>and</strong> ............... 210,087 62,343 22,873 23,895 15,575 113,376 66,578 30,478 ... 34,367<br />
Massachusetts ........... 70,824 36,675 10,616 19,263 6,796 24,374 19,870 *4,504 ... 9,775<br />
Michigan ............... 915,884 262,326 134,017 105,588 22,720 371,574 210,202 61,477 ... 281,985<br />
Minnesota .............. 494,149 166,577 78,295 73,749 14,533 219,505 179,406 36,001 ... 108,066<br />
Mississippi .............. 519,808 149,362 67,646 53,649 28,068 152,654 90,355 18,348 ... 217,792<br />
Missouri ................ 1,146,240 234,468 90,216 108,385 35,866 499,132 283,748 57,023 ... 412,641<br />
Montana ................ 310,540 132,808 48,044 50,289 34,475 144,951 62,657 16,417 *65,878 32,782<br />
Nebraska................ 231,032 46,027 17,685 25,416 2,926 137,627 75,814 23,727 ... 47,378<br />
Nevada ................. 129,080 39,574 18,022 16,193 5,360 76,412 17,082 12,631 ... 13,094<br />
New Hampshire .......... 74,467 17,665 8,860 8,460 *344 48,294 37,199 2,776 ... 8,509<br />
New Jersey .............. 146,001 72,680 34,083 19,133 *19,463 62,897 55,390 *6,862 ... 10,424<br />
New Mexico............. 164,308 93,052 28,346 25,440 39,266 61,766 29,057 11,090 ... 9,490<br />
NewYork............... 715,707 201,631 98,197 74,828 28,606 338,592 230,525 42,510 ... 175,485<br />
North Carolina .......... 430,562 89,979 46,603 40,173 *3,203 314,578 202,839 17,825 ... 26,006<br />
North Dakota ........... 129,114 72,445 28,270 31,908 *12,266 45,473 24,228 8,561 ... 11,196<br />
Ohio ................... 841,556 148,609 73,341 66,995 *8,273 599,743 210,082 41,726 ... 93,204<br />
Oklahoma .............. 476,657 135,335 52,990 69,314 13,031 307,048 111,501 22,468 *173,078 34,274<br />
Oregon ................. 373,613 116,690 51,610 58,089 6,991 226,632 105,293 16,531 *104,808 30,290<br />
Pennsylvania............. 1,609,045 274,158 125,470 123,397 25,290 1,037,875 390,810 96,587 ... 297,013<br />
Rhode Isl<strong>and</strong> ............ 10,186 3,734 1,455 1,731 *547 5,839 5,113 *726 ... 613<br />
South Carolina ........... 278,640 121,953 50,471 38,137 33,345 112,304 94,138 7,767 ... 44,382<br />
South Dakota ............ 185,258 117,063 53,224 41,388 22,451 31,517 24,683 5,679 ... 36,678<br />
Tennessee ............... 488,420 109,447 52,240 45,299 11,908 350,346 109,606 21,663 ... 28,627<br />
Texas................... 2,222,298 873,928 337,965 335,890 200,073 785,297 445,492 125,975 ... 563,073<br />
Utah ................... 273,782 71,575 25,915 37,255 8,405 180,329 92,425 30,042 *57,862 21,879<br />
Vermont ................ 189,707 20,928 10,993 8,954 *981 151,053 17,658 2,587 ... 17,726<br />
Virginia................. 480,802 124,862 60,585 56,592 7,686 297,143 167,914 25,158 ... 58,797<br />
Washington.............. 313,134 74,233 33,083 36,528 4,622 188,739 66,625 44,120 ... 50,163<br />
West Virginia ............ 284,511 79,376 40,194 38,070 *1,113 160,014 99,231 15,621 ... 45,121<br />
Wisconsin ............... 1,312,128 275,268 147,349 104,350 23,569 316,756 170,466 53,572 ... 720,103<br />
Wyoming ............... 137,265 62,991 31,901 22,090 9,000 45,632 22,802 9,655 ... 28,642<br />
* Estimate based on a sample size <strong>of</strong> 10–29. ... Sample size too small to report data reliably.<br />
1 Includes expenditures for magazine subscriptions, membership dues <strong>and</strong> contributions, l<strong>and</strong> leasing <strong>and</strong> ownership, <strong>and</strong> licenses, stamps, tags, <strong>and</strong> permits.<br />
Note: U.S. totals include responses from participants residing in the District <strong>of</strong> Columbia, as described in Appendix D.<br />
U.S. Fish & <strong>Wildlife</strong> Service <strong>2006</strong> <strong>National</strong> <strong>Survey</strong> <strong>of</strong> <strong>Fishing</strong>, <strong>Hunting</strong>, <strong>and</strong> <strong>Wildlife</strong>-<strong>Associated</strong> Recreation 107
Table 60. Freshwater (Except Great Lakes) Anglers <strong>and</strong> Days <strong>of</strong> <strong>Fishing</strong> by State Where <strong>Fishing</strong> Took<br />
Place: <strong>2006</strong><br />
(Population 16 years old <strong>and</strong> older. Numbers in thous<strong>and</strong>s)<br />
Anglers<br />
Days <strong>of</strong> fishing<br />
State where fishing<br />
took place<br />
Total anglers,<br />
residents <strong>and</strong><br />
nonresidents<br />
State residents<br />
Nonresidents<br />
Total days,<br />
residents <strong>and</strong><br />
nonresidents<br />
Days by<br />
state<br />
residents<br />
Days by<br />
nonresidents<br />
Number Percent Number Percent Number Percent Number Percent Number Percent Number Percent<br />
United States, total..... 25,035 100 23,266 93 4,604 18 419,942 100 382,512 91 37,869 9<br />
Alabama ............... 714 100 567 79 147 21 12,987 100 12,202 94 785 6<br />
Alaska ................. 191 100 99 52 92 48 1,826 100 1,305 71 521 29<br />
Arizona ................ 422 100 330 78 92 22 4,156 100 3,505 84 651 16<br />
Arkansas ............... 655 100 430 66 225 34 10,812 100 9,273 86 1,539 14<br />
California ............... 1,224 100 1,150 94 74 6 12,307 100 11,526 94 781 6<br />
Colorado ............... 660 100 490 74 171 26 6,374 100 5,529 87 845 13<br />
Connecticut ............. 204 100 178 87 *26 *13 4,354 100 4,179 96 *175 *4<br />
Delaware ............... 58 100 34 59 ... ... 1,133 100 780 69 ... ...<br />
Florida ................. 1,417 100 1,155 82 262 18 24,512 100 23,031 94 1,482 6<br />
Georgia ................ 1,025 100 908 89 118 11 15,646 100 14,742 94 905 6<br />
Hawaii ................. 22 100 *15 *69 ... ... 67 100 *60 *90 ... ...<br />
Idaho .................. 350 100 206 59 144 41 4,301 100 3,307 77 994 23<br />
Illinois ................. 777 100 710 91 67 9 15,631 100 14,968 96 663 4<br />
Indiana ................. 677 100 582 86 *96 *14 8,289 100 7,594 92 *695 *8<br />
Iowa ................... 438 100 397 91 *40 *9 6,215 100 6,063 98 *152 *2<br />
Kansas ................. 404 100 319 79 85 21 5,314 100 4,883 92 431 8<br />
Kentucky ............... 721 100 580 80 141 20 9,231 100 8,324 90 906 10<br />
Louisiana ............... 549 100 472 86 *77 *14 8,743 100 8,312 95 *431 *5<br />
Maine .................. 303 100 209 69 94 31 4,272 100 3,472 81 800 19<br />
Maryl<strong>and</strong> ............... 364 100 244 67 119 33 4,799 100 3,090 64 1,708 36<br />
Massachusetts ........... 292 100 263 90 29 10 5,345 100 5,186 97 159 3<br />
Michigan ............... 1,192 100 941 79 250 21 19,677 100 17,993 91 1,684 9<br />
Minnesota ............... 1,381 100 1,091 79 289 21 24,041 100 22,093 92 1,949 8<br />
Mississippi ............. 508 100 439 86 *69 *14 7,095 100 6,609 93 *486 *7<br />
Missouri ............... 1,076 100 871 81 206 19 16,569 100 15,263 92 1,306 8<br />
Montana ............... 291 100 172 59 119 41 2,927 100 2,357 81 569 19<br />
Nebraska ............... 198 100 169 85 *29 *15 3,096 100 2,913 94 *183 *6<br />
Nevada ................. 142 100 114 81 *27 *19 1,526 100 1,436 94 *90 *6<br />
New Hampshire ......... 198 100 94 47 104 53 2,733 100 1,849 68 884 32<br />
New Jersey ............. 243 100 210 86 *33 *14 3,646 100 3,500 96 *146 *4<br />
New Mexico............. 248 100 164 66 *84 *34 2,596 100 2,129 82 *467 *18<br />
NewYork............... 741 100 633 85 108 15 10,994 100 9,806 89 1,188 11<br />
North Carolina .......... 884 100 740 84 144 16 13,923 100 13,207 95 716 5<br />
North Dakota ........... 106 100 88 84 ... ... 953 100 905 95 ... ...<br />
Ohio ................... 982 100 929 95 *53 *5 12,827 100 12,064 94 *763 *6<br />
Oklahoma ............... 611 100 525 86 86 14 10,580 100 9,843 93 737 7<br />
Oregon ................. 491 100 401 82 90 18 7,053 100 6,175 88 878 12<br />
Pennsylvania ............ 914 100 770 84 143 16 14,456 100 13,754 95 703 5<br />
Rhode Isl<strong>and</strong> ............ 50 100 38 76 ... ... 541 100 467 86 ... ...<br />
South Carolina ........... 612 100 483 79 130 21 10,658 100 9,817 92 842 8<br />
South Dakota ........... 135 100 89 66 45 34 1,697 100 1,406 83 291 17<br />
Tennessee .............. 871 100 658 75 214 25 15,103 100 13,221 88 1,882 12<br />
Texas .................. 1,860 100 1,711 92 150 8 27,074 100 25,628 95 1,446 5<br />
Utah ................... 375 100 288 77 87 23 3,822 100 3,387 89 434 11<br />
Vermont ................ 114 100 64 56 50 44 1,665 100 1,400 84 265 16<br />
Virginia ................ 622 100 454 73 168 27 6,417 100 5,680 89 737 11<br />
Washington ............. 538 100 481 90 *56 *10 7,524 100 7,076 94 *448 *6<br />
West Virginia ........... 376 100 291 77 86 23 6,885 100 6,442 94 443 6<br />
Wisconsin ............... 1,253 100 918 73 336 27 16,216 100 13,424 83 2,792 17<br />
Wyoming ............... 203 100 96 47 107 53 1,691 100 1,245 74 446 26<br />
* Estimate based on a sample size <strong>of</strong> 10–29. ... Sample size too small to report data reliably.<br />
Note: For the U.S. row, detail does not add to total because <strong>of</strong> multiple responses. U.S. totals include responses from participants residing in the District <strong>of</strong> Columbia, as<br />
described in Appendix D.<br />
108 <strong>2006</strong> <strong>National</strong> <strong>Survey</strong> <strong>of</strong> <strong>Fishing</strong>, <strong>Hunting</strong>, <strong>and</strong> <strong>Wildlife</strong>-<strong>Associated</strong> Recreation U.S. Fish & <strong>Wildlife</strong> Service
Table 61. Great Lakes Anglers <strong>and</strong> Days <strong>of</strong> Great Lakes <strong>Fishing</strong> by State Where <strong>Fishing</strong> Took Place:<br />
<strong>2006</strong><br />
(Population 16 years old <strong>and</strong> older. Numbers in thous<strong>and</strong>s)<br />
Anglers<br />
Days <strong>of</strong> fishing<br />
State where fishing<br />
took place<br />
Total anglers,<br />
residents <strong>and</strong><br />
nonresidents<br />
State residents<br />
Nonresidents<br />
Total days,<br />
residents <strong>and</strong><br />
nonresidents<br />
Days by<br />
state<br />
residents<br />
Days by<br />
nonresidents<br />
Number Percent Number Percent Number Percent Number Percent Number Percent Number Percent<br />
United States, total..... 1,420 100 1,182 83 306 22 18,016 100 15,545 86 2,366 13<br />
Illinois ................. *56 *100 *47 *84 ... ... *728 *100 *709 *97 ... ...<br />
Indiana ................. *46 *100 *42 *90 ... ... *759 *100 *654 *86 ... ...<br />
Michigan ............... 461 100 367 80 94 20 6,981 100 6,280 90 701 10<br />
Minnesota .............. *48 *100 ... ... ... ... *272 *100 ... ... ... ...<br />
NewYork............... 247 100 178 72 69 28 2,060 100 1,431 69 628 31<br />
Ohio ................... 328 100 275 84 *53 *16 2,807 100 2,432 87 *375 *13<br />
Pennsylvania ............ *85 *100 *75 *88 ... ... *598 *100 *522 *87 ... ...<br />
Wisconsin ............... 235 100 176 75 *60 *25 3,705 100 3,348 90 *357 *10<br />
* Estimate based on a sample size <strong>of</strong> 10–29. ... Sample size too small to report data reliably.<br />
Note: For the U.S. row, detail does not add to total because <strong>of</strong> multiple responses.<br />
Table 62. Saltwater Anglers <strong>and</strong> Days <strong>of</strong> Saltwater <strong>Fishing</strong> by State Where <strong>Fishing</strong> Took Place: <strong>2006</strong><br />
(Population 16 years old <strong>and</strong> older. Numbers in thous<strong>and</strong>s)<br />
Anglers<br />
Days <strong>of</strong> fishing<br />
State where fishing<br />
took place<br />
Total anglers,<br />
residents <strong>and</strong><br />
nonresidents<br />
State residents<br />
Nonresidents<br />
Total days,<br />
residents <strong>and</strong><br />
nonresidents<br />
Days by<br />
state<br />
residents<br />
Days by<br />
nonresidents<br />
Number Percent Number Percent Number Percent Number Percent Number Percent Number Percent<br />
United States, total .... 7,717 100 6,089 79 2,185 28 85,663 100 73,365 86 12,451 15<br />
Alabama ............... 153 100 89 59 *63 *41 758 100 530 70 *229 *30<br />
Alaska ................. 180 100 76 42 104 58 974 100 641 66 333 34<br />
California .............. 761 100 666 88 95 12 7,606 100 7,275 96 330 4<br />
Connecticut.............. 157 100 121 77 *36 *23 1,691 100 1,398 83 *293 *17<br />
Delaware ............... 117 100 45 39 *72 *61 703 100 444 63 *260 *37<br />
Florida ................. 2,002 100 1,286 64 716 36 23,077 100 19,553 85 3,524 15<br />
Georgia ................ 146 100 125 85 ... ... 1,707 100 1,383 81 ... ...<br />
Hawaii ................. 154 100 89 58 *65 *42 1,411 100 1,244 88 *167 *12<br />
Louisiana ............... 289 100 248 86 *42 *14 2,975 100 2,541 85 *433 *15<br />
Maine .................. 100 100 52 52 48 48 703 100 504 72 198 28<br />
Maryl<strong>and</strong> ............... 372 100 227 61 145 39 3,114 100 2,357 76 756 24<br />
Massachusetts ........... 298 100 223 75 75 25 3,054 100 2,616 86 438 14<br />
Mississippi ............. *66 *100 *57 *87 ... ... *590 *100 *573 *97 ... ...<br />
New Hampshire .......... 47 100 27 58 *20 *42 206 100 120 58 *86 *42<br />
New Jersey ............. 496 100 340 69 155 31 5,568 100 4,728 85 840 15<br />
NewYork .............. 291 100 238 82 52 18 3,950 100 3,646 92 304 8<br />
North Carolina .......... 519 100 253 49 266 51 3,434 100 1,922 56 1,511 44<br />
Oregon ................. 150 100 128 85 *23 *15 846 100 813 96 *33 *4<br />
Rhode Isl<strong>and</strong> ............ 122 100 55 45 67 55 1,236 100 864 70 371 30<br />
South Carolina .......... 325 100 142 44 183 56 2,174 100 1,425 66 749 34<br />
Texas .................. 1,147 100 1,070 93 77 7 15,143 100 14,380 95 762 5<br />
Virginia ................ 352 100 289 82 63 18 3,313 100 3,023 91 290 9<br />
Washington.............. 286 100 244 85 *42 *15 1,550 100 1,383 89 *167 *11<br />
* Estimate based on a sample size <strong>of</strong> 10–29. ... Sample size too small to report data reliably.<br />
Note: For the U.S. row, detail does not add to total because <strong>of</strong> multiple responses. U.S. totals include responses from participants residing in the District <strong>of</strong> Columbia, as<br />
described in Appendix D.<br />
U.S. Fish & <strong>Wildlife</strong> Service <strong>2006</strong> <strong>National</strong> <strong>Survey</strong> <strong>of</strong> <strong>Fishing</strong>, <strong>Hunting</strong>, <strong>and</strong> <strong>Wildlife</strong>-<strong>Associated</strong> Recreation 109
Table 63. Days <strong>of</strong> <strong>Fishing</strong> by State Where <strong>Fishing</strong> Took Place <strong>and</strong> Angler’s State <strong>of</strong> Residence: <strong>2006</strong><br />
(Population 16 years old <strong>and</strong> older. Numbers in thous<strong>and</strong>s)<br />
Days <strong>of</strong> fishing in state<br />
Days <strong>of</strong> fishing by state residents<br />
State<br />
Total days,<br />
residents <strong>and</strong><br />
nonresidents<br />
Days by state<br />
residents<br />
Days by<br />
nonresidents<br />
Total days, in<br />
state <strong>of</strong><br />
residence<br />
<strong>and</strong> other states<br />
Days in state<br />
<strong>of</strong> residence<br />
Days in other<br />
states<br />
Number Percent Number Percent Number Percent Number Percent Number Percent Number Percent<br />
United States, total .... 516,781 100 470,594 91 52,380 10 516,781 100 470,594 91 52,380 10<br />
Alabama ................ 13,708 100 12,686 93 1,022 7 13,286 100 12,686 95 600 5<br />
Alaska. ................. 2,687 100 1,925 72 762 28 1,965 100 1,925 98 40 2<br />
Arizona ................ 4,156 100 3,505 84 651 16 4,450 100 3,505 79 944 21<br />
Arkansas ............... 10,812 100 9,273 86 1,539 14 10,101 100 9,273 92 828 8<br />
California .............. 19,394 100 18,310 94 1,084 6 19,731 100 18,310 93 1,420 7<br />
Colorado ................ 6,374 100 5,529 87 845 13 6,813 100 5,529 81 1,284 19<br />
Connecticut.............. 5,860 100 5,403 92 457 8 6,400 100 5,403 84 997 16<br />
Delaware................ 1,821 100 1,185 65 *637 *35 1,557 100 1,185 76 373 24<br />
Florida ................. 46,311 100 41,507 90 4,804 10 43,632 100 41,507 95 2,125 5<br />
Georgia ................ 17,375 100 16,305 94 1,070 6 18,567 100 16,305 88 2,262 12<br />
Hawaii ................. 1,471 100 1,300 88 *171 *12 1,345 100 1,300 97 45 3<br />
Idaho. .................. 4,301 100 3,307 77 994 23 4,214 100 3,307 78 908 22<br />
Illinois ................. 16,881 100 16,159 96 723 4 21,713 100 16,159 74 5,554 26<br />
Indiana ................. 9,805 100 9,052 92 753 8 10,754 100 9,052 84 1,702 16<br />
Iowa ................... 6,215 100 6,063 98 *152 *2 7,188 100 6,063 84 1,125 16<br />
Kansas ................. 5,314 100 4,883 92 431 8 5,724 100 4,883 85 841 15<br />
Kentucky ............... 9,231 100 8,324 90 906 10 10,210 100 8,324 82 1,886 18<br />
Louisiana ............... 11,204 100 10,564 94 640 6 11,205 100 10,564 94 641 6<br />
Maine .................. 4,794 100 3,804 79 990 21 3,856 100 3,804 99 52 1<br />
Maryl<strong>and</strong> ............... 8,223 100 5,753 70 2,470 30 6,729 100 5,753 85 976 15<br />
Massachusetts ........... 7,847 100 7,259 93 588 7 9,892 100 7,259 73 2,633 27<br />
Michigan ............... 24,822 100 22,532 91 2,290 9 23,389 100 22,532 96 856 4<br />
Minnesota .............. 24,382 100 22,305 91 2,077 9 23,474 100 22,305 95 1,169 5<br />
Mississippi .............. 7,648 100 7,134 93 514 7 7,601 100 7,134 94 467 6<br />
Missouri ................ 16,569 100 15,263 92 1,306 8 16,416 100 15,263 93 1,152 7<br />
Montana ................ 2,927 100 2,357 81 569 19 2,464 100 2,357 96 106 4<br />
Nebraska................ 3,096 100 2,913 94 *183 *6 3,235 100 2,913 90 322 10<br />
Nevada ................. 1,526 100 1,436 94 *90 *6 1,999 100 1,436 72 563 28<br />
New Hampshire .......... 2,947 100 1,971 67 976 33 2,518 100 1,971 78 547 22<br />
New Jersey .............. 8,820 100 7,836 89 984 11 9,457 100 7,836 83 1,621 17<br />
New Mexico............. 2,596 100 2,129 82 *467 *18 2,475 100 2,129 86 346 14<br />
NewYork............... 17,060 100 14,960 88 2,100 12 16,282 100 14,960 92 1,322 8<br />
North Carolina .......... 17,221 100 15,015 87 2,205 13 16,198 100 15,015 93 1,182 7<br />
North Dakota ........... 953 100 905 95 ... ... 1,152 100 905 79 247 21<br />
Ohio ................... 16,318 100 15,141 93 1,178 7 17,628 100 15,141 86 2,487 14<br />
Oklahoma .............. 10,580 100 9,843 93 737 7 10,376 100 9,843 95 533 5<br />
Oregon ................. 8,384 100 7,408 88 975 12 8,126 100 7,408 91 718 9<br />
Pennsylvania............. 17,967 100 17,128 95 839 5 20,957 100 17,128 82 3,829 18<br />
Rhode Isl<strong>and</strong> ............ 1,745 100 1,294 74 451 26 1,508 100 1,294 86 214 14<br />
South Carolina ........... 12,325 100 10,910 89 1,415 11 11,311 100 10,910 96 401 4<br />
South Dakota ............ 1,697 100 1,406 83 291 17 1,476 100 1,406 95 69 5<br />
Tennessee ............... 15,103 100 13,221 88 1,882 12 14,134 100 13,221 94 912 6<br />
Texas. .................. 41,141 100 38,942 95 2,199 5 40,249 100 38,942 97 1,306 3<br />
Utah ................... 3,822 100 3,387 89 434 11 3,852 100 3,387 88 465 12<br />
Vermont ................ 1,665 100 1,400 84 265 16 1,527 100 1,400 92 127 8<br />
Virginia................. 9,629 100 8,596 89 1,033 11 10,054 100 8,596 85 1,458 15<br />
Washington.............. 8,882 100 8,249 93 633 7 9,166 100 8,249 90 917 10<br />
West Virginia ............ 6,885 100 6,442 94 443 6 6,995 100 6,442 92 552 8<br />
Wisconsin ............... 20,823 100 17,034 82 3,789 18 17,834 100 17,034 96 800 4<br />
Wyoming ............... 1,691 100 1,245 74 446 26 1,363 100 1,245 91 118 9<br />
* Estimate based on a sample size <strong>of</strong> 10–29. ... Sample size too small to report data reliably.<br />
Note: U.S. totals include responses from participants residing in the District <strong>of</strong> Columbia, as described in Appendix D.<br />
110 <strong>2006</strong> <strong>National</strong> <strong>Survey</strong> <strong>of</strong> <strong>Fishing</strong>, <strong>Hunting</strong>, <strong>and</strong> <strong>Wildlife</strong>-<strong>Associated</strong> Recreation U.S. Fish & <strong>Wildlife</strong> Service
Table 64. Expenditures for <strong>Fishing</strong> by State Where Spending Took Place: <strong>2006</strong><br />
(Population 16 years old <strong>and</strong> older. Expenditures in thous<strong>and</strong>s <strong>of</strong> dollars)<br />
State where spending<br />
took place<br />
Total<br />
expenditures<br />
Trip-related expenditures Expenditures for equipment Expenditures<br />
for<br />
Total triprelated<br />
Food <strong>and</strong><br />
lodging<br />
Transportation<br />
Other<br />
trip costs<br />
Total<br />
equipment<br />
<strong>Fishing</strong><br />
equipment<br />
Auxiliary<br />
equipment<br />
Special<br />
equipment<br />
other<br />
items 1<br />
United States, total .... 42,011,124 1,787,560 6,302,524 4,961,830 6,614,205 18,757,370 5,332,401 778,740 12,646,229 5,375,195<br />
Alabama ................ 699,532 417,279 126,363 101,414 189,502 221,832 139,540 *11,462 *70,830 60,421<br />
Alaska.................. 516,749 362,019 132,056 99,945 130,018 135,237 39,504 7,063 *88,671 19,492<br />
Arizona ................ 802,405 245,741 80,144 67,026 98,570 547,205 33,529 6,164 *507,512 9,460<br />
Arkansas ............... 420,571 272,160 106,389 84,709 81,062 127,228 66,454 *8,058 *52,717 21,183<br />
California .............. 2,420,503 1,203,244 410,279 291,465 501,500 1,140,587 326,982 90,940 *722,665 76,672<br />
Colorado ................ 542,937 300,324 125,067 111,885 63,373 224,118 52,838 10,974 *160,306 18,494<br />
Connecticut.............. 243,552 130,742 37,910 30,819 62,013 102,988 49,268 12,677 *41,044 9,821<br />
Delaware................ 96,775 48,536 17,785 12,477 18,274 39,246 14,181 6,568 *18,497 8,994<br />
Florida ................. 4,308,583 1,973,985 680,147 419,711 874,127 1,944,798 523,433 37,035 1,384,330 389,800<br />
Georgia ................ 1,020,411 370,743 152,886 100,416 117,441 459,927 134,972 24,435 *300,519 189,741<br />
Hawaii ................. 110,516 72,728 24,600 18,480 29,648 36,849 27,297 6,850 ... 939<br />
Idaho................... 282,972 173,993 75,877 58,256 39,860 90,425 38,885 *5,943 ... 18,554<br />
Illinois ................. 774,319 279,732 94,413 92,326 92,994 455,317 136,349 25,255 *293,714 39,269<br />
Indiana ................. 627,167 242,624 67,201 67,546 107,877 316,108 110,784 17,648 *187,676 68,435<br />
Iowa ................... 322,648 140,617 46,271 40,607 53,740 163,104 59,311 13,215 *90,578 18,927<br />
Kansas ................. 242,444 127,996 40,561 54,627 32,808 108,983 44,817 6,371 *57,794 5,465<br />
Kentucky ............... 855,417 237,430 96,607 67,266 73,557 596,587 125,828 *9,659 ... 21,400<br />
Louisiana ............... 1,006,136 337,363 96,927 87,043 153,393 424,564 122,194 *7,633 *294,738 244,208<br />
Maine .................. 257,124 118,002 51,735 39,653 26,613 115,792 27,679 3,653 *84,460 23,330<br />
Maryl<strong>and</strong> ............... 568,211 292,638 88,459 59,475 144,703 253,571 97,600 6,691 *149,280 22,003<br />
Massachusetts ........... 769,631 297,312 85,723 56,248 155,341 397,049 98,524 14,957 283,568 75,269<br />
Michigan ............... 1,671,114 584,030 210,052 180,363 193,615 720,637 190,066 *13,532 *517,039 366,446<br />
Minnesota .............. 2,725,366 859,657 350,889 299,240 209,528 1,220,074 218,400 26,485 975,188 645,635<br />
Mississippi .............. 240,332 105,618 38,357 33,464 33,798 120,138 50,651 *4,797 ... 14,576<br />
Missouri ................ 1,093,206 457,963 187,138 135,593 135,232 517,239 134,910 18,514 *363,815 118,003<br />
Montana ................ 226,349 149,800 58,092 61,516 30,192 59,938 23,765 *3,186 *32,987 16,610<br />
Nebraska................ 181,280 60,992 24,365 22,042 14,584 83,777 32,130 4,978 *46,669 36,511<br />
Nevada ................. 144,634 61,390 26,342 23,476 11,572 65,190 26,863 2,708 ... 18,054<br />
New Hampshire .......... 172,413 88,581 35,674 28,613 24,293 62,892 21,588 6,559 *34,744 20,940<br />
New Jersey .............. 752,273 471,178 88,650 74,589 307,939 253,729 128,299 14,311 *111,118 27,366<br />
New Mexico............. 301,101 128,413 51,059 48,588 28,766 80,729 29,216 7,293 *44,220 91,958<br />
NewYork............... 925,701 584,644 197,876 143,792 242,976 269,704 180,746 18,774 *70,185 71,354<br />
North Carolina .......... 1,124,274 692,977 281,279 169,492 242,206 311,489 166,816 28,474 *116,198 119,809<br />
North Dakota ........... 93,729 39,076 14,367 18,762 5,948 52,346 15,745 *1,007 ... 2,306<br />
Ohio ................... 1,062,036 558,793 198,886 125,429 234,478 461,692 147,939 21,790 *291,963 41,552<br />
Oklahoma .............. 501,786 301,408 108,505 106,687 86,216 169,020 87,604 5,849 *75,566 31,358<br />
Oregon ................. 496,941 258,474 102,998 98,698 56,779 199,319 101,008 19,364 *78,947 39,149<br />
Pennsylvania............. 1,291,211 298,610 113,989 107,453 77,168 896,076 153,021 37,226 *705,829 96,526<br />
Rhode Isl<strong>and</strong> ............ 153,694 78,900 20,276 9,561 49,063 68,950 18,458 7,346 *43,146 5,845<br />
South Carolina ........... 1,404,133 525,937 194,829 115,546 215,562 725,624 176,118 *28,664 *520,842 152,572<br />
South Dakota ............ 131,089 58,624 25,821 21,408 11,395 38,564 20,215 *1,698 ... 33,900<br />
Tennessee ............... 599,683 290,424 101,063 90,676 98,685 280,692 90,631 11,076 *178,985 28,568<br />
Texas................... 3,237,212 1,563,994 448,390 480,681 634,924 1,363,877 496,454 47,487 ... 309,341<br />
Utah ................... 371,087 183,859 65,081 63,356 55,421 174,560 54,025 15,828 *104,708 12,667<br />
Vermont ................ 63,749 40,535 17,916 9,858 12,762 18,907 8,023 *1,591 ... 4,306<br />
Virginia................. 733,777 395,264 122,771 72,448 200,045 318,616 95,681 14,978 *207,957 19,897<br />
Washington.............. 904,796 354,880 117,878 120,130 116,873 485,945 139,299 35,378 311,267 63,971<br />
West Virginia ............ 333,454 153,525 63,284 57,739 32,503 154,149 38,504 21,775 ... 25,780<br />
Wisconsin ............... 1,647,035 747,312 351,744 225,688 169,879 623,420 152,350 8,795 462,275 276,303<br />
Wyoming ............... 521,479 110,604 44,488 50,939 15,178 97,185 17,480 *3,037 *76,668 313,690<br />
* Estimate based on a sample size <strong>of</strong> 10–29. ... Sample size too small to report data reliably.<br />
1 Includes expenditures for magazine subscriptions, membership dues <strong>and</strong> contributions, l<strong>and</strong> leasing <strong>and</strong> ownership, <strong>and</strong> licenses, stamps, tags, <strong>and</strong> permits.<br />
Note: U.S. totals include responses from participants residing in the District <strong>of</strong> Columbia, as described in Appendix D.<br />
U.S. Fish & <strong>Wildlife</strong> Service <strong>2006</strong> <strong>National</strong> <strong>Survey</strong> <strong>of</strong> <strong>Fishing</strong>, <strong>Hunting</strong>, <strong>and</strong> <strong>Wildlife</strong>-<strong>Associated</strong> Recreation 111
Table 65. Participation in <strong>Wildlife</strong>-Watching Activities by State Residents Both Inside <strong>and</strong> Outside Their<br />
Resident State: <strong>2006</strong><br />
(Population 16 years old <strong>and</strong> older. Numbers in thous<strong>and</strong>s)<br />
Participant’s state<br />
<strong>of</strong> residence<br />
Population<br />
Total participants Away from home Around the home<br />
Number<br />
Percent <strong>of</strong><br />
population<br />
Number<br />
Percent <strong>of</strong><br />
population<br />
Number<br />
Percent <strong>of</strong><br />
population<br />
United States, total .... 229,245 71,132 31 22,977 10 67,756 30<br />
Alabama ................ 3,550 1,006 28 348 10 989 28<br />
Alaska. ................. 499 207 42 68 14 202 41<br />
Arizona ................ 4,585 988 22 381 8 950 21<br />
Arkansas ............... 2,156 859 40 304 14 811 38<br />
California .............. 27,299 5,799 21 2,565 9 5,259 19<br />
Colorado ................ 3,605 1,459 40 531 15 1,393 39<br />
Connecticut.............. 2,735 1,102 40 290 11 1,063 39<br />
Delaware................ 669 212 32 49 7 206 31<br />
Florida ................. 14,233 3,520 25 988 7 3,274 23<br />
Georgia ................ 6,910 1,819 26 371 5 1,798 26<br />
Hawaii ................. 1,014 160 16 *55 *5 145 14<br />
Idaho. .................. 1,102 432 39 183 17 395 36<br />
Illinois ................. 9,767 2,355 24 756 8 2,258 23<br />
Indiana ................. 4,799 1,825 38 611 13 1,786 37<br />
Iowa ................... 2,339 1,111 48 344 15 1,059 45<br />
Kansas ................. 2,110 787 37 234 11 723 34<br />
Kentucky ............... 3,260 1,341 41 540 17 1,235 38<br />
Louisiana ............... 3,433 712 21 *234 *7 671 20<br />
Maine .................. 1,074 600 56 213 20 576 54<br />
Maryl<strong>and</strong> ............... 4,333 1,334 31 305 7 1,322 31<br />
Massachusetts ........... 5,032 1,725 34 531 11 1,647 33<br />
Michigan ............... 7,804 2,947 38 827 11 2,826 36<br />
Minnesota .............. 4,021 1,946 48 579 14 1,908 47<br />
Mississippi .............. 2,214 618 28 *145 *7 606 27<br />
Missouri ................ 4,521 2,059 46 709 16 1,966 43<br />
Montana ................ 753 412 55 184 24 389 52<br />
Nebraska................ 1,359 438 32 151 11 407 30<br />
Nevada ................. 1,895 420 22 168 9 371 20<br />
New Hampshire .......... 1,044 471 45 127 12 451 43<br />
New Jersey .............. 6,734 1,537 23 513 8 1,483 22<br />
New Mexico............. 1,500 490 33 220 15 437 29<br />
NewYork............... 14,990 3,548 24 1,178 8 3,465 23<br />
North Carolina .......... 6,719 2,267 34 402 6 2,237 33<br />
North Dakota ........... 507 134 26 *30 *6 128 25<br />
Ohio ................... 8,889 3,379 38 1,174 13 3,272 37<br />
Oklahoma .............. 2,743 1,082 39 414 15 976 36<br />
Oregon ................. 2,889 1,266 44 481 17 1,129 39<br />
Pennsylvania............. 9,793 3,638 37 1,038 11 3,502 36<br />
Rhode Isl<strong>and</strong> ............ 842 312 37 96 11 298 35<br />
South Carolina ........... 3,315 943 28 332 10 924 28<br />
South Dakota ............ 601 266 44 116 19 257 43<br />
Tennessee ............... 4,699 1,966 42 725 15 1,853 39<br />
Texas. .................. 17,076 4,111 24 1,176 7 3,861 23<br />
Utah ................... 1,808 574 32 255 14 491 27<br />
Vermont ................ 506 279 55 82 16 274 54<br />
Virginia................. 5,893 2,126 36 603 10 2,082 35<br />
Washington.............. 4,980 2,007 40 686 14 1,927 39<br />
West Virginia ............ 1,458 585 40 *129 *9 559 38<br />
Wisconsin ............... 4,350 1,710 39 424 10 1,703 39<br />
Wyoming ............... 405 194 48 82 20 180 44<br />
* Estimate based on a sample size <strong>of</strong> 10–29.<br />
Note: Detail does not add to total because <strong>of</strong> multiple responses. U.S. totals include responses from participants residing in the District <strong>of</strong> Columbia, as described in<br />
Appendix D.<br />
112 <strong>2006</strong> <strong>National</strong> <strong>Survey</strong> <strong>of</strong> <strong>Fishing</strong>, <strong>Hunting</strong>, <strong>and</strong> <strong>Wildlife</strong>-<strong>Associated</strong> Recreation U.S. Fish & <strong>Wildlife</strong> Service
Table 66. Participation in <strong>Wildlife</strong>-Watching Activities by State Where Activity Took Place: <strong>2006</strong><br />
(Population 16 years old <strong>and</strong> older. Numbers in thous<strong>and</strong>s)<br />
State where activity<br />
took place<br />
Total participants Away from home Around the home<br />
Number Percent Number Percent Number Percent<br />
United States, total ....... 71,132 100 22,977 32 67,756 95<br />
Alabama ................... 1,161 100 471 41 989 85<br />
Alaska..................... 496 100 354 72 202 41<br />
Arizona ................... 1,277 100 644 50 950 74<br />
Arkansas .................. 1,011 100 435 43 811 80<br />
California ................. 6,270 100 2,894 46 5,259 84<br />
Colorado ................... 1,819 100 873 48 1,393 77<br />
Connecticut................. 1,170 100 266 23 1,063 91<br />
Delaware................... 285 100 109 38 206 72<br />
Florida .................... 4,240 100 1,560 37 3,274 77<br />
Georgia ................... 1,987 100 438 22 1,798 90<br />
Hawaii .................... 262 100 154 59 145 55<br />
Idaho...................... 754 100 506 67 395 52<br />
Illinois .................... 2,566 100 837 33 2,258 88<br />
Indiana .................... 2,042 100 755 37 1,786 87<br />
Iowa ...................... 1,205 100 404 34 1,059 88<br />
Kansas .................... 816 100 248 30 723 89<br />
Kentucky .................. 1,475 100 572 39 1,235 84<br />
Louisiana .................. 738 100 *225 *30 671 91<br />
Maine ..................... 801 100 399 50 576 72<br />
Maryl<strong>and</strong> .................. 1,491 100 419 28 1,322 89<br />
Massachusetts .............. 1,919 100 655 34 1,647 86<br />
Michigan .................. 3,227 100 1,034 32 2,826 88<br />
Minnesota ................. 2,093 100 641 31 1,908 91<br />
Mississippi ................. 731 100 246 34 606 83<br />
Missouri ................... 2,248 100 842 37 1,966 87<br />
Montana ................... 755 100 512 68 389 52<br />
Nebraska................... 490 100 176 36 407 83<br />
Nevada .................... 686 100 416 61 371 54<br />
New Hampshire ............. 710 100 347 49 451 63<br />
New Jersey ................. 1,713 100 615 36 1,483 87<br />
New Mexico................ 787 100 507 64 437 55<br />
NewYork.................. 3,852 100 1,293 34 3,465 90<br />
North Carolina ............. 2,641 100 686 26 2,237 85<br />
North Dakota .............. 148 100 *39 *26 128 86<br />
Ohio ...................... 3,489 100 1,055 30 3,272 94<br />
Oklahoma ................. 1,110 100 372 33 976 88<br />
Oregon .................... 1,484 100 675 45 1,129 76<br />
Pennsylvania................ 3,947 100 1,168 30 3,502 89<br />
Rhode Isl<strong>and</strong> ............... 436 100 203 47 298 68<br />
South Carolina .............. 1,115 100 447 40 924 83<br />
South Dakota ............... 432 100 270 63 257 60<br />
Tennessee .................. 2,362 100 1,007 43 1,853 78<br />
Texas...................... 4,225 100 956 23 3,861 91<br />
Utah ...................... 877 100 518 59 491 56<br />
Vermont ................... 468 100 265 57 274 59<br />
Virginia.................... 2,312 100 728 31 2,082 90<br />
Washington................. 2,331 100 959 41 1,927 83<br />
WestVirginia............... 743 100 282 38 559 75<br />
Wisconsin .................. 2,039 100 685 34 1,703 84<br />
Wyoming .................. 643 100 521 81 180 28<br />
* Estimate based on a sample size <strong>of</strong> 10–29.<br />
Note: Detail does not add to total because <strong>of</strong> multiple responses. U.S. totals include responses from participants residing in the District <strong>of</strong> Columbia, as described in<br />
Appendix D.<br />
U.S. Fish & <strong>Wildlife</strong> Service <strong>2006</strong> <strong>National</strong> <strong>Survey</strong> <strong>of</strong> <strong>Fishing</strong>, <strong>Hunting</strong>, <strong>and</strong> <strong>Wildlife</strong>-<strong>Associated</strong> Recreation 113
Table 67. Participation in Away-From-Home <strong>Wildlife</strong> Watching by State Where Activity Took Place: <strong>2006</strong><br />
(Population 16 years old <strong>and</strong> older. Numbers in thous<strong>and</strong>s)<br />
State where activity<br />
took place<br />
Total participants State residents Nonresidents<br />
Number Percent Number Percent Number Percent<br />
United States, total .... 22,977 100 19,095 83 7,530 33<br />
Alabama ................ 471 100 315 67 *156 *33<br />
Alaska. ................. 354 100 66 19 288 81<br />
Arizona ................ 644 100 352 55 292 45<br />
Arkansas ............... 435 100 274 63 *161 *37<br />
California .............. 2,894 100 2,328 80 566 20<br />
Colorado ................ 873 100 488 56 385 44<br />
Connecticut.............. 266 100 187 70 *79 *30<br />
Delaware................ 109 100 35 32 *74 *68<br />
Florida ................. 1,560 100 813 52 746 48<br />
Georgia ................ 438 100 *256 *58 *183 *42<br />
Hawaii ................. 154 100 *47 *31 *107 *69<br />
Idaho. .................. 506 100 179 35 326 65<br />
Illinois ................. 837 100 546 65 *291 *35<br />
Indiana ................. 755 100 537 71 *218 *29<br />
Iowa ................... 404 100 292 72 *112 *28<br />
Kansas ................. 248 100 202 81 ... ...<br />
Kentucky ............... 572 100 398 70 *173 *30<br />
Louisiana ............... *225 *100 *193 *86 ... ...<br />
Maine .................. 399 100 186 47 213 53<br />
Maryl<strong>and</strong> ............... 419 100 253 60 *166 *40<br />
Massachusetts ........... 655 100 444 68 212 32<br />
Michigan ............... 1,034 100 753 73 *281 *27<br />
Minnesota .............. 641 100 495 77 *146 *23<br />
Mississippi .............. 246 100 *126 *51 *120 *49<br />
Missouri ................ 842 100 611 73 *231 *27<br />
Montana ................ 512 100 169 33 343 67<br />
Nebraska................ 176 100 115 65 *61 *35<br />
Nevada ................. 416 100 133 32 283 68<br />
New Hampshire .......... 347 100 98 28 249 72<br />
New Jersey .............. 615 100 418 68 *198 *32<br />
New Mexico............. 507 100 199 39 *308 *61<br />
NewYork............... 1,293 100 936 72 357 28<br />
North Carolina .......... 686 100 300 44 386 56<br />
North Dakota ........... *39 *100 *23 *60 ... ...<br />
Ohio ................... 1,055 100 923 87 *132 *13<br />
Oklahoma .............. 372 100 313 84 ... ...<br />
Oregon ................. 675 100 382 57 293 43<br />
Pennsylvania............. 1,168 100 858 73 310 27<br />
Rhode Isl<strong>and</strong> ............ 203 100 75 37 *128 *63<br />
South Carolina ........... 447 100 267 60 *180 *40<br />
South Dakota ............ 270 100 105 39 *165 *61<br />
Tennessee ............... 1,007 100 611 61 397 39<br />
Texas. .................. 956 100 *778 *81 *178 *19<br />
Utah ................... 518 100 194 37 324 63<br />
Vermont ................ 265 100 77 29 188 71<br />
Virginia................. 728 100 542 74 *186 *26<br />
Washington.............. 959 100 628 66 *331 *34<br />
West Virginia ............ 282 100 *120 *43 *162 *57<br />
Wisconsin ............... 685 100 356 52 329 48<br />
Wyoming ............... 521 100 71 14 451 86<br />
* Estimate based on a sample size <strong>of</strong> 10–29. ... Sample size too small to report data reliably.<br />
Note: Detail does not add to total because <strong>of</strong> multiple responses. U.S. totals include responses from participants residing in the District <strong>of</strong> Columbia, as described in<br />
Appendix D.<br />
114 <strong>2006</strong> <strong>National</strong> <strong>Survey</strong> <strong>of</strong> <strong>Fishing</strong>, <strong>Hunting</strong>, <strong>and</strong> <strong>Wildlife</strong>-<strong>Associated</strong> Recreation U.S. Fish & <strong>Wildlife</strong> Service
Table 68. Days <strong>of</strong> <strong>Wildlife</strong> Watching Away From Home by State Where Activity Took Place<br />
<strong>and</strong> Participant’s State <strong>of</strong> Residence: <strong>2006</strong><br />
(Population 16 years old <strong>and</strong> older. Numbers in thous<strong>and</strong>s)<br />
Days <strong>of</strong> activity in state<br />
Days <strong>of</strong> activity by state residents<br />
State<br />
Total days,<br />
residents <strong>and</strong><br />
nonresidents<br />
Days by<br />
residents<br />
Days by<br />
nonresidents<br />
Total days, in state<br />
<strong>of</strong> residence <strong>and</strong><br />
other states<br />
Days in state<br />
<strong>of</strong> residence<br />
Days in other<br />
states<br />
Number Percent Number Percent Number Percent Number Percent Number Percent Number Percent<br />
United States, total .... 352,070 100 269,936 77 82,134 23 352,070 100 269,936 77 82,134 23<br />
Alabama ................ 7,292 100 6,634 91 *659 *9 7,488 100 6,634 89 *854 *11<br />
Alaska.................. 4,126 100 1,434 35 2,692 65 1,629 100 1,434 88 ... ...<br />
Arizona ................ 5,281 100 3,634 69 1,647 31 4,784 100 3,634 76 *1,149 *24<br />
Arkansas ............... 4,148 100 3,739 90 *409 *10 4,434 100 3,739 84 ... ...<br />
California .............. 45,010 100 41,436 92 3,573 8 47,752 100 41,436 87 6,315 13<br />
Colorado ................ 9,404 100 7,010 75 2,394 25 8,105 100 7,010 86 *1,095 *14<br />
Connecticut.............. 4,184 100 3,660 87 *524 *13 5,400 100 3,660 68 1,740 32<br />
Delaware................ 855 100 718 84 *136 *16 847 100 718 85 *129 *15<br />
Florida ................. 16,551 100 10,449 63 6,102 37 14,451 100 10,449 72 *4,001 *28<br />
Georgia ................ 4,097 100 *3,266 *80 *830 *20 5,221 100 *3,266 *63 *1,954 *37<br />
Hawaii ................. 1,109 100 *386 *35 *723 *65 *488 *100 *386 *79 ... ...<br />
Idaho................... 5,165 100 2,423 47 2,741 53 2,975 100 2,423 81 ... ...<br />
Illinois ................. 5,686 100 4,512 79 *1,174 *21 7,720 100 4,512 58 3,208 42<br />
Indiana ................. 24,013 100 7,397 31 *16,616 *69 8,644 100 7,397 86 *1,248 *14<br />
Iowa ................... 4,013 100 3,655 91 *358 *9 4,436 100 3,655 82 *782 *18<br />
Kansas ................. 3,244 100 3,029 93 ... ... 3,626 100 3,029 84 *597 *16<br />
Kentucky ............... 4,155 100 3,265 79 *890 *21 4,155 100 3,265 79 *890 *21<br />
Louisiana ............... *3,199 *100 *3,076 *96 ... ... *3,905 *100 *3,076 *79 ... ...<br />
Maine .................. 4,778 100 3,621 76 1,157 24 3,979 100 3,621 91 *358 *9<br />
Maryl<strong>and</strong> ............... 4,782 100 4,124 86 *658 *14 4,919 100 4,124 84 *795 *16<br />
Massachusetts ........... 8,461 100 7,866 93 595 7 9,863 100 7,866 80 1,998 20<br />
Michigan ............... 10,043 100 8,600 86 *1,443 *14 11,582 100 8,600 74 *2,982 *26<br />
Minnesota .............. 8,040 100 7,416 92 *625 *8 9,705 100 7,416 76 *2,290 *24<br />
Mississippi .............. 1,302 100 *962 *74 *339 *26 *1,408 *100 *962 *68 ... ...<br />
Missouri ................ 14,757 100 13,445 91 *1,312 *9 14,924 100 13,445 90 *1,479 *10<br />
Montana ................ 3,081 100 1,578 51 1,503 49 1,809 100 1,578 87 *231 *13<br />
Nebraska................ 906 100 808 89 *98 *11 1,323 100 808 61 *514 *39<br />
Nevada ................. 2,298 100 1,366 59 932 41 1,935 100 1,366 71 *569 *29<br />
New Hampshire .......... 3,165 100 1,922 61 1,243 39 2,393 100 1,922 80 471 20<br />
New Jersey .............. 7,965 100 7,307 92 *658 *8 8,694 100 7,307 84 1,388 16<br />
New Mexico............. 5,429 100 3,670 68 *1,759 *32 3,890 100 3,670 94 *219 *6<br />
NewYork............... 13,521 100 11,361 84 2,160 16 14,515 100 11,361 78 *3,154 *22<br />
North Carolina .......... 4,868 100 2,552 52 2,316 48 3,641 100 2,552 70 *1,089 *30<br />
North Dakota ........... *264 *100 *168 *64 ... ... *284 *100 *168 *59 ... ...<br />
Ohio ................... 7,816 100 6,746 86 *1,070 *14 9,522 100 6,746 71 *2,776 *29<br />
Oklahoma .............. 7,098 100 6,824 96 ... ... 8,003 100 6,824 85 *1,179 *15<br />
Oregon ................. 8,162 100 6,344 78 1,817 22 7,741 100 6,344 82 *1,397 *18<br />
Pennsylvania............. 11,972 100 10,562 88 1,410 12 13,157 100 10,562 80 *2,594 *20<br />
Rhode Isl<strong>and</strong> ............ 2,948 100 900 31 *2,048 *69 1,246 100 900 72 346 28<br />
South Carolina ........... 4,759 100 1,788 38 *2,972 *62 2,233 100 1,788 80 *446 *20<br />
South Dakota ............ 1,382 100 690 50 *693 *50 771 100 690 89 ... ...<br />
Tennessee ............... 15,486 100 13,447 87 2,039 13 15,031 100 13,447 89 *1,584 *11<br />
Texas................... 13,120 100 *12,150 *93 *970 *7 *31,986 *100 *12,150 *38 ... ...<br />
Utah ................... 3,927 100 2,409 61 1,518 39 3,216 100 2,409 75 *807 *25<br />
Vermont ................ 2,459 100 1,491 61 968 39 2,053 100 1,491 73 *562 *27<br />
Virginia................. 5,745 100 4,495 78 *1,250 *22 7,269 100 4,495 62 *2,774 *38<br />
Washington.............. 9,104 100 7,995 88 *1,109 *12 9,475 100 7,995 84 1,480 16<br />
West Virginia ............ 4,005 100 *2,748 *69 *1,257 *31 *3,346 *100 *2,748 *82 ... ...<br />
Wisconsin ............... 5,547 100 3,760 68 1,786 32 4,568 100 3,760 82 ... ...<br />
Wyoming ............... 3,009 100 813 27 2,196 73 963 100 813 84 *149 *16<br />
* Estimate based on a sample size <strong>of</strong> 10–29. ... Sample size too small to report data reliably.<br />
Note: Detail does not add to total because <strong>of</strong> nonresponse. U.S. totals include responses from participants residing in the District <strong>of</strong> Columbia, as described in<br />
Appendix D.<br />
U.S. Fish & <strong>Wildlife</strong> Service <strong>2006</strong> <strong>National</strong> <strong>Survey</strong> <strong>of</strong> <strong>Fishing</strong>, <strong>Hunting</strong>, <strong>and</strong> <strong>Wildlife</strong>-<strong>Associated</strong> Recreation 115
Table 69. Expenditures for <strong>Wildlife</strong>-Watching Activities by State Where Spending Took Place: <strong>2006</strong><br />
(Population 16 years old <strong>and</strong> older. Expenditures in thous<strong>and</strong>s <strong>of</strong> dollars)<br />
State where spending<br />
took place<br />
Trip-related expenditures<br />
Food <strong>and</strong><br />
lodging<br />
Total triprelated<br />
Transportation<br />
Other<br />
trip costs<br />
Expenditures for equipment<br />
Total<br />
equipment<br />
<strong>Wildlife</strong>watching<br />
equipment<br />
Auxiliary<br />
equipment<br />
Special<br />
equipment<br />
Total<br />
expenditures<br />
Expenditures<br />
for<br />
other<br />
items 1<br />
United States, total .... 45,654,960 12,875,152 7,516,281 4,456,013 902,858 23,174,053 9,869,727 1,033,060 12,271,266 9,605,755<br />
Alabama ................ 450,004 151,665 77,815 47,239 *26,611 258,551 137,632 *18,943 ... *39,788<br />
Alaska. ................. 581,051 511,602 308,919 148,615 54,068 36,803 34,318 *2,486 ... 32,646<br />
Arizona ................ 838,307 376,256 226,856 138,829 10,572 289,296 132,546 *28,670 ... 172,754<br />
Arkansas ............... 607,073 114,879 60,666 46,451 *7,762 314,275 128,546 ... ... *177,919<br />
California .............. 4,179,583 1,997,551 1,181,309 657,316 158,927 1,931,640 1,131,764 200,080 *599,797 250,391<br />
Colorado ................ 1,387,737 537,427 345,652 165,370 26,405 817,468 131,635 *32,468 ... 32,842<br />
Connecticut.............. 509,950 53,025 14,833 34,896 *3,296 395,098 151,303 13,581 ... 61,826<br />
Delaware................ 130,832 13,128 6,054 5,978 *1,097 110,214 31,593 *3,053 ... 7,490<br />
Florida ................. 3,081,496 887,942 565,177 264,052 58,713 1,730,152 353,046 24,159 *1,352,947 463,402<br />
Georgia ................ 1,615,316 146,722 89,209 43,820 *13,694 1,246,059 417,129 *44,523 ... 222,534<br />
Hawaii ................. 210,414 185,100 108,276 60,429 16,395 20,505 17,450 *3,055 ... 4,810<br />
Idaho. .................. 265,383 193,468 81,615 96,383 15,471 62,756 59,828 ... ... *9,159<br />
Illinois ................. 1,133,856 205,976 98,942 88,364 *18,670 780,921 340,407 *57,082 ... 146,959<br />
Indiana ................. 933,920 143,615 80,678 43,914 19,022 671,595 242,537 *8,853 ... 118,710<br />
Iowa ................... 318,006 54,411 26,749 26,241 ... 199,190 132,212 ... ... 64,405<br />
Kansas ................. 156,185 52,778 20,316 30,411 *2,051 90,294 55,191 *4,815 ... 13,113<br />
Kentucky ............... 542,059 116,113 67,494 46,949 ... 374,034 137,558 ... ... 51,912<br />
Louisiana ............... 312,430 61,822 *41,818 *18,772 *1,232 188,409 102,097 ... ... 62,199<br />
Maine .................. 865,643 178,462 116,876 50,392 11,194 593,051 76,001 *61,474 *455,576 94,130<br />
Maryl<strong>and</strong> ............... 636,214 70,457 35,864 25,799 8,794 526,010 174,055 *8,815 *343,140 39,748<br />
Massachusetts ........... 754,963 148,779 73,481 65,496 9,802 494,008 215,958 31,122 ... 112,177<br />
Michigan ............... 1,622,521 339,188 189,949 133,660 *15,579 780,258 331,432 *26,322 ... 503,076<br />
Minnesota .............. 698,889 271,493 192,267 68,787 *10,439 370,838 332,942 *20,354 ... 56,558<br />
Mississippi .............. 175,846 68,587 *31,567 *30,634 *6,386 86,553 84,814 ... ... *20,706<br />
Missouri ................ 869,075 219,932 86,027 121,019 *12,886 410,810 316,242 *21,580 ... 238,332<br />
Montana ................ 376,451 302,625 177,498 95,146 29,982 54,631 43,694 ... ... 19,195<br />
Nebraska................ 141,910 22,741 10,721 11,431 *589 108,348 42,675 *960 ... 10,821<br />
Nevada ................. 362,229 158,935 75,569 45,901 37,466 109,816 61,649 *6,426 ... 93,478<br />
New Hampshire .......... 273,920 116,136 63,345 50,754 2,037 75,466 70,947 *3,509 ... 82,318<br />
New Jersey .............. 537,449 146,300 81,168 58,984 *6,148 265,100 225,519 *35,044 ... 126,049<br />
New Mexico............. 297,174 208,278 124,779 71,056 12,443 81,952 47,495 *3,541 ... 6,944<br />
NewYork............... 1,567,629 695,724 351,017 306,721 37,986 635,306 602,353 *17,256 ... 236,599<br />
North Carolina .......... 916,903 246,906 131,930 99,341 15,635 588,658 294,390 *15,900 ... 81,338<br />
North Dakota ........... 22,913 4,952 *1,306 *3,551 ... 16,979 10,008 ... ... *981<br />
Ohio ................... 1,187,703 207,253 118,964 84,018 ... 738,301 372,495 *40,105 ... 242,149<br />
Oklahoma .............. 328,660 134,868 75,517 54,824 *4,527 177,568 158,048 *3,052 ... 16,225<br />
Oregon ................. 776,414 262,425 155,350 96,970 10,105 442,818 142,603 *29,407 ... 71,170<br />
Pennsylvania............. 1,442,681 324,990 176,807 131,536 16,646 928,853 432,149 *29,397 ... 188,838<br />
Rhode Isl<strong>and</strong> ............ 214,247 97,407 84,630 9,984 *2,793 48,884 33,237 *10,103 ... 67,955<br />
South Carolina ........... 550,777 195,804 115,067 57,668 *23,069 281,434 150,641 *36,976 ... 73,539<br />
South Dakota ............ 183,304 129,930 97,896 29,244 *2,789 46,977 34,758 *4,204 ... 6,397<br />
Tennessee ............... 992,362 327,240 215,427 102,989 8,823 433,538 271,007 46,057 ... 231,585<br />
Texas. .................. 2,939,018 424,197 206,692 148,729 68,776 1,780,171 664,076 *24,928 ... 734,650<br />
Utah ................... 564,443 322,023 228,164 83,011 10,848 226,692 55,756 *8,414 ... 15,728<br />
Vermont ................ 122,872 58,219 37,206 19,244 *1,770 30,461 27,646 *2,815 ... 34,192<br />
Virginia................. 960,190 248,021 195,270 41,807 10,944 626,861 245,364 *4,016 ... 85,307<br />
Washington.............. 1,502,311 441,652 227,721 157,045 56,886 594,706 262,335 29,797 *302,574 465,953<br />
West Virginia ............ 241,601 136,136 *76,701 *57,678 ... 77,068 69,352 ... ... *28,397<br />
Wisconsin ............... 744,689 260,166 171,773 79,881 *8,512 285,185 199,868 *27,604 ... 199,339<br />
Wyoming ............... 394,869 299,988 186,338 97,847 15,803 64,740 20,031 ... ... 30,140<br />
* Estimate based on a sample size <strong>of</strong> 10–29. ... Sample size too small to report data reliably.<br />
1 Includes expenditures for magazine subscriptions, membership dues <strong>and</strong> contributions, l<strong>and</strong> leasing <strong>and</strong> owning, <strong>and</strong> plantings around the home that benefit wildlife.<br />
Note: U.S. totals include responses from participants residing in the District <strong>of</strong> Columbia, as described in Appendix D.<br />
116 <strong>2006</strong> <strong>National</strong> <strong>Survey</strong> <strong>of</strong> <strong>Fishing</strong>, <strong>Hunting</strong>, <strong>and</strong> <strong>Wildlife</strong>-<strong>Associated</strong> Recreation U.S. Fish & <strong>Wildlife</strong> Service
Appendix A
Appendix A.<br />
Defi nitions<br />
Annual household income—Total<br />
<strong>2006</strong> income <strong>of</strong> household members<br />
before taxes <strong>and</strong> other deductions.<br />
Around-the-home wildlife<br />
watching—Activity within 1 mile <strong>of</strong><br />
home with one <strong>of</strong> six primary purposes:<br />
(1) taking special interest in or trying<br />
to identify birds or other wildlife; (2)<br />
photographing wildlife; (3) feeding<br />
birds or other wildlife; (4) maintaining<br />
natural areas <strong>of</strong> at least 1/4 acre for<br />
the benefit <strong>of</strong> wildlife; (5) maintaining<br />
plantings (such as shrubs <strong>and</strong> agricultural<br />
crops) for the benefit <strong>of</strong> wildlife;<br />
<strong>and</strong> (6) visiting public l<strong>and</strong> to observe,<br />
photograph, or feed wildlife.<br />
Auxiliary equipment—Equipment<br />
owned primarily for wildlife- associated<br />
recreation. For the sportspersons<br />
section, these include sleeping bags,<br />
packs, duffel bags, tents, binoculars<br />
<strong>and</strong> field glasses, special fishing <strong>and</strong><br />
hunting clothing, foul weather gear,<br />
boots <strong>and</strong> waders, maintenance <strong>and</strong><br />
repair <strong>of</strong> equipment, <strong>and</strong> processing<br />
<strong>and</strong> taxidermy costs. For the wildlifewatching<br />
section, these include tents,<br />
tarps, frame packs, backpacking <strong>and</strong><br />
other camping equipment, <strong>and</strong> blinds.<br />
Away-from-home wildlife watching—<br />
Trips or outings at least 1 mile from<br />
home for the primary purpose <strong>of</strong><br />
observing, photographing, or feeding<br />
wildlife. Trips to zoos, circuses, aquariums,<br />
<strong>and</strong> museums are not included.<br />
Big game—Bear, deer, elk, moose,<br />
wild turkey, <strong>and</strong> similar large animals<br />
that are hunted.<br />
Census Divisions<br />
East North Central<br />
Illinois<br />
Indiana<br />
Michigan<br />
Ohio<br />
Wisconsin<br />
East South Central<br />
Alabama<br />
Kentucky<br />
Mississippi<br />
Tennessee<br />
Middle Atlantic<br />
New Jersey<br />
New York<br />
Pennsylvania<br />
Mountain<br />
Arizona<br />
Colorado<br />
Idaho<br />
Montana<br />
Nevada<br />
New Mexico<br />
Utah<br />
Wyoming<br />
New Engl<strong>and</strong><br />
Connecticut<br />
Maine<br />
Massachusetts<br />
New Hampshire<br />
Rhode Isl<strong>and</strong><br />
Vermont<br />
Pacific<br />
Alaska<br />
California<br />
Hawaii<br />
Oregon<br />
Washington<br />
South Atlantic<br />
Delaware<br />
District <strong>of</strong> Columbia<br />
Florida<br />
Georgia<br />
Maryl<strong>and</strong><br />
North Carolina<br />
South Carolina<br />
Virginia<br />
West Virginia<br />
West North Central<br />
Kansas<br />
Iowa<br />
Minnesota<br />
Missouri<br />
Nebraska<br />
North Dakota<br />
South Dakota<br />
West South Central<br />
Arkansas<br />
Louisiana<br />
Oklahoma<br />
Texas<br />
Day—Any part <strong>of</strong> a day spent participating<br />
in a given activity. For example,<br />
if someone hunted two hours one day<br />
<strong>and</strong> three hours another day, it would<br />
be reported as two days <strong>of</strong> hunting.<br />
If someone hunted two hours in the<br />
morning <strong>and</strong> three hours in the afternoon<br />
<strong>of</strong> the same day, it would be<br />
considered one day <strong>of</strong> hunting.<br />
Education—The highest completed<br />
grade <strong>of</strong> school or year <strong>of</strong> college.<br />
Expenditures—Money spent in <strong>2006</strong><br />
for wildlife-related recreation trips<br />
in the United States, wildlife-related<br />
recreational equipment purchased in<br />
the United States, <strong>and</strong> other items. The<br />
“other items” were books <strong>and</strong> magazines,<br />
membership dues <strong>and</strong> contributions,<br />
l<strong>and</strong> leasing or owning, hunting<br />
<strong>and</strong> fishing licenses, <strong>and</strong> plantings,<br />
all for the purpose <strong>of</strong> wildlife-related<br />
recreation. Expenditures included<br />
both money spent by participants for<br />
themselves <strong>and</strong> the value <strong>of</strong> gifts they<br />
received.<br />
<strong>Fishing</strong>—The sport <strong>of</strong> catching or<br />
attempting to catch fish with a hook<br />
<strong>and</strong> line, bow <strong>and</strong> arrow, or spear; it<br />
also includes catching or gathering<br />
shellfish (clams, crabs, etc.); <strong>and</strong> the<br />
noncommercial seining or netting<br />
<strong>of</strong> fish, unless the fish are for use as<br />
bait. For example, seining for smelt is<br />
fishing, but seining for bait minnows is<br />
not included as fishing.<br />
118 <strong>2006</strong> <strong>National</strong> <strong>Survey</strong> <strong>of</strong> <strong>Fishing</strong>, <strong>Hunting</strong>, <strong>and</strong> <strong>Wildlife</strong>-<strong>Associated</strong> Recreation U.S. Fish & <strong>Wildlife</strong> Service
<strong>Fishing</strong> equipment—Items owned<br />
primarily for fishing:<br />
Rods, reels, poles, <strong>and</strong> rodmaking<br />
components<br />
Lines <strong>and</strong> leaders<br />
Artificial lures, flies, baits, <strong>and</strong><br />
dressing for flies or lines<br />
Hooks, sinkers, swivels, <strong>and</strong> other<br />
items attached to a line, except lures<br />
<strong>and</strong> baits<br />
Tackle boxes<br />
Creels, stringers, fish bags, l<strong>and</strong>ing<br />
nets, <strong>and</strong> gaff hooks<br />
Minnow traps, seines, <strong>and</strong> bait<br />
containers<br />
Depth finders, fish finders, <strong>and</strong> other<br />
electronic fishing devices<br />
Ice fishing equipment<br />
Other fishing equipment<br />
Freshwater—Reservoirs, lakes, ponds,<br />
<strong>and</strong> the nontidal portions <strong>of</strong> rivers <strong>and</strong><br />
streams.<br />
Great Lakes fishing—<strong>Fishing</strong> in Lakes<br />
Superior, Michigan, Huron, St. Clair,<br />
Erie, <strong>and</strong> Ontario, their connecting<br />
waters such as the St. Mary’s River<br />
system, Detroit River, St. Clair River,<br />
<strong>and</strong> the Niagara River, <strong>and</strong> the St.<br />
Lawrence River south <strong>of</strong> the bridge<br />
at Cornwall, New York. Great Lakes<br />
fishing includes fishing in tributaries <strong>of</strong><br />
the Great Lakes for smelt, steelhead,<br />
<strong>and</strong> salmon.<br />
Home—The starting point <strong>of</strong> a<br />
wi ldlife-related recreational trip. It may<br />
be a permanent residence or a temporary<br />
or seasonal residence such as a<br />
cabin.<br />
<strong>Hunting</strong>—The sport <strong>of</strong> shooting or<br />
attempting to shoot wildlife with firearms<br />
or archery equipment.<br />
<strong>Hunting</strong> equipment—Items owned<br />
primarily for hunting:<br />
Rifles, shotguns, muzzleloaders, <strong>and</strong><br />
h<strong>and</strong>guns<br />
Archery equipment<br />
Telescopic sights<br />
Decoys <strong>and</strong> game calls<br />
Ammunition<br />
H<strong>and</strong> loading equipment<br />
<strong>Hunting</strong> dogs <strong>and</strong> associated costs<br />
Other hunting equipment<br />
L<strong>and</strong> leasing <strong>and</strong> owning—Leasing<br />
or owning l<strong>and</strong> either singly or in<br />
cooperation with others for the primary<br />
purpose <strong>of</strong> fishing, hunting, or wildlife<br />
watching on it.<br />
Maintain natural areas—To set aside<br />
1/4 acre or more <strong>of</strong> natural environment,<br />
such as wood lots or open fields,<br />
for the primary purpose <strong>of</strong> benefiting<br />
wildlife. This is categorized as a wildlife-watching<br />
activity, not fishing or<br />
hunting.<br />
Maintain plantings—To introduce<br />
or encourage the growth <strong>of</strong> food <strong>and</strong><br />
cover plants for the primary purpose<br />
<strong>of</strong> benefiting wildlife. Examples <strong>of</strong><br />
plantings are butterfly bushes <strong>and</strong><br />
various sumacs. This is categorized as<br />
a wildlife-watching activity, not fishing<br />
or hunting.<br />
Metropolitan statistical ar ea<br />
(MSA)—Except in the New Engl<strong>and</strong><br />
States, an MSA is a county or group <strong>of</strong><br />
contiguous counties containing at least<br />
one city <strong>of</strong> 50,000 or more inhabitants<br />
or twin cities (i.e., cities with contiguous<br />
boundaries <strong>and</strong> constituting, for<br />
general social <strong>and</strong> economic purposes,<br />
a single community) with a combined<br />
population <strong>of</strong> at least 50,000. Also<br />
included in an MSA are contiguous<br />
counties that are socially <strong>and</strong> economically<br />
integrated with the central city.<br />
In the New Engl<strong>and</strong> States, an MSA<br />
consists <strong>of</strong> towns <strong>and</strong> cities instead <strong>of</strong><br />
counties. Each MSA must include at<br />
least one central city. See U.S. Census<br />
Bureau publication State <strong>and</strong> Metropolitan<br />
Area Data Book; <strong>2006</strong> for more<br />
detailed information on MSAs. It can<br />
be found at .<br />
Migratory birds—Birds that regularly<br />
migrate from one region or climate to<br />
another such as ducks, geese, <strong>and</strong> doves<br />
<strong>and</strong> other birds that may be hunted.<br />
Multiple responses—The term used<br />
to reflect the fact that individuals or<br />
their characteristics fall into more than<br />
one reporting category. An example<br />
<strong>of</strong> a big game hunter who hunted for<br />
deer <strong>and</strong> elk demonstrates the effect <strong>of</strong><br />
multiple responses. In this case, adding<br />
the number <strong>of</strong> deer hunters (one) <strong>and</strong><br />
elk hunters (one) would overstate the<br />
number <strong>of</strong> big game hunters (one)<br />
because deer <strong>and</strong> elk hunters are not<br />
mutually exclusive categories. In<br />
contrast, total participants is the sum <strong>of</strong><br />
male <strong>and</strong> female participants, because<br />
“male” <strong>and</strong> “female” are mutually<br />
exclusive categories.<br />
Nonresidents—Individuals who do<br />
not live in the State being reported.<br />
For example, a person living in Texas<br />
who watches whales in California is<br />
a nonresidential wildlife-watcher in<br />
California.<br />
Nonresponse—A term used to reflect<br />
the fact that some <strong>Survey</strong> respondents<br />
provide incomplete sets <strong>of</strong> information.<br />
For example, a <strong>Survey</strong> respondent<br />
may have been unable to identify the<br />
primary type <strong>of</strong> hunting for which a<br />
gun was bought. Total hunting expenditure<br />
estimates will include the gun<br />
purchase, but it will not appear as<br />
spending for big game or any other<br />
type <strong>of</strong> hunting. Nonresponses result in<br />
reported totals that are greater than the<br />
sum <strong>of</strong> their parts.<br />
Observe—To take special interest in<br />
or try to identify birds, fish, or other<br />
wildlife.<br />
Other animals—Coyotes, crows,<br />
foxes, groundhogs, prairie dogs,<br />
raccoons, <strong>and</strong> similar animals that can<br />
be legally hunted <strong>and</strong> are not classified<br />
as big game, small game, or migratory<br />
birds. They may be classified as<br />
unprotected or predatory animals by the<br />
State in which they are hunted. Feral<br />
pigs are classified as “other animals” in<br />
all States except Hawaii, where they are<br />
considered big game.<br />
Participants—Individuals who engage<br />
in fishing, hunting, or a wildlifewatching<br />
activity. Unless otherwise<br />
stated, a person has to have hunted,<br />
fished, or wildlife watched in <strong>2006</strong> to<br />
be considered a participant.<br />
Plantings—See “Maintain plantings.”<br />
Primary purpose—The principal<br />
motivation for an activity, trip, or<br />
expenditure.<br />
Private l<strong>and</strong>—L<strong>and</strong> that is owned by a<br />
private individual, group <strong>of</strong> individuals,<br />
or nongovernmental organization.<br />
Public l<strong>and</strong>—L<strong>and</strong> that is owned by<br />
local governments (such as county<br />
parks <strong>and</strong> municipal watersheds), State<br />
U.S. Fish & <strong>Wildlife</strong> Service <strong>2006</strong> <strong>National</strong> <strong>Survey</strong> <strong>of</strong> <strong>Fishing</strong>, <strong>Hunting</strong>, <strong>and</strong> <strong>Wildlife</strong>-<strong>Associated</strong> Recreation 119
governments (such as State parks <strong>and</strong><br />
wildlife management areas), or federal<br />
governments (such as <strong>National</strong> Forests<br />
<strong>and</strong> <strong>Wildlife</strong> Refuges).<br />
Public parks or areas—See “Public<br />
l<strong>and</strong>.”<br />
Residents—Individuals who lived in<br />
the State being reported. For example,<br />
a person who lives in California <strong>and</strong><br />
watches whales in California is a residential<br />
wildlife watcher in California.<br />
Rural—All territory, population,<br />
<strong>and</strong> housing units located outside <strong>of</strong><br />
urbanized areas <strong>and</strong> urban clusters, as<br />
determined by the Census Bureau.<br />
Saltwater—Oceans, tidal bays <strong>and</strong><br />
sounds, <strong>and</strong> the tidal portions <strong>of</strong> rivers<br />
<strong>and</strong> streams.<br />
Screening interviews—The first<br />
<strong>Survey</strong> contact with a sample household.<br />
Screening interviews are<br />
conducted with a household representative<br />
to identify respondents who<br />
are eligible for in-depth interviews.<br />
Screening interviews gather data such<br />
as age <strong>and</strong> sex about individuals in the<br />
households. Further information on<br />
screening interviews is available on<br />
page vii in the “<strong>Survey</strong> Background<br />
<strong>and</strong> Method” section <strong>of</strong> this report.<br />
Small game—Grouse, pheasants, quail,<br />
rabbits, squirrels, <strong>and</strong> similar small<br />
animals for which States have small<br />
game seasons <strong>and</strong> bag limits.<br />
Special equipment—Big-ticket equipment<br />
items that are owned primarily for<br />
wildlife-related recreation:<br />
Bass boats<br />
Other types <strong>of</strong> motorboats<br />
Canoes <strong>and</strong> other types <strong>of</strong> nonmotorboats<br />
Boat motors, boat trailer/hitches,<br />
<strong>and</strong> other boat accessories<br />
Pickups, campers, vans, travel or<br />
tent trailers, motor homes, house<br />
trailers, recreational vehicles (RVs)<br />
Cabins<br />
Off-the-road vehicles such as trail<br />
bikes, all terrain vehicles (ATVs),<br />
dune buggies, four-wheelers, 4x4<br />
vehicles, <strong>and</strong> snowmobiles<br />
Other special equipment<br />
Spenders—People who spent money<br />
on fishing, hunting, or wildlifewatching<br />
activities or equipment.<br />
Sportspersons—Individuals who<br />
engage in fishing, hunting, or both.<br />
Trip—An outing involving fishing,<br />
hunting, or wildlife watching. A trip<br />
may begin from an individual’s principal<br />
residence or from another place,<br />
such as a vacation home or the home<br />
<strong>of</strong> a relative. A trip may last an hour, a<br />
day, or many days.<br />
Type <strong>of</strong> fishing—There are three<br />
types <strong>of</strong> fishing: (1) freshwater except<br />
Great Lakes, (2) Great Lakes, <strong>and</strong> (3)<br />
saltwater.<br />
Type <strong>of</strong> hunting—There are four types<br />
<strong>of</strong> hunting: (1) big game, (2) small<br />
game, (3) migratory bird, <strong>and</strong> (4) other<br />
animal.<br />
Unspecified expenditure—An item<br />
that was purchased for use in both<br />
fishing <strong>and</strong> hunting, rather than<br />
primarily one or the other. Auxiliary<br />
equipment, special equipment, magazines<br />
<strong>and</strong> books, <strong>and</strong> membership dues<br />
<strong>and</strong> contributions are the items for<br />
which a purchase could be categorized<br />
as “unspecified.”<br />
Urban—All territory, population, <strong>and</strong><br />
housing units located within boundaries<br />
that encompass densely settled territory,<br />
consisting <strong>of</strong> core census block groups<br />
or blocks that have a population density<br />
<strong>of</strong> at least 1,000 people per square mile<br />
<strong>and</strong> surrounding census blocks that<br />
have an overall density <strong>of</strong> at least 500<br />
people per square mile. Under certain<br />
conditions, less densely settled territory<br />
may be included, as determined by the<br />
Census Bureau.<br />
<strong>Wildlife</strong>—Animals, such as birds, fish,<br />
insects, mammals, amphibians, <strong>and</strong><br />
reptiles that are living in natural or wild<br />
environments. <strong>Wildlife</strong> does not include<br />
animals living in aquariums, zoos,<br />
<strong>and</strong> other artificial surroundings or<br />
domestic animals such as farm animals<br />
or pets.<br />
<strong>Wildlife</strong>-associated recreation—<br />
Recreational fishing, hunting, <strong>and</strong><br />
wildlife watching.<br />
<strong>Wildlife</strong> watching—There are six<br />
types <strong>of</strong> wildlife watching: (1) closely<br />
observing, (2) photographing, (3)<br />
feeding, (4) visiting public parks or<br />
areas, (5) maintaining plantings, <strong>and</strong><br />
(6) maintaining natural areas. These<br />
activities must be the primary purpose<br />
<strong>of</strong> the trip or the around-the-home<br />
undertaking.<br />
<strong>Wildlife</strong> observed, photographed, or<br />
fed—Examples <strong>of</strong> species that wildlife<br />
watchers observe, photograph, <strong>and</strong>/or<br />
feed are (1) Wild birds—songbirds<br />
such as cardinals, robins, warblers,<br />
jays, buntings, <strong>and</strong> sparrows; birds<br />
<strong>of</strong> prey such as hawks, owls, eagles,<br />
<strong>and</strong> falcons; waterfowl such as ducks,<br />
geese, <strong>and</strong> swans; other water birds<br />
such as shorebirds, herons, pelicans,<br />
<strong>and</strong> cranes; <strong>and</strong> other birds such as<br />
pheasants, turkeys, road runners, <strong>and</strong><br />
woodpeckers; (2) L<strong>and</strong> mammals—<br />
large l<strong>and</strong> mammals such as bears,<br />
bison, deer, moose, <strong>and</strong> elk; <strong>and</strong> small<br />
l<strong>and</strong> mammals such as squirrels, foxes,<br />
prairie dogs, <strong>and</strong> rabbits; (3) Fish<br />
such as salmon, sharks, <strong>and</strong> groupers;<br />
(4) Marine mammals such as whales,<br />
dolphins, <strong>and</strong> manatees; <strong>and</strong> (5) Other<br />
wildlife such as butterflies, turtles,<br />
spiders, <strong>and</strong> snakes.<br />
<strong>Wildlife</strong>-watching equipment—Items<br />
owned primarily for observing, photographing,<br />
or feeding wildlife:<br />
Binoculars <strong>and</strong> spotting scopes<br />
Cameras, video cameras, special<br />
lenses, <strong>and</strong> other photographic<br />
equipment<br />
Film <strong>and</strong> developing<br />
Commercially prepared <strong>and</strong> packaged<br />
wild bird food<br />
Other bulk food used to feed wild<br />
birds<br />
Food for other wildlife<br />
Nest boxes, bird houses, feeders, <strong>and</strong><br />
baths<br />
Day packs, carrying cases, <strong>and</strong><br />
special clothing<br />
Other items such as field guides <strong>and</strong><br />
maps<br />
120 <strong>2006</strong> <strong>National</strong> <strong>Survey</strong> <strong>of</strong> <strong>Fishing</strong>, <strong>Hunting</strong>, <strong>and</strong> <strong>Wildlife</strong>-<strong>Associated</strong> Recreation U.S. Fish & <strong>Wildlife</strong> Service
Appendix B
Appendix B.<br />
2005 Participation <strong>of</strong> 6-to-15-Year-Olds <strong>and</strong><br />
Historical Participation <strong>of</strong> Sportspersons: Data<br />
From Screening Interviews<br />
The <strong>2006</strong> <strong>National</strong> <strong>Survey</strong> <strong>of</strong> <strong>Fishing</strong>,<br />
<strong>Hunting</strong>, <strong>and</strong> <strong>Wildlife</strong>-<strong>Associated</strong><br />
Recreation was carried out in two<br />
phases. The first (or screening) phase<br />
began in April <strong>2006</strong>. The main purpose<br />
<strong>of</strong> this phase was to collect information<br />
about all persons 16 years old <strong>and</strong><br />
older in order to develop a sample <strong>of</strong><br />
potential sportspersons <strong>and</strong> wildlifewatchers<br />
for the second (or detailed)<br />
phase. Also, information was collected<br />
on the number <strong>of</strong> persons 6 to 15 years<br />
old who participated in wildlife-related<br />
recreation activities in 2005.<br />
It is important to emphasize that the<br />
information reported from the <strong>2006</strong><br />
screen relates to activity only up to<br />
<strong>and</strong> including 2005. Also, these data<br />
are reported in most cases by one<br />
household respondent speaking for all<br />
household members rather than the<br />
actual participant. In addition, these<br />
data are based on long-term recall<br />
(at least a 12-month recall), which<br />
has been found in <strong>Survey</strong> research<br />
(Investigation <strong>of</strong> Possible Recall/Reference<br />
Period Bias in <strong>National</strong> <strong>Survey</strong>s<br />
<strong>of</strong> <strong>Fishing</strong>, <strong>Hunting</strong>, <strong>and</strong> <strong>Wildlife</strong>-<br />
<strong>Associated</strong> Recreation, December<br />
1989, Westat, Inc.) to add bias to the<br />
resulting estimates. In many cases,<br />
longer recall periods result in overestimating<br />
participation <strong>and</strong> expenditures<br />
for wildlife-related recreation.<br />
Tables B-1 through B-4 report data on<br />
first-time participation <strong>and</strong> the most<br />
recent year <strong>of</strong> hunting <strong>and</strong> fishing<br />
for participants 6 years <strong>of</strong> age <strong>and</strong><br />
older. Tables B-5 though B-11 report<br />
data specifically on 6-to-15-year-old<br />
participants in 2005. Table B-12 gives<br />
trend data for 6-15 year olds. Detailed<br />
expenditures <strong>and</strong> recreational activity<br />
data were not gathered for the 6-to-15-<br />
year-old participants.<br />
Because <strong>of</strong> differences in methodologies<br />
<strong>of</strong> the screening <strong>and</strong> the detailed<br />
phases <strong>of</strong> the <strong>2006</strong> <strong>Survey</strong>, resulting<br />
estimates are not comparable. Only<br />
participants 16 years old <strong>and</strong> older<br />
were eligible for the detailed phase.<br />
The detailed phase was a series <strong>of</strong> three<br />
interviews conducted at four-month<br />
intervals. The screening interviews<br />
were one year or more recall. The<br />
shorter recall period <strong>of</strong> the detailed<br />
phase had better data accuracy.<br />
122 <strong>2006</strong> <strong>National</strong> <strong>Survey</strong> <strong>of</strong> <strong>Fishing</strong>, <strong>Hunting</strong>, <strong>and</strong> <strong>Wildlife</strong>-<strong>Associated</strong> Recreation U.S. Fish & <strong>Wildlife</strong> Service
Table B-1. Anglers <strong>and</strong> Hunters Participating for the First Time in 2005 by Age Group<br />
(Population 6 years old <strong>and</strong> older. Numbers in thous<strong>and</strong>s)<br />
<strong>Fishing</strong> for first time<br />
<strong>Hunting</strong> for first time<br />
Age group<br />
Total anglers<br />
in 2005<br />
Number<br />
Percent<br />
<strong>of</strong> anglers<br />
in age group<br />
Total hunters<br />
in 2005<br />
Number<br />
Percent<br />
<strong>of</strong> hunters<br />
in age group<br />
Total, all ages .............. 55,739 3,983 7 15,725 1,327 8<br />
6 to 8 years .............. 3,403 937 28 212 101 48<br />
9 to 11 years.............. 3,747 574 15 369 153 42<br />
12 to 15 years ............ 4,960 464 9 1,192 423 35<br />
16 to 17 years ............ 1,910 128 7 677 97 14<br />
18 to 24 years ............ 4,773 288 6 1,475 165 11<br />
25to34years ............ 7,468 418 6 2,388 143 6<br />
35 to 44 years ............ 10,523 518 5 3,104 113 4<br />
45 to 54 years ............ 9,091 350 4 3,171 103 3<br />
55 to 64 years ............ 6,005 150 3 1,927 *21 *1<br />
65 years or older .......... 3,859 155 4 ... ... ...<br />
* Estimate based on a sample size <strong>of</strong> 10–29. ... Sample size too small to report data reliably.<br />
Note: Data reported on this table are from screening interviews in which one adult household member responded for all household members. The screening interview<br />
required the respondent to recall 12 months worth <strong>of</strong> activity.<br />
Table B-2. Anglers <strong>and</strong> Hunters Participating in 2004 but Not in 2005 by Age Group<br />
(Population 6 years old <strong>and</strong> older. Numbers in thous<strong>and</strong>s)<br />
Age group<br />
Anglers<br />
Hunters<br />
Number Percent Number Percent<br />
Total, all ages ....................... 11,506 100 3,183 100<br />
6 to 8 years ....................... 475 4 *61 *2<br />
9 to 11 years....................... 615 5 88 3<br />
12 to 15 years ..................... 929 8 171 5<br />
16 to 17 years ..................... 506 4 121 4<br />
18 to 24 years ..................... 1,002 9 327 10<br />
25 to 34 years ..................... 1,846 16 522 16<br />
35 to 44 years ..................... 2,166 19 697 22<br />
45 to 54 years ..................... 1,973 17 525 16<br />
55 to 64 years ..................... 1,131 10 402 13<br />
65 years or older ................... 864 8 269 8<br />
* Estimate based on a sample size <strong>of</strong> 10–29.<br />
Note: Data reported on this table are from screening interviews in which one adult household member responded for all household members. The screening interview<br />
required the respondent to recall 12 months worth <strong>of</strong> activity. Includes persons who fished or hunted only in other countries.<br />
U.S. Fish & <strong>Wildlife</strong> Service <strong>2006</strong> <strong>National</strong> <strong>Survey</strong> <strong>of</strong> <strong>Fishing</strong>, <strong>Hunting</strong>, <strong>and</strong> <strong>Wildlife</strong>-<strong>Associated</strong> Recreation 123
Table B-3. Most Recent Year <strong>of</strong> <strong>Hunting</strong> by Age Group<br />
(Population 6 years old <strong>and</strong> older. Numbers in thous<strong>and</strong>s)<br />
Age group<br />
Total, all persons<br />
who hunted in 2005<br />
or earlier year<br />
Most recent year <strong>of</strong> hunting<br />
2005 2004 2003<br />
Number Percent Number Percent Number Percent Number Percent<br />
Total, all ages .............. 46,247 100 15,741 34 3,191 7 1,750 4<br />
6 to 11 years.............. 829 100 581 70 149 18 *28 *3<br />
12 to 15 years ............ 1,588 100 1,192 75 172 11 68 4<br />
16 to 17 years ............ 967 100 677 70 121 13 73 8<br />
18 to 24 years ............ 3,037 100 1,477 49 331 11 224 7<br />
25 to 34 years ............ 5,868 100 2,390 41 522 9 300 5<br />
35 to 44 years ............ 8,465 100 3,111 37 700 8 409 5<br />
45 to 54 years ............ 9,326 100 3,174 34 525 6 281 3<br />
55 to 64 years ............ 7,761 100 1,927 25 402 5 219 3<br />
65 years or older .......... 8405 100 1,213 14 269 3 149 2<br />
Most recent year <strong>of</strong> hunting<br />
2002 2001 2000 Before 2000<br />
Number Percent Number Percent Number Percent Number Percent<br />
Total, all ages .............. 1,249 3 1,037 2 1,271 3 21,693 47<br />
6 to 11 years.............. ... ... ... ... ... ... *39 *5<br />
12 to 15 years ............ *43 *3 *15 *1 ... ... 67 4<br />
16 to 17 years ............ ... ... *16 *2 *18 *2 47 5<br />
18 to 24 years ............ 159 5 116 4 132 4 546 18<br />
25 to 34 years ............ 186 3 202 3 191 3 2,022 34<br />
35 to 44 years ............ 291 3 193 2 256 3 3,437 41<br />
45 to 54 years ............ 254 3 189 2 264 3 4,605 49<br />
55 to 64 years ............ 174 2 128 2 214 3 4,681 60<br />
65 years or older .......... 127 2 176 2 179 2 6,249 74<br />
* Estimate based on a sample size <strong>of</strong> 10–29. ... Sample size too small to report data reliably.<br />
Note: Data reported on this table are from screening interviews in which one adult household member responded for all household members. The screening interview<br />
required the respondent to recall 12 months worth <strong>of</strong> activity.<br />
124 <strong>2006</strong> <strong>National</strong> <strong>Survey</strong> <strong>of</strong> <strong>Fishing</strong>, <strong>Hunting</strong>, <strong>and</strong> <strong>Wildlife</strong>-<strong>Associated</strong> Recreation U.S. Fish & <strong>Wildlife</strong> Service
Table B-4. Most Recent Year <strong>of</strong> <strong>Fishing</strong> by Age Group<br />
(Population 6 years old <strong>and</strong> older. Numbers in thous<strong>and</strong>s)<br />
Age group<br />
Total, all persons<br />
who fished in 2005<br />
or earlier year<br />
Most recent year <strong>of</strong> fishing<br />
2005 2004 2003<br />
Number Percent Number Percent Number Percent Number Percent<br />
Total, all ages .............. 119,399 100 55,766 47 11,546 10 5,760 5<br />
6 to 11 years.............. 9,333 100 7,150 77 1,090 12 397 4<br />
12 to 15 years ............ 7,543 100 4,960 66 935 12 443 6<br />
16 to 17 years ............ 3,635 100 1,910 53 506 14 248 7<br />
18 to 24 years ............ 9,753 100 4,781 49 1,013 10 646 7<br />
25 to 34 years ............ 15,840 100 7,470 47 1,851 12 884 6<br />
35 to 44 years ............ 20,805 100 10,527 51 2,172 10 1,089 5<br />
45 to 54 years ............ 21,081 100 9,095 43 1,979 9 1,003 5<br />
55 to 64 years ............ 15,645 100 6,008 38 1,134 7 593 4<br />
65 years or older .......... 15,763 100 3,865 25 866 5 456 3<br />
Most recent year <strong>of</strong> fishing<br />
2002 2001 2000 Before 2000<br />
Number Percent Number Percent Number Percent Number Percent<br />
Total, all ages .............. 3,965 3 3,250 3 3,169 3 35,190 29<br />
6 to 11 years.............. 223 2 126 1 85 1 199 2<br />
12 to 15 years ............ 330 4 167 2 113 1 560 7<br />
16 to 17 years ............ 197 5 107 3 97 3 547 15<br />
18 to 24 years ............ 389 4 343 4 373 4 2,051 21<br />
25 to 34 years ............ 619 4 435 3 447 3 3,990 25<br />
35 to 44 years ............ 630 3 588 3 677 3 5,000 24<br />
45 to 54 years ............ 722 3 603 3 661 3 6,935 33<br />
55 to 64 years ............ 492 3 508 3 343 2 6,514 42<br />
65 years or older .......... 363 2 374 2 372 2 9,394 60<br />
Note: Data reported on this table are from screening interviews in which one adult household member responded for all household members. The screening interview<br />
required the respondent to recall 12 months worth <strong>of</strong> activity.<br />
U.S. Fish & <strong>Wildlife</strong> Service <strong>2006</strong> <strong>National</strong> <strong>Survey</strong> <strong>of</strong> <strong>Fishing</strong>, <strong>Hunting</strong>, <strong>and</strong> <strong>Wildlife</strong>-<strong>Associated</strong> Recreation 125
Table B-5. Anglers <strong>and</strong> Hunters 6 to 15 Years Old: 2005<br />
(Population 6 to 15 years old. Numbers in thous<strong>and</strong>s)<br />
Sportspersons<br />
Total, 6 to 15 years old 12 to 15 years old 9 to 11 years old 6 to 8 years old<br />
Number Percent Number Percent Number Percent Number Percent<br />
Total sportspersons, fished or hunted . 12,318 100 5,121 100 3,786 100 3,411 100<br />
Total anglers .................... 12,110 98 4,960 97 3,747 99 3,403 100<br />
Fished only .................... 10,545 86 3,929 77 3,417 90 3,199 94<br />
Fished <strong>and</strong> hunted............... 1,565 13 1,031 20 330 9 203 6<br />
Total hunters .................... 1,773 14 1,192 23 369 10 212 6<br />
Hunted only.................... 208 2 161 3 *38 *1 ... ...<br />
Hunted <strong>and</strong> fished............... 1,565 13 1,031 20 330 9 203 6<br />
* Estimate based on a sample size <strong>of</strong> 10–29. ... Sample size too small to report data reliably.<br />
Note: Detail does not add to total because <strong>of</strong> multiple responses. Data reported on this table are from screening interviews in which one adult household member<br />
responded for all household members 6 to 15 years old. The screening interview required the respondent to recall 12 months worth <strong>of</strong> activity. Includes persons<br />
who fished or hunted only in other countries.<br />
Table B-6. <strong>Wildlife</strong>-Watching Participants 6 to 15 Years Old by <strong>Wildlife</strong>-Watching Activity: 2005<br />
(Population 6 to 15 years old. Numbers in thous<strong>and</strong>s)<br />
Total, 6 to 15 years old 12 to 15 years old 9 to 11 years old 6 to 8 years old<br />
Activity<br />
Number<br />
Percent<br />
<strong>of</strong> participants<br />
Percent<br />
<strong>of</strong><br />
population<br />
Number<br />
Percent<br />
<strong>of</strong> participants<br />
Percent<br />
<strong>of</strong><br />
population<br />
Number<br />
Percent<br />
<strong>of</strong> participants<br />
Percent<br />
<strong>of</strong><br />
population<br />
Number<br />
Percent<br />
<strong>of</strong> participants<br />
Percent<br />
<strong>of</strong> population<br />
Total participants ......... 13,587 100 34 5,115 100 30 4,334 100 37 4,137 100 35<br />
Away from home ........ 5,850 43 14 2,154 42 13 1,981 46 17 1,716 41 14<br />
Around the home ........ 12,055 89 30 4,526 88 27 3,849 89 33 3,680 89 31<br />
Observe wildlife ....... 9,967 73 25 3,684 72 22 3,212 74 27 3,072 74 26<br />
Photograph wildlife .... 2,009 15 5 934 18 6 670 15 6 405 10 3<br />
Feed wild birds or other<br />
wildlife ............. 6,324 47 16 2,248 44 13 2,139 49 18 1,937 47 16<br />
Maintain plantings or<br />
natural areas ......... 1,913 14 5 843 16 5 626 14 5 444 11 4<br />
Note: Detail does not add to total because <strong>of</strong> multiple responses. Columns showing percent <strong>of</strong> participants are based on the first row <strong>of</strong> each column. Columns showing<br />
percent <strong>of</strong> population in age group are based on the U.S. population in each age category, including those who did not participate in wildlife-watching activities.<br />
Data reported on this table are from screening interviews in which one adult household member responded for household members 6 to 15 years old. The screening<br />
interview required the respondent to recall 12 months worth <strong>of</strong> activity. Includes persons who participated only in other countries.<br />
126 <strong>2006</strong> <strong>National</strong> <strong>Survey</strong> <strong>of</strong> <strong>Fishing</strong>, <strong>Hunting</strong>, <strong>and</strong> <strong>Wildlife</strong>-<strong>Associated</strong> Recreation U.S. Fish & <strong>Wildlife</strong> Service
Table B-7. Selected Characteristics <strong>of</strong> Anglers <strong>and</strong> Hunters 6 to 15 Years Old: 2005<br />
(Population 6 to 15 years old. Numbers in thous<strong>and</strong>s)<br />
Characteristic<br />
U.S. population Sportspersons, fished or hunted Fished only<br />
Number Percent Number<br />
Percent who<br />
participated Percent Number<br />
Percent who<br />
participated<br />
Percent<br />
Total persons ....................... 40,500 100 12,318 30 100 10,545 26 100<br />
Population Density <strong>of</strong> Residence<br />
Urban............................ 31,077 77 8,108 26 66 7,382 24 70<br />
Rural ............................ 9,422 23 4,210 45 34 3,163 34 30<br />
Population Size <strong>of</strong> Residence<br />
Metropolitan statistical area (MSA).... 33,809 83 9,618 28 78 8,537 25 81<br />
1,000,000 or more ............... 21,164 52 5,590 26 45 5,039 24 48<br />
250,000 to 999,999............... 8,790 22 2,678 30 22 2,383 27 23<br />
Less than 250,000................ 3,854 10 1,350 35 11 1,114 29 11<br />
Outside MSA ..................... 6,691 17 2,701 40 22 2,008 30 19<br />
Census Geographic Division<br />
New Engl<strong>and</strong> ..................... 1,807 4 552 31 4 530 29 5<br />
Middle Atlantic.................... 5,246 13 1,384 26 11 1,266 24 12<br />
East North Central ................. 6,343 16 2,285 36 19 2,002 32 19<br />
West North Central................. 2,571 6 1,289 50 10 1,074 42 10<br />
South Atlantic ..................... 7,435 18 2,222 30 18 1,930 26 18<br />
East South Central ................. 2,309 6 886 38 7 627 27 6<br />
West South Central................. 4,896 12 1,502 31 12 1,117 23 11<br />
Mountain......................... 2,922 7 872 30 7 760 26 7<br />
Pacific ........................... 6,971 17 1,326 19 11 1,240 18 12<br />
Age<br />
6 to 8 years....................... 11,896 29 3,411 29 28 3,199 27 30<br />
9 to 11 years ...................... 11,827 29 3,786 32 31 3,417 29 32<br />
12 to 15 years..................... 16,777 41 5,121 31 42 3,929 23 37<br />
Sex<br />
Male, total........................ 20,929 52 7,662 37 62 6,225 30 59<br />
6 to 8 years..................... 6,068 15 2,017 33 16 1,835 30 17<br />
9to11years.................... 6,104 15 2,324 38 19 2,013 33 19<br />
12 to 15 years................... 8,756 22 3,321 38 27 2,377 27 23<br />
Female, total ...................... 19,571 48 4,656 24 38 4,320 22 41<br />
6 to 8 years..................... 5,828 14 1,394 24 11 1,364 23 13<br />
9to11years.................... 5,722 14 1,462 26 12 1,404 25 13<br />
12 to 15 years................... 8,021 20 1,799 22 15 1,551 19 15<br />
Ethnicity<br />
Hispanic ......................... 7,598 19 1,032 14 8 941 12 9<br />
Non-Hispanic ..................... 32,901 81 11,286 34 92 9,604 29 91<br />
Race<br />
White............................ 31,400 78 10,976 35 89 9,315 30 88<br />
Black ............................ 6,051 15 709 12 6 664 11 6<br />
Asian ............................ 1,948 5 227 12 2 220 11 2<br />
All others ........................ 1,100 3 406 37 3 347 32 3<br />
Annual Household Income<br />
Under $10,000 .................... 1,647 4 324 20 3 290 18 3<br />
$10,000 to $19,999................. 2,894 7 439 15 4 405 14 4<br />
$20,000 to $24,999................. 2,105 5 509 24 4 449 21 4<br />
$25,000 to $29,999................. 2,099 5 524 25 4 441 21 4<br />
$30,000 to $34,999................. 2,127 5 561 26 5 492 23 5<br />
$35,000 to $39,999................. 2,006 5 565 28 5 477 24 5<br />
$40,000 to $49,999................. 3,416 8 1,200 35 10 1,026 30 10<br />
$50,000 to $74,999................. 6,824 17 2,542 37 21 2,077 30 20<br />
$75,000 to $99,999................. 4,470 11 1,869 42 15 1,611 36 15<br />
$100,000 or more .................. 6,225 15 2,616 42 21 2,295 37 22<br />
Not reported ...................... 6,687 17 1,170 17 9 983 15 9<br />
See footnotes at end <strong>of</strong> table.<br />
U.S. Fish & <strong>Wildlife</strong> Service <strong>2006</strong> <strong>National</strong> <strong>Survey</strong> <strong>of</strong> <strong>Fishing</strong>, <strong>Hunting</strong>, <strong>and</strong> <strong>Wildlife</strong>-<strong>Associated</strong> Recreation 127
Table B-7. Selected Characteristics <strong>of</strong> Anglers <strong>and</strong> Hunters 6 to 15 Years Old: 2005—Continued<br />
(Population 6 to 15 years old. Numbers in thous<strong>and</strong>s)<br />
Hunted only<br />
Fished <strong>and</strong> hunted<br />
Characteristic<br />
Number<br />
Percent who<br />
participated Percent Number<br />
Percent who<br />
participated<br />
Percent<br />
Total persons ....................... 208 1 100 1,565 4 100<br />
Population Density <strong>of</strong> Residence<br />
Urban............................ 99 (Z) 47 627 2 40<br />
Rural ............................ 110 1 53 937 10 60<br />
Population Size <strong>of</strong> Residence<br />
Metropolitan statistical area (MSA).... 141 (Z) 68 939 3 60<br />
1,000,000 or more ............... 62 (Z) 30 489 2 31<br />
250,000 to 999,999............... *49 *1 *24 245 3 16<br />
Less than 250,000................ *31 *1 *15 205 5 13<br />
Outside MSA ..................... 67 1 32 626 9 40<br />
Census Geographic Division<br />
New Engl<strong>and</strong> ..................... ... ... ... *20 *1 *1<br />
Middle Atlantic.................... ... ... ... *95 *2 *6<br />
East North Central ................. ... ... ... 264 4 17<br />
West North Central................. *30 *1 *14 185 7 12<br />
South Atlantic ..................... *37 *(Z) *18 255 3 16<br />
East South Central ................. *31 *1 *15 228 10 15<br />
West South Central................. *30 *1 *15 355 7 23<br />
Mountain......................... 25 1 12 86 3 6<br />
Pacific ........................... ... ... ... 75 1 5<br />
Age<br />
6 to 8 years....................... ... ... ... 203 2 13<br />
9 to 11 years ...................... *38 *(Z) *18 330 3 21<br />
12 to 15 years..................... 161 1 77 1,031 6 66<br />
Sex<br />
Male, total........................ 158 1 76 1,278 6 82<br />
6 to 8 years..................... ... ... ... 175 3 11<br />
9 to 11 years .................... *27 *(Z) *13 284 5 18<br />
12 to 15 years................... 125 1 60 819 9 52<br />
Female, total ...................... 50 (Z) 24 286 1 18<br />
6 to 8 years..................... ... ... ... *28 *(Z) *2<br />
9 to 11 years .................... ... ... ... *46 *1 *3<br />
12 to 15 years................... *36 *(Z) *17 212 3 14<br />
Ethnicity<br />
Hispanic ......................... ... ... ... *86 *1 *6<br />
Non-Hispanic ..................... 203 1 97 1,478 4 94<br />
Race<br />
White............................ 194 1 93 1,466 5 94<br />
Black ............................ ... ... ... *36 *1 *2<br />
Asian ............................ ... ... ... ... ... ...<br />
All others ........................ ... ... ... 55 5 3<br />
Annual Household Income<br />
Under $10,000 .................... ... ... ... *29 *2 *2<br />
$10,000 to $19,999................. ... ... ... *26 *1 *2<br />
$20,000 to $24,999................. ... ... ... *50 *2 *3<br />
$25,000 to $29,999................. ... ... ... *74 *4 *5<br />
$30,000 to $34,999................. ... ... ... 64 3 4<br />
$35,000 to $39,999................. ... ... ... 75 4 5<br />
$40,000 to $49,999................. ... ... ... 161 5 10<br />
$50,000 to $74,999................. 57 1 28 407 6 26<br />
$75,000 to $99,999................. *27 *1 *13 231 5 15<br />
$100,000 or more .................. *39 *1 *19 282 5 18<br />
Not reported ...................... *21 *(Z) *10 165 2 11<br />
* Estimate based on a sample size <strong>of</strong> 10–29. ... Sample size too small to report data reliably. (Z) Less than 0.5 percent.<br />
Note: Percent who participated columns show the percent <strong>of</strong> each row’s population who participated in the activity named by the column (the percent <strong>of</strong> those living in<br />
urban areas who fished only, etc.). Percent columns show the percent <strong>of</strong> each column’s participants who are described by the row heading (the percent <strong>of</strong> those who<br />
fished only who lived in urban areas, etc.). Data reported on this table are from screening interviews in which one adult household member responded for all<br />
household members. The screening interview required the respondent to recall 12 months worth <strong>of</strong> activity.<br />
128 <strong>2006</strong> <strong>National</strong> <strong>Survey</strong> <strong>of</strong> <strong>Fishing</strong>, <strong>Hunting</strong>, <strong>and</strong> <strong>Wildlife</strong>-<strong>Associated</strong> Recreation U.S. Fish & <strong>Wildlife</strong> Service
Table B-8. Selected Characteristics <strong>of</strong> <strong>Wildlife</strong>-Watching Participants 6 to 15 Years Old: 2005<br />
(Population 6 to 15 years old. Numbers in thous<strong>and</strong>s)<br />
Characteristic<br />
U.S. population<br />
Number Percent Number<br />
Participants<br />
Total Away from home Around the home<br />
Percent<br />
who<br />
participated<br />
Percent Number<br />
Percent<br />
who<br />
participated<br />
Percent Number<br />
Percent<br />
who<br />
participated<br />
Percent<br />
Total persons ..................... 40,500 100 13,587 34 100 5,850 14 100 12,055 30 100<br />
Population Density <strong>of</strong> Residence<br />
Urban. ......................... 31,077 77 9,503 31 70 4,103 13 70 8,331 27 69<br />
Rural .......................... 9,422 23 4,084 43 30 1,747 19 30 3,724 40 31<br />
Population Size <strong>of</strong> Residence<br />
Metropolitan statistical area (MSA) . . . 33,809 83 10,937 32 80 4,726 14 81 9,694 29 80<br />
1,000,000 or more .............. 21,164 52 6,289 30 46 2,713 13 46 5,569 26 46<br />
250,000 to 999,999 ............. 8,790 22 3,097 35 23 1,365 16 23 2,727 31 23<br />
Less than 250,000 .............. 3,854 10 1,550 40 11 647 17 11 1,398 36 12<br />
Outside MSA. ................... 6,691 17 2,650 40 20 1,125 17 19 2,361 35 20<br />
Census Geographic Division<br />
New Engl<strong>and</strong> .................... 1,807 4 744 41 5 295 16 5 658 36 5<br />
Middle Atlantic .................. 5,246 13 1,698 32 12 712 14 12 1,564 30 13<br />
East North Central ................ 6,343 16 2,265 36 17 987 16 17 2,074 33 17<br />
West North Central ............... 2,571 6 1,201 47 9 498 19 9 1,028 40 9<br />
South Atlantic ................... 7,435 18 2,343 32 17 875 12 15 2,165 29 18<br />
East South Central ................ 2,309 6 792 34 6 317 14 5 731 32 6<br />
West South Central ............... 4,896 12 1,603 33 12 738 15 13 1,400 29 12<br />
Mountain ....................... 2,922 7 1,072 37 8 554 19 9 906 31 8<br />
Pacific ......................... 6,971 17 1,868 27 14 873 13 15 1,528 22 13<br />
Age<br />
6 to 8 years ..................... 11,896 29 4,137 35 30 1,716 14 29 3,680 31 31<br />
9 to 11 years .................... 11,827 29 4,334 37 32 1,981 17 34 3,849 33 32<br />
12to15years................... 16,777 41 5,115 30 38 2,154 13 37 4,526 27 38<br />
Sex<br />
Male, total ...................... 20,929 52 7,281 35 54 3,138 15 54 6,468 31 54<br />
6 to 8 years ................... 6,068 15 2,156 36 16 916 15 16 1,908 31 16<br />
9 to 11 years .................. 6,104 15 2,256 37 17 1,051 17 18 2,027 33 17<br />
12to15years ................. 8,756 22 2,869 33 21 1,171 13 20 2,533 29 21<br />
Female, total .................... 19,571 48 6,306 32 46 2,712 14 46 5,587 29 46<br />
6 to 8 years ................... 5,828 14 1,981 34 15 800 14 14 1,772 30 15<br />
9 to 11 years .................. 5,722 14 2,078 36 15 930 16 16 1,822 32 15<br />
12 to 15 years ................. 8,021 20 2,247 28 17 983 12 17 1,993 25 17<br />
Ethnicity<br />
Hispanic. ....................... 7,598 19 1,626 21 12 784 10 13 1,378 18 11<br />
Non-Hispanic. ................... 32,901 81 11,960 36 88 5,067 15 87 10,677 32 89<br />
Race<br />
White. ......................... 31,400 78 11,687 37 86 5,025 16 86 10,468 33 87<br />
Black .......................... 6,051 15 1,000 17 7 314 5 5 890 15 7<br />
Asian .......................... 1,948 5 438 22 3 275 14 5 294 15 2<br />
All others. ...................... 1,100 3 461 42 3 236 21 4 404 37 3<br />
Annual Household Income<br />
Under $10,000 ................... 1,647 4 335 20 2 145 9 2 284 17 2<br />
$10,000 to $19,999 ............... 2,894 7 716 25 5 271 9 5 648 22 5<br />
$20,000 to $24,999 ............... 2,105 5 533 25 4 188 9 3 462 22 4<br />
$25,000 to $29,999 ............... 2,099 5 547 26 4 300 14 5 464 22 4<br />
$30,000 to $34,999 ............... 2,127 5 743 35 5 279 13 5 642 30 5<br />
$35,000 to $39,999 ............... 2,006 5 641 32 5 283 14 5 596 30 5<br />
$40,000 to $49,999 ............... 3,416 8 1,312 38 10 493 14 8 1,167 34 10<br />
$50,000 to $74,999 ............... 6,824 17 2,601 38 19 1,171 17 20 2,351 34 20<br />
$75,000 to $99,999 ............... 4,470 11 2,027 45 15 1,022 23 17 1,776 40 15<br />
$100,000 or more. ................ 6,225 15 2,858 46 21 1,280 21 22 2,537 41 21<br />
Not reported. .................... 6,687 17 1,273 19 9 417 6 7 1,129 17 9<br />
Note: Detail does not add to total because <strong>of</strong> multiple responses. Percent who participated columns show the percent <strong>of</strong> each row’s population who participated in the<br />
activity named by the column (the percent <strong>of</strong> those living in urban areas who were around-the-home participants, etc.). Percent columns show the percent <strong>of</strong> each<br />
column’s participants who are described by the row heading (the percent <strong>of</strong> those who were around-the-home participants who lived in urban areas, etc.). Data<br />
reported on this table are from screening interviews in which one adult household member responded for all household members 6 to 15 years old. The screening<br />
interview required the respondent to recall 12 months worth <strong>of</strong> activity. Includes persons who participated in wildlife-watching activities only in other countries.<br />
U.S. Fish & <strong>Wildlife</strong> Service <strong>2006</strong> <strong>National</strong> <strong>Survey</strong> <strong>of</strong> <strong>Fishing</strong>, <strong>Hunting</strong>, <strong>and</strong> <strong>Wildlife</strong>-<strong>Associated</strong> Recreation 129
Table B-9. Participants in <strong>Wildlife</strong>-Related Recreation 6 to 15 Years Old by State Residents Both Inside<br />
<strong>and</strong> Outside Their Resident State: 2005<br />
(Population 6 to 15 years old. Numbers in thous<strong>and</strong>s)<br />
Participant’s state <strong>of</strong><br />
residence<br />
Population<br />
Total participants Sportspersons <strong>Wildlife</strong>-watching participants<br />
Number<br />
Percent <strong>of</strong><br />
population<br />
Number<br />
Percent <strong>of</strong><br />
population<br />
Number<br />
Percent <strong>of</strong><br />
population<br />
United States, total.......... 40,500 18,421 45 12,318 30 13,587 34<br />
Alabama ................. 600 281 47 230 38 177 29<br />
Alaska................... 104 75 72 58 55 52 50<br />
Arizona .................. 879 321 36 172 20 236 27<br />
Arkansas ................. 371 217 58 164 44 121 33<br />
California ................ 5,389 1,656 31 810 15 1,255 23<br />
Colorado ................. 646 364 56 242 37 302 47<br />
Connecticut............... 472 225 48 138 29 175 37<br />
Delaware................. 107 53 49 35 32 40 37<br />
Florida .................. 2,263 884 39 547 24 645 29<br />
Georgia .................. 1,281 567 44 394 31 406 32<br />
Hawaii .................. 168 56 33 33 20 38 22<br />
Idaho.................... 206 124 60 87 42 86 42<br />
Illinois................... 1,785 725 41 493 28 500 28<br />
Indiana .................. 897 489 55 366 41 313 35<br />
Iowa .................... 368 240 65 184 50 177 48<br />
Kansas .................. 368 237 64 177 48 178 48<br />
Kentucky ................ 541 348 64 272 50 245 45<br />
Louisiana ................ 620 233 37 167 27 160 26<br />
Maine ................... 155 103 66 73 47 78 51<br />
Maryl<strong>and</strong> ................ 772 329 43 210 27 253 33<br />
Massachusetts............. 798 380 48 194 24 316 40<br />
Michigan................. 1,414 747 53 541 38 613 43<br />
Minnesota ................ 672 495 74 391 58 346 52<br />
Mississippi ............... 404 164 41 147 36 96 24<br />
Missouri ................. 756 469 62 353 47 343 45<br />
Montana ................. 112 71 63 46 41 49 44<br />
Nebraska................. 233 135 58 106 45 73 31<br />
Nevada .................. 354 122 34 69 20 103 29<br />
New Hampshire ........... 172 106 62 78 45 80 47<br />
New Jersey ............... 1,203 438 36 279 23 326 27<br />
New Mexico.............. 270 131 48 83 31 103 38<br />
NewYork................ 2,476 905 37 513 21 697 28<br />
North Carolina ............ 1,181 562 48 384 33 370 31<br />
North Dakota ............. 74 45 61 37 50 28 38<br />
Ohio .................... 1,531 861 56 596 39 597 39<br />
Oklahoma ................ 466 269 58 172 37 201 43<br />
Oregon .................. 477 254 53 157 33 188 39<br />
Pennsylvania.............. 1,567 854 54 592 38 674 43<br />
Rhode Isl<strong>and</strong> ............. 136 67 50 36 26 52 39<br />
South Carolina ............ 564 290 51 218 39 179 32<br />
South Dakota ............. 101 65 65 41 41 56 56<br />
Tennessee ................ 764 364 48 236 31 275 36<br />
Texas.................... 3,438 1,412 41 1,000 29 1,121 33<br />
Utah .................... 393 203 51 141 36 157 40<br />
Vermont ................. 74 53 71 33 45 41 56<br />
Virginia.................. 1,000 479 48 325 33 367 37<br />
Washington............... 833 416 50 268 32 335 40<br />
West Virginia ............. 211 120 57 109 52 83 39<br />
Wisconsin ................ 716 375 52 290 40 242 34<br />
Wyoming ................ 62 46 74 30 49 36 58<br />
Note: Detail does not add to total because <strong>of</strong> multiple responses. U.S. totals include responses from participants residing in the District <strong>of</strong> Columbia, as described in the<br />
statistical accuracy appendix. Data reported on this table are from screening interviews in which one adult household member responded for household members<br />
6 to 15 years old. The screening interview required the respondent to recall 12 months worth <strong>of</strong> activity. Includes persons who participated only in other countries.<br />
130 <strong>2006</strong> <strong>National</strong> <strong>Survey</strong> <strong>of</strong> <strong>Fishing</strong>, <strong>Hunting</strong>, <strong>and</strong> <strong>Wildlife</strong>-<strong>Associated</strong> Recreation U.S. Fish & <strong>Wildlife</strong> Service
Table B-10. Anglers <strong>and</strong> Hunters 6 to 15 Years Old by State Residents Participating Both Inside <strong>and</strong><br />
Outside Their Resident State: 2005<br />
(Population 6 to 15 years old. Numbers in thous<strong>and</strong>s)<br />
Sportsperson’s state <strong>of</strong><br />
residence<br />
Population<br />
Fished or hunted Fished only Hunted only Fished <strong>and</strong> hunted<br />
Number<br />
Percent <strong>of</strong><br />
population<br />
Number<br />
Percent <strong>of</strong><br />
population<br />
Number<br />
Percent <strong>of</strong><br />
population<br />
Number<br />
Percent <strong>of</strong><br />
population<br />
United States, total.......... 40,500 12,318 30 10,545 26 208 1 1,565 4<br />
Alabama ................. 600 230 38 157 26 ... ... *64 *11<br />
Alaska................... 104 58 55 52 50 ... ... *6 *5<br />
Arizona .................. 879 172 20 156 18 ... ... ... ...<br />
Arkansas ................. 371 164 44 120 32 ... ... *37 *10<br />
California ................ 5,389 810 15 778 14 ... ... ... ...<br />
Colorado ................. 646 242 37 223 34 ... ... *13 *2<br />
Connecticut............... 472 138 29 136 29 ... ... ... ...<br />
Delaware................. 107 35 32 32 30 ... ... ... ...<br />
Florida .................. 2,263 547 24 499 22 ... ... *38 *2<br />
Georgia .................. 1,281 394 31 324 25 ... ... *56 *4<br />
Hawaii .................. 168 33 20 30 18 ... ... ... ...<br />
Idaho.................... 206 87 42 68 33 ... ... *13 *6<br />
Illinois................... 1,785 493 28 438 25 ... ... *55 *3<br />
Indiana .................. 897 366 41 303 34 ... ... *57 *6<br />
Iowa .................... 368 184 50 157 43 ... ... *23 *6<br />
Kansas .................. 368 177 48 152 41 ... ... *18 *5<br />
Kentucky ................ 541 272 50 219 41 ... ... *42 *8<br />
Louisiana ................ 620 167 27 120 19 ... ... *43 *7<br />
Maine ................... 155 73 47 68 44 ... ... ... ...<br />
Maryl<strong>and</strong> ................ 772 210 27 187 24 ... ... *19 *2<br />
Massachusetts............. 798 194 24 190 24 ... ... ... ...<br />
Michigan................. 1,414 541 38 486 34 ... ... *52 *4<br />
Minnesota ................ 672 391 58 334 50 ... ... *54 *8<br />
Mississippi ............... 404 147 36 78 19 ... ... 61 15<br />
Missouri ................. 756 353 47 289 38 ... ... *57 *8<br />
Montana ................. 112 46 41 33 30 ... ... *9 *8<br />
Nebraska................. 233 106 45 86 37 ... ... *18 *8<br />
Nevada .................. 354 69 20 62 18 ... ... ... ...<br />
New Hampshire ........... 172 78 45 74 43 ... ... ... ...<br />
New Jersey ............... 1,203 279 23 271 23 ... ... ... ...<br />
New Mexico.............. 270 83 31 78 29 ... ... ... ...<br />
NewYork................ 2,476 513 21 471 19 ... ... ... ...<br />
North Carolina ............ 1,181 384 33 337 29 ... ... *42 *4<br />
North Dakota ............. 74 37 50 26 36 ... ... *7 *9<br />
Ohio .................... 1,531 596 39 541 35 ... ... *49 *3<br />
Oklahoma ................ 466 172 37 125 27 ... ... 41 9<br />
Oregon .................. 477 157 33 141 29 ... ... ... ...<br />
Pennsylvania.............. 1,567 592 38 525 33 ... ... *53 *3<br />
Rhode Isl<strong>and</strong> ............. 136 36 26 35 26 ... ... ... ...<br />
South Carolina ............ 564 218 39 188 33 ... ... *29 *5<br />
South Dakota ............. 101 41 41 30 30 ... ... *8 *8<br />
Tennessee ................ 764 236 31 173 23 ... ... *62 *8<br />
Texas.................... 3,438 1,000 29 752 22 ... ... 234 7<br />
Utah .................... 393 141 36 114 29 ... ... *23 *6<br />
Vermont ................. 74 33 45 27 37 ... ... ... ...<br />
Virginia.................. 1,000 325 33 289 29 ... ... *34 *3<br />
Washington............... 833 268 32 239 29 ... ... *22 *3<br />
WestVirginia............. 211 109 52 73 35 ... ... *34 *16<br />
Wisconsin ................ 716 290 40 233 33 ... ... *51 *7<br />
Wyoming ................ 62 30 49 25 40 ... ... *5 *7<br />
* Estimate based on a sample size <strong>of</strong> 10–29. ... Sample size too small to report data reliably.<br />
Note: U.S. totals include responses from participants residing in the District <strong>of</strong> Columbia, as described in the statistical accuracy appendix. Data reported on this table are<br />
from screening interviews in which one adult household member responded for household members 6 to 15 years old. The screening interviews required the<br />
respondent to recall 12 months worth <strong>of</strong> activity. Includes persons who participated only in other countries.<br />
U.S. Fish & <strong>Wildlife</strong> Service <strong>2006</strong> <strong>National</strong> <strong>Survey</strong> <strong>of</strong> <strong>Fishing</strong>, <strong>Hunting</strong>, <strong>and</strong> <strong>Wildlife</strong>-<strong>Associated</strong> Recreation 131
Table B-11. Participants in <strong>Wildlife</strong>-Watching Activities 6 to 15 Years Old by State Residents Participating<br />
Both Inside <strong>and</strong> Outside Their Resident State: 2005<br />
(Population 6 to 15 years old. Numbers in thous<strong>and</strong>s)<br />
Participants<br />
Participant’s state <strong>of</strong><br />
residence<br />
Population<br />
Number<br />
Total Away from home Around the home<br />
Percent <strong>of</strong><br />
population<br />
Number<br />
Percent <strong>of</strong><br />
population<br />
Number<br />
Percent <strong>of</strong><br />
population<br />
United States, total.......... 40,500 13,587 34 5,850 14 12,055 30<br />
Alabama ................. 600 177 29 *49 *8 165 27<br />
Alaska................... 104 52 50 27 26 47 45<br />
Arizona .................. 879 236 27 113 13 205 23<br />
Arkansas ................. 371 121 33 *41 *11 102 27<br />
California ................ 5,389 1,255 23 597 11 1,011 19<br />
Colorado ................. 646 302 47 158 25 265 41<br />
Connecticut............... 472 175 37 71 15 155 33<br />
Delaware................. 107 40 37 17 16 35 33<br />
Florida .................. 2,263 645 29 232 10 611 27<br />
Georgia .................. 1,281 406 32 153 12 376 29<br />
Hawaii .................. 168 38 22 17 10 30 18<br />
Idaho.................... 206 86 42 37 18 63 31<br />
Illinois................... 1,785 500 28 216 12 467 26<br />
Indiana .................. 897 313 35 144 16 285 32<br />
Iowa .................... 368 177 48 77 21 160 43<br />
Kansas .................. 368 178 48 68 19 147 40<br />
Kentucky ................ 541 245 45 89 16 224 41<br />
Louisiana ................ 620 160 26 *74 *12 143 23<br />
Maine ................... 155 78 51 35 23 73 47<br />
Maryl<strong>and</strong> ................ 772 253 33 118 15 231 30<br />
Massachusetts............. 798 316 40 121 15 278 35<br />
Michigan................. 1,414 613 43 313 22 551 39<br />
Minnesota ................ 672 346 52 161 24 296 44<br />
Mississippi ............... 404 96 24 *34 *8 88 22<br />
Missouri ................. 756 343 45 130 17 295 39<br />
Montana ................. 112 49 44 36 32 39 34<br />
Nebraska................. 233 73 31 33 14 57 25<br />
Nevada .................. 354 103 29 50 14 84 24<br />
New Hampshire ........... 172 80 47 40 23 67 39<br />
New Jersey ............... 1,203 326 27 139 12 288 24<br />
New Mexico.............. 270 103 38 53 20 82 30<br />
NewYork................ 2,476 697 28 264 11 646 26<br />
North Carolina ............ 1,181 370 31 121 10 333 28<br />
North Dakota ............. 74 28 38 *7 *10 25 34<br />
Ohio .................... 1,531 597 39 254 17 533 35<br />
Oklahoma ................ 466 201 43 65 14 178 38<br />
Oregon .................. 477 188 39 74 15 155 33<br />
Pennsylvania.............. 1,567 674 43 310 20 630 40<br />
Rhode Isl<strong>and</strong> ............. 136 52 39 19 14 46 34<br />
South Carolina ............ 564 179 32 90 16 165 29<br />
South Dakota ............. 101 56 56 22 22 47 46<br />
Tennessee ................ 764 275 36 146 19 255 33<br />
Texas.................... 3,438 1,121 33 558 16 977 28<br />
Utah .................... 393 157 40 84 21 137 35<br />
Vermont ................. 74 41 56 *10 *14 40 54<br />
Virginia.................. 1,000 367 37 111 11 338 34<br />
Washington............... 833 335 40 158 19 284 34<br />
West Virginia ............. 211 83 39 *33 *16 77 36<br />
Wisconsin ................ 716 242 34 *61 *9 239 33<br />
Wyoming ................ 62 36 58 22 36 31 50<br />
* Estimate based on a sample size <strong>of</strong> 10–29.<br />
Note: Detail does not add to total because <strong>of</strong> multiple responses. U.S. totals include responses from participants residing in the District <strong>of</strong> Columbia, as described in the<br />
statistical accuracy appendix. Data reported on this table are from screening interviews in which one adult household member responded for all household members<br />
6 to 15 years old. The screening interview required the respondent to recall 12 months worth <strong>of</strong> activity. Includes persons who participated only in other countries.<br />
132 <strong>2006</strong> <strong>National</strong> <strong>Survey</strong> <strong>of</strong> <strong>Fishing</strong>, <strong>Hunting</strong>, <strong>and</strong> <strong>Wildlife</strong>-<strong>Associated</strong> Recreation U.S. Fish & <strong>Wildlife</strong> Service
Table B-12. Participation by 6-to-15-Year-Olds in 1980, 1985, 1990, 1995, 2000, <strong>and</strong> 2005<br />
(Numbers in thous<strong>and</strong>s)<br />
1980 1985 1990<br />
Participant<br />
Number <strong>of</strong><br />
participants<br />
Percent<br />
change<br />
from<br />
previous<br />
survey<br />
Percent <strong>of</strong><br />
6-to-15-<br />
year-old<br />
population<br />
Number <strong>of</strong><br />
participants<br />
Percent<br />
change<br />
from<br />
previous<br />
survey<br />
Percent <strong>of</strong><br />
6-to-15-<br />
year-old<br />
population<br />
Number <strong>of</strong><br />
participants<br />
Percent<br />
change<br />
from<br />
previous<br />
survey<br />
Percent <strong>of</strong><br />
6-to-15-<br />
year-old<br />
population<br />
Total sportspersons ......... 12,141 (NA) 34 12,558 3 36 14,011 12 39<br />
Anglers .................. 11,787 (NA) 33 12,243 4 35 13,790 13 39<br />
Hunters .................. 1,962 (NA) 6 1,799 –8 5 1,730 –4 5<br />
Total wildlife watchers....... (NA) (NA) (NA) 17,789 (NA) 51 17,136 –4 48<br />
Around the home .......... (NA) (NA) (NA) 16,151 (NA) 46 15,406 –5 43<br />
Away from home .......... (NA) (NA) (NA) 6,615 (NA) 19 7,311 11 21<br />
1995 2000 2005<br />
Number <strong>of</strong><br />
participants<br />
Percent<br />
change<br />
from<br />
previous<br />
survey<br />
Percent <strong>of</strong><br />
6-to-15-<br />
year-old<br />
population<br />
Number <strong>of</strong><br />
participants<br />
Percent<br />
change<br />
from<br />
previous<br />
survey<br />
Percent <strong>of</strong><br />
6-to-15-<br />
year-old<br />
population<br />
Number <strong>of</strong><br />
participants<br />
Percent<br />
change<br />
from<br />
previous<br />
survey<br />
Percent <strong>of</strong><br />
6-to-15-<br />
year-old<br />
population<br />
Total sportspersons ......... 15,019 7 39 13,369 –11 33 12,318 –8 30<br />
Anglers .................. 14,808 7 38 13,145 –11 32 12,110 –8 30<br />
Hunters .................. 1,720 –1 4 1,741 1 4 1,773 2 4<br />
Total wildlife watchers....... 17,449 2 45 15,066 –14 37 13,587 –10 34<br />
Around the home .......... 15,425 (Z) 40 13,542 –12 33 12,055 –11 30<br />
Away from home .......... 8,314 14 21 6,091 –27 15 5,850 –4 14<br />
(NA) Not available.<br />
(Z) Less than 0.5 percent.<br />
U.S. Fish & <strong>Wildlife</strong> Service <strong>2006</strong> <strong>National</strong> <strong>Survey</strong> <strong>of</strong> <strong>Fishing</strong>, <strong>Hunting</strong>, <strong>and</strong> <strong>Wildlife</strong>-<strong>Associated</strong> Recreation 133
Appendix C
Appendix C.<br />
Signifi cant Methodological Changes From Previous<br />
<strong>Survey</strong>s <strong>and</strong> Regional Trends<br />
The <strong>2006</strong> <strong>National</strong> <strong>Survey</strong> <strong>of</strong> <strong>Fishing</strong>,<br />
<strong>Hunting</strong>, <strong>and</strong> <strong>Wildlife</strong>-<strong>Associated</strong><br />
Recreation (FHWAR) was designed<br />
to continue the data collection <strong>of</strong> the<br />
1955 to 2001 <strong>Survey</strong>s. While complete<br />
comparability between any two surveys<br />
cannot be achieved, this appendix<br />
compares major findings <strong>of</strong> all the<br />
surveys <strong>and</strong> presents trends for the<br />
major categories <strong>of</strong> wildlife-related<br />
recreation where feasible. Differences<br />
among the <strong>Survey</strong>s are discussed in the<br />
following two sections.<br />
The principal characteristics <strong>of</strong> the<br />
1955 to <strong>2006</strong> <strong>Survey</strong>s are summarized<br />
in Table C-1. The table shows the scope<br />
<strong>and</strong> design <strong>of</strong> all 11 surveys.<br />
This appendix provides trend information<br />
in two sections (1991 to <strong>2006</strong> <strong>and</strong><br />
1955 to 1985). A significant change<br />
was made in 1991 in the recall period<br />
used in the detailed phase <strong>of</strong> the<br />
FHWAR <strong>Survey</strong>s. The recall period in<br />
1991 was shortened from 12 months<br />
(used in previous surveys) to 4 months<br />
in order to improve the accuracy <strong>of</strong><br />
the data collected. As a result <strong>of</strong> that<br />
change, the surveys conducted since<br />
1991 cannot be compared with those<br />
conducted earlier.<br />
The 1955 to 1985 <strong>Survey</strong>s required<br />
respondents to recall their recreation<br />
activities for the survey year at the<br />
beginning <strong>of</strong> the following year. The<br />
1991 to <strong>2006</strong> <strong>Survey</strong>s went back to<br />
the respondents three times during the<br />
survey year to get their activity information.<br />
The change in the recall period<br />
was due to a study 1 <strong>of</strong> the effect <strong>of</strong><br />
the respondent recall length on survey<br />
estimates. The study found significant<br />
differences in FHWAR survey<br />
results using annual recall periods<br />
1<br />
Investigation <strong>of</strong> Possible Recall/Reference<br />
Period Bias in <strong>National</strong> <strong>Survey</strong>s <strong>of</strong> <strong>Fishing</strong>,<br />
<strong>Hunting</strong>, <strong>and</strong> <strong>Wildlife</strong>-<strong>Associated</strong> Recreation,<br />
December 1989, Westat, Inc.<br />
versus shorter recall periods. Longer<br />
recall periods lead to higher estimates.<br />
Even when everything else was held<br />
constant, such as questionnaire content<br />
<strong>and</strong> sample design, increasing the<br />
respondent’s recall period resulted in<br />
significantly higher estimates for the<br />
same phenomenon.<br />
The recall study also found that the<br />
extent <strong>of</strong> recall bias varied for different<br />
types <strong>of</strong> fishing <strong>and</strong> hunting participation<br />
<strong>and</strong> expenditures. For example,<br />
annual recall respondents gave an<br />
estimate <strong>of</strong> average annual days <strong>of</strong> saltwater<br />
fishing that was 46 percent higher<br />
than the trimester recall estimate, while<br />
the annual recall estimate <strong>of</strong> average<br />
annual saltwater fishing trips was 30<br />
percent higher than the trimester recall<br />
estimate. This means there is no single<br />
correction factor for all survey estimates<br />
when calculating trends from<br />
surveys using different recall periods.<br />
Reliable trends analysis needs to use<br />
data compiled from surveys in which<br />
the important elements, such as the<br />
sample design <strong>and</strong> recall period, are not<br />
significantly different.<br />
1991 to <strong>2006</strong> Signifi cant<br />
Methodological Differences<br />
The most significant design differences<br />
in the four surveys are as follows:<br />
1. The 1991 <strong>Survey</strong> data were<br />
collected by interviewers filling<br />
out paper questionnaires. The data<br />
entries were keyed in a separate<br />
operation after the interview. The<br />
1996, 2001, <strong>and</strong> <strong>2006</strong> survey<br />
data were collected by the use <strong>of</strong><br />
computer-assisted interviews. The<br />
questionnaires were programmed<br />
into computers, <strong>and</strong> the interviewer<br />
keyed in the responses at the time<br />
<strong>of</strong> the interview.<br />
2. The 1991 <strong>Survey</strong> screening phase<br />
was conducted in January <strong>and</strong><br />
February 1991, when the sample<br />
households were contacted <strong>and</strong> a<br />
household respondent was interviewed<br />
on behalf <strong>of</strong> the entire<br />
household. The screening interviews<br />
for the 1996, 2001, <strong>and</strong><br />
<strong>2006</strong> <strong>Survey</strong>s were conducted<br />
April through June <strong>of</strong> their survey<br />
years in conjunction with the first<br />
wave <strong>of</strong> the detailed interviews.<br />
The screening interviews for all<br />
four <strong>Survey</strong>s consisted primarily<br />
<strong>of</strong> demographic questions <strong>and</strong><br />
wildlife-related recreation questions<br />
concerning activity in the<br />
previous year (1990, 1995, etc.)<br />
<strong>and</strong> int entions for recreating in the<br />
survey year.<br />
In the 1991 <strong>Survey</strong>, an attempt was<br />
made to contact every sample person<br />
in all three detailed interview waves. In<br />
1996, 2001, <strong>and</strong> <strong>2006</strong>, respondents who<br />
were interviewed in the first detailed<br />
interview wave were not contacted<br />
again until the third wave. Also, all<br />
interviews in the second wave were<br />
conducted by telephone. In-person<br />
interviews were only conducted in the<br />
first <strong>and</strong> third waves.<br />
Section I. Important Instrument<br />
Changes in the 1996 <strong>Survey</strong><br />
1. The 1991 <strong>Survey</strong> collected information<br />
on all wildlife-related<br />
recreation purchases made by<br />
participants without reference to<br />
where the purchase was made. The<br />
1996 <strong>Survey</strong> asked in which state<br />
the purchase was made.<br />
2. In 1991, respondents were asked<br />
what kind <strong>of</strong> fishing they did, i.e.,<br />
Great Lakes, other freshwater, or<br />
saltwater, <strong>and</strong> then were asked in<br />
what states they fished. In 1996,<br />
respondents were asked in which<br />
136 <strong>2006</strong> <strong>National</strong> <strong>Survey</strong> <strong>of</strong> <strong>Fishing</strong>, <strong>Hunting</strong>, <strong>and</strong> <strong>Wildlife</strong>-<strong>Associated</strong> Recreation U.S. Fish & <strong>Wildlife</strong> Service
Table C-1. Major Characteristics <strong>of</strong> <strong>Survey</strong>s: 1955 to <strong>2006</strong><br />
Characteristic 1955 1960 1965 1970 1975 1980 1985 1991 1996 2001 <strong>2006</strong><br />
<strong>Survey</strong> design:<br />
Screening interview<br />
mode <strong>and</strong> population<br />
<strong>of</strong> interest ............<br />
Combined<br />
with<br />
detailed<br />
phase<br />
Personal<br />
interview,<br />
12 years<br />
old <strong>and</strong><br />
older<br />
Personal<br />
interview,<br />
9 years<br />
old <strong>and</strong><br />
older<br />
Mail<br />
questionnaire,<br />
9 years<br />
old <strong>and</strong><br />
older<br />
Telephone<br />
interview,<br />
6 years<br />
old <strong>and</strong><br />
older<br />
Telephone/<br />
personal<br />
interview,<br />
6 years<br />
old <strong>and</strong><br />
older<br />
Telephone/<br />
personal<br />
interview,<br />
6 years<br />
old <strong>and</strong><br />
older<br />
Telephone/<br />
personal<br />
interview,<br />
6 years<br />
old <strong>and</strong><br />
older<br />
Telephone/<br />
personal<br />
interview,<br />
6 years<br />
old <strong>and</strong><br />
older<br />
Telephone/<br />
personal<br />
interview,<br />
6 years<br />
old <strong>and</strong><br />
older<br />
Telephone/<br />
personal<br />
interview,<br />
6 years<br />
old <strong>and</strong><br />
older<br />
Detailed interview<br />
mode <strong>and</strong> population<br />
<strong>of</strong> interest ............<br />
Personal<br />
interview,<br />
12 years<br />
old <strong>and</strong><br />
older<br />
Personal<br />
interview,<br />
12 years<br />
old <strong>and</strong><br />
older.<br />
Substantial<br />
participants<br />
1<br />
Personal<br />
interview,<br />
12 years<br />
old <strong>and</strong><br />
older.<br />
Substantial<br />
participants<br />
1<br />
Personal<br />
interview,<br />
12 years<br />
old <strong>and</strong><br />
older.<br />
Substantial<br />
participants<br />
2<br />
Mail<br />
questionnaire,<br />
9 years<br />
old <strong>and</strong><br />
older<br />
Personal<br />
interview,<br />
16 years<br />
old <strong>and</strong><br />
older<br />
Personal<br />
interview,<br />
16 years<br />
old <strong>and</strong><br />
older<br />
Telephone/<br />
personal<br />
interview,<br />
16 years<br />
old <strong>and</strong><br />
older.<br />
Respondent’s recall period. . . 1 year 1 year 1 year 1 year 1 year 1 year 1 year 4 months<br />
Telephone/<br />
personal<br />
interview,<br />
16 years<br />
old <strong>and</strong><br />
older<br />
4–8<br />
months<br />
Telephone/<br />
personal<br />
interview,<br />
16 years<br />
old <strong>and</strong><br />
older<br />
4–8<br />
months<br />
Telephone/<br />
personal<br />
interview,<br />
16 years<br />
old <strong>and</strong><br />
older<br />
4–8<br />
months<br />
Sample sizes:<br />
Screening phase<br />
(households) .......... 20,000 18,000 16,000 24,000 106,294 116,025 102,694 102,804 44,000 52,508 66,688<br />
Detailed phase<br />
(individuals):<br />
<strong>Fishing</strong> <strong>and</strong> hunting .... 9,328 10,300 6,400 8,700 20,211 30,291 28,011 23,179 13,222 25,070 21,938<br />
<strong>Wildlife</strong> watching 3 ..... (X) (X) (X) (X) (X) 5,997 26,671 22,723 9,802 15,303 11,279<br />
Response rates:<br />
Screening phase ........ (NA) (NA) (NA) (NA) 95 percent 95 percent 93 percent 95 percent 71 percent 75 percent 90 percent<br />
Detailed phase:<br />
<strong>Fishing</strong> <strong>and</strong> hunting .... (NA) 93 percent (NA) (NA) 37 percent 90 percent 92 percent 95 percent 80 percent 88 percent 77 percent<br />
<strong>Wildlife</strong> watching 3 ..... (X) (X) (X) (X) (X) 95percent 94 percent 95 percent 82 percent 90 percent 78 percent<br />
Level <strong>of</strong> reporting. ........ <strong>National</strong> <strong>National</strong> <strong>National</strong> <strong>National</strong> State <strong>and</strong><br />
<strong>National</strong><br />
State <strong>and</strong><br />
<strong>National</strong><br />
State <strong>and</strong><br />
<strong>National</strong><br />
State <strong>and</strong><br />
<strong>National</strong><br />
State <strong>and</strong><br />
<strong>National</strong><br />
State <strong>and</strong><br />
<strong>National</strong><br />
State <strong>and</strong><br />
<strong>National</strong><br />
Data collection agent ......<br />
Private<br />
contractor<br />
U.S.<br />
Census<br />
Bureau<br />
U.S.<br />
Census<br />
Bureau<br />
U.S.<br />
Census<br />
Bureau<br />
Private<br />
contractor<br />
U.S.<br />
Census<br />
Bureau<br />
U.S.<br />
Census<br />
Bureau<br />
U.S.<br />
Census<br />
Bureau<br />
U.S.<br />
Census<br />
Bureau<br />
U.S.<br />
Census<br />
Bureau<br />
U.S.<br />
Census<br />
Bureau<br />
(NA) Not available. (X) Not applicable; wildlife-watching (nonconsumptive) interviews were not conducted prior to 1980.<br />
1 Spent $5.00 or more or participated 3 days or more during the year.<br />
2 Spent $7.50 or more or participated 3 days or more during the year.<br />
3 Termed ‘‘nonconsumptive’’ in 1980, 1985, <strong>and</strong> 1991 <strong>Survey</strong>s.<br />
U.S. Fish & <strong>Wildlife</strong> Service <strong>2006</strong> <strong>National</strong> <strong>Survey</strong> <strong>of</strong> <strong>Fishing</strong>, <strong>Hunting</strong>, <strong>and</strong> <strong>Wildlife</strong>-<strong>Associated</strong> Recreation 137
states they fished <strong>and</strong> then were<br />
asked what kind <strong>of</strong> fishing they did.<br />
This method had the advantage <strong>of</strong><br />
not asking about, for example, saltwater<br />
fishing when they only fished<br />
in a noncoastal state.<br />
3. In 1991, respondents were asked<br />
how many days they “actually”<br />
hunted or fished for a particular<br />
type <strong>of</strong> game or fish <strong>and</strong> then how<br />
many days they “chiefly” hunted<br />
or fished for the same type <strong>of</strong> game<br />
or fish rather than another type <strong>of</strong><br />
game or fish. To get total days <strong>of</strong><br />
hunting or fishing for a particular<br />
type <strong>of</strong> game or fish, the “actually”<br />
day response was used, while to<br />
get the sum <strong>of</strong> all days <strong>of</strong> hunting<br />
or fishing, the “chiefly” days were<br />
summed. In 1996, respondents<br />
were asked their total days <strong>of</strong><br />
hunting or fishing in the country<br />
<strong>and</strong> in each state, then how many<br />
days they hunted or fished for a<br />
particular type <strong>of</strong> game or fish.<br />
4. Trip-related <strong>and</strong> equipment expenditure<br />
categories were not the same<br />
for all <strong>Survey</strong>s. “Guide fee” <strong>and</strong><br />
“Pack trip or package fee” were<br />
two separate trip-related expenditure<br />
items in 1991, while they<br />
were combined into one category<br />
in the 1996 <strong>Survey</strong>. “Boating costs”<br />
was added to the 1996 hunting<br />
<strong>and</strong> wildlife-watching trip-related<br />
expenditure sections. “Heating<br />
<strong>and</strong> cooking fuel” was added to<br />
all <strong>of</strong> the trip-related expenditure<br />
sections. “Spearfishing equipment”<br />
was moved from a separate category<br />
to the “other” list. “Rods” <strong>and</strong><br />
“Reels” were two separate categories<br />
in 1991 but were combined<br />
in 1996. “Lines, hooks, sinkers,<br />
etc.” was one category in 1991<br />
but split into “Lines” <strong>and</strong> “Hooks,<br />
sinkers, etc.” in 1996. “Food used<br />
to feed other wildlife” was added<br />
to the wildlife-watching equipment<br />
section; “Boats” <strong>and</strong> “Cabins” were<br />
added to the wildlife-watching<br />
special equipment section; <strong>and</strong><br />
“L<strong>and</strong> leasing <strong>and</strong> ownership” was<br />
added to the wildlife-watching<br />
expenditures section.<br />
5. Questions asking sportspersons if<br />
they participated as much as they<br />
wanted were added in 1996. If the<br />
sportspersons said no, they were<br />
asked why not.<br />
6. The 1991 <strong>Survey</strong> included questions<br />
about participation in organized<br />
fishing competitions; anglers<br />
using bows <strong>and</strong> arrows, nets or<br />
seines, or spearfishing; hunters<br />
using pistols or h<strong>and</strong>guns <strong>and</strong> target<br />
shooting in preparation for hunting.<br />
These questions were not asked in<br />
1996.<br />
7. The 1996 <strong>Survey</strong> included questions<br />
about catch <strong>and</strong> release<br />
fishing <strong>and</strong> persons with disabilities<br />
participating in wildlife-related<br />
recreation. These questions were<br />
not part <strong>of</strong> the 1991 <strong>Survey</strong>.<br />
8. The 1991 <strong>Survey</strong> included questions<br />
about average distance<br />
traveled to recreation sites. These<br />
questions were not included in the<br />
1996 <strong>Survey</strong>.<br />
9. The 1996 <strong>Survey</strong> included questions<br />
about the last trip the respondent<br />
took. Included were questions<br />
about the type <strong>of</strong> trip, where the<br />
activity took place, <strong>and</strong> the distance<br />
<strong>and</strong> direction to the site visited.<br />
These questions were not asked in<br />
1991.<br />
10. The 1991 <strong>Survey</strong> collected data<br />
on hunting, fishing, <strong>and</strong> wildlife<br />
watching by U.S. residents in<br />
Canada. The 1996 <strong>Survey</strong> collected<br />
data on fishing <strong>and</strong> wildlifewatching<br />
by U.S. residents in<br />
Canada.<br />
Section II. Important Instrument<br />
Changes in the 2001 <strong>Survey</strong><br />
1. The 1991 <strong>and</strong> 1996 single-race<br />
category “Asian or Pacific Isl<strong>and</strong>er”<br />
was changed to two categories<br />
“Asian” <strong>and</strong> “Native Hawaiian or<br />
Other Pacific Isl<strong>and</strong>er.” In 1991 <strong>and</strong><br />
1996, the respondent was required<br />
to pick only one category, while in<br />
2001 the respondent could pick any<br />
combination <strong>of</strong> categories. The next<br />
question stipulated that the respondent<br />
could only be identified with<br />
one category <strong>and</strong> then asked what<br />
that category was.<br />
2. The 1991 <strong>and</strong> 1996 l<strong>and</strong> leasing<br />
<strong>and</strong> ownership sections asked the<br />
respondent to combine the two<br />
types <strong>of</strong> l<strong>and</strong> use into one <strong>and</strong> give<br />
total acreage <strong>and</strong> expenditures. In<br />
2001, the two types <strong>of</strong> l<strong>and</strong> use<br />
were explored separately.<br />
3. The 1991 <strong>and</strong> 1996 wildlifewatching<br />
sections included questions<br />
on birdwatching for residential<br />
users only. The 2001 <strong>Survey</strong><br />
added a question on birdwatching<br />
for nonresidential users. Also, questions<br />
on the use <strong>of</strong> birding life lists<br />
<strong>and</strong> how many species the respondent<br />
can identify were added.<br />
4. “Recreational vehicles” was added<br />
to the sportspersons <strong>and</strong> wildlifewatchers<br />
special equipment section.<br />
“House trailer” was added to the<br />
sportspersons special equipment<br />
section.<br />
5. Total personal income was asked<br />
in the detailed phase <strong>of</strong> the 1996<br />
<strong>Survey</strong>. This was changed to total<br />
household income in the 2001<br />
<strong>Survey</strong>.<br />
6. A question was added to the triprelated<br />
expenditures section to<br />
ascertain how much <strong>of</strong> the total<br />
was spent in the respondent’s state<br />
<strong>of</strong> residence when the respondent<br />
participated in hunting, fishing, or<br />
wildlife watching out <strong>of</strong> state.<br />
7. Boating questions were added to<br />
the fishing section. The respondent<br />
was asked about the extent <strong>of</strong> boat<br />
usage for the three types <strong>of</strong> fishing.<br />
8. The 1996 <strong>Survey</strong> included questions<br />
about the months residential<br />
wildlife watchers fed birds. These<br />
questions were not repeated in the<br />
2001 <strong>Survey</strong>.<br />
9. The contingent valuation sections <strong>of</strong><br />
the three types <strong>of</strong> wildlife-related<br />
recreation were altered, using an<br />
open-ended question format instead<br />
<strong>of</strong> the dichotomous choice format<br />
used in 1996.<br />
Section III. Important Instrument<br />
Changes in the <strong>2006</strong> <strong>Survey</strong><br />
1. A series <strong>of</strong> boating questions was<br />
added. The new questions dealt<br />
with anglers using motorboats <strong>and</strong>/<br />
or non-motorboats, length <strong>of</strong> boat<br />
138 <strong>2006</strong> <strong>National</strong> <strong>Survey</strong> <strong>of</strong> <strong>Fishing</strong>, <strong>Hunting</strong>, <strong>and</strong> <strong>Wildlife</strong>-<strong>Associated</strong> Recreation U.S. Fish & <strong>Wildlife</strong> Service
Table C-2. Anglers <strong>and</strong> Hunters by Census Division: 1991, 1996, 2001, <strong>and</strong> <strong>2006</strong><br />
(U.S. population 16 years old <strong>and</strong> older. Numbers in thous<strong>and</strong>s)<br />
Area <strong>and</strong> sportsperson<br />
1991 1996 2001 <strong>2006</strong><br />
Number Percent Number Percent Number Percent Number Percent<br />
UNITED STATES<br />
Total population .................... 189,964 100 201,472 100 212,298 100 229,245 100<br />
Sportspersons ...................... 39,979 21 39,694 20 37,805 18 33,916 15<br />
Anglers ......................... 35,578 19 35,246 17 34,067 16 29,952 13<br />
Hunters ......................... 14,063 7 13,975 7 13,034 6 12,510 5<br />
New Engl<strong>and</strong><br />
Total population .................... 10,180 100 10,306 100 10,575 100 11,233 100<br />
Sportspersons ...................... 1,658 16 1,673 16 1,504 14 1,353 12<br />
Anglers ......................... 1,545 15 1,520 15 1,402 13 1,246 11<br />
Hunters ......................... 444 4 465 5 386 4 374 3<br />
Middle Atlantic<br />
Total population .................... 29,216 100 29,371 100 29,806 100 31,518 100<br />
Sportspersons ...................... 4,508 15 4,192 14 3,810 13 3,214 10<br />
Anglers ......................... 3,871 13 3,627 12 3,250 11 2,550 8<br />
Hunters ......................... 1,746 6 1,453 5 1,633 5 1,520 5<br />
East North Central<br />
Total population .................... 32,188 100 33,121 100 34,082 100 35,609 100<br />
Sportspersons ...................... 7,202 22 6,912 21 6,400 19 5,975 17<br />
Anglers ......................... 6,264 19 6,006 18 5,655 17 5,190 15<br />
Hunters ......................... 2,789 9 2,712 8 2,421 7 2,376 7<br />
West North Central<br />
Total population .................... 13,504 100 13,875 100 14,430 100 15,458 100<br />
Sportspersons ...................... 4,143 31 3,977 29 4,239 29 3,836 25<br />
Anglers ......................... 3,647 27 3,416 25 3,836 27 3,284 21<br />
Hunters ......................... 1,709 13 1,917 14 1,710 12 1,779 12<br />
South Atlantic<br />
Total population .................... 33,682 100 36,776 100 39,286 100 43,965 100<br />
Sportspersons ...................... 6,996 21 7,282 20 6,957 18 6,633 15<br />
Anglers ......................... 6,441 19 6,636 18 6,451 16 6,116 14<br />
Hunters ......................... 2,083 6 2,050 6 1,875 5 1,884 4<br />
East South Central<br />
Total population .................... 11,667 100 12,459 100 12,976 100 13,722 100<br />
Sportspersons ...................... 2,984 26 2,907 23 2,865 22 2,689 20<br />
Anglers ......................... 2,635 23 2,514 20 2,543 20 2,436 18<br />
Hunters ......................... 1,279 11 1,301 10 1,164 9 1,101 8<br />
West South Central<br />
Total population .................... 19,926 100 21,811 100 23,337 100 25,407 100<br />
Sportspersons ...................... 5,125 26 5,093 23 4,924 21 4,499 18<br />
Anglers ......................... 4,592 23 4,616 21 4,375 19 3,952 16<br />
Hunters ......................... 1,843 9 1,812 8 1,988 9 1,810 7<br />
Mountain<br />
Total population .................... 10,092 100 11,966 100 13,308 100 15,651 100<br />
Sportspersons ...................... 2,488 25 2,761 23 2,757 21 2,372 15<br />
Anglers ......................... 2,079 21 2,411 20 2,443 18 2,084 13<br />
Hunters ......................... 1,069 11 1,061 9 1,020 8 868 6<br />
Pacific<br />
Total population .................... 29,508 100 31,787 100 34,498 100 36,681 100<br />
Sportspersons ...................... 4,875 17 4,897 15 4,349 13 3,345 9<br />
Anglers ......................... 4,505 15 4,501 14 4,111 12 3,094 8<br />
Hunters ......................... 1,101 4 1,203 4 837 2 798 2<br />
U.S. Fish & <strong>Wildlife</strong> Service <strong>2006</strong> <strong>National</strong> <strong>Survey</strong> <strong>of</strong> <strong>Fishing</strong>, <strong>Hunting</strong>, <strong>and</strong> <strong>Wildlife</strong>-<strong>Associated</strong> Recreation 139
Table C-3. <strong>Wildlife</strong>-Watching Participants by Census Division: 1991, 1996, 2001, <strong>and</strong> <strong>2006</strong><br />
(Numbers in thous<strong>and</strong>s. Population 16 years old <strong>and</strong> older)<br />
Area <strong>and</strong> wildlife watcher<br />
1991 1996 2001 <strong>2006</strong><br />
Number Percent Number Percent Number Percent Number Percent<br />
UNITED STATES<br />
Total population .................... 189,964 100 201,472 100 212,298 100 229,245 100<br />
Total wildlife watchers ............... 76,111 40 62,868 31 66,105 31 71,132 31<br />
Away from home ................. 29,999 16 23,652 12 21,823 10 22,977 10<br />
Around the home ................. 73,904 39 60,751 30 62,928 30 67,756 30<br />
New Engl<strong>and</strong><br />
Total population .................... 10,180 100 10,306 100 10,575 100 11,233 100<br />
Total wildlife watchers ............... 4,598 45 3,710 36 3,875 37 4,489 40<br />
Away from home ................. 1,856 18 1,443 14 1,155 11 1,340 12<br />
Around the home ................. 4,544 45 3,586 35 3,765 36 4,310 38<br />
Middle Atlantic<br />
Total population .................... 29,216 100 29,371 100 29,806 100 31,518 100<br />
Total wildlife watchers ............... 10,556 36 8,185 28 8,740 29 8,723 28<br />
Away from home ................. 4,166 14 2,960 10 2,849 10 2,729 9<br />
Around the home ................. 10,282 35 8,023 27 8,452 28 8,451 27<br />
East North Central<br />
Total population .................... 32,188 100 33,121 100 34,082 100 35,609 100<br />
Total wildlife watchers ............... 14,511 45 11,731 35 11,631 34 12,215 34<br />
Away from home ................. 5,572 17 4,501 14 3,571 10 3,792 11<br />
Around the home ................. 14,175 44 11,297 34 11,196 33 11,845 33<br />
West North Central<br />
Total population .................... 13,504 100 13,875 100 14,430 100 15,458 100<br />
Total wildlife watchers ............... 6,924 51 5,089 37 6,206 43 6,741 44<br />
Away from home ................. 2,654 20 1,927 14 2,059 14 2,163 14<br />
Around the home ................. 6,722 50 4,900 35 5,938 41 6,447 42<br />
South Atlantic<br />
Total population .................... 33,682 100 36,776 100 39,286 100 43,965 100<br />
Total wildlife watchers ............... 13,047 39 11,252 31 11,395 29 12,862 29<br />
Away from home ................. 4,450 13 3,992 11 3,469 9 3,208 7<br />
Around the home ................. 12,813 38 10,964 30 10,911 28 12,432 28<br />
East South Central<br />
Total population .................... 11,667 100 12,459 100 12,976 100 13,722 100<br />
Total wildlife watchers ............... 4,864 42 3,904 31 4,514 35 4,931 36<br />
Away from home ................. 1,592 14 1,118 9 1,086 8 1,758 13<br />
Around the home ................. 4,765 41 3,795 30 4,390 34 4,683 34<br />
West South Central<br />
Total population .................... 19,926 100 21,811 100 23,337 100 25,407 100<br />
Total wildlife watchers ............... 7,035 35 5,933 27 5,747 25 6,764 27<br />
Away from home ................. 2,459 12 2,096 10 1,822 8 2,127 8<br />
Around the home ................. 6,817 34 5,773 26 5,490 24 6,319 25<br />
Mountain<br />
Total population .................... 10,092 100 11,966 100 13,308 100 15,651 100<br />
Total wildlife watchers ............... 4,437 44 4,099 34 4,619 35 4,968 32<br />
Away from home ................. 2,215 22 1,967 16 2,019 15 2,004 13<br />
Around the home ................. 4,145 41 3,855 32 4,282 32 4,605 29<br />
Pacific<br />
Total population .................... 29,508 100 31,787 100 34,498 100 36,681 100<br />
Total wildlife watchers ............... 10,139 34 8,966 28 9,377 27 9,439 26<br />
Away from home ................. 5,035 17 3,648 11 3,793 11 3,856 11<br />
Around the home ................. 9,641 33 8,558 27 8,504 25 8,664 24<br />
140 <strong>2006</strong> <strong>National</strong> <strong>Survey</strong> <strong>of</strong> <strong>Fishing</strong>, <strong>Hunting</strong>, <strong>and</strong> <strong>Wildlife</strong>-<strong>Associated</strong> Recreation U.S. Fish & <strong>Wildlife</strong> Service
used most <strong>of</strong>ten, distance to boat<br />
launch used most <strong>of</strong>ten, needed<br />
improvements to facilities at the<br />
launch, whether or not the respondent<br />
completed a boating safety<br />
course, who the boater fished with<br />
most <strong>of</strong>ten, <strong>and</strong> the source <strong>and</strong> type<br />
<strong>of</strong> information the boater used for<br />
his or her fishing.<br />
2. Questions regarding catch <strong>and</strong><br />
release fishing were added.<br />
Whether or not the respondent<br />
caught <strong>and</strong> released fish <strong>and</strong>, if so,<br />
the percent <strong>of</strong> fish released.<br />
3. The proportion <strong>of</strong> hunting<br />
done with a rifle or shotgun, as<br />
contrasted with muzzleloader or<br />
archery equipment, was asked.<br />
4. In the contingent valuation section,<br />
where the value <strong>of</strong> wildlife-related<br />
recreation was determined, two<br />
quality-variable questions were<br />
added: the average length <strong>of</strong> certain<br />
fish caught <strong>and</strong> whether a deer,<br />
elk, or moose was killed. Plus, the<br />
economic evaluation bid questions<br />
were rephrased, from “What is<br />
the most your [species] hunting in<br />
[State name] could have cost you<br />
per trip last year before you would<br />
NOT have gone [species] hunting<br />
at all in 2001, not even one trip,<br />
because it would have been too<br />
expensive,” for the hunters, for<br />
example, to “What is the cost that<br />
would have prevented you from<br />
taking even one such trip in <strong>2006</strong><br />
In other words, if the trip cost was<br />
below this amount, you would have<br />
gone [species] hunting in [State<br />
name], but if the trip cost was<br />
above this amount, you would not<br />
have gone.”<br />
5. Questions concerning hunting,<br />
fishing, or wildlife watching in<br />
other countries was taken out <strong>of</strong> the<br />
<strong>Survey</strong>.<br />
6. Questions about the reasons for<br />
not going hunting or fishing, or not<br />
going as much as expected, were<br />
deleted.<br />
7. Disability <strong>of</strong> participants questions<br />
were taken out.<br />
8. Determination <strong>of</strong> the types <strong>of</strong> sites<br />
for wildlife watching was discontinued.<br />
9. The birding questions regarding<br />
the use <strong>of</strong> birding life lists <strong>and</strong> the<br />
ability to identify birds based on<br />
their sight or sounds were deleted.<br />
10. Public transportation costs were<br />
divided into two sections, “public<br />
transportation by airplane” <strong>and</strong><br />
“other public transportation,<br />
including trains, buses, <strong>and</strong> car<br />
rentals, etc.”<br />
1955 to 1985 Signifi cant<br />
Methodological Differences<br />
1955 to 1970 <strong>Survey</strong>s<br />
The 1955 to 1970 <strong>Survey</strong>s included<br />
only substantial participants. Substantial<br />
participants were defined as people<br />
who participated at least three days<br />
<strong>and</strong>/or spent at least $5 (the 1955 to<br />
1965 <strong>Survey</strong>s) or $7.50 (the 1970<br />
<strong>Survey</strong>) during the survey year. Under<br />
most circumstances, the <strong>Survey</strong>s may<br />
be compared for totals, but the effects<br />
<strong>of</strong> differences should be considered<br />
when comparing the details <strong>of</strong> the<br />
<strong>Survey</strong>s.<br />
The 1960, 1965, <strong>and</strong> 1970 <strong>Survey</strong>s<br />
differed from the 1955 <strong>National</strong> <strong>Survey</strong><br />
in classification <strong>of</strong> expenditures as<br />
outlined below:<br />
1. Alaska <strong>and</strong> Hawaii were not<br />
included in the 1955 <strong>Survey</strong>.<br />
2. Expenditure categories were more<br />
detailed in 1970 than in earlier<br />
<strong>Survey</strong>s.<br />
3. The 1960 to 1970 classification<br />
<strong>of</strong> some expenditures differs from<br />
the 1955 <strong>Survey</strong> in the following<br />
respects:<br />
a. “Boats <strong>and</strong> boat motors” shown<br />
under “auxiliary equipment”<br />
were included in “equipment,<br />
other” in 1955.<br />
b. “Entrance <strong>and</strong> other privilege<br />
fees” shown separately were<br />
included in “trip expenditures,<br />
other” in 1955.<br />
c. “Snacks <strong>and</strong> refreshments” not<br />
included with “food” expenditures<br />
in the 1960 to 1970<br />
reports were under “trip expenditures,<br />
other” in 1955.<br />
d. Expenditures on equipment,<br />
magazines, club dues, licenses,<br />
<strong>and</strong> similar items were classified<br />
by the one sport activity<br />
for which expenditures were<br />
chiefly made. In 1955, these<br />
expenditures were evenly<br />
divided among all the activities<br />
in which the sportsperson took<br />
part.<br />
e. Compared with 1955, the 1960<br />
to 1970 <strong>Survey</strong>s reported fewer<br />
expenditures within the “other”<br />
category because selected items<br />
were transferred to more appropriate<br />
categories.<br />
f. Expenditures on alcoholic<br />
beverages were reported separately<br />
in the 1970 <strong>Survey</strong>.<br />
g. In 1970, definition <strong>of</strong> a<br />
“substantial participant” was<br />
changed from one who spent<br />
at least $5 during the year or<br />
spent three days fishing or<br />
hunting to one who spent $7.50<br />
for the year or spent three days<br />
fishing or hunting.<br />
4. The number <strong>of</strong> waterfowl hunters<br />
in the 1970 <strong>Survey</strong> is not comparable<br />
with those reported in the<br />
1960 <strong>and</strong> 1965 <strong>Survey</strong>s. In 1960<br />
<strong>and</strong> 1965, respondent sportspersons<br />
were not included in the waterfowl<br />
hunter total if they reported that<br />
they went waterfowl hunting but<br />
did not take the trip chiefly to hunt<br />
waterfowl. In 1970, all respondents<br />
who reported that they had hunted<br />
waterfowl during 1970, regardless<br />
<strong>of</strong> trip purpose, were included in<br />
the total. The number <strong>of</strong> hunters<br />
who did not take trips chiefly<br />
to hunt waterfowl in 1970 was<br />
1,054,000.<br />
1975 <strong>Survey</strong><br />
In contrast to previous surveys that<br />
covered substantial participants 12<br />
years old <strong>and</strong> older, the 1975 <strong>Survey</strong><br />
based all the estimates on responses<br />
U.S. Fish & <strong>Wildlife</strong> Service <strong>2006</strong> <strong>National</strong> <strong>Survey</strong> <strong>of</strong> <strong>Fishing</strong>, <strong>Hunting</strong>, <strong>and</strong> <strong>Wildlife</strong>-<strong>Associated</strong> Recreation 141
from individuals 9 years <strong>of</strong> age <strong>and</strong><br />
older <strong>and</strong> did not select respondents<br />
based upon substantial participation as<br />
defined above. As a result, individuals<br />
who participated fewer than three days<br />
or spent less than $7.50 on hunting or<br />
fishing were included in the estimates<br />
<strong>of</strong> participants, days <strong>of</strong> activity, <strong>and</strong><br />
expenditures.<br />
Categories <strong>of</strong> hunting <strong>and</strong> fishing<br />
expenditures differed from the<br />
previous four <strong>Survey</strong>s in that only<br />
major categories were reported. For<br />
example, hunting equipment expenditures<br />
were not further delineated by<br />
subcategory. Similarly, no detail was<br />
provided within the category <strong>of</strong> fishing<br />
equipment expenditures. Expenses for<br />
“other” items, such as daily entrance<br />
fees, magazines, club dues, <strong>and</strong> dogs,<br />
were categorized as “other” in the 1975<br />
report.<br />
In addition to the above differences, the<br />
1975 <strong>Survey</strong> gathered data on species<br />
sought for the favorite hunting <strong>and</strong><br />
fishing activity. This data replaced the<br />
“chiefly” category where hunting or<br />
fishing was the primary purpose <strong>of</strong> the<br />
trip or day <strong>of</strong> activity. Data omitted in<br />
the 1975 <strong>Survey</strong> that were included in<br />
previous <strong>Survey</strong>s include the respondents<br />
population density <strong>of</strong> residence,<br />
occupation, <strong>and</strong> level <strong>of</strong> education.<br />
1980 to 1985 <strong>Survey</strong>s<br />
The 1980 <strong>and</strong> 1985 <strong>Survey</strong>s were<br />
similar. Each measured participants,<br />
rather than substantial participants.<br />
Questions were incorporated into<br />
the 1980 <strong>and</strong> 1985 <strong>Survey</strong> questionnaires<br />
to facilitate the construction <strong>of</strong><br />
categories <strong>of</strong> data for comparisons with<br />
earlier <strong>Survey</strong>s. The use <strong>of</strong> “chiefly”<br />
to delimit primary purpose appeared in<br />
the 1970 <strong>and</strong> prior <strong>Survey</strong>s, <strong>and</strong> its use<br />
was continued in the 1980 <strong>and</strong> 1985<br />
<strong>Survey</strong>s. The expenditure categories<br />
in 1980 <strong>and</strong> 1985 are similar to the<br />
1970 categories with the addition <strong>of</strong><br />
fish finders, motor homes, <strong>and</strong> camper<br />
trucks as separate categories. The<br />
definition <strong>of</strong> fishing included the use <strong>of</strong><br />
nets or seines <strong>and</strong> spearfishing.<br />
As in the 1970 <strong>and</strong> 1975 <strong>Survey</strong>s, the<br />
1980 <strong>and</strong> 1985 <strong>Survey</strong>s used a twophase<br />
process to gather information<br />
from households <strong>and</strong> individuals. In<br />
the first phase, household respondents<br />
were asked to identify each participant<br />
6 years <strong>of</strong> age <strong>and</strong> older who resided<br />
in their household. In comparison,<br />
the 1975 <strong>and</strong> 1970 <strong>Survey</strong>s screened<br />
households for participants who<br />
were 9 years <strong>of</strong> age <strong>and</strong> older. In the<br />
second phase, the detailed interview<br />
phase, interviews were conducted in<br />
person for the 1985, 1980, <strong>and</strong> 1970<br />
<strong>Survey</strong>s <strong>and</strong> were conducted by mail<br />
for the 1975 <strong>Survey</strong>. Participants were<br />
included in the detailed phase <strong>of</strong> the<br />
<strong>Survey</strong> if they were at least 12 years<br />
old in 1970, 9 years old in 1975, <strong>and</strong> 16<br />
years old in 1980 <strong>and</strong> 1985. As a result,<br />
the population <strong>of</strong> hunters <strong>and</strong> anglers<br />
was more narrowly defined in 1980 <strong>and</strong><br />
1985 to include individuals 16 years<br />
old <strong>and</strong> older. However, estimates <strong>of</strong><br />
sportspersons 6 years old <strong>and</strong> older, 9<br />
years old <strong>and</strong> older, <strong>and</strong> 12 years old<br />
<strong>and</strong> older are available for comparison<br />
with past surveys.<br />
Regional Trends<br />
Section I. Most Recent Trends<br />
This trends section covers the period<br />
from 1991 to <strong>2006</strong>. The 1991, 1996,<br />
2001, <strong>and</strong> <strong>2006</strong> <strong>Survey</strong>s used similar<br />
methodologies, therefore all published<br />
information for the three <strong>Survey</strong>s is<br />
directly comparable.<br />
Section II. Historical Trends<br />
This trends section covers the period<br />
from 1955 to 1985. The methodology<br />
<strong>of</strong> these <strong>Survey</strong>s differed (see above),<br />
but acceptable correction factors were<br />
estimated.<br />
142 <strong>2006</strong> <strong>National</strong> <strong>Survey</strong> <strong>of</strong> <strong>Fishing</strong>, <strong>Hunting</strong>, <strong>and</strong> <strong>Wildlife</strong>-<strong>Associated</strong> Recreation U.S. Fish & <strong>Wildlife</strong> Service
Table C-4. Comparison <strong>of</strong> Major Findings <strong>of</strong> the <strong>National</strong> <strong>Survey</strong>s: 1955 to 1985<br />
(U.S. population 12 years old <strong>and</strong> older. Numbers in thous<strong>and</strong>s)<br />
Sportspersons 1955 1960 1965 1970 1975 1980 1985<br />
Total sportspersons .................... 24,917 30,435 32,881 36,277 45,773 46,966 49,827<br />
Anglers............................. 20,813 25,323 28,348 33,158 41,299 41,873 45,345<br />
Freshwater ........................ 18,420 21,677 23,962 29,363 36,599 35,782 39,122<br />
Saltwater ......................... 4,557 6,292 8,305 9,460 13,738 11,972 12,893<br />
Hunters............................. 11,784 14,637 13,583 14,336 17,094 16,758 16,340<br />
Small game ....................... 9,822 12,105 10,576 11,671 14,182 12,496 11,130<br />
Big game ......................... 4,414 6,277 6,566 7,774 11,037 11,047 12,576<br />
Waterfowl......................... 1,986 1,955 1,650 2,894 4,284 3,177 3,201<br />
Expenditures 1 ......................... 11,401,464 13,948,974 14,991,502 19,618,548 33,398,677 34,517,421 42,058,860<br />
Anglers............................. 7,655,522 9,743,971 9,952,411 13,699,311 23,498,506 23,387,469 28,585,686<br />
Freshwater ........................ 5,700,187 7,476,454 7,231,851 10,315,966 17,333,212 16,663,239 18,942,060<br />
Saltwater ......................... 1,955,336 2,267,512 2,720,574 3,383,345 6,165,294 5,581,976 7,191,387<br />
Hunters............................. 3,745,942 4,204,997 3,814,303 5,919,236 9,900,171 10,812,058 10,256,668<br />
Small game ....................... 1,975,707 2,629,360 2,093,137 2,612,390 4,525,942 3,335,852 2,342,860<br />
Big game ......................... 1,295,357 1,251,800 1,424,711 2,631,532 4,238,341 5,638,395 5,345,606<br />
Waterfowl......................... 474,878 323,840 296,452 675,315 1,135,889 766,033 783,315<br />
Days ................................. 566,870 658,308 708,578 909,876 1,459,551 1,300,983 1,415,379<br />
<strong>Fishing</strong> ............................. 397,447 465,769 522,759 706,187 1,058,075 952,420 1,064,986<br />
Freshwater ........................ 338,826 385,167 426,922 592,494 890,576 788,392 895,027<br />
Saltwater ......................... 58,621 80,602 95,837 113,694 167,499 164,040 171,055<br />
<strong>Hunting</strong> ............................ 169,423 192,539 185,819 203,689 401,476 348,543 350,393<br />
Small game ....................... 118,630 138,192 128,448 124,041 269,653 225,793 214,544<br />
Big game ......................... 30,834 39,190 43,845 54,536 100,600 117,406 135,447<br />
Waterfowl......................... 19,959 15,158 13,526 25,113 31,223 26,179 25,933<br />
1 In 1985 dollars.<br />
Note: Methodological differences described in the text make the estimates in this table not comparable with the estimates in Tables C-2 <strong>and</strong> C-3.<br />
U.S. Fish & <strong>Wildlife</strong> Service <strong>2006</strong> <strong>National</strong> <strong>Survey</strong> <strong>of</strong> <strong>Fishing</strong>, <strong>Hunting</strong>, <strong>and</strong> <strong>Wildlife</strong>-<strong>Associated</strong> Recreation 143
Table C-5. Anglers <strong>and</strong> Hunters by Census Division: 1955 to 1985<br />
(U.S. population 12 years old <strong>and</strong> older. Numbers in thous<strong>and</strong>s)<br />
Year<br />
Population<br />
Sportspersons,<br />
fished or hunted<br />
Anglers<br />
Hunters<br />
Number Percent Number Percent Number Percent Number Percent<br />
UNITED STATES<br />
1955 ......................... 118,366 100 24,917 21.1 20,813 17.6 11,784 10.0<br />
1960 ......................... 131,226 100 30,435 23.2 25,323 19.3 14,637 11.2<br />
1965 ......................... 141,928 100 32,881 23.2 28,348 20.0 13,585 9.6<br />
1970 ......................... 155,230 100 36,277 23.4 33,158 21.4 14,336 9.2<br />
1975 ......................... 171,860 100 45,773 26.6 41,299 24.0 17,094 9.9<br />
1980 ......................... 184,691 100 46,966 25.4 41,873 22.7 16,758 9.1<br />
1985 ......................... 195,659 100 49,827 25.5 45,345 23.2 16,340 8.4<br />
New Engl<strong>and</strong><br />
1955 ......................... 7,919 100 1,224 15.4 1,002 12.7 589 7.4<br />
1960 ......................... 8,349 100 1,368 16.4 1,205 14.4 517 6.2<br />
1965 ......................... 9,256 100 1,650 17.8 1,488 16.0 583 6.3<br />
1970 ......................... 8,652 100 1,579 18.3 1,430 16.5 582 6.7<br />
1975 ......................... 9,910 100 2,004 20.2 1,861 18.8 566 5.7<br />
1980 ......................... 10,205 100 1,974 19.3 1,788 17.5 572 5.6<br />
1985 ......................... 10,554 100 2,058 19.5 1,914 18.1 552 5.2<br />
Middle Atlantic<br />
1955 ......................... 24,869 100 3,539 14.2 2,811 11.3 1,608 6.5<br />
1960 ......................... 26,493 100 3,432 13.0 2,569 9.7 1,723 6.5<br />
1965 ......................... 27,346 100 3,602 13.2 2,760 10.1 1,631 6.0<br />
1970 ......................... 28,244 100 4,539 16.1 4,504 14.4 1,731 6.1<br />
1975 ......................... 30,449 100 5,919 19.4 5,097 16.7 2,096 6.9<br />
1980 ......................... 30,256 100 5,181 17.1 4,332 14.3 2,001 6.6<br />
1985 ......................... 31,099 100 5,565 17.9 4,820 15.5 1,972 6.3<br />
East North Central<br />
1955 ......................... 25,733 100 5,489 21.3 4,583 17.8 2,538 9.9<br />
1960 ......................... 26,833 100 6,316 32.5 5,317 19.8 2,985 11.1<br />
1965 ......................... 28,124 100 6,214 22.1 5,336 19.0 2,563 9.1<br />
1970 ......................... 31,550 100 7,284 23.1 6,699 21.2 2,812 8.9<br />
1975 ......................... 32,796 100 9,049 27.6 8,181 24.9 3,392 10.3<br />
1980 ......................... 33,526 100 8,725 26.0 7,891 23.5 2,955 8.8<br />
1985 ......................... 33,747 100 8,973 26.6 8,270 24.5 2,814 8.3<br />
West North Central<br />
1955 ......................... 9,201 100 2,913 31.7 2,346 25.5 1,534 16.7<br />
1960 ......................... 10,149 100 3,383 33.3 2,855 28.1 1,709 16.8<br />
1965 ......................... 11,681 100 3,678 31.5 3,226 27.6 1,620 13.9<br />
1970 ......................... 12,904 100 4,000 31.0 3,579 27.7 1,783 13.8<br />
1975 ......................... 13,564 100 4,524 33.3 4,089 30.1 1,863 13.7<br />
1980 ......................... 13,826 100 4,770 34.5 4,220 30.5 1,965 14.2<br />
1985 ......................... 14,137 100 5,140 36.4 4,681 33.1 1,971 13.9<br />
South Atlantic<br />
1955 ......................... 14,336 100 3,223 22.5 2,805 19.6 1,449 10.1<br />
1960 ......................... 17,798 100 4,423 24.9 3,695 20.8 2,045 11.5<br />
1965 ......................... 20,593 100 5,626 27.3 5,054 24.5 1,900 9.2<br />
1970 ......................... 23,539 100 5,461 23.2 5,129 21.8 1,904 8.1<br />
1975 ......................... 27,127 100 7,110 26.2 6,479 23.9 2,494 9.2<br />
1980 ......................... 30,512 100 7,769 25.5 7,086 23.2 2,444 8.0<br />
1985 ......................... 33,636 100 8,721 25.9 8,056 24.0 2,467 7.3<br />
East South Central<br />
1955 ......................... 7,959 100 1,963 24.7 1,665 20.9 989 12.4<br />
1960 ......................... 9,277 100 2,778 29.9 2,207 23.8 1,510 16.3<br />
1965 ......................... 9,652 100 2,587 26.8 2,201 22.8 1,294 13.4<br />
1970 ......................... 9,862 100 2,660 27.0 2,464 25.0 1,162 11.8<br />
1975 ......................... 10,798 100 3,007 27.8 2,689 24.9 1,355 12.5<br />
1980 ......................... 11,771 100 3,614 30.7 3,173 27.0 1,567 13.3<br />
1985 ......................... 12,364 100 3,671 29.7 3,308 26.8 1,441 11.7<br />
144 <strong>2006</strong> <strong>National</strong> <strong>Survey</strong> <strong>of</strong> <strong>Fishing</strong>, <strong>Hunting</strong>, <strong>and</strong> <strong>Wildlife</strong>-<strong>Associated</strong> Recreation U.S. Fish & <strong>Wildlife</strong> Service
Table C-5. Anglers <strong>and</strong> Hunters by Census Division: 1955 to 1985—Continued<br />
(U.S. population 12 years old <strong>and</strong> older. Numbers in thous<strong>and</strong>s)<br />
Year<br />
Population<br />
Sportspersons,<br />
fished or hunted<br />
Anglers<br />
Hunters<br />
Number Percent Number Percent Number Percent Number Percent<br />
West South Central<br />
1955 ......................... 10,250 100 2,560 25.0 2,237 21.8 1,165 11.4<br />
1960 ......................... 11,837 100 3,666 31.0 3,133 26.5 1,750 14.8<br />
1965 ......................... 12,724 100 3,713 29.2 3,278 25.8 1,571 12.3<br />
1970 ......................... 14,624 100 4,380 30.0 4,006 27.4 1,918 13.1<br />
1975 ......................... 16,628 100 5,781 34.8 5,267 31.7 2,563 15.4<br />
1980 ......................... 19,136 100 5,862 30.6 5,136 26.8 2,456 12.8<br />
1985 ......................... 21,184 100 6,418 30.3 5,704 26.9 2,572 12.1<br />
Mountain<br />
1955 ......................... 4,529 100 1,369 30.2 1,112 24.6 796 17.6<br />
1960 ......................... 5,222 100 1,646 31.5 1,372 26.3 1,120 21.4<br />
1965 ......................... 5,029 100 1,565 31.1 1,261 25.1 988 19.6<br />
1970 ......................... 5,656 100 2,044 36.1 1,769 31.3 980 17.3<br />
1975 ......................... 7,576 100 2,570 33.9 2,252 29.7 1,159 15.3<br />
1980 ......................... 9,160 100 2,903 31.7 2,500 27.3 1,268 13.8<br />
1985 ......................... 10,215 100 3,128 30.6 2,765 27.1 1,241 12.1<br />
Pacific<br />
1955 ......................... 13,570 100 2,637 19.4 2,252 16.6 1,116 8.2<br />
1960 ......................... 15,268 100 3,422 22.4 2,971 19.5 1,279 8.4<br />
1965 ......................... 17,523 100 4,246 24.2 3,744 21.4 1,433 8.2<br />
1970 ......................... 20,199 100 4,332 21.4 4,030 20.0 1,466 7.3<br />
1975 ......................... 23,012 100 5,811 25.2 5,386 23.4 1,607 7.0<br />
1980 ......................... 26,299 100 6,168 23.5 5,747 21.9 1,531 5.0<br />
1985 ......................... 38,725 100 6,154 21.4 5,829 20.3 1,310 4.6<br />
Note: Methodological differences described in the text make the estimates in this table not comparable with the estimates in Tables C-2 <strong>and</strong> C-3.<br />
U.S. Fish & <strong>Wildlife</strong> Service <strong>2006</strong> <strong>National</strong> <strong>Survey</strong> <strong>of</strong> <strong>Fishing</strong>, <strong>Hunting</strong>, <strong>and</strong> <strong>Wildlife</strong>-<strong>Associated</strong> Recreation 145
Appendix D
Appendix D.<br />
Sample Design <strong>and</strong> Statistical Accuracy<br />
This appendix is presented in two parts.<br />
The first part is the U.S. Census Bureau<br />
Source <strong>and</strong> Accuracy Statement. This<br />
statement describes the sampling<br />
design for the <strong>2006</strong> <strong>Survey</strong> <strong>and</strong><br />
highlights the steps taken to produce<br />
estimates from the completed questionnaires.<br />
The statement explains the<br />
use <strong>of</strong> st<strong>and</strong>ard errors <strong>and</strong> confidence<br />
intervals. It also provides comprehensive<br />
information about errors characteristic<br />
<strong>of</strong> surveys <strong>and</strong> formulas <strong>and</strong><br />
parameters to calculate an approximate<br />
st<strong>and</strong>ard error or confidence interval for<br />
each number published in this report.<br />
The second part, Tables D-1 to D-5,<br />
reports approximate st<strong>and</strong>ard errors<br />
<strong>and</strong> 95-percent confidence intervals<br />
for selected measures <strong>of</strong> participation<br />
<strong>and</strong> expenditures for wildlife-related<br />
recreation.<br />
Source <strong>and</strong> Accuracy Statement for<br />
the <strong>2006</strong> <strong>National</strong> <strong>Survey</strong> <strong>of</strong> <strong>Fishing</strong>,<br />
<strong>Hunting</strong>, <strong>and</strong> <strong>Wildlife</strong>-<strong>Associated</strong><br />
Recreation<br />
SOURCE OF DATA<br />
The estimates in this report are<br />
based on data collected in the <strong>2006</strong><br />
<strong>National</strong> <strong>Survey</strong> <strong>of</strong> <strong>Fishing</strong>, <strong>Hunting</strong>,<br />
<strong>and</strong> <strong>Wildlife</strong>-<strong>Associated</strong> Recreation<br />
(FHWAR) conducted by the Census<br />
Bureau <strong>and</strong> sponsored by the U.S. Fish<br />
<strong>and</strong> <strong>Wildlife</strong> Service.<br />
The eligible universe for the FHWAR<br />
is the civilian noninstitutionalized <strong>and</strong><br />
nonbarrack military population living in<br />
the United States. The institutionalized<br />
population, which is excluded from<br />
the population universe, is composed<br />
primarily <strong>of</strong> the population in correctional<br />
institutions <strong>and</strong> nursing homes<br />
(91 percent <strong>of</strong> the 4.1 million institutionalized<br />
people in Census 2000).<br />
The <strong>2006</strong> <strong>Survey</strong> was designed to<br />
provide state-level estimates <strong>of</strong> the<br />
number <strong>of</strong> participants in recreational<br />
hunting <strong>and</strong> fishing <strong>and</strong> in wildlifewatching<br />
activities (e.g., wi ldlife<br />
observation). Information was<br />
collected on the number <strong>of</strong> participants,<br />
where <strong>and</strong> how <strong>of</strong>ten they participated,<br />
the type <strong>of</strong> wildlife encountered, <strong>and</strong><br />
the amounts <strong>of</strong> money spent on wildlife-related<br />
recreation.<br />
The survey was conducted in two<br />
stages: an initial screening <strong>of</strong> households<br />
to identify likely sportspersons<br />
<strong>and</strong> wildlife-watching participants<br />
<strong>and</strong> a series <strong>of</strong> follow-up interviews <strong>of</strong><br />
selected persons to collect detailed data<br />
about their wildlife-related recreation<br />
during <strong>2006</strong>.<br />
SAMPLE DESIGN<br />
The <strong>2006</strong> FHWAR sample was selected<br />
from the Census Bureau’s master<br />
address file (MAF) <strong>and</strong> unused sample<br />
<strong>of</strong> the Current Population <strong>Survey</strong><br />
(CPS). The CPS sample was used<br />
to improve coverage in rural areas <strong>of</strong><br />
some states.<br />
The FHWAR is a multistage probability<br />
sample, with coverage in all 50<br />
states <strong>and</strong> the District <strong>of</strong> Columbia. In<br />
the first stage <strong>of</strong> the sampling process,<br />
primary sampling units (PSUs) are<br />
selected for sample. The PSUs are<br />
defined to correspond to the Office <strong>of</strong><br />
Management <strong>and</strong> Budget definitions<br />
<strong>of</strong> Core Based Statistical Area definitions<br />
<strong>and</strong> to improve efficiency in<br />
field operations. The United States is<br />
divided into 2,025 PSUs. These PSUs<br />
are grouped into 824 strata. Within<br />
each stratum, a single PSU is chosen<br />
for the sample, with its probability <strong>of</strong><br />
selection proportional to its population<br />
as <strong>of</strong> the most recent decennial census.<br />
This PSU represents the entire stratum<br />
from which it was selected. In the case<br />
<strong>of</strong> strata consisting <strong>of</strong> only one PSU,<br />
the PSU is chosen with certainty.<br />
Within the selected PSUs, the FHWAR<br />
sample was selected from the MAF<br />
where sufficient coverage <strong>of</strong> addresses<br />
existed. In some rural areas, the sample<br />
was selected from unused cases from<br />
the CPS to improve coverage.<br />
FHWAR Screening Sample<br />
The total screening sample consisted<br />
<strong>of</strong> 85,000 households. Interviewing<br />
for the screen was conducted during<br />
April, May, <strong>and</strong> June <strong>2006</strong>. Of all<br />
housing units in sample, about 74,000<br />
were determined to be eligible for<br />
interview. Interviewers obtained<br />
interviews at 66,688 <strong>of</strong> these units for<br />
a national response rate <strong>of</strong> 90 percent.<br />
Local field representatives conducted<br />
interviews by telephone when possible,<br />
otherwise through a personal visit. The<br />
field representatives asked screening<br />
questions for all household members<br />
6 years old <strong>and</strong> older. Noninterviews<br />
occur when the occupants are not found<br />
at home after repeated calls or are<br />
unavailable for some other reason.<br />
Data for the FHWAR sportspersons<br />
sample <strong>and</strong> wildlife-watchers sample<br />
were collected in three waves. The<br />
first wave started in April <strong>2006</strong>, the<br />
second in September <strong>2006</strong>, <strong>and</strong> the<br />
third in January 2007. In the sportspersons<br />
sample, all persons who hunted<br />
or fished in <strong>2006</strong> by the time <strong>of</strong> the<br />
screening interview were interviewed in<br />
the first wave. The remaining sportspersons<br />
sample were interviewed in the<br />
second wave. A subsampling operation<br />
was conducted before the third wave <strong>of</strong><br />
sampling to reduce cost <strong>of</strong> the <strong>Survey</strong>,<br />
<strong>and</strong> everyone remaining in sample was<br />
interviewed in the third wave.<br />
The reference period was the preceding<br />
4 months for waves 1 <strong>and</strong> 2. In wave<br />
3, the reference period was either 4, 8,<br />
or 12 months depending on when the<br />
sample person was first interviewed.<br />
Detailed Samples<br />
Two independent detailed samples were<br />
chosen from the FHWAR screening<br />
sample. One consisted <strong>of</strong> sportspersons<br />
(people who hunt or fish) <strong>and</strong> the<br />
other <strong>of</strong> wildlife watchers (people who<br />
observe, photograph, or feed wildlife).<br />
148 <strong>2006</strong> <strong>National</strong> <strong>Survey</strong> <strong>of</strong> <strong>Fishing</strong>, <strong>Hunting</strong>, <strong>and</strong> <strong>Wildlife</strong>-<strong>Associated</strong> Recreation U.S. Fish & <strong>Wildlife</strong> Service
A. Sportspersons<br />
The Census Bureau selected the<br />
detailed samples based on information<br />
reported during the screening<br />
phase. Based on information<br />
collected from the household<br />
respondent, every person 16 years<br />
old <strong>and</strong> older in the FHWAR<br />
screening sample was assigned to a<br />
sportspersons stratum. The criteria<br />
for the strata included time devoted<br />
to hunting or fishing in previous<br />
years, participation in hunting or<br />
fishing in <strong>2006</strong> by the time <strong>of</strong> the<br />
screening interview, <strong>and</strong> intentions<br />
to participate in hunting <strong>and</strong> fishing<br />
activities during the remainder<br />
<strong>of</strong> <strong>2006</strong>. The four sportspersons<br />
categories were:<br />
1. Active—a person who had<br />
already participated in hunting<br />
or fishing in <strong>2006</strong> at the time <strong>of</strong><br />
the screener interview.<br />
2. Likely—a person who had not<br />
participated in <strong>2006</strong> at the time<br />
<strong>of</strong> the screener, but had participated<br />
in 2005 OR was likely to<br />
participate in <strong>2006</strong>.<br />
3. Inactive—a person who had not<br />
participated in 2005 or <strong>2006</strong><br />
AND was somewhat unlikely to<br />
participate in <strong>2006</strong>.<br />
4. Nonparticipant—a person who<br />
had not participated in 2005 or<br />
<strong>2006</strong> AND was very unlikely to<br />
participate in <strong>2006</strong>.<br />
Persons were selected for the<br />
detailed phase based on these<br />
groupings.<br />
Active sportspersons were given<br />
the detailed interview twice—at<br />
the time <strong>of</strong> the screening interview<br />
(in April, May, or June <strong>2006</strong>)<br />
<strong>and</strong> again in January or February<br />
2007. Likely sportspersons <strong>and</strong> a<br />
subsample <strong>of</strong> the inactive sportspersons<br />
were also interviewed<br />
twice—first in September or<br />
October <strong>2006</strong>, then in January or<br />
February 2007. If Census Bureau<br />
field representatives were not able<br />
to obtain the first interview, they<br />
attempted to interview the person<br />
in the final interviewing period<br />
with the reference period being the<br />
entire year. Persons in the nonparticipant<br />
group were not eligible for<br />
a detailed interview.<br />
About 28,600 persons were designated<br />
for interviews. The detailed<br />
sportspersons sample sizes varied<br />
by state to get reliable state-level<br />
estimates. During each interview<br />
period, about 23 percent <strong>of</strong> the<br />
designated persons were not found<br />
at home or were unavailable for<br />
some other reason. Overall, about<br />
22,000 detailed sportspersons interviews<br />
were completed at a response<br />
rate <strong>of</strong> 77 percent.<br />
B. <strong>Wildlife</strong> Watchers<br />
The wildlife-watching detailed<br />
sample was also selected based on<br />
information reported during the<br />
screening phase. Based on information<br />
collected from the household<br />
respondent, every person 16 years<br />
old <strong>and</strong> older was assigned to a<br />
stratum. The criteria for the strata<br />
included time devoted to wildlifewatching<br />
activities in previous<br />
years, participation in wildlifewatching<br />
activities in <strong>2006</strong> by the<br />
time <strong>of</strong> the screening interview,<br />
<strong>and</strong> intentions to participate in<br />
wildlife watching activities during<br />
the remainder <strong>of</strong> <strong>2006</strong>. The five<br />
wildlife watching categories were:<br />
1. Active—a person who had<br />
already participated in <strong>2006</strong> at<br />
the time <strong>of</strong> the screening interview.<br />
2. Avid—a person who had not<br />
yet participated in <strong>2006</strong>, but<br />
in 2005 had taken trips to<br />
participate in wildlife-watching<br />
activities for 21 or more days or<br />
had spent $300 or more.<br />
3. Average—a person who had not<br />
yet participated in <strong>2006</strong>, but in<br />
2005 had taken trips to wildlife<br />
watch for less than 21 days <strong>and</strong><br />
had spent less than $300 OR<br />
had not participated in wildlife<br />
watching activities but was very<br />
likely to in the remainder <strong>of</strong><br />
<strong>2006</strong>.<br />
4. Infrequent—a person who had<br />
not participated in 2005 or<br />
<strong>2006</strong>, but was somewhat likely<br />
or somewhat unlikely to participate<br />
in the remainder <strong>of</strong> <strong>2006</strong>.<br />
5. Nonparticipant—a person<br />
who had not participated in<br />
2005 or <strong>2006</strong> AND was very<br />
unlikely to participate during<br />
the remainder <strong>of</strong> <strong>2006</strong>.<br />
Persons were selected for the<br />
detailed sample based on these<br />
groupings, but persons in the<br />
nonparticipant group were not<br />
eligible for a detailed interview.<br />
A subsample <strong>of</strong> each <strong>of</strong> the other<br />
groups was selected to receive a<br />
detailed interview with the chance<br />
<strong>of</strong> selection diminishing as the likelihood<br />
<strong>of</strong> participation diminished.<br />
<strong>Wildlife</strong>-watching participants were<br />
given the detailed interview twice.<br />
Some received their first detailed<br />
interview at the same time as the<br />
screening interview (in April, May,<br />
or June <strong>2006</strong>). The rest received<br />
their first detailed interview in<br />
September or October <strong>2006</strong>. All<br />
wildlife-watching participants<br />
received their second interview<br />
in January or February 2007. If<br />
Census Bureau field representatives<br />
were not able to obtain the<br />
first interview, they attempted to<br />
interview the person in the final<br />
interviewing period with the reference<br />
period being the entire year.<br />
About 14,400 persons were<br />
designated for interviews. The<br />
detailed wildlife-watching sample<br />
sizes varied by state to get reliable<br />
state-level estimates. During each<br />
interview period, about 20 percent<br />
<strong>of</strong> the designated persons were not<br />
found at home or were unavailable<br />
for some other reason. Overall,<br />
about 11,300 detailed wildlifewatcher<br />
interviews were completed<br />
at a response rate <strong>of</strong> 78 percent.<br />
ESTIMATION PROCEDURE<br />
Several stages <strong>of</strong> adjustments were<br />
used to derive the final <strong>2006</strong> FHWAR<br />
person weights. A brief description <strong>of</strong><br />
the major components <strong>of</strong> the weights is<br />
given below.<br />
All statistics for the population 6 to<br />
15 years <strong>of</strong> age were derived from the<br />
screening interview. Statistics for the<br />
population 16 years old <strong>and</strong> older come<br />
from both the screening <strong>and</strong> detailed<br />
interviews. Estimates that come from<br />
the screening sample are presented in<br />
Appendix B.<br />
A. Screening Sample<br />
Every interviewed person in<br />
the screening sample received<br />
a screening weight that was the<br />
product <strong>of</strong> the following factors:<br />
U.S. Fish & <strong>Wildlife</strong> Service <strong>2006</strong> <strong>National</strong> <strong>Survey</strong> <strong>of</strong> <strong>Fishing</strong>, <strong>Hunting</strong>, <strong>and</strong> <strong>Wildlife</strong>-<strong>Associated</strong> Recreation 149
1. Base Weight. The base weight<br />
is the inverse <strong>of</strong> the household’s<br />
probability <strong>of</strong> selection.<br />
2. Household Noninterview<br />
Adjustment. The noninterview<br />
adjustment inflates the weight<br />
assigned to interviewed households<br />
to account for households<br />
eligible for interview but<br />
for which no interview was<br />
obtained.<br />
3. First-Stage Adjustment. The<br />
824 areas designated for our<br />
samples were selected from<br />
2,025 such areas <strong>of</strong> the United<br />
States. Some sample areas<br />
represent only themselves<br />
<strong>and</strong> are referred to as selfrepresenting.<br />
The remaining<br />
areas represent other areas<br />
similar in selected characteristics<br />
<strong>and</strong> are thus designated<br />
non-self-representing. The<br />
first-stage factor reduces the<br />
component <strong>of</strong> variation arising<br />
from sampling the non-selfrepresenting<br />
areas.<br />
4. Second-Stage Adjustment. This<br />
adjustment brings the estimates<br />
<strong>of</strong> the total population<br />
into agreement with censusbased<br />
estimates <strong>of</strong> the civilian<br />
non institutionalized <strong>and</strong> nonbarrack<br />
military populations for<br />
each state.<br />
B. Sportspersons Sample<br />
Every interviewed person in the<br />
sportspersons detailed sample<br />
received a weight that was the<br />
product <strong>of</strong> the following factors:<br />
1. Screening Weight. This is the<br />
person’s final weight from the<br />
screening sample.<br />
2. Sportspersons Stratum Adjustment.<br />
This factor inflates the<br />
weights <strong>of</strong> persons selected for<br />
the detailed sample to account<br />
for the subsampling done within<br />
each sportsperson stratum.<br />
3. Sportspersons Noninterview<br />
Adjustment. This factor adjusts<br />
the weights <strong>of</strong> the interviewed<br />
sportspersons to account for<br />
sportspersons selected for the<br />
detailed sample for whom no<br />
interview was obtained. A<br />
person was considered a noninterview<br />
if he or she was not<br />
interviewed in the third wave <strong>of</strong><br />
interviewing.<br />
4. Sportspersons Ratio Adjustment<br />
Factor. This is a ratio adjustment<br />
<strong>of</strong> the detailed sample to<br />
the screening sample within<br />
the sportspersons sampling<br />
stratum. This adjustment brings<br />
the population estimates <strong>of</strong><br />
persons aged 16 years old <strong>and</strong><br />
older from the detailed sample<br />
into agreement with the same<br />
estimates from the screening<br />
sample, which was a much<br />
larger sample.<br />
C. <strong>Wildlife</strong>-Watchers Sample<br />
Every interviewed person in the<br />
wildlife-watchers detailed sample<br />
received a weight that was the<br />
product <strong>of</strong> the following factors:<br />
1. Screening Weight. This is the<br />
person’s final weight from the<br />
screening sample.<br />
2. <strong>Wildlife</strong>-Watchers Stratum<br />
Adjustment. This factor inflates<br />
the weights <strong>of</strong> persons selected<br />
for the detailed sample to<br />
account for the subsampling<br />
done within each wildlifewatcher<br />
stratum.<br />
3. <strong>Wildlife</strong>-Watchers Noninterview<br />
Adjustment. This factor adjusts<br />
the weights <strong>of</strong> the interviewed<br />
wildlife-watching participants<br />
to account for wildlife watchers<br />
selected for the detailed sample<br />
for which no interview was<br />
obtained. A person was considered<br />
a noninterview if he or she<br />
was not interviewed in the third<br />
wave <strong>of</strong> interviewing.<br />
4. <strong>Wildlife</strong>-Watchers Ratio Adjustment<br />
Factor. This is a ratio<br />
adjustment <strong>of</strong> the detailed<br />
sample to the screening sample<br />
within wildlife-watchers<br />
sampling strata. This adjustment<br />
brings the population<br />
estimates <strong>of</strong> persons aged 16<br />
years old <strong>and</strong> older from the<br />
detailed sample into agreement<br />
with the same estimates from<br />
the screening sample, which<br />
was a much larger sample.<br />
ACCURACY OF THE ESTIMATES<br />
A sample survey estimate has two types<br />
<strong>of</strong> error: sampling <strong>and</strong> nonsampling.<br />
The accuracy <strong>of</strong> an estimate depends<br />
on both types <strong>of</strong> error. The nature <strong>of</strong><br />
the sampling error is known given the<br />
survey design; the full extent <strong>of</strong> the<br />
nonsampling error is unknown.<br />
NONSAMPLING ERROR<br />
For a given estimator, the difference<br />
between the estimate that would result<br />
if the sample were to include the entire<br />
population <strong>and</strong> the true population<br />
value being estimated is known as<br />
nonsampling error. There are several<br />
sources <strong>of</strong> nonsampling error that<br />
may occur during the development or<br />
execution <strong>of</strong> the survey. It can occur<br />
because <strong>of</strong> circumstances created by the<br />
interviewer, the respondent, the survey<br />
instrument, or the way the data are<br />
collected <strong>and</strong> processed. For example,<br />
errors could occur because:<br />
• The interviewer records the wrong<br />
answer, the respondent provides<br />
incorrect information, the respondent<br />
estimates the requested<br />
information, or an unclear survey<br />
question is misunderstood by the<br />
respondent (measurement error).<br />
• Some individuals or businesses<br />
that should have been included<br />
in the survey frame were missed<br />
(coverage error).<br />
• Responses are not collected from<br />
all those in the sample or the<br />
respondent is unwilling to provide<br />
information (nonresponse error).<br />
• Values are estimated imprecisely<br />
for missing data (imputation error).<br />
• Forms may be lost, data may<br />
be incorrectly keyed, coded, or<br />
recoded, etc. (processing error).<br />
The Census Bureau employs quality<br />
control procedures throughout the<br />
production process, including the<br />
overall design <strong>of</strong> surveys, the wording<br />
<strong>of</strong> questions, the review <strong>of</strong> the work<br />
<strong>of</strong> interviewers <strong>and</strong> coders, <strong>and</strong> the<br />
statistical review <strong>of</strong> reports to minimize<br />
these errors.<br />
Two types <strong>of</strong> nonsampling error that<br />
can be examined to a limited extent are<br />
nonresponse <strong>and</strong> undercoverage.<br />
Nonresponse. The effect <strong>of</strong> nonresponse<br />
cannot be measured directly, but<br />
one indication <strong>of</strong> its potential effect is<br />
the nonresponse rate. For the FHWAR<br />
screener interview, the household-level<br />
nonresponse rate was 10 percent. The<br />
person-level nonresponse rate for the<br />
150 <strong>2006</strong> <strong>National</strong> <strong>Survey</strong> <strong>of</strong> <strong>Fishing</strong>, <strong>Hunting</strong>, <strong>and</strong> <strong>Wildlife</strong>-<strong>Associated</strong> Recreation U.S. Fish & <strong>Wildlife</strong> Service
detailed sportsperson interview was an<br />
23 percent <strong>and</strong> for the wildlife watchers<br />
it was 22 percent. Since the screener<br />
nonresponse rate is a household-level<br />
rate <strong>and</strong> the detailed interview nonresponse<br />
rate is a person-level rate, we<br />
cannot combine these rates to derive<br />
an overall nonresponse rate. Since it is<br />
unlikely the nonresponding households<br />
to the FHWAR have the same number<br />
<strong>of</strong> persons as the households successfully<br />
interviewed, combining these<br />
rates would result in an overestimate <strong>of</strong><br />
the “true” person-level overall nonresponse<br />
rate for the detailed interviews.<br />
Coverage. Overall screener undercoverage<br />
is estimated to be about 13<br />
percent. Ratio estimation to independent<br />
population controls, as described<br />
previously, partially corrects for the<br />
bias due to survey undercoverage.<br />
However, biases exist in the estimates<br />
to the extent that missed persons in<br />
missed households or missed persons in<br />
interviewed households have different<br />
characteristics from those <strong>of</strong> interviewed<br />
persons in the same age group.<br />
Comparability <strong>of</strong> Data. Data obtained<br />
from the <strong>2006</strong> FHWAR <strong>and</strong> other<br />
sources are not entirely comparable.<br />
This results from differences in interviewer<br />
training <strong>and</strong> experience <strong>and</strong> in<br />
differing survey processes. This is an<br />
example <strong>of</strong> nonsampling variability<br />
not reflected in the st<strong>and</strong>ard errors.<br />
Therefore, caution should be used<br />
when comparing results from different<br />
sources. (See Appendix C.)<br />
A Nonsampling Error Warning. Since<br />
the full extent <strong>of</strong> the nonsampling error<br />
is unknown, one should be particularly<br />
careful when interpreting results based<br />
on small differences between estimates.<br />
The Census Bureau recommends that<br />
data users incorporate information<br />
about nonsampling errors into their<br />
analyses, as nonsampling error could<br />
impact the conclusions drawn from<br />
the results. Caution should also be<br />
used when interpreting results based<br />
on a relatively small number <strong>of</strong> cases.<br />
Summary measures (such as medians<br />
<strong>and</strong> percentage distributions) probably<br />
do not reveal useful information when<br />
computed on a subpopulation smaller<br />
than 50,000 for screener data, 65,000<br />
for the detailed sportsperson data, <strong>and</strong><br />
230,000 for the wildlife-watchers data.<br />
SAMPLING ERROR<br />
Since the FHWAR estimates come from<br />
a sample, they may differ from figures<br />
from an enumeration <strong>of</strong> the entire<br />
population using the same questionnaires,<br />
instructions, <strong>and</strong> enumerators.<br />
For a given estimator, the difference<br />
between an estimate based on a sample<br />
<strong>and</strong> the estimate that would result if<br />
the sample were to include the entire<br />
population is known as sampling<br />
error. St<strong>and</strong>ard errors, as calculated<br />
by methods described in “St<strong>and</strong>ard<br />
Errors <strong>and</strong> Their Use,” are primarily<br />
measures <strong>of</strong> the magnitude <strong>of</strong> sampling<br />
error. However, they may include some<br />
nonsampling error.<br />
St<strong>and</strong>ard Errors <strong>and</strong> Their Use. The<br />
sample estimate <strong>and</strong> its st<strong>and</strong>ard error<br />
enable one to construct a confidence<br />
interval. A confidence interval is a<br />
range that has a known probability<br />
<strong>of</strong> including the average result <strong>of</strong> all<br />
possible samples. For example, if all<br />
possible samples were surveyed under<br />
essentially the same general conditions<br />
<strong>and</strong> using the same sample design, <strong>and</strong><br />
if an estimate <strong>and</strong> its st<strong>and</strong>ard error<br />
were calculated from each sample, then<br />
approximately 95 percent <strong>of</strong> the intervals<br />
from 1.96 st<strong>and</strong>ard errors below<br />
the estimate to 1.96 st<strong>and</strong>ard errors<br />
above the estimate would include the<br />
average result <strong>of</strong> all possible samples.<br />
A particular confidence interval may or<br />
may not contain the average estimate<br />
derived from all possible samples.<br />
However, one can say with specified<br />
confidence that the interval includes<br />
the average estimate calculated from all<br />
possible samples.<br />
St<strong>and</strong>ard errors may also be used to<br />
perform hypothesis testing, a procedure<br />
for distinguishing between population<br />
parameters using sample estimates.<br />
The most common type <strong>of</strong> hypothesis<br />
is that the population parameters<br />
are different. An example would be<br />
comparing the proportion <strong>of</strong> anglers to<br />
the proportion <strong>of</strong> hunters.<br />
Tests may be performed at various<br />
levels <strong>of</strong> significance. A significance<br />
level is the probability <strong>of</strong> concluding<br />
that the characteristics are different<br />
when, in fact, they are the same. For<br />
example, to conclude that two characteristics<br />
are different at the 0.05 level <strong>of</strong><br />
significance, the absolute value <strong>of</strong> the<br />
estimated difference between characteristics<br />
must be greater than or equal<br />
to 1.96 times the st<strong>and</strong>ard error <strong>of</strong> the<br />
difference.<br />
This report uses 95-percent confidence<br />
intervals <strong>and</strong> 0.05 levels <strong>of</strong> significance<br />
to determine statistical validity.<br />
Consult st<strong>and</strong>ard statistical textbooks<br />
for alternative criteria.<br />
Estimating St<strong>and</strong>ard Errors. The<br />
Census Bureau uses replication<br />
methods to estimate the st<strong>and</strong>ard errors<br />
<strong>of</strong> FHWAR estimates. These methods<br />
primarily measure the magnitude <strong>of</strong><br />
sampling error. However, they do<br />
measure some effects <strong>of</strong> nonsampling<br />
error as well. They do not measure<br />
systematic biases in the data associated<br />
with nonsampling error. Bias is<br />
the average over all possible samples<br />
<strong>of</strong> the differences between the sample<br />
estimates <strong>and</strong> the true value.<br />
Generalized Variance Parameters.<br />
While it is possible to compute <strong>and</strong><br />
present an estimate <strong>of</strong> the st<strong>and</strong>ard<br />
error based on the survey data for each<br />
estimate in a report, there are a number<br />
<strong>of</strong> reasons why this is not done. A<br />
presentation <strong>of</strong> the individual st<strong>and</strong>ard<br />
errors would be <strong>of</strong> limited use, since<br />
one could not possibly predict all <strong>of</strong><br />
the combinations <strong>of</strong> results that may<br />
be <strong>of</strong> interest to data users. Additionally,<br />
data users have access to FHWAR<br />
microdata files, <strong>and</strong> it is impossible to<br />
compute in advance the st<strong>and</strong>ard error<br />
for every estimate one might obtain<br />
from those data sets. Moreover, variance<br />
estimates are based on sample<br />
data <strong>and</strong> have variances <strong>of</strong> their own.<br />
Therefore, some methods <strong>of</strong> stabilizing<br />
these estimates <strong>of</strong> variance, for<br />
example, by generalizing or averaging<br />
over time, may be used to improve their<br />
reliability.<br />
Experience has shown that certain<br />
groups <strong>of</strong> estimates have similar<br />
relationships between their variances<br />
<strong>and</strong> expected values. Modeling or<br />
generalizing may provide more stable<br />
variance estimates by taking advantage<br />
<strong>of</strong> these similarities. The generalized<br />
variance function is a simple<br />
model that expresses the variance as a<br />
function <strong>of</strong> the expected value <strong>of</strong> the<br />
survey estimate. The parameters <strong>of</strong> the<br />
generalized variance function are estimated<br />
using direct replicate variances.<br />
These generalized variance parameters<br />
provide a relatively easy method to<br />
obtain approximate st<strong>and</strong>ard errors for<br />
numerous characteristics. Tables D-6 to<br />
D-11 provide the generalized variance<br />
parameters for FHWAR data. Methods<br />
for using the parameters to calculate<br />
st<strong>and</strong>ard errors <strong>of</strong> various estimates are<br />
given in the next sections.<br />
U.S. Fish & <strong>Wildlife</strong> Service <strong>2006</strong> <strong>National</strong> <strong>Survey</strong> <strong>of</strong> <strong>Fishing</strong>, <strong>Hunting</strong>, <strong>and</strong> <strong>Wildlife</strong>-<strong>Associated</strong> Recreation 151
St<strong>and</strong>ard Errors <strong>of</strong> Estimated Numbers. The approximate st<strong>and</strong>ard error, S x<br />
, <strong>of</strong> an estimated number shown in this report<br />
can be obtained using the following formulas. Formula (1) is used to calculate the st<strong>and</strong>ard errors <strong>of</strong> levels <strong>of</strong> sportspersons,<br />
anglers, <strong>and</strong> wildlife watchers.<br />
2<br />
s ax bx<br />
x <br />
(1)<br />
Here, x is the size <strong>of</strong> the estimate <strong>and</strong> a <strong>and</strong> b are the parameters in the tables associated with the particular characteristic.<br />
Formula (2) is used for st<strong>and</strong>ard errors <strong>of</strong> aggregates, i.e., trips, days, <strong>and</strong> expenditures.<br />
s 2<br />
x<br />
ax bx <br />
cx<br />
y<br />
2<br />
(2)<br />
Here, x is again the size <strong>of</strong> the estimate; y is the base <strong>of</strong> the estimate; <strong>and</strong> a, b, <strong>and</strong> c are the parameters in the tables associated<br />
with the particular characteristic.<br />
Illustration <strong>of</strong> the Computation <strong>of</strong> the St<strong>and</strong>ard Error <strong>of</strong> an Estimated Number<br />
Table 1 in this report shows that 33,916,000 persons 16 years old <strong>and</strong> older either fished or hunted in the United States in<br />
<strong>2006</strong>. Using formula (1) with the parameters a = –0.000027 <strong>and</strong> b = 6,125 from table D-7, the approximate st<strong>and</strong>ard error <strong>of</strong><br />
the estimated number <strong>of</strong> 33,916,000 sportspersons 16 years old <strong>and</strong> older is<br />
2<br />
s x<br />
0. 000027 33, 916, 000 6, 125 33, 916, 000 420,<br />
330<br />
The 95-percent confidence interval for the estimated number <strong>of</strong> sportspersons 16 years old <strong>and</strong> older is from 33,092,000 to<br />
34,740,000, i.e., 33,916,000 ± 1.96 x 420,330. Therefore, a conclusion that the average estimate derived from all possible<br />
samples lies within a range computed in this way would be correct for roughly 95 percent <strong>of</strong> all possible samples.<br />
Table 1 shows that 12,510,000 hunters 16 years old <strong>and</strong> older engaged in 219,925,000 days <strong>of</strong> participation in <strong>2006</strong>. Using<br />
formula (2) with the parameters a = –0.000235, b = –85,241, <strong>and</strong> c = 22,698 from table D-9, the approximate st<strong>and</strong>ard error<br />
on 219,925,000 estimated days on an estimated base <strong>of</strong> 12,510,000 hunters is<br />
2<br />
s x<br />
0. 000235 219, 925, 000 85, 241 219, 925,<br />
000 <br />
22, 698 219, 925,<br />
000<br />
12, 510,<br />
000<br />
2<br />
<br />
7592000 , ,<br />
The 95-percent confidence interval on the estimate <strong>of</strong> 219,925,000 days is from 205,044,000 to 234,806,000, i.e.,<br />
219,925,000 ± 1.96 x 7,592,000. Again, a conclusion that the average estimate derived from all possible samples lies within a<br />
range computed in this way would be correct for roughly 95 percent <strong>of</strong> all possible samples.<br />
St<strong>and</strong>ard Errors <strong>of</strong> Estimated Percentages. The reliability <strong>of</strong> an estimated percentage, computed using sample data for both<br />
numerator <strong>and</strong> denominator, depends on the size <strong>of</strong> the percentage <strong>and</strong> its base. Estimated percentages are relatively more<br />
reliable than the corresponding estimates <strong>of</strong> the numerators <strong>of</strong> the percentages, particularly if the percentages are 50 percent<br />
or more. When the numerator <strong>and</strong> the denominator <strong>of</strong> the percentage are in different categories, use the parameter in the<br />
tables indicated by the numerator.<br />
The approximate st<strong>and</strong>ard error, s x,p<br />
, can be obtained by use <strong>of</strong> the formula<br />
s<br />
x,<br />
p<br />
,p<br />
<br />
bp( 100 p)<br />
x<br />
Here, x is the total number <strong>of</strong> sportspersons, hunters, etc., which is the base <strong>of</strong> the percentage; p is the percentage<br />
(0 ≤ p ≤ 100); <strong>and</strong> b is the parameter in the tables associated with the characteristic in the numerator <strong>of</strong> the percentage.<br />
Illustration <strong>of</strong> the Computation <strong>of</strong> the St<strong>and</strong>ard Error <strong>of</strong> an Estimated Percentage<br />
Table 1 shows that <strong>of</strong> the 12,510,000 hunters 16 years old <strong>and</strong> older, 18.3 percent hunted migratory birds. From table D-7,<br />
the appropriate b parameter is 5,756. Using formula (3), the approximate st<strong>and</strong>ard error on the estimate <strong>of</strong> 18.3 percent is<br />
(3)<br />
152 <strong>2006</strong> <strong>National</strong> <strong>Survey</strong> <strong>of</strong> <strong>Fishing</strong>, <strong>Hunting</strong>, <strong>and</strong> <strong>Wildlife</strong>-<strong>Associated</strong> Recreation U.S. Fish & <strong>Wildlife</strong> Service
5, 756 18. 3 100 18.<br />
3<br />
,<br />
<br />
<br />
12, 510,<br />
000<br />
s xp<br />
Consequently, the 95-percent confidence interval for the estimate percentage <strong>of</strong> migratory bird hunters 16 years old <strong>and</strong> older<br />
is from 16.7 percent to 19.9 percent, i.e., 18.3 ± 1.96 x 0.83.<br />
St<strong>and</strong>ard Error <strong>of</strong> a Difference. The st<strong>and</strong>ard error <strong>of</strong> the difference between two sample estimates is approximately equal to<br />
s<br />
<br />
s s<br />
2 2<br />
x y x y<br />
where S x<br />
<strong>and</strong> S y<br />
are the st<strong>and</strong>ard errors <strong>of</strong> the estimates x <strong>and</strong> y. The estimates can be numbers, percentages, ratios, etc. This<br />
will represent the actual st<strong>and</strong>ard error quite accurately for the difference between estimates <strong>of</strong> the same characteristic in two<br />
different areas, or for the difference between separate <strong>and</strong> uncorrelated characteristics in the same area. However, if there is<br />
a high positive (negative) correlation between the two characteristics, the formula will overestimate (underestimate) the true<br />
st<strong>and</strong>ard error.<br />
Illustration <strong>of</strong> the Computation <strong>of</strong> the St<strong>and</strong>ard Error <strong>of</strong> a Difference<br />
In Table 8, <strong>of</strong> the 11,655,000 females in the age range <strong>of</strong> 18–24, 726,000 or 6.2 percent are sportspersons. Similarly, <strong>of</strong><br />
the 11,638,000 males in the same age range, 1,929,000 or 16.6 percent are sportspersons. The apparent difference between<br />
the percent <strong>of</strong> female <strong>and</strong> male participants is 10.4 percent. Using formula (3) <strong>and</strong> the appropriate b parameter from Table<br />
D-7, the approximate st<strong>and</strong>ard errors <strong>of</strong> 6.2 percent <strong>and</strong> 16.6 percent are 0.55 <strong>and</strong> 0.85, respectively. Using formula (4), the<br />
approximate st<strong>and</strong>ard error <strong>of</strong> the estimated difference <strong>of</strong> 10.4 percent is<br />
2 2<br />
s x<br />
y<br />
<br />
055 . 085 . 102 .<br />
The 95-percent confidence interval on the difference between 18-to-24-year-old female <strong>and</strong> male sportspersons is from 8.4 to<br />
12.4, i.e., 10.4 ± 1.96 x 1.02. Since the interval does not contain zero, we can conclude with 95 percent confidence that the<br />
percentage <strong>of</strong> 18-to-24-year-old female sportspersons is less than the percentage <strong>of</strong> 18-to-24-year-old male sportspersons.<br />
St<strong>and</strong>ard Errors <strong>of</strong> Estimated Averages. Certain mean values for sportspersons, anglers, etc., shown in the report were calculated<br />
as the ratio <strong>of</strong> two numbers. For example, average days per angler is calculated as:<br />
x<br />
y<br />
total days<br />
<br />
total anglers<br />
083 .<br />
St<strong>and</strong>ard errors for these averages may be approximated by the use <strong>of</strong> formula (5) below.<br />
(4)<br />
s<br />
x y<br />
In formula (5), r represents the correlation coefficient between the numerator <strong>and</strong> the denominator <strong>of</strong> the estimate. In the<br />
above formula, use 0.7 as an estimate <strong>of</strong> r.<br />
Illustration <strong>of</strong> the Computation <strong>of</strong> the St<strong>and</strong>ard Error <strong>of</strong> an Estimated Average<br />
<br />
x<br />
y<br />
s<br />
s<br />
r ss<br />
<br />
x <br />
<br />
<br />
y<br />
2<br />
xy<br />
2 2<br />
x y x y<br />
Table 2 shows that the average days per angler 16 years old <strong>and</strong> older for all fishing was 17.3 days. Using formulas (1) <strong>and</strong><br />
(2) above, we compute the st<strong>and</strong>ard error on total days, 516,781,000, <strong>and</strong> total anglers, 29,952,000, to be 15,828,079 <strong>and</strong><br />
399,342, respectively. The approximate st<strong>and</strong>ard error on the estimated average <strong>of</strong> 17.3 days is<br />
(5)<br />
s xy<br />
<br />
516, 781,<br />
000<br />
29, 952,<br />
000<br />
2 2<br />
158, 280,<br />
079 <br />
<br />
<br />
<br />
399,<br />
342 <br />
15, 828, 079 399,<br />
342<br />
2 07 .<br />
516, 781,<br />
000 29, 952,<br />
000<br />
516, 781, 000 29, 952,<br />
000<br />
<br />
040 .<br />
Therefore, the 95-percent confidence interval on the estimated average <strong>of</strong> 17.3 days is from<br />
16.5 to 18.0, i.e., 17.3 ± 1.96 x 0.40.<br />
U.S. Fish & <strong>Wildlife</strong> Service <strong>2006</strong> <strong>National</strong> <strong>Survey</strong> <strong>of</strong> <strong>Fishing</strong>, <strong>Hunting</strong>, <strong>and</strong> <strong>Wildlife</strong>-<strong>Associated</strong> Recreation 153
Table D-1. Approximate St<strong>and</strong>ard Errors <strong>and</strong> 95-Percent Confidence Intervals for Selected <strong>Fishing</strong><br />
Estimates: <strong>2006</strong><br />
Anglers, days, <strong>and</strong> expenditures Estimate St<strong>and</strong>ard error Lower 95 percent Upper 95 percent<br />
ANGLERS (thous<strong>and</strong>s)<br />
Total ................................................. 29,952 399 29,169 30,735<br />
Freshwater .......................................... 25,431 372 24,702 26,160<br />
Freshwater, except Great Lakes........................ 25,035 370 24,311 25,759<br />
Great Lakes ....................................... 1,420 93 1,238 1,602<br />
Saltwater............................................ 7,717 214 7,298 8,136<br />
DAYS OF FISHING (thous<strong>and</strong>s)<br />
Total ................................................. 516,781 15,828 485,758 547,804<br />
Freshwater .......................................... 433,337 14,153 405,597 461,077<br />
Freshwater, except Great Lakes........................ 419,942 13,797 392,900 446,984<br />
Great Lakes ....................................... 18,016 2,222 13,661 22,371<br />
Saltwater............................................ 85,663 4,641 76,566 94,760<br />
Average Days Per Angler<br />
Total ................................................. 17.3 0.4 16.5 18.0<br />
Freshwater .......................................... 17.0 0.4 16.2 17.9<br />
Freshwater, except Great Lakes........................ 16.8 0.4 16.0 17.6<br />
Great Lakes ....................................... 12.7 1.1 10.4 14.9<br />
Saltwater............................................ 11.1 0.4 10.2 12.0<br />
FISHING EXPENDITURES (thous<strong>and</strong>s <strong>of</strong> dollars)<br />
Total 1 ................................................ 42,011,124 1,257,135 39,547,139 44,475,109<br />
Freshwater .......................................... 26,348,217 858,427 24,665,699 28,030,735<br />
Freshwater, except Great Lakes........................ 24,581,671 808,752 22,996,516 26,166,826<br />
Great Lakes ....................................... 1,507,656 193,877 1,127,657 1,887,655<br />
Saltwater............................................ 8,879,948 514,207 7,872,103 9,887,793<br />
Average Expenditures Per Angler (dollars)<br />
Total 1 ................................................ 1,403 32 1,340 1,466<br />
Freshwater .......................................... 1,036 26 986 1,086<br />
Freshwater, except Great Lakes........................ 982 24 934 1,030<br />
Great Lakes ....................................... 1,062 101 864 1,260<br />
Saltwater............................................ 1,151 50 1,053 1,248<br />
1 The total expenditures line includes ‘‘other’’ expenditures, such as membership dues, contributions, <strong>and</strong> licenses, while the type <strong>of</strong> fishing expenditure lines include triprelated<br />
<strong>and</strong> equipment expenditures only.<br />
154 <strong>2006</strong> <strong>National</strong> <strong>Survey</strong> <strong>of</strong> <strong>Fishing</strong>, <strong>Hunting</strong>, <strong>and</strong> <strong>Wildlife</strong>-<strong>Associated</strong> Recreation U.S. Fish & <strong>Wildlife</strong> Service
Table D-2. Approximate St<strong>and</strong>ard Errors <strong>and</strong> 95-Percent Confidence Intervals for Selected <strong>Hunting</strong><br />
Estimates: <strong>2006</strong><br />
Hunters, days, <strong>and</strong> expenditures Estimate St<strong>and</strong>ard error Lower 95 percent Upper 95 percent<br />
HUNTERS (thous<strong>and</strong>s)<br />
Total ................................................. 12,510 261 11,999 13,021<br />
Big game ........................................... 10,682 242 10,207 11,157<br />
Small game.......................................... 4,797 164 4,475 5,119<br />
Migratory bird ....................................... 2,293 114 2,069 2,517<br />
Other animals ........................................ 1,128 80 970 1,286<br />
DAYS OF HUNTING (thous<strong>and</strong>s)<br />
Total ................................................. 219,925 7,592 205,045 234,805<br />
Big game ........................................... 164,061 6,073 152,158 175,964<br />
Small game.......................................... 52,395 2,807 46,894 57,896<br />
Migratory bird ....................................... 19,770 1,446 16,935 22,605<br />
Other animals ........................................ 15,205 1,817 11,644 18,766<br />
Average Days Per Hunter<br />
Total ................................................. 17.6 0.4 16.7 18.4<br />
Big game ........................................... 15.4 0.4 14.6 16.2<br />
Small game.......................................... 10.9 0.4 10.1 11.7<br />
Migratory bird ....................................... 8.6 0.5 7.7 9.5<br />
Other animals ........................................ 13.5 1.2 11.2 15.8<br />
HUNTING EXPENDITURES (thous<strong>and</strong>s <strong>of</strong> dollars)<br />
Total 1 ................................................ 22,893,156 1,097,899 20,741,273 25,045,039<br />
Big game ........................................... 11,754,122 601,296 10,575,582 12,932,662<br />
Small game.......................................... 2,365,778 166,802 2,038,845 2,692,711<br />
Migratory bird ....................................... 1,349,148 128,833 1,096,636 1,601,660<br />
Other animals ........................................ 207,856 29,591 149,857 265,855<br />
Average Expenditures Per Hunter (dollars)<br />
Total 1 ................................................ 1,830 67 1,699 1,961<br />
Big game ........................................... 1,100 43 1,017 1,184<br />
Small game.......................................... 493 26 442 544<br />
Migratory bird ....................................... 588 41 507 669<br />
Other animals ........................................ 184 19 146 222<br />
1 The total expenditures line includes ‘‘other’’ expenditures, such as membership dues, contributions, <strong>and</strong> licenses, while the type <strong>of</strong> hunting expenditure lines include triprelated<br />
<strong>and</strong> equipment expenditures only.<br />
U.S. Fish & <strong>Wildlife</strong> Service <strong>2006</strong> <strong>National</strong> <strong>Survey</strong> <strong>of</strong> <strong>Fishing</strong>, <strong>Hunting</strong>, <strong>and</strong> <strong>Wildlife</strong>-<strong>Associated</strong> Recreation 155
Table D-3. Approximate St<strong>and</strong>ard Errors <strong>and</strong> 95-Percent Confidence Intervals for Selected <strong>Fishing</strong> <strong>and</strong><br />
<strong>Hunting</strong> Expenditure Estimates: <strong>2006</strong><br />
(Thous<strong>and</strong>s <strong>of</strong> dollars)<br />
Expenditures Estimate St<strong>and</strong>ard error Lower 95 percent Upper 95 percent<br />
FISHING AND HUNTING EXPENDITURES<br />
Total ................................................. 76,650,027 2,166,932 72,402,840 80,897,214<br />
Trip-related .......................................... 24,557,174 714,964 23,155,846 25,958,502<br />
Food <strong>and</strong> lodging ..................................... 9,093,769 279,376 8,546,191 9,641,347<br />
Transportation........................................ 7,658,755 233,992 7,200,130 8,117,380<br />
Other trip costs....................................... 7,804,650 252,636 7,309,484 8,299,816<br />
Equipment<br />
<strong>Fishing</strong> ............................................. 5,365,933 188,904 4,995,681 5,736,185<br />
<strong>Hunting</strong> ............................................ 5,716,758 273,637 5,180,429 6,253,087<br />
Auxiliary............................................ 2,969,992 143,901 2,687,945 3,252,039<br />
Special ............................................. 26,910,442 2,260,113 22,480,620 31,340,264<br />
Other<br />
Books, magazine subscriptions .......................... 304,181 16,416 272,006 336,356<br />
Membership dues <strong>and</strong> contributions ...................... 593,242 41,212 512,467 674,017<br />
L<strong>and</strong> leasing <strong>and</strong> ownership ............................ 8,986,342 902,640 7,217,168 10,755,516<br />
Licenses, stamps, tags, <strong>and</strong> permits ...................... 1,245,963 39,478 1,168,586 1,323,340<br />
<strong>Fishing</strong> Expenditures<br />
Total ................................................. 42,011,124 1,257,135 39,547,139 44,475,109<br />
Trip-related .......................................... 17,878,560 552,205 16,796,238 18,960,882<br />
Food <strong>and</strong> lodging ..................................... 6,302,524 206,999 5,896,805 6,708,243<br />
Transportation........................................ 4,961,830 163,180 4,641,996 5,281,664<br />
Other trip costs....................................... 6,614,205 218,667 6,185,617 7,042,793<br />
Equipment<br />
<strong>Fishing</strong> ............................................. 5,332,401 188,871 4,962,214 5,702,588<br />
Auxiliary............................................ 778,740 58,892 663,312 894,168<br />
Special ............................................. 12,646,229 1,404,577 9,893,258 15,399,200<br />
Other<br />
Books, magazine subscriptions .......................... 115,019 9,174 97,038 133,000<br />
Membership dues <strong>and</strong> contributions. ..................... 157,728 19,181 120,133 195,323<br />
L<strong>and</strong> leasing <strong>and</strong> ownership ............................ 4,598,988 783,665 3,063,004 6,134,972<br />
Licenses, stamps, tags, <strong>and</strong> permits ...................... 503,460 16,857 470,420 536,500<br />
<strong>Hunting</strong> Expenditures<br />
Total ................................................. 22,893,156 1,097,899 20,741,273 25,045,039<br />
Trip-related .......................................... 6,678,614 329,123 6,033,533 7,323,695<br />
Food <strong>and</strong> lodging ..................................... 2,791,245 140,998 2,514,888 3,067,602<br />
Transportation........................................ 2,696,924 133,733 2,434,807 2,959,041<br />
Other trip costs....................................... 1,190,445 88,756 1,016,483 1,364,407<br />
Equipment<br />
<strong>Hunting</strong>............................................. 5,366,357 277,519 4,822,419 5,910,295<br />
Auxiliary............................................ 1,330,216 90,892 1,152,068 1,508,364<br />
Special ............................................. 4,034,928 749,373 2,566,157 5,503,699<br />
Other<br />
Books, magazine subscriptions .......................... 83,524 6,323 71,132 95,916<br />
Membership dues <strong>and</strong> contributions ...................... 269,660 26,130 218,444 320,876<br />
L<strong>and</strong> leasing <strong>and</strong> ownership ............................ 4,387,354 468,754 3,468,597 5,306,111<br />
Licenses, stamps, tags, <strong>and</strong> permits ...................... 742,503 34,036 675,793 809,213<br />
156 <strong>2006</strong> <strong>National</strong> <strong>Survey</strong> <strong>of</strong> <strong>Fishing</strong>, <strong>Hunting</strong>, <strong>and</strong> <strong>Wildlife</strong>-<strong>Associated</strong> Recreation U.S. Fish & <strong>Wildlife</strong> Service
Table D-4. Approximate St<strong>and</strong>ard Errors <strong>and</strong> 95-Percent Confidence Intervals for Selected<br />
<strong>Wildlife</strong>-Watching Estimates: <strong>2006</strong><br />
Participants <strong>and</strong> expenditures Estimate St<strong>and</strong>ard error Lower 95 percent Upper 95 percent<br />
WILDLIFE-WATCHING PARTICIPANTS (thous<strong>and</strong>s)<br />
Total ................................................. 71,132 808 69,548 72,716<br />
Away from home ..................................... 22,977 525 21,949 24,005<br />
Observe wildlife.................................... 21,546 510 20,547 22,545<br />
Photograph wildlife ................................. 11,708 385 10,954 12,462<br />
Feed wildlife ...................................... 7,084 302 6,491 7,677<br />
Around the home ..................................... 67,756 797 66,193 69,319<br />
Observe wildlife.................................... 44,467 691 43,113 45,821<br />
Photograph wildlife ................................. 18,763 479 17,824 19,702<br />
Feed wildlife ...................................... 55,512 749 54,045 56,979<br />
Visit public parks ................................... 13,271 408 12,471 14,071<br />
Maintain natural areas or plantings..................... 14,508 425 13,674 15,342<br />
DAYS OF PARTICIPATION IN AWAY-FROM-HOME<br />
ACTIVITIES (thous<strong>and</strong>s)<br />
Total ................................................. 352,070 23,204 306,589 397,551<br />
Observe wildlife...................................... 291,027 20,962 249,942 332,112<br />
Photograph wildlife ................................... 103,872 12,238 79,886 127,858<br />
Feed wildlife ........................................ 77,329 10,439 56,868 97,790<br />
Average Days <strong>of</strong> Participation in Away-From-Home<br />
Activities<br />
Total ................................................. 15.3 0.8 13.7 16.9<br />
Observe wildlife...................................... 13.5 0.8 12.0 15.0<br />
Photograph wildlife ................................... 8.9 0.9 7.2 10.6<br />
Feed wildlife ........................................ 10.9 1.2 8.6 13.3<br />
EXPENDITURES (thous<strong>and</strong>s <strong>of</strong> dollars)<br />
Total ................................................. 45,654,960 1,682,661 42,356,945 48,952,975<br />
Trip-related .......................................... 12,875,152 766,956 11,371,918 14,378,386<br />
Food <strong>and</strong> lodging ................................... 7,516,281 482,580 6,570,424 8,462,138<br />
Transportation...................................... 4,456,013 267,023 3,932,647 4,979,379<br />
Other trip costs..................................... 902,858 79,026 747,967 1,057,749<br />
Equipment <strong>and</strong> other expenses .......................... 32,779,808 1,083,752 30,655,654 34,903,962<br />
<strong>Wildlife</strong>-watching equipment.......................... 9,869,727 374,202 9,136,291 10,603,163<br />
Auxiliary equipment ................................ 1,033,060 117,461 802,836 1,263,284<br />
Special equipment .................................. 12,271,266 2,301,238 7,760,839 16,781,693<br />
Magazines, books................................... 359,681 22,995 314,611 404,751<br />
L<strong>and</strong> leasing <strong>and</strong> ownership .......................... 6,551,517 1,819,034 2,986,211 10,116,823<br />
Membership dues <strong>and</strong> contributions .................... 1,052,496 91,539 873,080 1,231,912<br />
Plantings .......................................... 1,642,061 162,142 1,324,262 1,959,860<br />
U.S. Fish & <strong>Wildlife</strong> Service <strong>2006</strong> <strong>National</strong> <strong>Survey</strong> <strong>of</strong> <strong>Fishing</strong>, <strong>Hunting</strong>, <strong>and</strong> <strong>Wildlife</strong>-<strong>Associated</strong> Recreation 157
Table D-5. Approximate St<strong>and</strong>ard Errors <strong>and</strong> 95-Percent Confidence Intervals for Participants in<br />
<strong>Wildlife</strong>-Related Recreation by Participant’s State <strong>of</strong> Residence: <strong>2006</strong><br />
(Numbers in thous<strong>and</strong>s)<br />
Participant’s state <strong>of</strong> residence Total participants St<strong>and</strong>ard error Lower 95 percent Upper 95 percent<br />
United States, total................................... 87,465 864 85,772 89,158<br />
Alabama .............................................. 1,417 83 1,253 1,581<br />
Alaska. ............................................... 288 21 248 328<br />
Arizona ............................................... 1,233 68 1,099 1,367<br />
Arkansas .............................................. 1,082 71 943 1,221<br />
California ............................................. 6,804 292 6,232 7,376<br />
Colorado .............................................. 1,735 98 1,543 1,927<br />
Connecticut............................................ 1,223 55 1,115 1,331<br />
Delaware.............................................. 256 15 227 285<br />
Florida ............................................... 4,626 216 4,202 5,050<br />
Georgia ............................................... 2,415 151 2,118 2,712<br />
Hawaii ............................................... 227 18 191 263<br />
Idaho. ................................................ 564 45 475 653<br />
Illinois. ............................................... 2,886 154 2,584 3,188<br />
Indiana ............................................... 2,279 112 2,059 2,499<br />
Iowa ................................................. 1,306 75 1,159 1,453<br />
Kansas ............................................... 979 52 876 1,082<br />
Kentucky ............................................. 1,667 96 1,479 1,855<br />
Louisiana ............................................. 1,106 78 953 1,259<br />
Maine ................................................ 717 40 639 795<br />
Maryl<strong>and</strong> ............................................. 1,549 81 1,391 1,707<br />
Massachusetts.......................................... 1,931 80 1,775 2,087<br />
Michigan.............................................. 3,651 213 3,233 4,069<br />
Minnesota ............................................. 2,480 143 2,200 2,760<br />
Mississippi ............................................ 896 69 760 1,032<br />
Missouri .............................................. 2,496 125 2,251 2,741<br />
Montana .............................................. 510 29 452 568<br />
Nebraska.............................................. 552 29 494 610<br />
Nevada ............................................... 530 41 450 610<br />
New Hampshire ........................................ 527 25 479 575<br />
New Jersey ............................................ 1,826 88 1,653 1,999<br />
New Mexico........................................... 601 35 533 669<br />
NewYork............................................. 4,103 239 3,634 4,572<br />
North Carolina ......................................... 2,816 127 2,566 3,066<br />
North Dakota .......................................... 232 18 198 266<br />
Ohio ................................................. 4,022 192 3,647 4,397<br />
Oklahoma ............................................. 1,372 87 1,201 1,543<br />
Oregon ............................................... 1,531 93 1,349 1,713<br />
Pennsylvania........................................... 4,165 210 3,754 4,576<br />
Rhode Isl<strong>and</strong> .......................................... 355 16 324 386<br />
South Carolina ......................................... 1,283 76 1,134 1,432<br />
South Dakota .......................................... 327 23 282 372<br />
Tennessee ............................................. 2,287 118 2,055 2,519<br />
Texas. ................................................ 5,481 374 4,748 6,214<br />
Utah ................................................. 764 53 660 868<br />
Vermont .............................................. 311 16 280 342<br />
Virginia............................................... 2,500 135 2,235 2,765<br />
Washington............................................ 2,315 86 2,147 2,483<br />
West Virginia .......................................... 735 56 625 845<br />
Wisconsin ............................................. 2,217 131 1,961 2,473<br />
Wyoming ............................................. 229 18 194 264<br />
158 <strong>2006</strong> <strong>National</strong> <strong>Survey</strong> <strong>of</strong> <strong>Fishing</strong>, <strong>Hunting</strong>, <strong>and</strong> <strong>Wildlife</strong>-<strong>Associated</strong> Recreation U.S. Fish & <strong>Wildlife</strong> Service
Table D-6. Parameters a <strong>and</strong> b for Calculating Approximate St<strong>and</strong>ard Errors <strong>of</strong> Sportspersons, Anglers,<br />
Hunters, <strong>and</strong> <strong>Wildlife</strong>-Watching Participants<br />
(These parameters are to be used only to calculate estimates <strong>of</strong> st<strong>and</strong>ard errors for characteristics developed from the screening sample)<br />
State<br />
6 years <strong>and</strong> older 6-to-15-year-olds only<br />
a b a b<br />
United States, total................................... –0.000015 4,173 –0.000365 14,798<br />
Alabama .............................................. –0.000523 2,173 –0.014402 8,642<br />
Alaska................................................ –0.001157 697 –0.024644 2,566<br />
Arizona ............................................... –0.000399 2,178 –0.008468 7,441<br />
Arkansas .............................................. –0.001116 2,820 –0.026111 9,698<br />
California ............................................. –0.000126 4,134 –0.003139 16,914<br />
Colorado .............................................. –0.000573 2,435 –0.019382 12,522<br />
Connecticut............................................ –0.000313 1,005 –0.008787 4,151<br />
Delaware.............................................. –0.000510 396 –0.014882 1,597<br />
Florida ............................................... –0.000266 4,389 –0.006122 13,852<br />
Georgia ............................................... –0.000568 4,653 –0.012587 16,121<br />
Hawaii ............................................... –0.000437 517 –0.009528 1,602<br />
Idaho................................................. –0.001346 1,759 –0.042091 8,654<br />
Illinois................................................ –0.000296 3,416 –0.007029 12,542<br />
Indiana ............................................... –0.000488 2,782 –0.012165 10,911<br />
Iowa ................................................. –0.000762 2,062 –0.020347 7,491<br />
Kansas ............................................... –0.000537 1,329 –0.016690 6,138<br />
Kentucky ............................................. –0.000772 2,935 –0.018308 9,902<br />
Louisiana ............................................. –0.000775 3,143 –0.017795 11,036<br />
Maine ................................................ –0.000924 1,135 –0.030300 4,683<br />
Maryl<strong>and</strong> ............................................. –0.000357 1,821 –0.008162 6,298<br />
Massachusetts.......................................... –0.000261 1,521 –0.007130 5,692<br />
Michigan.............................................. –0.000685 6,318 –0.018937 26,784<br />
Minnesota ............................................. –0.001009 4,733 –0.029835 20,037<br />
Mississippi ............................................ –0.000757 1,982 –0.016992 6,865<br />
Missouri .............................................. –0.000670 3,534 –0.018329 13,847<br />
Montana .............................................. –0.001418 1,227 –0.033110 3,719<br />
Nebraska.............................................. –0.000567 902 –0.014086 3,277<br />
Nevada ............................................... –0.000515 1,159 –0.011577 4,097<br />
New Hampshire ........................................ –0.000535 650 –0.015945 2,744<br />
New Jersey ............................................ –0.000209 1,655 –0.005070 6,099<br />
New Mexico........................................... –0.000620 1,097 –0.016872 4,557<br />
NewYork............................................. –0.000320 5,582 –0.009275 22,967<br />
North Carolina ......................................... –0.000416 3,286 –0.011916 14,068<br />
North Dakota .......................................... –0.001096 637 –0.036240 2,677<br />
Ohio ................................................. –0.000484 5,045 –0.011219 17,172<br />
Oklahoma ............................................. –0.000744 2,389 –0.020948 9,767<br />
Oregon ............................................... –0.000752 2,533 –0.024824 11,839<br />
Pennsylvania........................................... –0.000544 6,176 –0.014615 22,903<br />
Rhode Isl<strong>and</strong> .......................................... –0.000315 308 –0.008710 1,182<br />
South Carolina ......................................... –0.000560 2,174 –0.016004 9,034<br />
South Dakota .......................................... –0.001061 745 –0.025331 2,568<br />
Tennessee ............................................. –0.000565 3,084 –0.015267 11,667<br />
Texas................................................. –0.000466 9,557 –0.011141 38,300<br />
Utah ................................................. –0.000700 1,541 –0.018090 7,116<br />
Vermont .............................................. –0.001053 611 –0.032724 2,420<br />
Virginia............................................... –0.000450 3,102 –0.014313 14,311<br />
Washington............................................ –0.000349 2,031 –0.010251 8,539<br />
West Virginia .......................................... –0.001092 1,823 –0.042234 8,929<br />
Wisconsin ............................................. –0.000820 4,156 –0.021060 15,086<br />
Wyoming ............................................. –0.001268 592 –0.028116 1,742<br />
U.S. Fish & <strong>Wildlife</strong> Service <strong>2006</strong> <strong>National</strong> <strong>Survey</strong> <strong>of</strong> <strong>Fishing</strong>, <strong>Hunting</strong>, <strong>and</strong> <strong>Wildlife</strong>-<strong>Associated</strong> Recreation 159
Table D-7. Parameters a <strong>and</strong> b for Calculating Approximate St<strong>and</strong>ard Errors for Levels for the Detailed<br />
Sportspersons Sample<br />
State<br />
Sportspersons <strong>and</strong> anglers 16 years <strong>and</strong> older<br />
Hunters 16 years <strong>and</strong> older<br />
a b a b<br />
United States, total............................. –0.000027 6,125 –0.000025 5,756<br />
Alabama ........................................ –0.000936 3,324 –0.000921 3,268<br />
Alaska. ......................................... –0.002197 1,096 –0.002013 1,004<br />
Arizona ......................................... –0.000641 2,941 –0.000403 1,849<br />
Arkansas ........................................ –0.001833 3,951 –0.001705 3,674<br />
California ....................................... –0.000239 6,523 –0.000213 5,801<br />
Colorado ........................................ –0.000960 3,459 –0.000735 2,650<br />
Connecticut...................................... –0.000545 1,490 –0.000514 1,407<br />
Delaware........................................ –0.000758 507 –0.000720 482<br />
Florida ......................................... –0.000415 5,911 –0.000347 4,943<br />
Georgia ......................................... –0.000965 6,668 –0.000752 5,199<br />
Hawaii ......................................... –0.000763 774 –0.000751 761<br />
Idaho. .......................................... –0.002486 2,738 –0.001888 2,080<br />
Illinois. ......................................... –0.000430 4,201 –0.000388 3,789<br />
Indiana ......................................... –0.000821 3,939 –0.000777 3,729<br />
Iowa ........................................... –0.001383 3,234 –0.001535 3,589<br />
Kansas ......................................... –0.001097 2,315 –0.001433 3,024<br />
Kentucky ....................................... –0.001222 3,983 –0.001048 3,415<br />
Louisiana ....................................... –0.001300 4,464 –0.001271 4,365<br />
Maine .......................................... –0.001560 1,675 –0.001469 1,578<br />
Maryl<strong>and</strong> ....................................... –0.000552 2,392 –0.000456 1,975<br />
Massachusetts.................................... –0.000412 2,072 –0.000383 1,929<br />
Michigan........................................ –0.001085 8,470 –0.001214 9,474<br />
Minnesota ....................................... –0.001694 6,812 –0.001504 6,049<br />
Mississippi ...................................... –0.001355 3,000 –0.001169 2,588<br />
Missouri ........................................ –0.001031 4,662 –0.001067 4,825<br />
Montana ........................................ –0.002523 1,899 –0.002383 1,793<br />
Nebraska........................................ –0.001066 1,449 –0.001236 1,680<br />
Nevada ......................................... –0.000898 1,703 –0.000823 1,561<br />
New Hampshire .................................. –0.000801 836 –0.000774 808<br />
New Jersey ...................................... –0.000327 2,200 –0.000251 1,690<br />
New Mexico..................................... –0.001323 1,984 –0.001264 1,895<br />
NewYork....................................... –0.000456 6,842 –0.000378 5,671<br />
North Carolina ................................... –0.000713 4,794 –0.000588 3,951<br />
North Dakota .................................... –0.001558 791 –0.001754 890<br />
Ohio ........................................... –0.000851 7,569 –0.000697 6,194<br />
Oklahoma ....................................... –0.001278 3,504 –0.001303 3,574<br />
Oregon ......................................... –0.001291 3,730 –0.001024 2,957<br />
Pennsylvania..................................... –0.000867 8,490 –0.001030 10,089<br />
Rhode Isl<strong>and</strong> .................................... –0.000487 410 –0.000425 358<br />
South Carolina ................................... –0.000983 3,259 –0.000981 3,251<br />
South Dakota .................................... –0.001728 1,038 –0.001532 920<br />
Tennessee ....................................... –0.001019 4,790 –0.000929 4,367<br />
Texas. .......................................... –0.000859 14,660 –0.000725 12,388<br />
Utah ........................................... –0.001453 2,627 –0.001268 2,292<br />
Vermont ........................................ –0.001514 766 –0.001403 710<br />
Virginia......................................... –0.000885 5,215 –0.001105 6,510<br />
Washington...................................... –0.000626 3,116 –0.000676 3,368<br />
West Virginia .................................... –0.001844 2,688 –0.001712 2,496<br />
Wisconsin ....................................... –0.001281 5,572 –0.001144 4,978<br />
Wyoming ....................................... –0.003226 1,306 –0.002251 911<br />
160 <strong>2006</strong> <strong>National</strong> <strong>Survey</strong> <strong>of</strong> <strong>Fishing</strong>, <strong>Hunting</strong>, <strong>and</strong> <strong>Wildlife</strong>-<strong>Associated</strong> Recreation U.S. Fish & <strong>Wildlife</strong> Service
Table D-8. Parameters a, b, <strong>and</strong> c for Calculating Approximate St<strong>and</strong>ard Errors for Expenditures for the<br />
Detailed Sportspersons Sample<br />
State<br />
Sportspersons <strong>and</strong> anglers 16 years <strong>and</strong> older<br />
Hunters 16 years <strong>and</strong> older<br />
a b c a b c<br />
United States, total....................... 0.000118 –150,479 22,234 0.000918 –401,912 17,005<br />
Alabama .................................. 0.019700 –12,417 5,855 0.016799 –96,800 6,317<br />
Alaska.................................... 0.030420 –2,004 1,057 0.031018 –14,867 1,091<br />
Arizona ................................... 0.036222 –2,002 2,994 0.069395 –74,101 2,742<br />
Arkansas .................................. 0.024408 –27,794 6,433 0.010107 –101,205 7,942<br />
California ................................. 0.018462 –35,800 10,686 0.027550 –58,262 9,255<br />
Colorado .................................. 0.008867 676 5,062 0.034102 –27,935 4,373<br />
Connecticut................................ 0.036498 –11,421 2,841 0.096937 –60,991 2,564<br />
Delaware.................................. 0.031385 –1,643 734 0.018489 –3,855 719<br />
Florida ................................... 0.014951 –23,048 9,553 0.021932 –407,268 10,425<br />
Georgia ................................... 0.022339 –47,820 8,031 0.051440 –143,590 7,061<br />
Hawaii ................................... 0.065152 –5,771 830 0.123487 –5,097 588<br />
Idaho..................................... 0.034640 9,981 3,224 0.023728 –69,369 3,841<br />
Illinois.................................... 0.017187 6,704 5,219 0.024778 74,958 3,321<br />
Indiana ................................... 0.027022 –16,160 4,558 0.042674 –61,618 4,557<br />
Iowa ..................................... 0.033205 22,341 2,171 0.045665 –41,343 1,583<br />
Kansas ................................... 0.034206 –23,245 3,454 0.042600 –116,049 4,343<br />
Kentucky ................................. 0.051496 –17,125 5,942 0.025277 –89,098 6,822<br />
Louisiana ................................. 0.023308 –66,118 7,237 0.027891 135,631 6,412<br />
Maine .................................... 0.022050 –7,457 2,175 0.021630 –12,360 2,038<br />
Maryl<strong>and</strong> ................................. 0.015599 –14,663 3,208 0.018873 –30,982 2,820<br />
Massachusetts.............................. 0.049013 –25,362 3,792 0.138120 –47,649 2,049<br />
Michigan.................................. 0.035078 –148,672 13,535 0.039658 –147,585 12,587<br />
Minnesota ................................. 0.028185 –92,976 11,279 0.027553 –263,285 12,919<br />
Mississippi ................................ 0.026713 –53,218 5,433 0.014058 –97,282 6,390<br />
Missouri .................................. 0.011821 –40,950 10,804 –0.005607 –190,726 17,070<br />
Montana .................................. 0.024760 –9,845 2,520 0.020119 –99,543 3,580<br />
Nebraska.................................. 0.018618 1,031 1,640 0.022265 –22,187 1,472<br />
Nevada ................................... 0.048609 –9,688 1,387 0.102222 –32,513 1,074<br />
New Hampshire ............................ 0.025253 –6,176 1,434 0.037780 –26,900 1,448<br />
New Jersey ................................ 0.019672 –39,093 4,262 0.029909 –90,209 3,910<br />
New Mexico............................... 0.084483 2,232 1,181 0.096226 20,132 683<br />
NewYork................................. 0.039569 –84,193 13,133 0.069695 –128,553 12,761<br />
North Carolina ............................. 0.029775 –35,783 6,154 0.035333 –15,128 5,717<br />
North Dakota .............................. 0.033611 –586 751 0.032562 6,176 804<br />
Ohio ..................................... 0.031480 –41,813 11,082 0.040646 –140,259 8,710<br />
Oklahoma ................................. 0.023920 –27,206 4,719 0.020041 –31,920 5,066<br />
Oregon ................................... 0.029208 –11,360 5,033 0.019440 –76,401 4,937<br />
Pennsylvania............................... 0.011981 –92,207 15,295 0.014951 –17,951 14,434<br />
Rhode Isl<strong>and</strong> .............................. 0.033545 –2,922 634 0.053976 –12,463 565<br />
South Carolina ............................. 0.082716 –96,641 6,922 0.191600 –23,834 2,573<br />
South Dakota .............................. 0.030933 682 1,071 0.018421 –25,518 1,356<br />
Tennessee ................................. 0.027200 67,423 6,450 0.029272 –98,688 7,535<br />
Texas..................................... 0.032817 –69,604 20,795 0.027826 –146,956 22,831<br />
Utah ..................................... 0.033896 –13,369 2,671 0.024396 –195,230 4,439<br />
Vermont .................................. 0.022379 –4,177 1,337 0.026395 –21,534 1,476<br />
Virginia................................... 0.035897 –28,532 5,705 0.032298 –68,680 6,293<br />
Washington................................ 0.026464 –45,106 5,612 0.081551 81,860 1,611<br />
West Virginia .............................. 0.086611 –39,384 2,945 0.103915 –184,675 4,610<br />
Wisconsin ................................. 0.017762 –81,329 10,849 0.029543 –54,069 8,015<br />
Wyoming ................................. 0.075474 –5,404 1,197 0.090886 12,235 847<br />
U.S. Fish & <strong>Wildlife</strong> Service <strong>2006</strong> <strong>National</strong> <strong>Survey</strong> <strong>of</strong> <strong>Fishing</strong>, <strong>Hunting</strong>, <strong>and</strong> <strong>Wildlife</strong>-<strong>Associated</strong> Recreation 161
Table D-9. Parameters a, b, <strong>and</strong> c for Calculating Approximate St<strong>and</strong>ard Errors for Days or Trips for the<br />
Detailed Sportspersons Sample<br />
State<br />
Sportspersons <strong>and</strong> anglers 16 years <strong>and</strong> older<br />
Hunters 16 years <strong>and</strong> older<br />
a b c a b c<br />
United States, total....................... 0.000211 –23,610 23,157 –0.000235 –85,241 22,698<br />
Alabama .................................. 0.027360 –4,011 4,995 0.035544 –6,621 5,383<br />
Alaska. ................................... 0.016117 –432 1,681 0.027498 8 1,622<br />
Arizona ................................... 0.065842 –511 1,775 0.053516 –8,367 2,773<br />
Arkansas .................................. 0.013952 –12,325 8,675 0.024038 –5,931 6,861<br />
California ................................. 0.010707 –16,022 13,917 0.028439 –23,877 12,350<br />
Colorado .................................. 0.019267 4,638 3,198 0.017940 128 3,608<br />
Connecticut................................ 0.034363 –781 1,504 0.024306 –1,047 1,829<br />
Delaware.................................. 0.061308 –234 527 0.058226 –184 529<br />
Florida ................................... 0.010264 –17,862 11,170 0.022310 21,695 5,794<br />
Georgia ................................... 0.040208 –10,805 6,234 0.044845 16,702 1,853<br />
Hawaii ................................... 0.034563 –1,603 1,552 0.212584 –1,169 945<br />
Idaho. .................................... 0.069064 –15,482 4,996 0.024568 –5,756 3,301<br />
Illinois. ................................... 0.005932 –8,487 9,365 0.001562 –38,372 13,100<br />
Indiana ................................... 0.006553 –5,775 6,973 0.018011 –6,028 6,053<br />
Iowa ..................................... 0.026962 –7,704 4,252 0.037766 –10,398 4,032<br />
Kansas ................................... 0.015744 –2,510 4,078 0.046706 –21,946 6,195<br />
Kentucky ................................. 0.015099 –6,026 7,313 –0.014871 –7,130 8,307<br />
Louisiana ................................. 0.004012 –4,767 6,568 0.022152 –3,240 5,213<br />
Maine .................................... 0.030520 –7,661 3,270 0.003096 –10,278 3,842<br />
Maryl<strong>and</strong> ................................. 0.017639 –6,240 3,697 0.011515 –6,512 3,608<br />
Massachusetts.............................. 0.027491 –3,619 4,355 0.044116 –8,700 5,301<br />
Michigan.................................. 0.011920 –23,905 20,643 0.025076 23,642 7,030<br />
Minnesota ................................. 0.035500 –7,447 10,504 0.027723 –23,061 14,333<br />
Mississippi ................................ 0.015625 –10,362 5,357 –0.000218 –2,695 4,394<br />
Missouri .................................. 0.019454 –11,342 12,042 0.010034 –70,146 19,451<br />
Montana .................................. 0.018290 –1,849 2,202 0.013948 –3,887 2,640<br />
Nebraska.................................. 0.009103 –2,063 3,655 –0.005553 –28,329 7,091<br />
Nevada ................................... 0.043203 –1,733 1,536 0.123560 535 425<br />
New Hampshire ............................ 0.019444 –2,643 1,627 0.013722 400 1,313<br />
New Jersey ................................ 0.026108 1,903 1,969 0.013215 –1,967 2,735<br />
New Mexico............................... 0.112638 –431 817 0.096905 807 610<br />
NewYork................................. 0.029022 –22,367 14,881 0.008095 –27,096 17,017<br />
North Carolina ............................. 0.021276 –6,354 5,499 0.012831 –28,563 9,265<br />
North Dakota .............................. 0.019007 –3,002 1,621 0.008541 –5,760 2,617<br />
Ohio ..................................... 0.022273 –21,768 15,604 0.044683 –9,949 10,955<br />
Oklahoma ................................. 0.006405 –10,237 8,296 0.013165 –12,426 8,445<br />
Oregon ................................... 0.073495 –1,650 3,786 0.042692 –10,309 6,182<br />
Pennsylvania............................... 0.027085 –24,417 16,685 –0.014656 –134,270 41,466<br />
Rhode Isl<strong>and</strong> .............................. 0.011732 –506 680 0.021282 –344 525<br />
South Carolina ............................. 0.014487 –6,537 6,823 0.086503 1,677 2,737<br />
South Dakota .............................. 0.012863 –1,152 1,751 0.019075 –2,901 1,859<br />
Tennessee ................................. 0.005611 –9,561 11,404 –0.011681 –60,797 16,711<br />
Texas. .................................... 0.014288 –13,795 18,462 –0.003611 –31,876 25,228<br />
Utah ..................................... 0.041500 –1,853 2,544 0.071790 3,964 792<br />
Vermont .................................. 0.016042 –1,485 1,360 –0.006963 –2,952 1,792<br />
Virginia................................... 0.008112 –5,920 7,627 0.011922 165 6,590<br />
Washington................................ 0.017168 –6,558 4,800 0.045009 3,663 1,723<br />
West Virginia .............................. 0.006512 –2,872 4,433 0.001964 –2,897 4,911<br />
Wisconsin ................................. 0.009197 –14,330 10,587 –0.002285 –35,565 15,098<br />
Wyoming ................................. 0.025766 –1,835 1,823 0.034258 –3,738 1,705<br />
162 <strong>2006</strong> <strong>National</strong> <strong>Survey</strong> <strong>of</strong> <strong>Fishing</strong>, <strong>Hunting</strong>, <strong>and</strong> <strong>Wildlife</strong>-<strong>Associated</strong> Recreation U.S. Fish & <strong>Wildlife</strong> Service
Table D-10. Parameters a <strong>and</strong> b for Calculating Approximate St<strong>and</strong>ard Errors <strong>of</strong> Levels <strong>of</strong><br />
<strong>Wildlife</strong>-Watching Participants for the Detailed <strong>Wildlife</strong>-Watching Sample<br />
State<br />
Away-from-home participants <strong>Wildlife</strong>-watching participants 1<br />
a b a b<br />
United States, total. .................................. –0.000064 14,628 –0.000058 13,319<br />
Alabama .............................................. –0.002522 8,955 –0.002252 7,994<br />
Alaska. ............................................... –0.005091 2,539 –0.005744 2,864<br />
Arizona ............................................... –0.001212 5,555 –0.001128 5,170<br />
Arkansas .............................................. –0.003685 7,943 –0.003787 8,163<br />
California ............................................. –0.000633 17,272 –0.000632 17,247<br />
Colorado .............................................. –0.002818 10,157 –0.002773 9,995<br />
Connecticut. ........................................... –0.001942 5,313 –0.001578 4,317<br />
Delaware. ............................................. –0.002431 1,625 –0.002061 1,378<br />
Florida ............................................... –0.001067 15,191 –0.001082 15,396<br />
Georgia ............................................... –0.002273 15,705 –0.002082 14,383<br />
Hawaii ............................................... –0.002169 2,200 –0.002077 2,106<br />
Idaho. ................................................ –0.005872 6,469 –0.006027 6,640<br />
Illinois. ............................................... –0.001350 13,189 –0.001237 12,083<br />
Indiana ............................................... –0.002090 10,031 –0.002026 9,722<br />
Iowa ................................................. –0.003442 8,051 –0.003725 8,712<br />
Kansas ............................................... –0.002087 4,403 –0.002245 4,737<br />
Kentucky ............................................. –0.003921 12,780 –0.003130 10,201<br />
Louisiana ............................................. –0.002878 9,878 –0.002325 7,980<br />
Maine ................................................ –0.005383 5,779 –0.005003 5,372<br />
Maryl<strong>and</strong> ............................................. –0.001401 6,072 –0.001512 6,552<br />
Massachusetts. ......................................... –0.001153 5,803 –0.001045 5,260<br />
Michigan. ............................................. –0.003188 24,879 –0.002805 21,892<br />
Minnesota ............................................. –0.004869 19,579 –0.004257 17,116<br />
Mississippi ............................................ –0.004033 8,929 –0.004149 9,184<br />
Missouri .............................................. –0.003241 14,653 –0.002731 12,349<br />
Montana .............................................. –0.006536 4,919 –0.005006 3,768<br />
Nebraska. ............................................. –0.001913 2,600 –0.001770 2,406<br />
Nevada ............................................... –0.003763 7,131 –0.002387 4,524<br />
New Hampshire ........................................ –0.002265 2,364 –0.002070 2,160<br />
New Jersey ............................................ –0.000942 6,346 –0.000899 6,057<br />
New Mexico. .......................................... –0.002139 3,207 –0.002023 3,034<br />
NewYork............................................. –0.001498 22,454 –0.001320 19,791<br />
North Carolina ......................................... –0.001307 8,785 –0.001368 9,194<br />
North Dakota .......................................... –0.004745 2,408 –0.004900 2,486<br />
Ohio ................................................. –0.001834 16,302 –0.001729 15,365<br />
Oklahoma ............................................. –0.004720 12,946 –0.003724 10,214<br />
Oregon ............................................... –0.004482 12,948 –0.003771 10,895<br />
Pennsylvania. .......................................... –0.001862 18,235 –0.001779 17,426<br />
Rhode Isl<strong>and</strong> .......................................... –0.001588 1,338 –0.001451 1,222<br />
South Carolina ......................................... –0.002527 8,378 –0.002147 7,118<br />
South Dakota .......................................... –0.005879 3,532 –0.005273 3,168<br />
Tennessee ............................................. –0.002040 9,583 –0.002340 10,996<br />
Texas. ................................................ –0.002981 50,906 –0.002276 38,865<br />
Utah ................................................. –0.002948 5,329 –0.003322 6,007<br />
Vermont .............................................. –0.003834 1,940 –0.003687 1,866<br />
Virginia. .............................................. –0.002142 12,625 –0.002049 12,078<br />
Washington. ........................................... –0.001012 5,037 –0.001076 5,361<br />
WestVirginia.......................................... –0.005125 7,470 –0.005457 7,954<br />
Wisconsin ............................................. –0.002461 10,707 –0.003232 14,058<br />
Wyoming ............................................. –0.006998 2,833 –0.006562 2,657<br />
1 Use these parameters for total wildlife-watching participants <strong>and</strong> around-the-home participants.<br />
U.S. Fish & <strong>Wildlife</strong> Service <strong>2006</strong> <strong>National</strong> <strong>Survey</strong> <strong>of</strong> <strong>Fishing</strong>, <strong>Hunting</strong>, <strong>and</strong> <strong>Wildlife</strong>-<strong>Associated</strong> Recreation 163
Table D-11. Parameters a, b, <strong>and</strong> c for Calculating Approximate St<strong>and</strong>ard Errors for Expenditures <strong>and</strong> Days or<br />
Trips for Detailed <strong>Wildlife</strong>-Watching Sample<br />
State<br />
Expenditures<br />
Days or trips<br />
a b c a b c<br />
United States, total.......................... 0.000184 –1,140,662 67,137 0.000574 1,457,630 –8,497<br />
Alabama ..................................... 0.045588 –11,994 16,603 0.188740 –119,343 614<br />
Alaska. ...................................... 0.120206 –27,366 3,041 –0.124071 –135,739 22,893<br />
Arizona ...................................... 0.030207 –53,304 10,729 –0.012992 48,146 15,350<br />
Arkansas ..................................... 0.099812 14,720 8,751 –0.017705 122,002 28,315<br />
California .................................... 0.033850 –512,106 41,075 –0.045068 409,984 182,262<br />
Colorado ..................................... 0.027999 –274,128 22,499 –0.048837 –38,813 65,367<br />
Connecticut................................... 0.021634 –65,691 10,399 –0.024457 –95,765 25,345<br />
Delaware..................................... 0.065106 –1,447 1,138 –0.008505 9,777 5,498<br />
Florida ...................................... 0.023886 346,119 21,198 0.008852 367,813 29,038<br />
Georgia ...................................... 0.074762 –1,010,585 34,617 –0.043108 –269,579 83,544<br />
Hawaii ...................................... 0.083826 –21,578 2,574 –0.072050 –22,450 10,110<br />
Idaho. ....................................... 0.062974 –42,113 7,740 –0.034736 –28,632 22,517<br />
Illinois. ...................................... 0.036256 –247,805 22,614 –0.015710 –127,759 55,397<br />
Indiana ...................................... 0.036663 –31,127 16,250 –0.011371 –60,979 38,357<br />
Iowa ........................................ 0.079272 54,459 5,841 –0.010582 –64,612 23,312<br />
Kansas ...................................... 0.065343 2,002 6,423 –0.009647 290,376 9,046<br />
Kentucky .................................... 0.054215 7,733 10,118 –0.027046 –203,563 66,052<br />
Louisiana .................................... 0.122208 –20,968 9,262 –0.027645 11,297 25,905<br />
Maine ....................................... 0.023874 –51,089 9,384 –0.124695 –361,658 61,734<br />
Maryl<strong>and</strong> .................................... 0.014472 –4,594 10,674 0.003905 125,364 13,230<br />
Massachusetts................................. 0.028723 –178,823 9,836 –0.028071 –151,233 43,446<br />
Michigan..................................... 0.034044 –350,268 38,895 –0.189982 –1,478,372 355,858<br />
Minnesota .................................... 0.074185 –156,337 26,053 –0.037135 –287,075 81,476<br />
Mississippi ................................... 0.069734 –5,671 8,343 0.007734 –4,828 12,669<br />
Missouri ..................................... 0.050350 –370,879 19,939 –0.072363 –297,324 107,372<br />
Montana ..................................... 0.096467 –101,441 7,127 0.021739 75,970 2,590<br />
Nebraska..................................... 0.057553 –29,126 3,150 –0.037603 –53,492 15,634<br />
Nevada ...................................... 0.114708 –32,736 5,704 0.007035 8,360 8,647<br />
New Hampshire ............................... 0.014724 –17,918 4,039 –0.004938 74,043 4,376<br />
New Jersey ................................... 0.022949 –169,333 13,969 –0.040442 238,149 40,992<br />
New Mexico.................................. 0.036652 16,768 4,306 –0.023441 72,449 11,803<br />
NewYork.................................... 0.042036 –450,788 32,575 –0.019285 –366,511 102,534<br />
North Carolina ................................ 0.061423 –16,794 13,694 –0.012815 19,657 37,216<br />
North Dakota ................................. 0.155007 –2,199 1,794 0.150664 6,024 376<br />
Ohio ........................................ 0.035458 –205,570 28,049 –0.018753 –103,758 63,267<br />
Oklahoma .................................... 0.036357 –21,977 15,171 –0.000564 1,344,926 16,961<br />
Oregon ...................................... 0.062814 –65,011 9,965 –0.004734 831,881 37,513<br />
Pennsylvania.................................. 0.054585 –176,791 24,331 –0.024636 –296,844 94,825<br />
Rhode Isl<strong>and</strong> ................................. 0.037242 –31 2,537 –0.019391 234 7,490<br />
South Carolina ................................ 0.017341 –52,304 14,141 –0.021836 –45,588 28,960<br />
South Dakota ................................. 0.058011 –16,346 3,878 –0.063876 –12,873 14,245<br />
Tennessee .................................... 0.058962 –19,581 19,197 –0.067979 539,487 98,190<br />
Texas. ....................................... 0.107126 268,978 41,639 –0.115263 –2,660,430 425,213<br />
Utah ........................................ 0.056246 –5,750 4,842 –0.002938 –77,345 25,347<br />
Vermont ..................................... 0.005556 –22,018 4,065 –0.014449 33,588 6,073<br />
Virginia. ..................................... 0.043764 –51,970 12,817 –0.046070 –227,508 91,189<br />
Washington................................... 0.030615 –16,210 11,199 –0.000250 36,174 12,719<br />
West Virginia ................................. 0.118586 –4,653 8,819 –0.073404 38,459 30,640<br />
Wisconsin .................................... 0.009997 –400,732 26,411 –0.015178 –125,383 46,927<br />
Wyoming .................................... 0.083907 –31,350 3,012 –0.062286 –29,913 12,976<br />
164 <strong>2006</strong> <strong>National</strong> <strong>Survey</strong> <strong>of</strong> <strong>Fishing</strong>, <strong>Hunting</strong>, <strong>and</strong> <strong>Wildlife</strong>-<strong>Associated</strong> Recreation U.S. Fish & <strong>Wildlife</strong> Service
U.S. Department <strong>of</strong> the Interior<br />
U.S. Fish & <strong>Wildlife</strong> Service<br />
http://federalaid.fws.gov<br />
October 2007