Tokologo Economic Profile.pdf - Arid Areas Programme
Tokologo Economic Profile.pdf - Arid Areas Programme
Tokologo Economic Profile.pdf - Arid Areas Programme
You also want an ePaper? Increase the reach of your titles
YUMPU automatically turns print PDFs into web optimized ePapers that Google loves.
12<br />
over the 1996 to 2004 timeframe. Although the value for Whites remained static it can be<br />
seen that overall income inequality is steadily increasing.<br />
5.3 Human Development Index (HDI)<br />
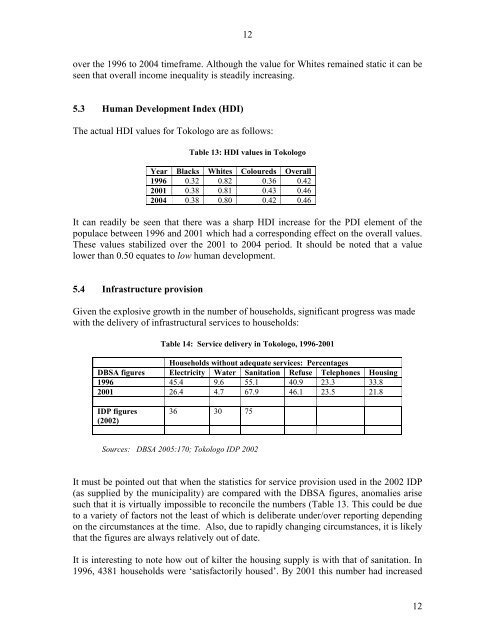
The actual HDI values for <strong>Tokologo</strong> are as follows:<br />
Table 13: HDI values in <strong>Tokologo</strong><br />
Year Blacks Whites Coloureds Overall<br />
1996 0.32 0.82 0.36 0.42<br />
2001 0.38 0.81 0.43 0.46<br />
2004 0.38 0.80 0.42 0.46<br />
It can readily be seen that there was a sharp HDI increase for the PDI element of the<br />
populace between 1996 and 2001 which had a corresponding effect on the overall values.<br />
These values stabilized over the 2001 to 2004 period. It should be noted that a value<br />
lower than 0.50 equates to low human development.<br />
5.4 Infrastructure provision<br />
Given the explosive growth in the number of households, significant progress was made<br />
with the delivery of infrastructural services to households:<br />
Table 14: Service delivery in <strong>Tokologo</strong>, 1996-2001<br />
Households without adequate services: Percentages<br />
DBSA figures Electricity Water Sanitation Refuse Telephones Housing<br />
1996 45.4 9.6 55.1 40.9 23.3 33.8<br />
2001 26.4 4.7 67.9 46.1 23.5 21.8<br />
IDP figures<br />
(2002)<br />
36 30 75<br />
Sources: DBSA 2005:170; <strong>Tokologo</strong> IDP 2002<br />
It must be pointed out that when the statistics for service provision used in the 2002 IDP<br />
(as supplied by the municipality) are compared with the DBSA figures, anomalies arise<br />
such that it is virtually impossible to reconcile the numbers (Table 13. This could be due<br />
to a variety of factors not the least of which is deliberate under/over reporting depending<br />
on the circumstances at the time. Also, due to rapidly changing circumstances, it is likely<br />
that the figures are always relatively out of date.<br />
It is interesting to note how out of kilter the housing supply is with that of sanitation. In<br />
1996, 4381 households were ‘satisfactorily housed’. By 2001 this number had increased<br />
12


