Tokologo Economic Profile.pdf - Arid Areas Programme
Tokologo Economic Profile.pdf - Arid Areas Programme
Tokologo Economic Profile.pdf - Arid Areas Programme

You also want an ePaper? Increase the reach of your titles
YUMPU automatically turns print PDFs into web optimized ePapers that Google loves.
13<br />
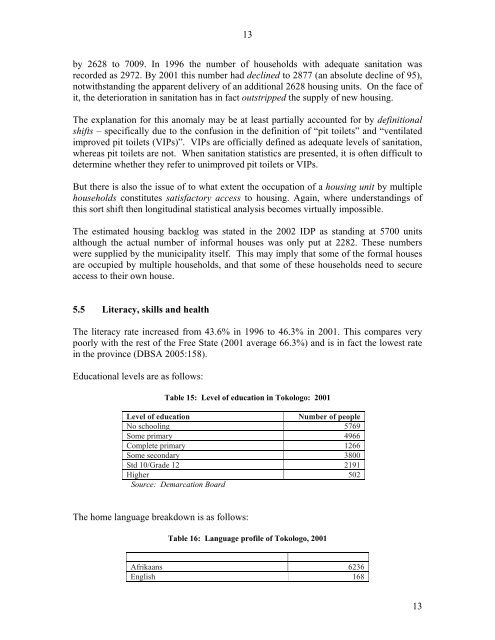
by 2628 to 7009. In 1996 the number of households with adequate sanitation was<br />
recorded as 2972. By 2001 this number had declined to 2877 (an absolute decline of 95),<br />
notwithstanding the apparent delivery of an additional 2628 housing units. On the face of<br />
it, the deterioration in sanitation has in fact outstripped the supply of new housing.<br />
The explanation for this anomaly may be at least partially accounted for by definitional<br />
shifts – specifically due to the confusion in the definition of “pit toilets” and “ventilated<br />
improved pit toilets (VIPs)”. VIPs are officially defined as adequate levels of sanitation,<br />
whereas pit toilets are not. When sanitation statistics are presented, it is often difficult to<br />
determine whether they refer to unimproved pit toilets or VIPs.<br />
But there is also the issue of to what extent the occupation of a housing unit by multiple<br />
households constitutes satisfactory access to housing. Again, where understandings of<br />
this sort shift then longitudinal statistical analysis becomes virtually impossible.<br />
The estimated housing backlog was stated in the 2002 IDP as standing at 5700 units<br />
although the actual number of informal houses was only put at 2282. These numbers<br />
were supplied by the municipality itself. This may imply that some of the formal houses<br />
are occupied by multiple households, and that some of these households need to secure<br />
access to their own house.<br />
5.5 Literacy, skills and health<br />
The literacy rate increased from 43.6% in 1996 to 46.3% in 2001. This compares very<br />
poorly with the rest of the Free State (2001 average 66.3%) and is in fact the lowest rate<br />
in the province (DBSA 2005:158).<br />
Educational levels are as follows:<br />
Table 15: Level of education in <strong>Tokologo</strong>: 2001<br />
Level of education<br />
Number of people<br />
No schooling 5769<br />
Some primary 4966<br />
Complete primary 1266<br />
Some secondary 3800<br />
Std 10/Grade 12 2191<br />
Higher 502<br />
Source: Demarcation Board<br />
The home language breakdown is as follows:<br />
Table 16: Language profile of <strong>Tokologo</strong>, 2001<br />
Description 2001<br />
Afrikaans 6236<br />
English 168<br />
13