Agilent N2610A FrameScope 350 Network Performance ... - Openxtra
Agilent N2610A FrameScope 350 Network Performance ... - Openxtra
Agilent N2610A FrameScope 350 Network Performance ... - Openxtra

Create successful ePaper yourself
Turn your PDF publications into a flip-book with our unique Google optimized e-Paper software.
User’s Manual<br />
<strong>Agilent</strong> <strong>N2610A</strong><br />
<strong>FrameScope</strong> <strong>350</strong><br />
<strong>Network</strong> <strong>Performance</strong><br />
Analyzer<br />
Version 3.1<br />
<strong>Agilent</strong> Technologies
Notices<br />
© 2002-2004 <strong>Agilent</strong> Technologies, Inc.<br />
No part of this manual may be reproduced<br />
in any form or by any means (including<br />
electronic storage and retrieval or translation<br />
into a foreign language) without prior<br />
agreement and written consent from <strong>Agilent</strong><br />
Technologies, Inc. as governed by<br />
United States and international copyright<br />
laws.<br />
Manual Part Number<br />
5971-4377<br />
Edition<br />
Second Edition, March 2004 (Version 3.1)<br />
First Edition, July 2002 (Version 3.0)<br />
<strong>Agilent</strong> Technologies, Inc.<br />
1 Yishun Avenue 7<br />
Singapore 768923<br />
Warranty<br />
The material contained in this document<br />
is provided “as is,” and is subject<br />
to being changed without notice<br />
in future editions. Further, to the maximum<br />
extent permitted by applicable<br />
law, <strong>Agilent</strong> Technologies disclaims<br />
all warranties of merchantability and<br />
fitness for a particular purpose. <strong>Agilent</strong><br />
Technologies shall not be liable<br />
for errors or for incidental or consequential<br />
damages in connection with<br />
the furnishing, use, or performance of<br />
this document or of any of the products<br />
to which it pertains. Should <strong>Agilent</strong><br />
Technologies have a written<br />
contract with the user and should any<br />
of the contract terms conflict with<br />
these terms the contract terms shall<br />
control.<br />
Technology Licenses<br />
The hardware and/or software described in<br />
this document are furnished under a<br />
license and may be used or copied only in<br />
accordance with the terms of such license.<br />
Restricted Rights Legend<br />
If Software is for use in the performance of<br />
a U.S. Government prime contract or subcontract,<br />
Software is delivered and<br />
licensed as “Commercial computer software”<br />
as defined in DFAR 252.227-7014<br />
(June 1995), or as a “commercial item” as<br />
defined in FAR 2.101(a) or as “Restricted<br />
computer software” as defined in FAR<br />
52.227-19 (June 1987) or any equivalent<br />
agency regulation or contract clause. Use,<br />
duplication or disclosure of Software is<br />
subject to <strong>Agilent</strong> Technologies’ standard<br />
commercial license terms, and non-DOD<br />
Departments and Agencies of the U.S. Government<br />
will receive no greater than<br />
Restricted Rights as defined in FAR<br />
52.227-19(c)(1-2) (June 1987). U.S. Government<br />
users will receive no greater than<br />
Limited Rights as defined in FAR 52.227-14<br />
(June 1987) or DFAR 252.227-7015 (b)(2)<br />
(November 1995), as applicable in any<br />
technical data.<br />
Safety Notices<br />
CAUTION<br />
A CAUTION notice denotes a hazard.<br />
It calls attention to an operating<br />
procedure, practice, or the like<br />
that, if not correctly performed or<br />
adhered to, could result in damage<br />
to the product or loss of important<br />
data. Do not proceed beyond a<br />
CAUTION notice until the indicated<br />
conditions are fully understood and<br />
met.<br />
WARNING<br />
A WARNING notice denotes a<br />
hazard. It calls attention to an<br />
operating procedure, practice, or<br />
the like that, if not correctly performed<br />
or adhered to, could result<br />
in personal injury or death. Do not<br />
proceed beyond a WARNING<br />
notice until the indicated conditions<br />
are fully understood and met.
In This Guide…<br />
This user’s guide contains information for using your<br />
<strong>FrameScope</strong> <strong>350</strong> handheld network performance analyzer<br />
using software version 3.1.<br />
Note that some systems running earlier software may not<br />
provide all of the features described in this manual; systems<br />
running later versions of software may operate differently<br />
than described in this manual. Be sure to refer to any user’s<br />
manual supplements or release notes that came with the<br />
unit or call 800- 452- 4844.<br />
<strong>Agilent</strong> <strong>FrameScope</strong> <strong>350</strong> User’s Manual 3
4 <strong>Agilent</strong> <strong>FrameScope</strong> <strong>350</strong> User’s Manual
Contents<br />
1 Introducing the <strong>FrameScope</strong> <strong>350</strong><br />
The <strong>FrameScope</strong> <strong>350</strong> at a Glance 10<br />
The DualRemote <strong>350</strong> at a Glance 14<br />
The Main Menu at a Glance 15<br />
<strong>FrameScope</strong> <strong>350</strong> Product Kit 18<br />
Getting Started 19<br />
2 <strong>Network</strong> Testing with the <strong>FrameScope</strong> <strong>350</strong><br />
<strong>Network</strong> Testing Overview 26<br />
Examining the <strong>Network</strong> 27<br />
Running an Autotest 29<br />
Changing the Autotest Metrics 33<br />
Using the Stations List 34<br />
Performing a Ping Test 38<br />
Performing a Trace Route 41<br />
Performing SNMP Queries 44<br />
Viewing Statistics 47<br />
Generating <strong>Network</strong> Traffic 50<br />
<strong>Performance</strong> Tests 53<br />
Locating a Hub Port with Blink Port 67<br />
Viewing the Error Log 69<br />
Using the Test Database 71<br />
Using the <strong>Network</strong> Database 73<br />
Locating Switch Ports 76<br />
3 Cable Testing with the <strong>FrameScope</strong> <strong>350</strong><br />
Cable Testing Overview 81<br />
Calibrating the Tester 85<br />
Setting Up an Autotest 86<br />
Running an Autotest 103<br />
Saving Test Results 104<br />
Viewing Result Details 107<br />
<strong>Agilent</strong> <strong>FrameScope</strong> <strong>350</strong> User’s Manual 5
4 Fiber Testing<br />
Using Talksets 112<br />
Using CompactFlash Cards 113<br />
Printing Labels 115<br />
WireMap Adapter Testing 117<br />
Fiber Testing Overview 122<br />
Calibrating the Tester 124<br />
Setting Up an Autotest 129<br />
Running an Autotest 142<br />
5 Cable Testing in Expert Mode<br />
6 Expert Fiber Testing<br />
7 System Operations<br />
Testing Overview 145<br />
Changing to Expert Mode 146<br />
The Expert Autotest Setup 147<br />
The Expert Tools Menu 163<br />
Running COAX and TWINAX Autotests 170<br />
About Fiber Expert Mode 176<br />
Changing to Expert Mode 177<br />
Viewing Probe Information 178<br />
The Fiber Tools Menu 180<br />
The Status Display Area 186<br />
The System Menu 187<br />
System Information 188<br />
Storage Setup 189<br />
Battery Status 190<br />
Time and Date Setup 191<br />
User Interface Setup 192<br />
Operator Setup 193<br />
Touchscreen Calibration 194<br />
Serial Baud Rate Setup 195<br />
6 <strong>Agilent</strong> <strong>FrameScope</strong> <strong>350</strong> User’s Manual
Restore Default Settings 196<br />
Calibration Information 198<br />
Printer Setup 199<br />
<strong>Network</strong> Settings 200<br />
Remote Control 203<br />
RFC 2544 Test 204<br />
SNMP Settings 205<br />
Demo Mode 206<br />
8 <strong>Network</strong> <strong>Performance</strong> Analyzer Reference<br />
<strong>Network</strong> Connection 209<br />
<strong>Network</strong> Database 211<br />
<strong>Network</strong> <strong>Performance</strong> Autotest 214<br />
Statistics 233<br />
9 Cable Tester Reference<br />
<strong>Network</strong> Tools 236<br />
Remote Control 240<br />
Memory Requirements 242<br />
Measurements 244<br />
Calibration 248<br />
10 DualRemote <strong>350</strong> Reference<br />
11 Specifications<br />
12 Glossary<br />
Memory Requirements 250<br />
The DualRemote <strong>350</strong> 252<br />
Physical 258<br />
Environmental 259<br />
Electrical 260<br />
Ports 261<br />
Display 262<br />
Fiber SmartProbe+ 263<br />
Glossary 266<br />
<strong>Agilent</strong> <strong>FrameScope</strong> <strong>350</strong> User’s Manual 7
8 <strong>Agilent</strong> <strong>FrameScope</strong> <strong>350</strong> User’s Manual
<strong>Agilent</strong> <strong>N2610A</strong> <strong>FrameScope</strong> <strong>350</strong> <strong>Network</strong> <strong>Performance</strong> Analyzer<br />
User’s Manual<br />
1<br />
Introducing the <strong>FrameScope</strong> <strong>350</strong><br />
The <strong>FrameScope</strong> <strong>350</strong> at a Glance 10<br />
Front View 10<br />
Side Views 11<br />
Controls 12<br />
Ports 12<br />
The DualRemote <strong>350</strong> at a Glance 14<br />
The Main Menu at a Glance 15<br />
The <strong>Network</strong> Tab 16<br />
The Cable Tab 17<br />
<strong>FrameScope</strong> <strong>350</strong> Product Kit 18<br />
Getting Started 19<br />
Switching the <strong>FrameScope</strong> On and Off 19<br />
Checking Power and Charging the Battery 20<br />
Connecting to the <strong>Network</strong> 22<br />
Using the <strong>FrameScope</strong> <strong>350</strong> 23<br />
Running a Test 23<br />
The <strong>Agilent</strong> <strong>FrameScope</strong> <strong>350</strong> <strong>Network</strong> <strong>Performance</strong> Analyzer<br />
is a powerful handheld instrument that measures the<br />
performance of your key network resources and verifies the<br />
cabling and active network equipment. The <strong>FrameScope</strong> <strong>350</strong><br />
integrates network performance analyzer features such as<br />
auto discovery, performance autotesting, and fault finding;<br />
with versatile cable certification testing for Category 6 (Class<br />
E) and category 5E (Class D).<br />
<strong>Agilent</strong> Technologies<br />
9
1 Introducing the <strong>FrameScope</strong> <strong>350</strong><br />
The <strong>FrameScope</strong> <strong>350</strong> at a Glance<br />
The <strong>FrameScope</strong> <strong>350</strong> at a Glance<br />
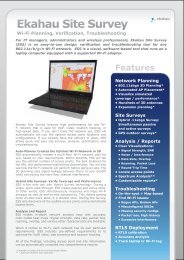
Front View<br />
SmartProbe port (top)<br />
Strap cleat<br />
Color touch screen<br />
Power button<br />
CompactFlash memory<br />
card slot (bottom)<br />
OK button<br />
Scroll button<br />
Figure 1 <strong>FrameScope</strong> <strong>350</strong> Front View<br />
10 <strong>Agilent</strong> <strong>FrameScope</strong> <strong>350</strong> User’s Manual
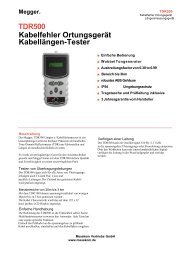
Side Views<br />
Stylus clip<br />
USB ports<br />
DC Power input<br />
Battery pack (back)<br />
Figure 2 Left Side<br />
Headset port<br />
Serial port<br />
Flip-out stand (back)<br />
Figure 3 Right Side<br />
Introducing the <strong>FrameScope</strong> <strong>350</strong> 1<br />
The <strong>FrameScope</strong> <strong>350</strong> at a Glance<br />
<strong>Agilent</strong> <strong>FrameScope</strong> <strong>350</strong> User’s Manual 11
1 Introducing the <strong>FrameScope</strong> <strong>350</strong><br />
The <strong>FrameScope</strong> <strong>350</strong> at a Glance<br />
Controls<br />
Ports<br />
Color Touch Screen The <strong>FrameScope</strong> <strong>350</strong>’s touch screen is<br />
the main user interface. Test controls and results are shown<br />
here. Simply press the screen with your finger or a stylus to<br />
navigate through the menus and test controls.<br />
Power Button Press the Power button briefly to switch the<br />
unit on. To switch the unit off, do one of the following:<br />
• Press Power twice.<br />
Press Power once, wait 5 seconds and the unit powers<br />
off.<br />
Press Power once and hit the Off button on the screen.<br />
OK Button Press the OK button to activate the currently<br />
selected item on the display. Use the OK button to confirm<br />
edits, enter values, and execute selected features.<br />
Scroll Button The scroll rocker button moves the highlight<br />
cursor on the screen. Use this button to scroll through<br />
selected items on the display.<br />
SmartProbe Port The SmartProbe test port on the top of the<br />
<strong>FrameScope</strong> provides the network test interface. This port<br />
accepts any of the <strong>Agilent</strong> SmartProbes such as:<br />
Channel SmartProbe for testing twisted pair using patch<br />
cords.<br />
Link SmartProbe for testing twisted pair at network<br />
outlets.<br />
Fiber SmartProbe for testing optical fiber.<br />
CompactFlash Slot This port on the bottom of the unit<br />
accepts standard CompactFlash cards for data storage.<br />
USB Ports The <strong>FrameScope</strong> provides a universal serial bus<br />
(USB) interface port to connect with PCs and peripherals.<br />
The unit provides a USB Type B (Hub) port.<br />
Serial Port The Serial port provides an 8- pin RS- 232<br />
interface for connecting a PC. See “Serial port” on page 261.<br />
12 <strong>Agilent</strong> <strong>FrameScope</strong> <strong>350</strong> User’s Manual
CAUTION<br />
Introducing the <strong>FrameScope</strong> <strong>350</strong> 1<br />
The <strong>FrameScope</strong> <strong>350</strong> at a Glance<br />
Talkset Port This port allows you to connect <strong>Agilent</strong>’s<br />
<strong>FrameScope</strong> talkset (N2605A- 137) for two- way voice<br />
communication between the <strong>FrameScope</strong> and DualRemote<br />
over copper cabling.<br />
DC Power Input The DC power input accepts the <strong>Agilent</strong><br />
12 Vdc power adapter/chargers that comes together with<br />
your <strong>FrameScope</strong>.<br />
Use only the 12 Vdc adapter/charger supplied with your<br />
<strong>FrameScope</strong> <strong>350</strong>. Using an incompatible adapter/charger can<br />
damage your <strong>FrameScope</strong> equipment.<br />
<strong>Agilent</strong> <strong>FrameScope</strong> <strong>350</strong> User’s Manual 13
1 Introducing the <strong>FrameScope</strong> <strong>350</strong><br />
The DualRemote <strong>350</strong> at a Glance<br />
The DualRemote <strong>350</strong> at a Glance<br />
Pair status indicators<br />
Warning indicators<br />
Test progress and Result<br />
indicators<br />
Fault location indicators<br />
Diagnostic indicators<br />
Power indicator<br />
Power button<br />
OK button<br />
Scroll button<br />
Figure 4 DualRemote Front View<br />
The <strong>Agilent</strong> DualRemote <strong>350</strong> is used with the<br />
<strong>FrameScope</strong> <strong>350</strong> when performing cable testing. The<br />
DualRemote is positioned at the far end of the cabling run<br />
being tested. This unit is controlled by the <strong>FrameScope</strong>, and<br />
shows the results of the cable tests.<br />
Figure 4 shows the indicators and controls of the<br />
DualRemote. For complete information on the DualRemote,<br />
see Chapter 10, “DualRemote <strong>350</strong> Reference”.<br />
14 <strong>Agilent</strong> <strong>FrameScope</strong> <strong>350</strong> User’s Manual
The Main Menu at a Glance<br />
Title bar<br />
Tab area<br />
Status display area<br />
Navigation buttons<br />
Figure 5 The Main Menu<br />
Introducing the <strong>FrameScope</strong> <strong>350</strong> 1<br />
The Main Menu at a Glance<br />
Title Bar Displays the name of the current screen.<br />
Tab Area Display the currently selected tab. The<br />
<strong>FrameScope</strong> <strong>350</strong> provides two tabs: <strong>Network</strong> and Cable.<br />
Select a tab to choose the type of testing you want to do.<br />
Status Display Area This area displays the time of day,<br />
network connection status, battery status, storage status, and<br />
talkset activity.<br />
Navigation Buttons These buttons move through the interface<br />
screens:<br />
Back returns to the previous screen.<br />
Main Menu returns to the Main Menu.<br />
Help launches the built- in help.<br />
<strong>Agilent</strong> <strong>FrameScope</strong> <strong>350</strong> User’s Manual 15
1 Introducing the <strong>FrameScope</strong> <strong>350</strong><br />
The Main Menu at a Glance<br />
The <strong>Network</strong> Tab<br />
Tab title<br />
<strong>Network</strong> resources area<br />
Error Flag<br />
Utilization graph<br />
System menu button<br />
Tools menu button<br />
Autotest button<br />
Figure 6 <strong>FrameScope</strong> <strong>Network</strong> Tab<br />
Tab Title Displays the name of the tab.<br />
<strong>Network</strong> Resource Area Shows all of the detected network<br />
resources. When you press the <strong>Network</strong> tab, the <strong>FrameScope</strong><br />
performs auto discovery of network resources. Resource<br />
icons shown with a black triangle (see below) can be pressed<br />
to display more information.<br />
Press icon to view details<br />
Error Flag Displayed when an unacknowledged error is in<br />
error log<br />
Utilization Graph Displays current network usage. Press this<br />
graph to display more statistics.<br />
System Menu Button Calls the System menu.<br />
Tools Menu Button Calls the Tools menu.<br />
16 <strong>Agilent</strong> <strong>FrameScope</strong> <strong>350</strong> User’s Manual
The Cable Tab<br />
NOTE<br />
Introducing the <strong>FrameScope</strong> <strong>350</strong> 1<br />
The Main Menu at a Glance<br />
Autotest Button Calls the <strong>Network</strong> Autotest Setup screen.<br />
Tab title<br />
Certification test buttons<br />
Setup menu button<br />
Calibration button<br />
System menu button<br />
Figure 7 <strong>FrameScope</strong> Cable Tab (normal mode)<br />
The Cable tab will look different if Expert Mode is turned on.<br />
Tab Title Displays the name of the tab.<br />
Certification Test Buttons Launch a certification autotest. For<br />
example, Category 5E or Category 6 cable certification.<br />
Setup Menu Button Opens the Setup menu.<br />
Calibration Button Opens the Calibration screen for<br />
calibrating the <strong>FrameScope</strong> <strong>350</strong> with the Dual Remote <strong>350</strong>.<br />
System Menu Button Opens the System menu.<br />
<strong>Agilent</strong> <strong>FrameScope</strong> <strong>350</strong> User’s Manual 17
1 Introducing the <strong>FrameScope</strong> <strong>350</strong><br />
<strong>FrameScope</strong> <strong>350</strong> Product Kit<br />
<strong>FrameScope</strong> <strong>350</strong> Product Kit<br />
The <strong>FrameScope</strong> <strong>350</strong> product kit has multiple configurations:<br />
Option 001: <strong>FrameScope</strong> <strong>350</strong><br />
Option 100: DualRemote <strong>350</strong> option<br />
Option 130: Contains contents of Option 001 and Option<br />
100 kits, MultiMode Fiber SmartProbe+ set, and additional<br />
accessories<br />
Option 150: Contains contents of Option 130 kit and<br />
SingleMode Fiber SmartProbe+ set<br />
For details on contents of each <strong>FrameScope</strong> kit, see the<br />
<strong>FrameScope</strong> <strong>350</strong> Quick Start Guide.<br />
18 <strong>Agilent</strong> <strong>FrameScope</strong> <strong>350</strong> User’s Manual
Getting Started<br />
Switching the <strong>FrameScope</strong> On and Off<br />
Introducing the <strong>FrameScope</strong> <strong>350</strong> 1<br />
Getting Started<br />
1 To switch the <strong>FrameScope</strong> on, briefly press the Power<br />
button on the front panel.<br />
The screen will light and a brief tone will sound.<br />
2 While the unit is on, briefly pressing the Power button<br />
will call the Sleep/Shutdown window.<br />
Press Sleep to put the unit in sleep mode. When the<br />
<strong>FrameScope</strong> is in sleep mode, briefly press the Power<br />
button or press the screen to reactivate it.<br />
Press Off or wait five seconds to turn the unit off.<br />
Press Cancel to go back to the Main Menu.<br />
3 You can also turn the unit off by pressing the Power<br />
button twice.<br />
<strong>Agilent</strong> <strong>FrameScope</strong> <strong>350</strong> User’s Manual 19
1 Introducing the <strong>FrameScope</strong> <strong>350</strong><br />
Getting Started<br />
Checking Power and Charging the Battery<br />
NOTE<br />
WARNING<br />
The <strong>FrameScope</strong>’s battery should provide enough power for<br />
a typical day of testing. The AC power adapter/charger can<br />
also be used to power the unit and to recharge the battery.<br />
To shorten the charging time, <strong>Agilent</strong> recommends switching off the<br />
<strong>FrameScope</strong> while charging.<br />
To check the battery’s charge level, perform these steps:<br />
1 Switch on the <strong>FrameScope</strong>, if necessary, by pressing the<br />
Power button on the front of the unit.<br />
2 Observe the battery icon in the Status display area on the<br />
Main Menu.<br />
The battery icon will show how much charge remains in<br />
the battery (for example, 45%). If the battery is severely<br />
depleted, a low- battery message will be displayed.<br />
Do not calibrate or operate the <strong>FrameScope</strong> or DualRemote while<br />
the battery is hot immediately after charging.<br />
When the battery temperature exceeds 55°C (131°F), a warning<br />
message, for example, “DualRemote too hot”, will appear to alert<br />
the user. The WireScope or DualRemote’s measurement functions<br />
will be suspended until the battery temperature falls below 55°C<br />
(131°F). Non-measurement related functions remain unaffected.<br />
3 To recharge the battery or to power the <strong>FrameScope</strong> from<br />
an AC power source, plug the DC power connector on the<br />
20 <strong>Agilent</strong> <strong>FrameScope</strong> <strong>350</strong> User’s Manual
Introducing the <strong>FrameScope</strong> <strong>350</strong> 1<br />
Getting Started<br />
adapter/charger into the 12 Vdc connector on the side of<br />
the unit.<br />
4 Observe that the AC power icon is displayed in the Status<br />
area.<br />
The AC icon will also indicate the battery’s charge level<br />
(for example 72%).<br />
<strong>Agilent</strong> <strong>FrameScope</strong> <strong>350</strong> User’s Manual 21
1 Introducing the <strong>FrameScope</strong> <strong>350</strong><br />
Getting Started<br />
Connecting to the <strong>Network</strong><br />
The <strong>FrameScope</strong> <strong>350</strong> uses test probes to connect to the<br />
network you are testing. Follow these steps to connect your<br />
unit to the network:<br />
1 Select an appropriate <strong>Agilent</strong> test probe for your<br />
application:<br />
Select a Channel SmartProbe for testing twisted pair<br />
using patch cords.<br />
Select a Link SmartProbe for testing twisted pair at<br />
network outlets.<br />
See also “Cable Testing Overview” on page 81.<br />
2 Plug the test probe into the SmartProbe port on the top<br />
of the <strong>FrameScope</strong>.<br />
3 Connect the cabling to the SmartProbe. If you are<br />
performing optical cable testing, connect both the input<br />
and output signals. If you are performing optical network<br />
testing, connect an optical- to- copper media converter to<br />
the SmartProbe.<br />
22 <strong>Agilent</strong> <strong>FrameScope</strong> <strong>350</strong> User’s Manual
Using the <strong>FrameScope</strong> <strong>350</strong><br />
Running a Test<br />
Introducing the <strong>FrameScope</strong> <strong>350</strong> 1<br />
Getting Started<br />
You operate the <strong>FrameScope</strong> using its front panel<br />
touchscreen and control buttons. When testing with the unit,<br />
use the following operating tips:<br />
Select items on the display by pressing them with your<br />
finger or with a stylus or by scrolling the highlight bar<br />
with the scroll button. The touch screen may not detect a<br />
quick press; you should press firmly.<br />
Many screens have lists of items that you can navigate<br />
using the Scroll button. Pressing this button up or down<br />
moves the selection highlight.<br />
Selected items are highlighted in dark blue to indicate<br />
that they are selected. Most screens have a default<br />
selected item.<br />
Execute a selected item by pressing it or by pressing the<br />
OK button.<br />
To return the Main Menu at any time, press the Main<br />
Menu button on the bottom of the display.<br />
To return to the previous screen, press the Back button<br />
on the bottom of the display.<br />
The basic steps for performing a test with the<br />
<strong>FrameScope</strong> <strong>350</strong> are described below. For more information<br />
on network testing, see Chapter 2, “<strong>Network</strong> Testing with the<br />
<strong>FrameScope</strong> <strong>350</strong>”. For more information on cable testing, see<br />
Chapter 3, “Cable Testing with the <strong>FrameScope</strong> <strong>350</strong>”.<br />
1 Switch the unit on. Connect power to charge the battery<br />
if necessary. See “Checking Power and Charging the<br />
Battery” on page 20.<br />
2 Install the appropriate SmartProbe for your test and<br />
connect the <strong>FrameScope</strong> to the network under test. See<br />
“Connecting to the <strong>Network</strong>” on page 22.<br />
3 Choose the type of test you want by pressing either the<br />
<strong>Network</strong> or Cable test tab.<br />
4 Make any needed configuration changes to match your<br />
testing environment.<br />
Most basic <strong>FrameScope</strong> operations execute automatically<br />
and require very little setup. In most cases you can skip<br />
this step.<br />
<strong>Agilent</strong> <strong>FrameScope</strong> <strong>350</strong> User’s Manual 23
1 Introducing the <strong>FrameScope</strong> <strong>350</strong><br />
Getting Started<br />
5 Press the Autotest button or Start Test button to begin<br />
the test.<br />
See “Viewing Details and Statistics” on page 36 for<br />
information on reviewing network test results. See “Viewing<br />
Result Details” on page 107 for information on reviewing<br />
cable test results.<br />
24 <strong>Agilent</strong> <strong>FrameScope</strong> <strong>350</strong> User’s Manual
<strong>Agilent</strong> <strong>N2610A</strong> <strong>FrameScope</strong> <strong>350</strong> <strong>Network</strong> <strong>Performance</strong> Analyzer<br />
User’s Manual<br />
2<br />
<strong>Network</strong> Testing with the<br />
<strong>FrameScope</strong> <strong>350</strong><br />
<strong>Network</strong> Testing Overview 26<br />
Examining the <strong>Network</strong> 27<br />
<strong>Network</strong> Overview 27<br />
Detailed List 28<br />
Running an Autotest 29<br />
Changing the Autotest Metrics 33<br />
Using the Stations List 34<br />
Viewing Details and Statistics 36<br />
Performing a Ping Test 38<br />
Performing a Trace Route 41<br />
Performing SNMP Queries 44<br />
Viewing Statistics 47<br />
Generating <strong>Network</strong> Traffic 50<br />
<strong>Performance</strong> Tests 53<br />
Performing a MAC or IP Loopback 54<br />
Performing RFC 2544 Throughput or Latency Test 57<br />
RFC 2544 Test Results 64<br />
Locating a Hub Port with Blink Port 67<br />
Viewing the Error Log 69<br />
Using the Test Database 71<br />
Using the <strong>Network</strong> Database 73<br />
Locating Switch Ports 76<br />
This chapter describes how to use your <strong>Agilent</strong><br />
<strong>FrameScope</strong> <strong>350</strong> as a network performance analyzer.<br />
The <strong>FrameScope</strong> network testing features allow you to create<br />
a list of key network resources and evaluate their<br />
performance. Active discovery and detailed metrics allow you<br />
to troubleshoot problems and pinpoint network bottlenecks.<br />
<strong>Agilent</strong> Technologies<br />
25
2 <strong>Network</strong> Testing with the <strong>FrameScope</strong> <strong>350</strong><br />
<strong>Network</strong> Testing Overview<br />
<strong>Network</strong> Testing Overview<br />
The following steps describe the general procedure for<br />
performing network analysis testing using the<br />
<strong>FrameScope</strong> <strong>350</strong>.<br />
1 Power the unit on. See “Switching the <strong>FrameScope</strong> On<br />
and Off” on page 19.<br />
2 Press the <strong>Network</strong> tab on the Main Menu to begin.<br />
3 Connect to the network under test. See “Connecting to<br />
the <strong>Network</strong>” on page 22.<br />
The <strong>FrameScope</strong> automatically begins to poll the network<br />
and locate devices. See “Examining the <strong>Network</strong>” on<br />
page 27.<br />
4 View details about the detected network resources. See<br />
“Detailed List” on page 28.<br />
5 Perform an Autotest on any or all desired resources. See<br />
“Running an Autotest” on page 29.<br />
6 Select any devices on the network and perform additional<br />
testing, such as:<br />
Ping test; see page 38.<br />
Trace Route test; see page 41.<br />
SNMP Queries; see page 44.<br />
7 Save results as desired, perform other tests or functions.<br />
26 <strong>Agilent</strong> <strong>FrameScope</strong> <strong>350</strong> User’s Manual
Examining the <strong>Network</strong><br />
<strong>Network</strong> Overview<br />
<strong>Network</strong> Testing with the <strong>FrameScope</strong> <strong>350</strong> 2<br />
Examining the <strong>Network</strong><br />
Press the <strong>Network</strong> tab on the Main Menu to begin the<br />
<strong>FrameScope</strong> auto discovery on your network.<br />
The <strong>Network</strong> resources area of the display will show a list<br />
of detected network devices.<br />
<strong>Agilent</strong> <strong>FrameScope</strong> <strong>350</strong> User’s Manual 27
2 <strong>Network</strong> Testing with the <strong>FrameScope</strong> <strong>350</strong><br />
Examining the <strong>Network</strong><br />
Detailed List<br />
1 To view a detailed list of network resources, press on any<br />
category in the <strong>Network</strong> Resources area. A triangle<br />
indicates that a list is available for that category.<br />
Press icon to view details<br />
2 Use the Scroll button to select items in the list. The<br />
Collapse List and Expand List button is renamed View<br />
when the highlight is on a particular station. Press the<br />
View button to see details of the selected item. A red ‘X’<br />
means that the device wasn’t present the last time it was<br />
checked.<br />
3 Press Back to return to the <strong>Network</strong> tab, or press Main<br />
Menu to return to the beginning screen.<br />
28 <strong>Agilent</strong> <strong>FrameScope</strong> <strong>350</strong> User’s Manual
Running an Autotest<br />
<strong>Network</strong> Testing with the <strong>FrameScope</strong> <strong>350</strong> 2<br />
Running an Autotest<br />
This section describes how to run an Autotest on the<br />
network using the <strong>FrameScope</strong> <strong>350</strong>. The <strong>FrameScope</strong> can<br />
store Autotest suites that define which network elements to<br />
test.<br />
1 From the <strong>Network</strong> Overview screen (see page 27) press<br />
the Autotest button. The <strong>Network</strong> Autotest Setup screen<br />
is displayed.<br />
<strong>Agilent</strong> <strong>FrameScope</strong> <strong>350</strong> User’s Manual 29
2 <strong>Network</strong> Testing with the <strong>FrameScope</strong> <strong>350</strong><br />
Running an Autotest<br />
2 If you want to save this Autotest suite, or load a<br />
previously- stored suite, press the Suite button.<br />
3 Select a stored suite from the list or select Create New,<br />
then press the Next button. You can select if<br />
you want to reload the default suite.<br />
4 If you Create New, you will be prompted to enter a new<br />
name.<br />
30 <strong>Agilent</strong> <strong>FrameScope</strong> <strong>350</strong> User’s Manual
<strong>Network</strong> Testing with the <strong>FrameScope</strong> <strong>350</strong> 2<br />
Running an Autotest<br />
5 On the <strong>Network</strong> Autotest Setup window, press the<br />
Iterations button to select how many times the test is to<br />
be run.<br />
6 Enter the number of times you want the test to run in<br />
the number entry box.<br />
7 Enter the time in minutes to wait between tests in the<br />
Interval text box.<br />
8 When you have finished press OK.<br />
9 On the <strong>Network</strong> Autotest Setup screen, use the Delete<br />
and Add buttons to remove or insert elements from the<br />
resources list. You can also use the Add button to enter<br />
new network resources.<br />
10 To change an item on the resources list, select the item<br />
and press the Edit button. You will be able to enter new<br />
details for that network resource.<br />
For more details, see “<strong>Network</strong> <strong>Performance</strong> Autotest” on<br />
page 214.<br />
<strong>Agilent</strong> <strong>FrameScope</strong> <strong>350</strong> User’s Manual 31
2 <strong>Network</strong> Testing with the <strong>FrameScope</strong> <strong>350</strong><br />
Running an Autotest<br />
11 When you have finished setting up the test, press the<br />
Start Test button (or press OK) on the <strong>Network</strong> Autotest<br />
Setup screen. The test will begin.<br />
12 To stop the test at any time press the Stop Test button.<br />
13 To view information about a network element’s results,<br />
select the element from the list and press the Details<br />
button.<br />
14 Press the Save Results button to store the test data on<br />
the CompactFlash card.<br />
The rating numbers will range from 5 to 1, where 5 is best<br />
and 1 is worst. A red ‘X’ will be displayed if an error<br />
occurred during the test. See the next section for how to<br />
change the metrics used to derive the ratings.<br />
32 <strong>Agilent</strong> <strong>FrameScope</strong> <strong>350</strong> User’s Manual
Changing the Autotest Metrics<br />
<strong>Network</strong> Testing with the <strong>FrameScope</strong> <strong>350</strong> 2<br />
Changing the Autotest Metrics<br />
The <strong>FrameScope</strong> <strong>350</strong> provides a measure of service speed<br />
and efficiency by emulating a client device in the network.<br />
By making a request for service to a key device, and<br />
comparing the results to reasonable expectations, it provides<br />
a rating of the service. However, the default numbers used to<br />
determine the rating may not apply to the network under<br />
test.<br />
For example, you may know that the connection to the<br />
available domain name server is over a slow link and this<br />
link cannot be upgraded. Consequently, it may be more<br />
important to have a test that is less sensitive but provides<br />
meaningful results that can be compared over time. The<br />
<strong>FrameScope</strong> <strong>350</strong> rating can be changed. After you’ve run the<br />
test and received a result, such as that shown below on the<br />
left, you can highlight the server address and press Details.<br />
The screen shown in the middle provides the measured<br />
results of the test. If you double click on Name Lookup, you<br />
can change the rating scale to whatever values you choose.<br />
The screen on which you do that is shown below on the<br />
right. This can be done for all rated measurements. See<br />
Chapter 8, “<strong>Network</strong> <strong>Performance</strong> Analyzer Reference”..<br />
<strong>Agilent</strong> <strong>FrameScope</strong> <strong>350</strong> User’s Manual 33
2 <strong>Network</strong> Testing with the <strong>FrameScope</strong> <strong>350</strong><br />
Using the Stations List<br />
Using the Stations List<br />
When a network resource on the <strong>Network</strong> tab is shown with<br />
a black triangle, you can press the resource to display the<br />
<strong>Network</strong> Database screen, which includes the Stations List.<br />
1 On the <strong>Network</strong> tab, press the resource you wish to<br />
view.<br />
Press here to view details<br />
Stations List<br />
2 Use the Scroll button to navigate through the items on<br />
the Station List.<br />
34 <strong>Agilent</strong> <strong>FrameScope</strong> <strong>350</strong> User’s Manual
NOTE<br />
<strong>Network</strong> Testing with the <strong>FrameScope</strong> <strong>350</strong> 2<br />
Using the Stations List<br />
3 Expand or collapse the Station List by selecting a<br />
category and then pressing the Expand (or Collapse)<br />
button.<br />
The Collapse List, Expand List, and View buttons all appear in the same<br />
place on the screen, depending on the currently selected item in the<br />
Station List. See also “Viewing Details and Statistics” on page 36.<br />
4 You can use the Settings button to reorder the Station<br />
List and select what information is displayed.<br />
5 You can use the Database Tools button to update, erase,<br />
load or save the Stations List or delete a resource from<br />
the Stations List.<br />
<strong>Agilent</strong> <strong>FrameScope</strong> <strong>350</strong> User’s Manual 35
2 <strong>Network</strong> Testing with the <strong>FrameScope</strong> <strong>350</strong><br />
Using the Stations List<br />
Viewing Details and Statistics<br />
1 Select a station on the Station List and then press the<br />
View button.<br />
2 Press the Statistics button to view statistics about the<br />
station.<br />
3 On the Station Detail screen, press Tools to see a list of<br />
test tools that can be used on the selected station. These<br />
tools are describe in more detail in the following sections.<br />
36 <strong>Agilent</strong> <strong>FrameScope</strong> <strong>350</strong> User’s Manual
NOTE<br />
<strong>Network</strong> Testing with the <strong>FrameScope</strong> <strong>350</strong> 2<br />
Using the Stations List<br />
The tools that are displayed on the Station Tools list will vary depending on<br />
what type of station you are viewing. Not all tools are available for every<br />
type of station.<br />
<strong>Agilent</strong> <strong>FrameScope</strong> <strong>350</strong> User’s Manual 37
2 <strong>Network</strong> Testing with the <strong>FrameScope</strong> <strong>350</strong><br />
Performing a Ping Test<br />
Performing a Ping Test<br />
The Ping test allows you to check if communications can be<br />
established with a particular remote node. The <strong>FrameScope</strong><br />
“pings” a remote node by sending it a request message. If<br />
the remote device is active and reachable it will respond.<br />
Follow these steps to run a Ping test.<br />
1 From the main <strong>Network</strong> tab or from a device’s display on<br />
the Station List, press the Tools button to display a menu<br />
of available network testing tools.<br />
38 <strong>Agilent</strong> <strong>FrameScope</strong> <strong>350</strong> User’s Manual
<strong>Network</strong> Testing with the <strong>FrameScope</strong> <strong>350</strong> 2<br />
Performing a Ping Test<br />
2 Press the Ping button to call the Ping screen.<br />
3 Enter the device you want to ping in the Target box. You<br />
can enter the device name or address.<br />
4 Select the ping options you want, selecting IP or IPX,<br />
length of the ping, and the number of iterations.<br />
5 Enter the Time To Live and whether you want<br />
fragmentation in the IP Options area. Or if you selected<br />
IPX above, select the IPX request type: Diagnostic or<br />
PING.<br />
6 Press the Start button to begin the ping test.<br />
The Ping Results screen will be displayed.<br />
<strong>Agilent</strong> <strong>FrameScope</strong> <strong>350</strong> User’s Manual 39
2 <strong>Network</strong> Testing with the <strong>FrameScope</strong> <strong>350</strong><br />
Performing a Ping Test<br />
7 Observe the results of the Ping test.<br />
The screen will show the frame length you selected, the<br />
number of requests (pings) sent and the number of<br />
replies received. Data on the response times are also<br />
displayed.<br />
8 To run the test again press the Start button.<br />
40 <strong>Agilent</strong> <strong>FrameScope</strong> <strong>350</strong> User’s Manual
Performing a Trace Route<br />
<strong>Network</strong> Testing with the <strong>FrameScope</strong> <strong>350</strong> 2<br />
Performing a Trace Route<br />
The Trace Route test allows you to determine the path<br />
through the network to a particular device. The <strong>FrameScope</strong><br />
sends data packets over the network and returns the routers<br />
on the path and the time it took for each hop.<br />
The following procedure describes how to run a Trace Route<br />
test.<br />
1 From the main <strong>Network</strong> tab or from a device’s display on<br />
the Station List, press the Tools button to display a menu<br />
of available network testing tools.<br />
<strong>Agilent</strong> <strong>FrameScope</strong> <strong>350</strong> User’s Manual 41
2 <strong>Network</strong> Testing with the <strong>FrameScope</strong> <strong>350</strong><br />
Performing a Trace Route<br />
2 Press the TraceRoute button to call the TraceRoute<br />
screen.<br />
3 Enter the device to which you want to trace in the Target<br />
box. You can enter the device name or address.<br />
4 Select the maximum number of hops to be reported.<br />
5 Press the Start button to begin the TraceRoute test.<br />
The TraceRoute Results screen will be displayed.<br />
42 <strong>Agilent</strong> <strong>FrameScope</strong> <strong>350</strong> User’s Manual
<strong>Network</strong> Testing with the <strong>FrameScope</strong> <strong>350</strong> 2<br />
Performing a Trace Route<br />
6 Observe the results of the TraceRoute test.<br />
The screen will show the number and address of each<br />
hop. In addition the delay (in seconds) to each hop is<br />
shown. The delay is cumulative, but since each<br />
termination is measured individually, an anomaly may<br />
exist where an intermediate time is greater than a<br />
subsequent time due to network performance.<br />
7 To run the test again press the Start button.<br />
<strong>Agilent</strong> <strong>FrameScope</strong> <strong>350</strong> User’s Manual 43
2 <strong>Network</strong> Testing with the <strong>FrameScope</strong> <strong>350</strong><br />
Performing SNMP Queries<br />
Performing SNMP Queries<br />
The simple network management protocol (SNMP) query tool<br />
allows you to send a query to the management information<br />
database (MIB) and retrieve the available information for<br />
that host.<br />
The following procedure describes how to run an SNMP<br />
Query using the <strong>FrameScope</strong> <strong>350</strong>.<br />
1 From the main <strong>Network</strong> tab or from a device’s display on<br />
the Station List, press the Tools button to display a menu<br />
of available network testing tools.<br />
44 <strong>Agilent</strong> <strong>FrameScope</strong> <strong>350</strong> User’s Manual
<strong>Network</strong> Testing with the <strong>FrameScope</strong> <strong>350</strong> 2<br />
Performing SNMP Queries<br />
2 Press the SNMP Queries button to call the SNMP Query<br />
screen.<br />
3 Enter the device to which you want to query in the<br />
Target box. You can enter the device name or address.<br />
4 The SNMP Settings button allows you to add SNMP<br />
communities and ports to the default “public” community<br />
and default port 161 or to change those set up for auto<br />
discovery.<br />
5 Press the Start button to begin the SNMP Query test.<br />
The SNMP Queries Results screen will be displayed.<br />
<strong>Agilent</strong> <strong>FrameScope</strong> <strong>350</strong> User’s Manual 45
2 <strong>Network</strong> Testing with the <strong>FrameScope</strong> <strong>350</strong><br />
Performing SNMP Queries<br />
6 Observe the returned information on the SNMP Queries<br />
results screen.<br />
The screen will show the description, ID, and other<br />
information as returned by the remote host.<br />
7 To run the test again press the Start button.<br />
46 <strong>Agilent</strong> <strong>FrameScope</strong> <strong>350</strong> User’s Manual
Viewing Statistics<br />
<strong>Network</strong> Testing with the <strong>FrameScope</strong> <strong>350</strong> 2<br />
Viewing Statistics<br />
You can use the <strong>FrameScope</strong> to view a variety network<br />
parameters, and see performance statistics for them. The<br />
following procedure describes how to use the <strong>FrameScope</strong>’s<br />
Statistics tool.<br />
1 Press the Tools button on the main <strong>Network</strong> tab to display<br />
the Tools menu or use the shortcut from the <strong>Network</strong><br />
Main Menu by pressing the Utilization bar<br />
<strong>Agilent</strong> <strong>FrameScope</strong> <strong>350</strong> User’s Manual 47<br />
or
2 <strong>Network</strong> Testing with the <strong>FrameScope</strong> <strong>350</strong><br />
Viewing Statistics<br />
2 Press the Statistics button to call the Statistics screen.<br />
Press this to view or<br />
change the<br />
Statistics settings.<br />
Press this to view<br />
the list of saved data<br />
or to delete saved<br />
data.<br />
The screen shows network utilization and other traffic<br />
data such as frame counters, and protocol counters.<br />
3 To view additional details, press any item shown with a<br />
black triangle.<br />
Press Unicasts, Broadcasts, or Multicasts to view the top<br />
talkers for that frame type.<br />
Press Errors to view a breakdown of the types of errors<br />
detected on the network.<br />
4 Press the Settings button on the Statistics screen to switch<br />
between counts and percentages, protocols and frames.<br />
48 <strong>Agilent</strong> <strong>FrameScope</strong> <strong>350</strong> User’s Manual
<strong>Network</strong> Testing with the <strong>FrameScope</strong> <strong>350</strong> 2<br />
Viewing Statistics<br />
5 Press Utilization on the Statistics screen to view the top<br />
talkers (most active devices) on the network.<br />
Press here to<br />
view details<br />
Set the Interval<br />
between 2 to 1080<br />
seconds. The graphs<br />
display statistics of<br />
data captured within<br />
this time interval and<br />
refreshes every<br />
interval time.<br />
<strong>Agilent</strong> <strong>FrameScope</strong> <strong>350</strong> User’s Manual 49
2 <strong>Network</strong> Testing with the <strong>FrameScope</strong> <strong>350</strong><br />
Generating <strong>Network</strong> Traffic<br />
Generating <strong>Network</strong> Traffic<br />
You can use the <strong>FrameScope</strong>’s Traffic Generator to create<br />
network traffic to stress the network and observe how is<br />
reacts under different loads.<br />
The following procedure describes how to use the Traffic<br />
Generator.<br />
1 Press the Tools button on the main <strong>Network</strong> tab to<br />
display the Tools menu.<br />
2 Press the Traffic Generator button. The Traffic Generator<br />
screen will be displayed. To add security to the use of the<br />
traffic generator, since it may disrupt your network, you<br />
may configure a password to prevent someone without<br />
the password from using the traffic generator.<br />
50 <strong>Agilent</strong> <strong>FrameScope</strong> <strong>350</strong> User’s Manual
<strong>Network</strong> Testing with the <strong>FrameScope</strong> <strong>350</strong> 2<br />
Generating <strong>Network</strong> Traffic<br />
3 On the Parameters tab, configure the traffic<br />
characteristics as you desire. Press each parameter<br />
(Frame Length, Frame Rate, and so on) and enter the<br />
value you want in the on- screen keypad. See “Traffic<br />
Generation” on page 238.<br />
4 To inject errors in the generated traffic, press the check<br />
box for the type of error you want (CRC, short frame, or<br />
long frame). See “Traffic Generation” on page 238.<br />
5 To configure the frame characteristics of the traffic, press<br />
the Frame tab.<br />
<strong>Agilent</strong> <strong>FrameScope</strong> <strong>350</strong> User’s Manual 51
2 <strong>Network</strong> Testing with the <strong>FrameScope</strong> <strong>350</strong><br />
Generating <strong>Network</strong> Traffic<br />
6 Press the box buttons to enter the Frame Type, MAC<br />
source, and MAC Destination. See “Traffic Generation” on<br />
page 238. Note that if you select an IP type frame, you<br />
will get additional selections for IP Source and IP<br />
Destination.<br />
7 Press the Start button to begin generating traffic. The<br />
Traffic Generator activity screen is displayed.<br />
8 Observe the traffic statistics. For more information on the<br />
results, see “Traffic Generation” on page 238.<br />
9 If you want to change traffic parameters press the Back<br />
key to return to the Parameters and Frame tabs. To<br />
restart the test press Start.<br />
52 <strong>Agilent</strong> <strong>FrameScope</strong> <strong>350</strong> User’s Manual
<strong>Performance</strong> Tests<br />
NOTE<br />
<strong>Network</strong> Testing with the <strong>FrameScope</strong> <strong>350</strong> 2<br />
<strong>Performance</strong> Tests<br />
<strong>Performance</strong> tests comprise of RFC 2544 tests and IP or<br />
MAC Loopback tests. These tests are used to verify the<br />
performance of network between two network points. Using<br />
this performance tests tool, you can perform the following:<br />
MAC or IP Loopback Test — go to “Performing a MAC or<br />
IP Loopback” on page 54.<br />
RFC 2544 Throughput Test — go to “RFC 2544 Throughput<br />
Test” on page 57.<br />
RFC 2544 Round- trip Latency Test — go to “RFC 2544<br />
Round- trip Latency Test” on page 57.<br />
All performance tests require two <strong>FrameScope</strong> <strong>350</strong>s; one at each end of<br />
the network circuit to be tested.<br />
General settings for the master <strong>FrameScope</strong><br />
To start off any performance test, follow the steps below:<br />
1 Connect two <strong>FrameScope</strong>s to the network. Connect one at<br />
each end of the network circuit you want to test. See<br />
“Connecting to the <strong>Network</strong>” on page 22.<br />
2 On the master <strong>FrameScope</strong>, press the Tools button on the<br />
main <strong>Network</strong> tab.<br />
3 Press <strong>Performance</strong> Tests button on the Tools menu.<br />
<strong>Agilent</strong> <strong>FrameScope</strong> <strong>350</strong> User’s Manual 53
2 <strong>Network</strong> Testing with the <strong>FrameScope</strong> <strong>350</strong><br />
<strong>Performance</strong> Tests<br />
Performing a MAC or IP Loopback<br />
The master or target <strong>FrameScope</strong> sends periodic MAC- level<br />
or IP- level messages to the slave framescope with<br />
user- defined periodic interval. The slave <strong>FrameScope</strong> echoes<br />
back each of these messages. The <strong>FrameScope</strong>s will record<br />
the number of transmitted, received and error frames, the<br />
current, average, minimum and maximum delays of frames.<br />
To perform the tests, see the following steps:<br />
54 <strong>Agilent</strong> <strong>FrameScope</strong> <strong>350</strong> User’s Manual
<strong>Network</strong> Testing with the <strong>FrameScope</strong> <strong>350</strong> 2<br />
<strong>Performance</strong> Tests<br />
1 From the <strong>Performance</strong> Tests menu, select MAC Loopback or<br />
IP Loopback<br />
2 There are two options to search for the slave <strong>FrameScope</strong>:<br />
Option 1: If you do not know the MAC or IP<br />
address/name of the slave <strong>FrameScope</strong>, select Search for<br />
<strong>FrameScope</strong>.<br />
Option 2: For MAC Loopback, unselect the Search for<br />
<strong>FrameScope</strong> checkbox and enter the MAC address of the<br />
slave <strong>FrameScope</strong>. For IP Loopback, enter the IP address<br />
or name of the slave <strong>FrameScope</strong>.<br />
3 In the MAC or IP Loopback menu, press Start or press the<br />
OK button to begin the test.<br />
The <strong>FrameScope</strong> will search the other <strong>FrameScope</strong> on the<br />
network and then report back the link results.<br />
<strong>Agilent</strong> <strong>FrameScope</strong> <strong>350</strong> User’s Manual 55
2 <strong>Network</strong> Testing with the <strong>FrameScope</strong> <strong>350</strong><br />
<strong>Performance</strong> Tests<br />
Option 1: Select<br />
Search for<br />
<strong>FrameScope</strong> to<br />
automatically locate<br />
the slave <strong>FrameScope</strong><br />
within the subnet.<br />
Option 2: Unselect<br />
Search for<br />
<strong>FrameScope</strong> and<br />
enter the MAC<br />
address of the slave<br />
<strong>FrameScope</strong>.<br />
Press Save to save<br />
current test results.<br />
Search results<br />
displays the MAC<br />
address and current<br />
MAC loopback test<br />
results.<br />
Press Interval to<br />
enter time (in<br />
seconds) between<br />
the start time of a<br />
transmitted frame to<br />
the start time of next<br />
transmitted frame<br />
from the master<br />
<strong>FrameScope</strong>.<br />
Option 1: Use auto<br />
search to locate the<br />
slave <strong>FrameScope</strong><br />
within the subnet.<br />
Option 2: Key in the IP<br />
name or IP address of<br />
slave <strong>FrameScope</strong><br />
within the subnet.<br />
56 <strong>Agilent</strong> <strong>FrameScope</strong> <strong>350</strong> User’s Manual
<strong>Network</strong> Testing with the <strong>FrameScope</strong> <strong>350</strong> 2<br />
<strong>Performance</strong> Tests<br />
4 Press Stop to cancel the test or to review the transmission<br />
information on the MAC Loopback or IP Loopback screen.<br />
Performing RFC 2544 Throughput or Latency Test<br />
NOTE<br />
RFC 2544 tests comprise of round- trip latency test and<br />
point- to- point throughput test. In throughput tests, you can<br />
obtain the range of measured frame rate, frame size, and<br />
theoretical limit of media for every frame size. In latency<br />
tests, you can obtain the range of round- trip delay for every<br />
frame size.<br />
For RFC 2544 tests, if the slave <strong>FrameScope</strong> unit is in use, for example,<br />
running a Ping test, an auto-search from the master <strong>FrameScope</strong> unit will<br />
result in Search Failed. A specific search (keying in the IP address) on a<br />
<strong>FrameScope</strong> unit under test will result in Remote Busy.<br />
RFC 2544 Throughput Test<br />
This test is designed to determine the maximum throughput<br />
rate in frames per second for different frame sizes between<br />
two network points. The test sends frames for a specified<br />
number of seconds at a constant frame rate in a single<br />
direction. If the transmitted frame count does not match the<br />
number of frames received by the other side, the transmit<br />
level is reduced. A binary search is conducted to determine<br />
the maximum frame rate that can be forwarded by the<br />
network with no loss. This procedure is repeated for a<br />
number of legal frame sizes to produce a table of maximum<br />
throughput versus frame size.<br />
RFC 2544 Round-trip Latency Test<br />
This test measures the latency experienced by a frame<br />
passing and looping back through the network. A specially<br />
tagged frame is sent and the time that this frame exits and<br />
loopbacks to the <strong>FrameScope</strong> is recorded. Round trip latency<br />
is the difference between the entrance and exit times of the<br />
tagged frame. The reported latency is an average of at least<br />
20 trials. The test is conducted over a range of frame sizes.<br />
<strong>Agilent</strong> <strong>FrameScope</strong> <strong>350</strong> User’s Manual 57
2 <strong>Network</strong> Testing with the <strong>FrameScope</strong> <strong>350</strong><br />
<strong>Performance</strong> Tests<br />
Setting the master <strong>FrameScope</strong> for RFC 2544 Tests<br />
To perform a RFC 2544 test, you will need two<br />
<strong>FrameScope</strong>s, one as master and the other as slave. For<br />
initial settings on the master unit, see “General settings for<br />
the master <strong>FrameScope</strong>” on page 53 and then continue with<br />
the steps below:<br />
1 Ensure that the slave <strong>FrameScope</strong> is ready for RFC 2544<br />
test. For slave <strong>FrameScope</strong> settings, go to “Setting the<br />
slave <strong>FrameScope</strong> for RFC 2544 Tests” on page 62.<br />
2 From the <strong>Performance</strong> Tests menu, select RFC 2544 Test.<br />
3 In the RFC 2544 Test menu, there are two options to<br />
search for the slave <strong>FrameScope</strong>:<br />
Option 1: If you do not know the IP address/name of the<br />
slave <strong>FrameScope</strong>, select Search for <strong>FrameScope</strong>.<br />
Option 2: If you know the IP address/name, enter the<br />
corresponding IP address/name.<br />
58 <strong>Agilent</strong> <strong>FrameScope</strong> <strong>350</strong> User’s Manual
<strong>Network</strong> Testing with the <strong>FrameScope</strong> <strong>350</strong> 2<br />
<strong>Performance</strong> Tests<br />
4 Select Throughput and/or Latency RFC 2544 test options.<br />
Press Suite to load or<br />
create new test suite.<br />
Select RFC 2544 test<br />
options.<br />
To set specific<br />
Throughput or Latency<br />
test parameters, press<br />
Settings.<br />
Press Slave Password<br />
button to enter the<br />
password set by the<br />
slave <strong>FrameScope</strong>.<br />
<strong>Agilent</strong> <strong>FrameScope</strong> <strong>350</strong> User’s Manual 59
2 <strong>Network</strong> Testing with the <strong>FrameScope</strong> <strong>350</strong><br />
<strong>Performance</strong> Tests<br />
5 Optional: If you want to save this RFC 2544 Test suite, or<br />
retrieve a previously stored suite, press the Suite button.<br />
Create New option: Select<br />
this if you want to save a new<br />
test suite. You will be<br />
prompted to enter a new<br />
name.<br />
Load Selected option: Select<br />
a stored suite from the list.<br />
You can select if<br />
you want to reload the default<br />
suite.<br />
6 For specific throughput and latency test settings, press<br />
Settings. For details on its parameters, go to “The<br />
Throughput Settings screen.” on page 61 or “The Latency<br />
Settings screen.” on page 61 respectively.<br />
60 <strong>Agilent</strong> <strong>FrameScope</strong> <strong>350</strong> User’s Manual
The Throughput Settings<br />
screen.<br />
Select the frame directions to<br />
measure.<br />
Max Data Rate is used for initial<br />
frame speed and performance<br />
calculation. Enter the maximum<br />
data rate of the network under<br />
test. If not known, the link speed<br />
will be used.<br />
Specify the frame length (minimum<br />
of 64 bytes to maximum of 1518<br />
bytes) or select full range to collect<br />
all frames of lengths 64, 128, 256,<br />
512, 768, 1024, 1280, and 1518).<br />
The Latency Settings<br />
screen.<br />
<strong>Network</strong> Testing with the <strong>FrameScope</strong> <strong>350</strong> 2<br />
<strong>Performance</strong> Tests<br />
Select to measure all frame rates<br />
or specify the upstream and<br />
downstream rates.<br />
<strong>Network</strong> connection speed<br />
Duration is the time taken (in<br />
seconds) to transmit frames<br />
that could be of different sizes,<br />
at different rates.<br />
Specify the frame length or<br />
select full range to collect all<br />
frames.<br />
Specify the number of<br />
round-trips for the test.<br />
7 If a password is preset in the slave <strong>FrameScope</strong>, press the<br />
Slave Password button on the master <strong>FrameScope</strong> to enter<br />
the password. You will get a warning, “Permission<br />
Denied”, if a password is set in the slave <strong>FrameScope</strong> and<br />
not entered correctly in the master <strong>FrameScope</strong>.<br />
8 Press Start to begin test.<br />
<strong>Agilent</strong> <strong>FrameScope</strong> <strong>350</strong> User’s Manual 61
2 <strong>Network</strong> Testing with the <strong>FrameScope</strong> <strong>350</strong><br />
<strong>Performance</strong> Tests<br />
After pressing the Start button, the master <strong>FrameScope</strong><br />
starts the activation and synchronization procedures with<br />
the slave <strong>FrameScope</strong> by doing the following actions:<br />
1 Search (if enabled) and check status of the slave<br />
<strong>FrameScope</strong><br />
2 Activate the slave <strong>FrameScope</strong> if in idle mode<br />
3 Authenticate the master <strong>FrameScope</strong> if the password is<br />
enabled<br />
4 Set up the slave <strong>FrameScope</strong> parameters by synchronizing<br />
the master and slave <strong>FrameScope</strong>s for the test<br />
5 Start test<br />
6 Query test results at end of test<br />
7 Stop test<br />
Setting the slave <strong>FrameScope</strong> for RFC 2544 Tests<br />
1 From the <strong>Network</strong> main menu, press System.<br />
2 From the System Settings <strong>Network</strong> menu, press RFC 2544<br />
Test.<br />
3 Select the Enable RFC 2544 Test option. You may set a<br />
password in the slave <strong>FrameScope</strong> to enable the master<br />
<strong>FrameScope</strong> login. Press OK.<br />
The slave <strong>FrameScope</strong> is now ready to perform RFC 2544<br />
tests. Do not run other tests on the slave <strong>FrameScope</strong><br />
while RFC 2544 tests are in progress.<br />
62 <strong>Agilent</strong> <strong>FrameScope</strong> <strong>350</strong> User’s Manual
<strong>Network</strong> Testing with the <strong>FrameScope</strong> <strong>350</strong> 2<br />
<strong>Performance</strong> Tests<br />
<strong>Agilent</strong> <strong>FrameScope</strong> <strong>350</strong> User’s Manual 63
2 <strong>Network</strong> Testing with the <strong>FrameScope</strong> <strong>350</strong><br />
<strong>Performance</strong> Tests<br />
.<br />
RFC 2544 Test Results<br />
These are the<br />
screens of the slave<br />
<strong>FrameScope</strong> when<br />
throughput (left)<br />
and latency (right)<br />
RFC 2544 tests are<br />
running.<br />
For full range frame size and frame rate throughput RFC<br />
2544 tests, a graph can be plotted to display the RFC 2544<br />
test results. The graph helps analysis of performance<br />
between two points in the network quickly and efficiently.<br />
These results can then be saved to the compact flash card<br />
for further analysis.<br />
64 <strong>Agilent</strong> <strong>FrameScope</strong> <strong>350</strong> User’s Manual
The IP address of the network<br />
under test. If the name exists, it<br />
will be displayed.<br />
Program Rate is the frame rate<br />
set by user.<br />
Actual Rate is the real frame rate<br />
during the test. The rate may<br />
differ from Program Rate due to<br />
delay or collisions in the network.<br />
<strong>Network</strong> Testing with the <strong>FrameScope</strong> <strong>350</strong> 2<br />
<strong>Performance</strong> Tests<br />
<strong>Agilent</strong> <strong>FrameScope</strong> <strong>350</strong> User’s Manual 65
2 <strong>Network</strong> Testing with the <strong>FrameScope</strong> <strong>350</strong><br />
<strong>Performance</strong> Tests<br />
The IP address of the network<br />
under test. If the name exists, it<br />
will be displayed.<br />
The throughput/ latency test set,<br />
according to frame size. Press the<br />
left or right button to go to the<br />
previous or next test set<br />
respectively.<br />
Upstream - throughput<br />
rates of frames sent from<br />
master <strong>FrameScope</strong>.<br />
Downstream - throughput<br />
rates of frames sent from<br />
slave <strong>FrameScope</strong>.<br />
Max - maximum<br />
theoretical frame rate.<br />
Below frame directions<br />
are frame throughput<br />
rates in frames per<br />
second for each frame<br />
size.<br />
The minimum, average<br />
and maximum delay of<br />
frame obtained from an<br />
average of multiple<br />
measurements<br />
depending on the<br />
number of iterations<br />
set.<br />
66 <strong>Agilent</strong> <strong>FrameScope</strong> <strong>350</strong> User’s Manual
Locating a Hub Port with Blink Port<br />
<strong>Network</strong> Testing with the <strong>FrameScope</strong> <strong>350</strong> 2<br />
Locating a Hub Port with Blink Port<br />
You can use the <strong>FrameScope</strong> to locate a network<br />
connection’s port on a hub or switch. The <strong>FrameScope</strong> will<br />
toggle the port’s link indicator on and off causing it to blink.<br />
This section describes how to use the Blink Port feature of<br />
the <strong>FrameScope</strong> <strong>350</strong>.<br />
1 Connect the <strong>FrameScope</strong> to the remote end of the circuit<br />
whose hub you want to locate. For example, connect the<br />
unit at the network wall circuit.<br />
2 Press the Tools button on the main <strong>Network</strong> tab to<br />
display the Tools menu.<br />
3 Press the Blink Port on the tools menu to call the Blink<br />
Port screen.<br />
<strong>Agilent</strong> <strong>FrameScope</strong> <strong>350</strong> User’s Manual 67
2 <strong>Network</strong> Testing with the <strong>FrameScope</strong> <strong>350</strong><br />
Locating a Hub Port with Blink Port<br />
4 To begin blinking the port, press the Start button.<br />
5 Observe the hub or switch and note which port’s link<br />
indicator is blinking. That will be the port for the tested<br />
circuit.<br />
6 To stop the blink, press the Stop button on the Blink Port<br />
screen.<br />
68 <strong>Agilent</strong> <strong>FrameScope</strong> <strong>350</strong> User’s Manual
Viewing the Error Log<br />
<strong>Network</strong> Testing with the <strong>FrameScope</strong> <strong>350</strong> 2<br />
Viewing the Error Log<br />
This section describes how to view the <strong>FrameScope</strong>’s error<br />
log. The error log tracks and displays any network problems<br />
that detected by the <strong>FrameScope</strong> <strong>350</strong>.<br />
1 From the main <strong>Network</strong> tab, press the Tools button to<br />
display the Tools menu.<br />
<strong>Agilent</strong> <strong>FrameScope</strong> <strong>350</strong> User’s Manual 69
2 <strong>Network</strong> Testing with the <strong>FrameScope</strong> <strong>350</strong><br />
Viewing the Error Log<br />
2 Press the Error Log button to call the Error Log<br />
screen.<br />
3 Observe the errors listed in the log.<br />
4 Press the Show All button to expand the error list and<br />
view all errors that were previously acknowledged by<br />
using the Ack button.<br />
5 Press the Ack button to acknowledge the errors without<br />
clearing the log.<br />
6 Press the Reset button to clear the log.<br />
70 <strong>Agilent</strong> <strong>FrameScope</strong> <strong>350</strong> User’s Manual
Using the Test Database<br />
<strong>Network</strong> Testing with the <strong>FrameScope</strong> <strong>350</strong> 2<br />
Using the Test Database<br />
The <strong>FrameScope</strong> <strong>350</strong> allows you to store (you must have a<br />
CompactFlash card installed) Autotest and <strong>Performance</strong><br />
Test results for later review and downloading. See page 32<br />
for saving Autotest results, page 56 for saving loopback test<br />
results and page 60 for RFC 2544 test results. You can recall<br />
previously stored test data using the Tests Database tool.<br />
This section describes how to recall and delete stored tests.<br />
1 Press the Tools button to call the Tools menu.<br />
2 On the Tools menu, press the Tests Database button.<br />
Three folders appear in the <strong>Network</strong> Test Database screen.<br />
<strong>Network</strong> Autotest results are stored in the <strong>Network</strong> Autotest<br />
folder. RFC 2544 throughput and latency test results are<br />
stored in the RFC 2544 Test folder. IP and MAC loopback<br />
test results are stored in the Loopback Tools Results folder.<br />
The number before the folder names indicates the number<br />
of stored files in the folder.<br />
<strong>Agilent</strong> <strong>FrameScope</strong> <strong>350</strong> User’s Manual 71
2 <strong>Network</strong> Testing with the <strong>FrameScope</strong> <strong>350</strong><br />
Using the Test Database<br />
3 Select the folder and press the + sign, or the Expand List<br />
button.<br />
4 Select the test results file, then press the View button to<br />
display the detailed test results.<br />
5 To delete a stored test, select the test results file and<br />
press the Delete button.<br />
72 <strong>Agilent</strong> <strong>FrameScope</strong> <strong>350</strong> User’s Manual
Using the <strong>Network</strong> Database<br />
NOTE<br />
<strong>Network</strong> Testing with the <strong>FrameScope</strong> <strong>350</strong> 2<br />
Using the <strong>Network</strong> Database<br />
The <strong>FrameScope</strong> <strong>350</strong> allows you to store (only on a<br />
CompactFlash) network topologies for later review and<br />
downloading (see “Using the Stations List” on page 34). You<br />
can recall previously stored network data using the <strong>Network</strong><br />
Database tool. This section describes how to recall and<br />
delete stored network data.<br />
1 Press the Tools button on the <strong>Network</strong> Main Menu to call<br />
the Tools menu.<br />
2 On the Tools menu, press the <strong>Network</strong> Database button<br />
to call the <strong>Network</strong> Database screen.<br />
3 <strong>Network</strong> resources are displayed in a list. Use the Scroll<br />
button or a stylus to select the resource you want.<br />
4 Use the Expand and Collapse buttons to show the items<br />
under the selected resource type.<br />
5 When a network resource is selected, press the View<br />
button to view detailed information about it.<br />
The Expand, Collapse, and View buttons occupy the same spot on the<br />
screen. The button changes depending on what you have selected in the<br />
network list.<br />
<strong>Agilent</strong> <strong>FrameScope</strong> <strong>350</strong> User’s Manual 73
2 <strong>Network</strong> Testing with the <strong>FrameScope</strong> <strong>350</strong><br />
Using the <strong>Network</strong> Database<br />
6 To access the Database Tools menu press the Database<br />
Tools button.<br />
7 To save the current network, or to load previously stored<br />
network data, press the Load/Save Station List button.<br />
74 <strong>Agilent</strong> <strong>FrameScope</strong> <strong>350</strong> User’s Manual
<strong>Network</strong> Testing with the <strong>FrameScope</strong> <strong>350</strong> 2<br />
Using the <strong>Network</strong> Database<br />
8 Use the buttons on the Station List name screen to store<br />
the current network data, load stored data, or delete<br />
stored data. If you are storing data, you will be prompted<br />
to enter a name for the data file.<br />
<strong>Agilent</strong> <strong>FrameScope</strong> <strong>350</strong> User’s Manual 75
2 <strong>Network</strong> Testing with the <strong>FrameScope</strong> <strong>350</strong><br />
Locating Switch Ports<br />
Locating Switch Ports<br />
The <strong>FrameScope</strong> <strong>350</strong> allows you to identify the switch ports<br />
being accessed by the <strong>FrameScope</strong> or any address on the<br />
network.<br />
This section describes how to create a list of switch ports<br />
being used.<br />
1 Press the Tools button to call the Tools menu.<br />
2 On the Tools menu, press the Locate Switch Port button<br />
to call the Locate Switch Port screen.<br />
3 Select the target, either this <strong>FrameScope</strong> or enter the<br />
name or address of the device you want to locate.<br />
76 <strong>Agilent</strong> <strong>FrameScope</strong> <strong>350</strong> User’s Manual
NOTE<br />
<strong>Network</strong> Testing with the <strong>FrameScope</strong> <strong>350</strong> 2<br />
Locating Switch Ports<br />
4 The SNMP Settings button allows you to add SNMP<br />
communities and ports to the default “public” community<br />
and default port 161 or to change those set up for auto<br />
discovery.<br />
5 Press Start to see the results of the Locate Switch Port.<br />
6 Use the Scroll button to scroll through the list if<br />
necessary.<br />
The order of the information presented is not useful and should not be<br />
used in interpreting the list.<br />
<strong>Agilent</strong> <strong>FrameScope</strong> <strong>350</strong> User’s Manual 77
2 <strong>Network</strong> Testing with the <strong>FrameScope</strong> <strong>350</strong><br />
Locating Switch Ports<br />
78 <strong>Agilent</strong> <strong>FrameScope</strong> <strong>350</strong> User’s Manual
<strong>Agilent</strong> <strong>N2610A</strong> <strong>FrameScope</strong> <strong>350</strong> <strong>Network</strong> <strong>Performance</strong> Analyzer<br />
User’s Manual<br />
3<br />
Cable Testing with the <strong>FrameScope</strong> <strong>350</strong><br />
Cable Testing Overview 81<br />
Cable Testing Background 81<br />
Choosing Your Test Configuration 81<br />
Cable Testing Procedure 83<br />
Calibrating the Tester 85<br />
Setting Up an Autotest 86<br />
Opening the Setup Menu 86<br />
Choosing the Profile 86<br />
Choosing the Standard 87<br />
Entering the Site Name 87<br />
Choosing the Labeling Format 89<br />
Choosing the Cable Type 96<br />
Choosing the Connector Type 98<br />
Choosing the Cable Pairing Convention 100<br />
Entering the Operator Names 100<br />
Running an Autotest 103<br />
Saving Test Results 104<br />
Choosing the Data Storage Location 104<br />
Saving the Results 106<br />
Viewing Result Details 107<br />
Interpreting Test Results Detail Screens 108<br />
Using Talksets 112<br />
Talkset Controls 112<br />
Using CompactFlash Cards 113<br />
Installing CompactFlash Cards 113<br />
Configuring CompactFlash Cards 113<br />
Printing Labels 115<br />
Printing Labels On Site 115<br />
Printing Labels from a PC 116<br />
WireMap Adapter Testing 117<br />
WireMap Adapter Operation 117<br />
Procedure for WireMap Testing 118<br />
<strong>Agilent</strong> Technologies<br />
79
3 Cable Testing with the <strong>FrameScope</strong> <strong>350</strong><br />
NOTE<br />
This chapter describes how to perform cable analysis and<br />
troubleshooting using the <strong>Agilent</strong> <strong>FrameScope</strong> <strong>350</strong>.<br />
The cable test features of the <strong>FrameScope</strong> <strong>350</strong> allow you to<br />
easily certify new network installations for compliance with<br />
industry cable standards.<br />
This chapter describes the standard <strong>FrameScope</strong> <strong>350</strong> cable test features.<br />
For information on using Expert Mode, see Chapter 5, “Cable Testing in<br />
Expert Mode”.<br />
80 <strong>Agilent</strong> <strong>FrameScope</strong> <strong>350</strong> User’s Manual
Cable Testing Overview<br />
Cable Testing Background<br />
Cable Testing with the <strong>FrameScope</strong> <strong>350</strong> 3<br />
Cable Testing Overview<br />
Industry standards for structured twisted- pair cabling<br />
require that both ends of each cabling run be tested to find<br />
the worst- case performance conditions. Therefore,<br />
certification testing requires a two- part test solution<br />
comprising a main unit and a remote unit with similar test<br />
capabilities. One test unit tests the cabling run from the<br />
telecommunications closet end of the cable, and the other<br />
test unit tests from the outlet end at the user location.<br />
Telecommunications<br />
Closet<br />
Figure 8 Typical Cable Certification Test Setup<br />
For cable certification testing, the <strong>FrameScope</strong> <strong>350</strong> is one of<br />
the test units required. The other unit is the <strong>Agilent</strong><br />
DualRemote <strong>350</strong>.<br />
Choosing Your Test Configuration<br />
Structured Cabling Link<br />
User Location<br />
Outlet<br />
<strong>FrameScope</strong> DualRemote<br />
There are two common test configurations for cable<br />
certification testing: the link test configuration and the<br />
channel test configuration:<br />
The link configuration is typically used in facilities that<br />
are under construction, and does not include the user’s<br />
patch cords at either end of the cabling run. Patch cords<br />
are usually installed after the facility is occupied.<br />
<strong>Performance</strong> standards are more stringent for link cable<br />
certification.<br />
<strong>Agilent</strong> <strong>FrameScope</strong> <strong>350</strong> User’s Manual 81
3 Cable Testing with the <strong>FrameScope</strong> <strong>350</strong><br />
Cable Testing Overview<br />
The channel configuration provides a full end- to- end<br />
performance certification, including the cable run as well<br />
as the user’s patch cords at each end. The pass/fail limits<br />
for channel performance testing are less stringent than for<br />
link configurations to accommodate the performance<br />
degradation inherent in the two additional modular<br />
connections.<br />
The <strong>FrameScope</strong> and DualRemote use different test probes<br />
for link and channel tests. The link probes incorporate a<br />
short test cord that connects to the outlets in the<br />
telecommunications closet and user location. Channel probes<br />
feature a socket into which you connect one end of the user<br />
patch cord. The other end of the patch cord is connected to<br />
the outlet in the telecommunications closet or user location.<br />
Figure 9 and Figure 10 on page 83 show the link and<br />
channel test connections.<br />
82 <strong>Agilent</strong> <strong>FrameScope</strong> <strong>350</strong> User’s Manual
Cable Testing Procedure<br />
Figure 9 Link Test Configuration<br />
Figure 10 Channel Test Configuration<br />
Cable Testing with the <strong>FrameScope</strong> <strong>350</strong> 3<br />
Cable Testing Overview<br />
Structured Cabling Link<br />
Link Probe Link Probe<br />
<strong>FrameScope</strong> DualRemote<br />
User Patch<br />
Cord<br />
Telecommunications<br />
Closet<br />
Telecommunications<br />
Closet<br />
Channel Probe<br />
Structured Cabling Link<br />
User Location<br />
Outlet<br />
User Location<br />
Outlet<br />
Channel Probe<br />
User Patch<br />
Cord<br />
<strong>FrameScope</strong> DualRemote<br />
The following steps describe the general procedure for<br />
performing cable certification testing using the <strong>FrameScope</strong><br />
and DualRemote testers.<br />
1 Calibrate the <strong>FrameScope</strong> and DualRemote testers that<br />
you will be using. See “Calibrating the Tester” on page 85.<br />
2 Choose a link or channel test configuration to meet your<br />
application. See “Choosing Your Test Configuration” on<br />
page 81.<br />
<strong>Agilent</strong> <strong>FrameScope</strong> <strong>350</strong> User’s Manual 83
3 Cable Testing with the <strong>FrameScope</strong> <strong>350</strong><br />
Cable Testing Overview<br />
3 Switch on the <strong>FrameScope</strong> and DualRemote testers and<br />
connect them to the cabling to be tested. See “Connecting<br />
to the <strong>Network</strong>” on page 22.<br />
4 Press the Cable tab on the <strong>FrameScope</strong>’s Main Menu<br />
screen and then press a test button to begin the test.<br />
You can run a preprogrammed autotest or configure your<br />
own test parameter values before running the test.<br />
See “Choosing the Profile” on page 86.<br />
See “Opening the Setup Menu” on page 86.<br />
5 View the results of the test and store test results as<br />
desired. See “Saving Test Results” on page 104.<br />
84 <strong>Agilent</strong> <strong>FrameScope</strong> <strong>350</strong> User’s Manual
Calibrating the Tester<br />
NOTE<br />
Cable Testing with the <strong>FrameScope</strong> <strong>350</strong> 3<br />
Calibrating the Tester<br />
Before you begin a test, the <strong>FrameScope</strong> and DualRemote<br />
pair must be calibrated. Calibration allows the <strong>FrameScope</strong><br />
to compensate for slight anomalies in its measurement<br />
hardware or that of the companion DualRemote unit.<br />
1 Connect the <strong>FrameScope</strong> <strong>350</strong> and DualRemote <strong>350</strong> in<br />
either of the configurations shown below.<br />
Channel<br />
Probe<br />
2 On the main menu, press Calibration.<br />
3 Follow the onscreen instructions to complete the<br />
calibration.<br />
<strong>Agilent</strong> <strong>FrameScope</strong> <strong>350</strong> User’s Manual 85<br />
Link<br />
Probe<br />
OR<br />
Precision Calibration<br />
Cable<br />
To test link configurations to Category 6, Class E, or higher, <strong>Agilent</strong><br />
recommends calibrating with the precision calibration cable.
3 Cable Testing with the <strong>FrameScope</strong> <strong>350</strong><br />
Setting Up an Autotest<br />
Setting Up an Autotest<br />
Opening the Setup Menu<br />
Choosing the Profile<br />
The tester must be configured for testing at each site by<br />
completing the following procedures.<br />
1 On the Main Menu, press Setup. The Autotest Setup<br />
screen displays.<br />
The <strong>FrameScope</strong> <strong>350</strong> normally displays one or two limit<br />
options on the Main Menu, based upon the profile selected.<br />
If None is selected, then the two limit options are dependent<br />
upon the Standard selected. If the Standard is TIA- 568B,<br />
then the two limit options are Category 5E and Category 6.<br />
Otherwise Class D and Class E are displayed. If the profile<br />
for a specific test is selected, then only that test choice is<br />
displayed. To change the profile:<br />
1 On the Autotest Setup screen, press Profile, then Edit.<br />
The Profile Setup screen displays.<br />
2 Press None, or the profile of choice, then press OK. The<br />
Autotest Setup screen will then show your selected<br />
profile.<br />
86 <strong>Agilent</strong> <strong>FrameScope</strong> <strong>350</strong> User’s Manual
Choosing the Standard<br />
NOTE<br />
Entering the Site Name<br />
Cable Testing with the <strong>FrameScope</strong> <strong>350</strong> 3<br />
Setting Up an Autotest<br />
The <strong>FrameScope</strong> <strong>350</strong> normally tests to the TIA- 568B<br />
standard. For detailed information about test standards,<br />
please visit the website at:<br />
http://<strong>FrameScope</strong>.comms.agilent.com/<br />
The Profile must be set to None in order to change the Standard.<br />
To test to a different standard, follow these steps:<br />
1 On the Autotest Setup screen, press Standard, then Edit.<br />
The Standard Setup screen displays.<br />
2 Select the desired standard, then press OK. The Autotest<br />
Setup screen will then show the selected standard. The<br />
selected standard is applied to all subsequent tests.<br />
The site name identifies the group of settings used on a job,<br />
and can be applied to test records for that site.<br />
To enter the site name:<br />
<strong>Agilent</strong> <strong>FrameScope</strong> <strong>350</strong> User’s Manual 87
3 Cable Testing with the <strong>FrameScope</strong> <strong>350</strong><br />
Setting Up an Autotest<br />
NOTE<br />
1 On the Autotest Setup screen, press Site, then press Edit.<br />
The Site Setup screen displays.<br />
2 Select Create a New Site Name, then press Next. (The<br />
OK button changes to a Next button when you select<br />
Create a New Site Name.) The screen changes, to allow<br />
naming the site.<br />
To change the name or labeling format for an existing site, press the site<br />
name on the list, then select Edit/View and press Next.<br />
3 Press the icon under Enter New Site Name. The onscreen<br />
keyboard opens.<br />
4 Press the keyboard keys to enter the site name, then<br />
press OK. The keyboard closes.<br />
88 <strong>Agilent</strong> <strong>FrameScope</strong> <strong>350</strong> User’s Manual
Choosing the Labeling Format<br />
Cable Testing with the <strong>FrameScope</strong> <strong>350</strong> 3<br />
Setting Up an Autotest<br />
The labeling format specifies the scheme used to label test<br />
records for that site. This format is applied to the test<br />
report and to labels printed for the job. There are three<br />
label format options:<br />
Simple has only one field, such as “cable number”. See<br />
“Simple Label Format” on page 90 for the Simple format<br />
configuration procedure.<br />
TIA- 606- A complies with the TIA- 606- A standard. See<br />
“TIA- 606- A Label Format” on page 91 for the TIA- 606- A<br />
format configuration procedure.<br />
Hierarchical has multiple fields, for designations such as<br />
Building, Floor, Wall Plate, and Jack Number. See<br />
“Hierarchical Label Format” on page 94 for the<br />
Hierarchical format configuration procedure.<br />
1 On the Site Setup screen, press the preferred labeling<br />
format, then press Next.<br />
<strong>Agilent</strong> <strong>FrameScope</strong> <strong>350</strong> User’s Manual 89
3 Cable Testing with the <strong>FrameScope</strong> <strong>350</strong><br />
Setting Up an Autotest<br />
Simple Label Format<br />
When you choose the Simple labeling format, the following<br />
screen displays:<br />
To configure the simple labeling format:<br />
1 If you want the numbers on the labels to increase<br />
automatically with each new label and test, press Enable<br />
Auto- Increment so that a checkmark appears, as in the<br />
figure above.<br />
2 To set the beginning number to other than 1, press the<br />
Enter Start Value field. The onscreen keyboard opens.<br />
3 Press the backspace arrow to erase the number in the<br />
display, then press the number keys to enter the new<br />
starting number. Press OK. The keyboard closes, and the<br />
new starting number appears in the Enter Start Value<br />
field.<br />
90 <strong>Agilent</strong> <strong>FrameScope</strong> <strong>350</strong> User’s Manual
Cable Testing with the <strong>FrameScope</strong> <strong>350</strong> 3<br />
Setting Up an Autotest<br />
4 To set the number of cable runs to label and test, press<br />
the Enter End Value field. The onscreen keyboard opens.<br />
5 Press the backspace arrow to erase the number in the<br />
display, if any, then press the number keys to enter the<br />
new number. Press OK. The keyboard closes, and the new<br />
ending number appears in the Enter End Value field.<br />
6 Press OK. The Autotest Setup screen displays.<br />
TIA-606-A Label Format<br />
When you choose the TIA- 606- A labeling format and press<br />
Next, the following screen displays:<br />
There are three formatting options within the TIA- 606- A<br />
standard:<br />
Class 1 and Class 2 have fields for Floor, Telecom Room,<br />
Panel, and Position.<br />
<strong>Agilent</strong> <strong>FrameScope</strong> <strong>350</strong> User’s Manual 91
3 Cable Testing with the <strong>FrameScope</strong> <strong>350</strong><br />
Setting Up an Autotest<br />
Class 3 has fields for Building, Floor, Telecom Room,<br />
Panel, and Position.<br />
The default Auto- Increment and number settings can be<br />
used, or the settings can be changed using the following<br />
procedures.<br />
To configure the TIA- 606- A labeling format:<br />
1 Press Class 1 or Class 2 if there is only one building on<br />
the site. Press Class 3 if the site includes more than one<br />
building. Press Next. The Site Setup screen changes to<br />
show the fields in the label, the Auto- Increment settings<br />
for the field highlighted, and the start and end values for<br />
the field highlighted.<br />
2 If you want the numbers for any field to increase<br />
automatically with each new label and test, highlight that<br />
field, then press Enable Auto- Increment so that a<br />
checkmark appears, as in the figure above.<br />
92 <strong>Agilent</strong> <strong>FrameScope</strong> <strong>350</strong> User’s Manual
Cable Testing with the <strong>FrameScope</strong> <strong>350</strong> 3<br />
Setting Up an Autotest<br />
3 To set the beginning number for a field to other than 1,<br />
highlight the category name, then press the Enter Start<br />
Value field. The onscreen keyboard opens.<br />
4 Press the backspace arrow to erase the number in the<br />
display, then press the number or letter keys to enter the<br />
new starting value. Press OK. The keyboard closes, and<br />
the new starting value appears in the Enter Start Value<br />
field.<br />
5 To set the number of instances of a category (for<br />
example, the number of floors), press the Enter End<br />
Value field. The onscreen keyboard opens.<br />
6 Press the backspace arrow to erase the value in the<br />
display, then press the number or letter keys to enter the<br />
new value. Press OK. The keyboard closes, and the new<br />
ending value appears in the Enter End Value field.<br />
7 Repeat steps 2 through 6 for all the selected categories.<br />
8 Press OK. The Autotest Setup screen displays.<br />
<strong>Agilent</strong> <strong>FrameScope</strong> <strong>350</strong> User’s Manual 93
3 Cable Testing with the <strong>FrameScope</strong> <strong>350</strong><br />
Setting Up an Autotest<br />
Hierarchical Label Format<br />
When you choose the Hierarchical labeling format, the<br />
following screen displays:<br />
Checkmarks indicate fields that appear in the labels. Yellow<br />
tags next to the categories indicate that automatic number<br />
incrementing is enabled for that field.<br />
To configure the hierarchical labeling format:<br />
1 Press a category to check it for inclusion in the label, or<br />
to uncheck it so it does not appear. When all the desired<br />
categories are checked, press Next. The Site Setup screen<br />
changes to show the selected categories.<br />
2 If you want the numbers for any field to increase<br />
automatically with each new label and test, press the<br />
category, then press Enable Auto- Increment so that a<br />
checkmark appears, as in the figure above.<br />
94 <strong>Agilent</strong> <strong>FrameScope</strong> <strong>350</strong> User’s Manual
Cable Testing with the <strong>FrameScope</strong> <strong>350</strong> 3<br />
Setting Up an Autotest<br />
3 To set the beginning number for a field to other than 1,<br />
press the category name, then press the Enter Start<br />
Value field. The onscreen keyboard opens.<br />
4 Press the backspace arrow to erase the number in the<br />
display, then press the number or letter keys to enter the<br />
new starting value. Press OK. The keyboard closes, and<br />
the new starting value appears in the Enter Start Value<br />
field.<br />
5 To set the number of instances of a category (for<br />
example, the number of floors), press the Enter End<br />
Value field. The onscreen keyboard opens.<br />
6 Press the backspace arrow to erase the value in the<br />
display, then press the number or letter keys to enter the<br />
new value. Press OK. The keyboard closes, and the new<br />
ending value appears in the Enter End Value field.<br />
7 Repeat steps 2 through 6 for all the selected categories.<br />
<strong>Agilent</strong> <strong>FrameScope</strong> <strong>350</strong> User’s Manual 95
3 Cable Testing with the <strong>FrameScope</strong> <strong>350</strong><br />
Setting Up an Autotest<br />
Choosing the Cable Type<br />
NOTE<br />
8 Press OK. The Autotest Setup screen displays.<br />
Cable from different manufacturers has different<br />
transmission characteristics. The <strong>FrameScope</strong> <strong>350</strong><br />
compensates for those differences if you tell it what cable is<br />
used on the job. A solid black cable spool icon indicates a<br />
shielded cable, a grey cable spool icon indicates an<br />
unshielded cable.<br />
1 On the Autotest Setup screen, press the cable spool icon,<br />
then press Edit. The Cable Setup screen displays.<br />
The scroll bar on the right of the screen shows the location of the data<br />
shown and is not a functional scroll bar. To scroll use the scroll button at<br />
the lower right of the <strong>FrameScope</strong>.<br />
2 Select the cable manufacturer, and press Next. The Cable<br />
Database screen displays.<br />
3 Select a cable on the list, and press OK. The Autotest<br />
Setup screen displays, with the selected cable type next to<br />
the cable spool icon. If you do not see the cable on list,<br />
see the next section.<br />
Adding a new cable type<br />
If you have a cable which is not in the cable database, you<br />
can add a new cable description to the database.<br />
1 If the manufacturer is not present, leave the manufacturer<br />
as Unspecified. If the manufacturer is present in the list,<br />
select it, then press Next. The Cable Database screen is<br />
96 <strong>Agilent</strong> <strong>FrameScope</strong> <strong>350</strong> User’s Manual
Cable Testing with the <strong>FrameScope</strong> <strong>350</strong> 3<br />
Setting Up an Autotest<br />
displayed. In either case you will be offered stored<br />
descriptions of cable types. If one of the stored<br />
descriptions matches the cable being tested select it, then<br />
press OK.<br />
2 If not highlight Add New Description and press Next.<br />
3 Enter the name to be added to the database and press<br />
Next.<br />
4 Enter the pair count, cable construction, and impedance<br />
(default selections are available) and press Next.<br />
5 Enter the nominal velocity of propagation (NVP) for each<br />
pair, if known, or select Calculate NVP from length. If<br />
you need to calculate the NVP from length, attach at least<br />
50 feet of cable to the <strong>FrameScope</strong> with the far end<br />
disconnected, enter the measured length, and press<br />
Calculate. The NVP as a percentage of the speed of light<br />
will be supplied in the NVP window. Press Next.<br />
6 Select the target performance grade of the cable if known<br />
and press OK.<br />
<strong>Agilent</strong> <strong>FrameScope</strong> <strong>350</strong> User’s Manual 97
3 Cable Testing with the <strong>FrameScope</strong> <strong>350</strong><br />
Setting Up an Autotest<br />
Choosing the Connector Type<br />
NOTE<br />
The Autotest Setup screen displays, with the new cable type next to the<br />
cable spool icon.<br />
Connectors from different manufacturers have different<br />
transmission characteristics. The <strong>FrameScope</strong> <strong>350</strong><br />
compensates for those differences, if you tell it what<br />
connectors are used on the job.<br />
1 On the Autotest Setup screen, press the connector icon,<br />
then press Edit. The Connector Setup screen displays.<br />
The scroll bar on the right of the screen shows the location of the data<br />
shown and is not a functional scroll bar. To scroll use the scroll button at<br />
the lower right of the <strong>FrameScope</strong>.<br />
98 <strong>Agilent</strong> <strong>FrameScope</strong> <strong>350</strong> User’s Manual
Cable Testing with the <strong>FrameScope</strong> <strong>350</strong> 3<br />
Setting Up an Autotest<br />
2 Select the manufacturer of the connector, then Next. A<br />
list of that manufacturer’s connectors displays.<br />
3 Select the name of the connector, then press OK. The<br />
Autotest Setup screen displays, with the selected<br />
connector type next to the connector icon. If you do not<br />
see the connector on list, see the next section.<br />
Adding a new connector type<br />
If you have a connector which is not in the connector<br />
database, you can add a new connector description to the<br />
database.<br />
1 If the manufacturer is not present, leave the manufacturer<br />
as Unspecified. If the manufacturer is present in the list,<br />
select it, then press Next. The next Connector Setup<br />
screen is displayed. In either case you will be offered<br />
stored descriptions of connector types. If one of the<br />
stored descriptions matches the connector being tested<br />
select it, then press OK.<br />
2 If not highlight Add New Description and press Next.<br />
3 Enter the name to be added to the database and press<br />
Next.<br />
4 Select whether the connector is shielded or not and press<br />
Next.<br />
5 Select the performance grade of the connector if known<br />
and press OK. The Autotest Setup screen displays, with the new<br />
connector type next to the connector icon.<br />
<strong>Agilent</strong> <strong>FrameScope</strong> <strong>350</strong> User’s Manual 99
3 Cable Testing with the <strong>FrameScope</strong> <strong>350</strong><br />
Setting Up an Autotest<br />
Choosing the Cable Pairing Convention<br />
Entering the Operator Names<br />
To identify the correct pair in the test results, the<br />
<strong>FrameScope</strong> must be told what cable pairing convention is<br />
used. For example, if the 3,6 pair fails a test, it would be<br />
“Pair 2” if using T568A pairing, but it would be “Pair 3” if<br />
using T568B pairing.<br />
1 On the Autotest Setup screen, press Cable Pairing, then<br />
press Edit. The Cable Pairing Setup screen displays.<br />
2 Press the cable pairing convention used on the job, then<br />
press OK. The Autotest Setup screen displays, with the<br />
cable pairing convention named.<br />
The names of the technicians performing the tests can be<br />
entered, and will appear on the test report.<br />
To enter the test technicians’ names:<br />
100 <strong>Agilent</strong> <strong>FrameScope</strong> <strong>350</strong> User’s Manual
Cable Testing with the <strong>FrameScope</strong> <strong>350</strong> 3<br />
Setting Up an Autotest<br />
1 On the Main Menu, press System. The System Settings<br />
screen displays.<br />
2 Press Operators, then press Edit. The Operator Setup<br />
screen displays.<br />
3 Choose the <strong>FrameScope</strong> unit’s testing location, either<br />
Telecom Room, Outlet, or Other.<br />
4 Press the <strong>FrameScope</strong> Operator field. The onscreen<br />
keyboard opens, with “<strong>FrameScope</strong> Operator” at the top<br />
or a list of previously entered names will appear with the<br />
keyboard and keypad buttons available.<br />
5 Pick a name from the list or press the keyboard keys to<br />
enter the name of the technician using the <strong>FrameScope</strong>,<br />
then press OK. The keyboard closes, and the technician’s<br />
name appears in the <strong>FrameScope</strong> Operator field of the<br />
Operator Setup screen.<br />
<strong>Agilent</strong> <strong>FrameScope</strong> <strong>350</strong> User’s Manual 101
3 Cable Testing with the <strong>FrameScope</strong> <strong>350</strong><br />
Setting Up an Autotest<br />
6 Choose the DualRemote unit’s testing location, either<br />
Telecom Room, Outlet, or Other.<br />
7 Press the DualRemote Operator field. The onscreen<br />
keyboard opens, with “DualRemote Operator” at the top<br />
or a list of previously entered names will appear with the<br />
keyboard and keypad buttons available.<br />
8 Pick a name from the list or press the keyboard keys to<br />
enter the name of the technician using the DualRemote,<br />
then press OK. The keyboard closes, and the technician’s<br />
name appears in the DualRemote Operator field of the<br />
Operator Setup screen.<br />
9 Press OK. The System Settings screen displays.<br />
102 <strong>Agilent</strong> <strong>FrameScope</strong> <strong>350</strong> User’s Manual
Running an Autotest<br />
NOTE<br />
To run an autotest:<br />
Cable Testing with the <strong>FrameScope</strong> <strong>350</strong> 3<br />
Running an Autotest<br />
1 If this is the first test of the day or after a long break,<br />
calibrate the tester. See “Calibrating the Tester” on<br />
page 85.<br />
2 Connect the <strong>FrameScope</strong> <strong>350</strong> and Dual Remote <strong>350</strong> to the<br />
ends of the circuit needing certification.<br />
3 On the <strong>FrameScope</strong> Main Menu, press the button<br />
identifying the selected test. The test executes.<br />
If no changes were made to the default testing standards or profiles, the<br />
Main Menu shows buttons for Category 5E and Category 6 tests. If the<br />
Profile has been changed, the Main Menu shows only one test button,<br />
indicating the new test profile.<br />
4 If the autotest passes, the screen will look like this:<br />
5 To save the test results, see “Saving Test Results” on<br />
page 104.<br />
<strong>Agilent</strong> <strong>FrameScope</strong> <strong>350</strong> User’s Manual 103
3 Cable Testing with the <strong>FrameScope</strong> <strong>350</strong><br />
Saving Test Results<br />
Saving Test Results<br />
NOTE<br />
Before saving test results, choose the storage site to save<br />
them to.<br />
The procedures below show screens from the copper testing<br />
configuration. The procedures for fiber testing are essentially the same,<br />
but the screens may differ in minor details.<br />
Choosing the Data Storage Location<br />
Test data can be saved to either the <strong>FrameScope</strong>’s internal<br />
memory or to an installed CompactFlash card. To choose<br />
the data storage location:<br />
1 On the Main Menu, press System. The System Settings<br />
screen displays.<br />
104 <strong>Agilent</strong> <strong>FrameScope</strong> <strong>350</strong> User’s Manual
Cable Testing with the <strong>FrameScope</strong> <strong>350</strong> 3<br />
Saving Test Results<br />
2 On the System Settings screen, press Save To, then press<br />
Edit. The Storage Setup screen displays.<br />
3 Select either Internal Flash or CFlash Card.<br />
4 If you chose Internal Flash, press OK. The System<br />
Settings screen displays, with “Internal Flash” next to<br />
Save To.<br />
5 If you chose CFlash Card, press Next. The Storage Setup<br />
screen displays a message about preparing the<br />
CompactFlash card. The Storage Setup screen displays a<br />
list of the steps in preparing the CF card, and a progress<br />
bar.<br />
6 When the progress bar shows 100%, press OK. The System<br />
Settings screen displays, with “CFlash Card” next to Save<br />
To.<br />
<strong>Agilent</strong> <strong>FrameScope</strong> <strong>350</strong> User’s Manual 105
3 Cable Testing with the <strong>FrameScope</strong> <strong>350</strong><br />
Saving Test Results<br />
Saving the Results<br />
To save the test results for inclusion in certification reports:<br />
1 After completing a test, press the Save button. The Save<br />
Results screen displays.<br />
2 If the cable ID in the display is wrong, press the<br />
backspace arrow to erase it, and press the keyboard keys<br />
to enter the correct cable ID. For a cable ID with multiple<br />
fields, press Shift, then Tab to back up to a prior field,<br />
or use your stylus or finger to get to the desired field. An<br />
unshifted Tab will move the cursor forward one field.<br />
3 When the label is correct, press the Save button. The<br />
<strong>FrameScope</strong> saves the results of the test to the chosen<br />
storage site. If you have a multiple- field cable ID, there<br />
must be a value in every field, including before the first<br />
yellow dot and after the last yellow dot.<br />
106 <strong>Agilent</strong> <strong>FrameScope</strong> <strong>350</strong> User’s Manual
Viewing Result Details<br />
Cable Testing with the <strong>FrameScope</strong> <strong>350</strong> 3<br />
Viewing Result Details<br />
A Details button on Pass and Fail screens opens the Test<br />
Data screen.<br />
The Test Data screen lists the test parameters and indicates<br />
passing or failure for each.<br />
To view detailed test data for one of the test parameters:<br />
1 Press the name of the test parameter. The Test Data<br />
screen displays buttons appropriate for the selected<br />
parameter.<br />
For example, when NEXT is selected, the screen includes<br />
Data, Plots, and Locator buttons, while pressing<br />
WireMap shows only the Data button.<br />
2 To view the Data screen for the selected test parameter,<br />
press Data. The Data screen displays.<br />
<strong>Agilent</strong> <strong>FrameScope</strong> <strong>350</strong> User’s Manual 107
3 Cable Testing with the <strong>FrameScope</strong> <strong>350</strong><br />
Viewing Result Details<br />
3 To view the Plots screen for the selected test parameter<br />
(if the Plots button is present), press Plots. The Plots<br />
screen displays.<br />
4 To view the Locator screen for the selected test parameter<br />
(if the Locator button is present), press Locator. The<br />
Locator screen displays.<br />
Interpreting Test Results Detail Screens<br />
The various test detail screens present test data in different<br />
formats, as explained below.<br />
108 <strong>Agilent</strong> <strong>FrameScope</strong> <strong>350</strong> User’s Manual
Data Screens<br />
Cable Testing with the <strong>FrameScope</strong> <strong>350</strong> 3<br />
Viewing Result Details<br />
The Data screen shows detail of the selected test parameter<br />
results. The examples above show data of a passing test, at<br />
left, and a failing one, at right. The data included depends<br />
on which parameter is selected. (See steps 2, 3, and 4 of the<br />
“Viewing Result Details” on page 107.)<br />
The Data screens shown above include a table that displays<br />
details of the test results for two twisted pairs of copper<br />
cable. To view the results for a different set of twisted pairs,<br />
press it on the list.<br />
Plots Screens<br />
Plots screens display test results as plots on a graph. The<br />
examples above show plots of a passing test, at left, and a<br />
failing one, at right. A smooth red line on the plot indicates<br />
the limit boundary between passing and failure. The Worst<br />
Margin button places a vertical line on the plot at the<br />
<strong>Agilent</strong> <strong>FrameScope</strong> <strong>350</strong> User’s Manual 109
3 Cable Testing with the <strong>FrameScope</strong> <strong>350</strong><br />
Viewing Result Details<br />
frequency where the test results come closest to the pass/fail<br />
boundary on passing test plots. On failing test plots, the<br />
Worst Margin button places the line at the frequency where<br />
the results exceed the acceptable limits the most. You can<br />
move the cursor around the plot screen by pressing the area<br />
you want to see and then using the scroll rocker to fine tune<br />
the location. The frequency of the cursor is displayed and<br />
the values in the table correspond to the cursor location.<br />
A chart below the plot shows detail results of the current<br />
location of the cursor at the <strong>FrameScope</strong> and DualRemote,<br />
and the limits for the test parameter, as follows:<br />
Data This is the worst case of the test results at the cursor<br />
location.<br />
Limit The limit of passing results, set when the test<br />
standard is chosen at the cursor location.<br />
Margin The difference between the Data value and the<br />
Limit value at the cursor location.<br />
The plots are color coded for different wire pairs. The plot<br />
lines displayed can be changed by pressing Settings and<br />
selecting All Plots, All Local Plots, All Remote Plots, Worst<br />
Case Plot, or Select Single Plot. You can also choose to show<br />
plots to 100 MHz, 250 MHz, or <strong>350</strong> MHz ,as long as the test<br />
was run to the frequency selected. For example, if the test<br />
was run to 250 MHz, you could not see plots to <strong>350</strong> MHz.<br />
See “Setting the Maximum Frequency” on page 161.<br />
110 <strong>Agilent</strong> <strong>FrameScope</strong> <strong>350</strong> User’s Manual
NOTE<br />
Locator Screens<br />
Cable Testing with the <strong>FrameScope</strong> <strong>350</strong> 3<br />
Viewing Result Details<br />
Locator screens aid in finding faults on the tested cable. The<br />
examples above show Locator screens for a passing test, at<br />
left, and a failing one, at right. Note the difference in the<br />
plots, where the failing result shows a peak where the<br />
failure occurs. The tape measure provides a reading of<br />
where the failure occurs. It will be placed on the right- hand<br />
side of the screen if showing the distance from the<br />
DualRemote. If there are more than one peak, you can press<br />
the plot area near the peak and fine tune the location using<br />
the scroll button to find the exact distance to that peak. By<br />
default, the distance shown is how far away the worst test<br />
result is from the closer of the <strong>FrameScope</strong> or DualRemote.<br />
To see the locator results for the different sets of twisted<br />
pair cables, press them on the list.<br />
Failures very near the ends of a cable run are usually because of<br />
termination errors such as a bad crimp. Failures far from the ends of a<br />
cable run are usually a fault with the cable itself.<br />
<strong>Agilent</strong> <strong>FrameScope</strong> <strong>350</strong> User’s Manual 111
3 Cable Testing with the <strong>FrameScope</strong> <strong>350</strong><br />
Using Talksets<br />
Using Talksets<br />
NOTE<br />
NOTE<br />
Talkset Controls<br />
The 2- Way Talkset Kit (N2605A- 137) allows operators at<br />
opposite ends of a copper cable run to coordinate their<br />
efforts.<br />
The talksets do not work with optical fiber cabling.<br />
To use talksets for communicating between the ends of a<br />
cable run:<br />
1 Insert a talkset’s plug into the talkset jack on the<br />
<strong>FrameScope</strong>, and the plug of another talkset into the jack<br />
of the DualRemote. See “Talkset Port” on page 13, for the<br />
jack’s location.<br />
2 Connect the <strong>FrameScope</strong>’s and DualRemote’s SmartProbes<br />
to the ends of a cable run.<br />
3 Speak and listen as with any telephone headset.<br />
When a test is running, talkset communication is disabled. Wait until the<br />
test is finishes before speaking.<br />
The <strong>FrameScope</strong> talksets have two controls:<br />
Microphone mute switch<br />
Earphone volume<br />
The thumbwheel in the inside curve of the control<br />
housing controls the earphone volume.<br />
The switch on the outside curve of the control housing<br />
switches the microphone off.<br />
112 <strong>Agilent</strong> <strong>FrameScope</strong> <strong>350</strong> User’s Manual
Using CompactFlash Cards<br />
NOTE<br />
Cable Testing with the <strong>FrameScope</strong> <strong>350</strong> 3<br />
Using CompactFlash Cards<br />
The <strong>FrameScope</strong> <strong>350</strong> can use CompactFlash cards for<br />
storing large amounts of test data, for transfering data to a<br />
PC, and for installing new software.<br />
Installing CompactFlash Cards<br />
To install a CompactFlash card:<br />
1 Find the CompactFlash card slot in the bottom of the<br />
<strong>FrameScope</strong> <strong>350</strong>. See “CompactFlash Slot” on page 12,<br />
for the location of the slot.<br />
2 Insert the CompactFlash card into the slot. If the card<br />
does not go in easily, make sure it is oriented correctly<br />
with the lip on the bottom.<br />
3 The <strong>FrameScope</strong> detects the card, and asks if you want to<br />
configure the card.<br />
Configuring CompactFlash Cards<br />
NOTE<br />
Use only Type I CompactFlash cards, with storage capacity of 8MB or<br />
higher.<br />
When a CompactFlash card is inserted in the <strong>FrameScope</strong><br />
<strong>350</strong>, the tester detects it and displays a window asking if<br />
you want to configure the card.<br />
If the compact flash card gets corrupted and cannot be read by the<br />
<strong>FrameScope</strong>, you must reformat it using the compact flash reader attached<br />
to the PC.<br />
To configure an installed CompactFlash card:<br />
1 Insert the card in the slot at the bottom of the<br />
<strong>FrameScope</strong>. The Storage window opens.<br />
<strong>Agilent</strong> <strong>FrameScope</strong> <strong>350</strong> User’s Manual 113
3 Cable Testing with the <strong>FrameScope</strong> <strong>350</strong><br />
Using CompactFlash Cards<br />
2 On the Storage dialog box, press Yes. The Storage Setup<br />
screen displays.<br />
3 A screen describing the configuration procedure displays.<br />
The configuration executes in steps.<br />
4 When the progress bar shows 100%, press OK. The<br />
<strong>FrameScope</strong> <strong>350</strong> will automatically change the Save to:<br />
setting on the System Settings to CFlash Card.<br />
114 <strong>Agilent</strong> <strong>FrameScope</strong> <strong>350</strong> User’s Manual
Printing Labels<br />
Printing Labels On Site<br />
Cable Testing with the <strong>FrameScope</strong> <strong>350</strong> 3<br />
Printing Labels<br />
The <strong>FrameScope</strong> <strong>350</strong> can print labels directly to a Brady<br />
TLS2200 label printer. The labeling parameters are set using<br />
the procedure “Choosing the Labeling Format” on page 89.<br />
When the <strong>FrameScope</strong> is configured as described in the<br />
following procedure, a label for the tested cable will be<br />
printed after saving a test result.<br />
To configure the <strong>FrameScope</strong> <strong>350</strong> to print to the Brady label<br />
printer:<br />
1 On the Cable Main Menu, press System. The System<br />
Settings screen displays.<br />
2 On the System Settings screen, press Autoprint, then<br />
Edit. The Printer Setup screen displays.<br />
<strong>Agilent</strong> <strong>FrameScope</strong> <strong>350</strong> User’s Manual 115
3 Cable Testing with the <strong>FrameScope</strong> <strong>350</strong><br />
Printing Labels<br />
Printing Labels from a PC<br />
3 Press Autoprint to enable the Autoprint function. A<br />
checkmark shows that the function is enabled. Press OK<br />
4 Connect the N2605A- 050 interface cable to the serial<br />
ports of the <strong>FrameScope</strong> <strong>350</strong> and Brady TLS2200.<br />
5 Turn the Brady printer on.<br />
6 Press the Func and Exit keys on the printer<br />
simultaneously. This sets the printer to Peripheral mode.<br />
Refer to the ScopeData Pro User’s Guide for instructions on<br />
printing labels using a PC.<br />
116 <strong>Agilent</strong> <strong>FrameScope</strong> <strong>350</strong> User’s Manual
WireMap Adapter Testing<br />
Cable Testing with the <strong>FrameScope</strong> <strong>350</strong> 3<br />
WireMap Adapter Testing<br />
WireMap testing checks for proper continuity and<br />
termination of cables. Without a DualRemote, you can use<br />
the WireMap Adapter for wiremap testing.<br />
The wiremap adapter is connected at the far end of a link<br />
or channel to display and identify point- to- point four<br />
twisted pairs connection.<br />
The test identifies the following faults:<br />
Short circuit<br />
Open circuit<br />
Reversed pairs<br />
Transposed pairs<br />
WireMap Adapter Operation<br />
WireMap Adapter<br />
Shield continuity faults<br />
Four indicator LEDs. The LED will light up when<br />
the associated twisted pair is connected<br />
correctly.<br />
When the wiremap adapter is connected to the <strong>FrameScope</strong>,<br />
the <strong>FrameScope</strong> sends a sequence of DC, TTL level signals<br />
through the wire pairs in order of a few 100 milliseconds.<br />
For each step of this sequence of signalling, the DC voltage<br />
<strong>Agilent</strong> <strong>FrameScope</strong> <strong>350</strong> User’s Manual 117
3 Cable Testing with the <strong>FrameScope</strong> <strong>350</strong><br />
WireMap Adapter Testing<br />
is measured by the receiver of the <strong>FrameScope</strong>. The<br />
<strong>FrameScope</strong> software identifies wiremap information based<br />
on the readings.<br />
LED Indicators<br />
Procedure for WireMap Testing<br />
The wiremap adapter has four LEDs, each connected to a<br />
wire pair. After completion of a test, if all pairs are correctly<br />
connected, all four LEDs will light up. The LED<br />
corresponding to a pair that is not properly connected will<br />
remain off (not lighted). These LED indicators can assist in<br />
testing such that the person located at the remote end can<br />
get a quick idea of the results.<br />
1 Connect the <strong>FrameScope</strong> and cable under test to the<br />
WireMap Adapter.<br />
2 From the <strong>Network</strong> Main Menu, press Tools, then press<br />
WireMap.<br />
3 Click Start Test.<br />
118 <strong>Agilent</strong> <strong>FrameScope</strong> <strong>350</strong> User’s Manual
Cable Testing with the <strong>FrameScope</strong> <strong>350</strong> 3<br />
WireMap Adapter Testing<br />
The test will run for a few seconds before displaying the<br />
results. If all tests pass, the results screen will display<br />
“Pass”, similar to the screen below.<br />
Pair number<br />
Wire numbers<br />
Otherwise, results will show “Fail” with details of error in<br />
red.<br />
<strong>Agilent</strong> <strong>FrameScope</strong> <strong>350</strong> User’s Manual 119
3 Cable Testing with the <strong>FrameScope</strong> <strong>350</strong><br />
WireMap Adapter Testing<br />
120 <strong>Agilent</strong> <strong>FrameScope</strong> <strong>350</strong> User’s Manual
<strong>Agilent</strong> <strong>N2610A</strong> <strong>FrameScope</strong> <strong>350</strong> <strong>Network</strong> <strong>Performance</strong> Analyzer<br />
User’s Manual<br />
4<br />
Fiber Testing<br />
Fiber Testing Overview 122<br />
Calibrating the Tester 124<br />
Calibrating for Double-Ended Testing 124<br />
Calibrating for Single-Ended Testing 127<br />
Setting Up an Autotest 129<br />
Opening the Settings Menu 129<br />
Choosing the Test Configuration 129<br />
Setting the Loss Limit 130<br />
Setting the Length Limit 133<br />
Choosing the <strong>Network</strong> Limit 134<br />
Entering the Site Name 134<br />
Choosing the Labeling Format 135<br />
Choosing the Cable Type 136<br />
Setting the Modal Bandwidth 138<br />
Choosing the Connector Type 139<br />
Entering the Operator Names 141<br />
Running an Autotest 142<br />
<strong>Agilent</strong> Technologies<br />
121
4 Fiber Testing<br />
Fiber Testing Overview<br />
Fiber Testing Overview<br />
This chapter describes how to certify optical fiber cabling.<br />
The procedures in the chapter are sufficient for most fiber<br />
certification jobs. If the requirements of the job are not<br />
addressed here, refer to Chapter 6, “Expert Fiber Testing”.<br />
Three connection configurations are available for optical<br />
fiber certification testing.<br />
Double-Ended, Single Fiber<br />
Double- ended single fiber configuration tests one fiber, using<br />
two Fiber SmartProbes. For single fiber testing the fiber<br />
must go from the transmitter/laser source on the<br />
DualRemote to the detector on the <strong>FrameScope</strong>. When the<br />
850nm multimode probe is in the DualRemote, the units can<br />
be as much as 4 km apart. When the 1300nm multimode<br />
probe is in the DualRemote, the units can be as much as<br />
10 km apart. When singlemode probes are used, the<br />
<strong>FrameScope</strong> and DualRemote can be as much as 50 km<br />
apart. All maximum lengths are barring excessive loss.<br />
Double-Ended, Fiber Pair<br />
Double- ended fiber pair configuration tests two fibers, using<br />
two Fiber SmartProbes. When multimode probes are used,<br />
the <strong>FrameScope</strong> and DualRemote can be as much as 4 km<br />
122 <strong>Agilent</strong> <strong>FrameScope</strong> <strong>350</strong> User’s Manual
NOTE<br />
Fiber Testing 4<br />
Fiber Testing Overview<br />
apart. When singlemode probes are used, the <strong>FrameScope</strong><br />
and DualRemote can be as much as 50 km apart. All<br />
maximum lengths are barring excessive loss.<br />
Single-Ended, Fiber Pair (Loopback)<br />
Fiber test<br />
jumper<br />
Single- ended loopback configuration tests two fibers, using<br />
one Fiber SmartProbe and a fiber test jumper. When an<br />
850nm multimode probe is used, the <strong>FrameScope</strong> and the<br />
fiber test jumper can be as much as 2 km apart or 4 km<br />
overall fiber length. When an 1300nm multimode probe is<br />
used, the <strong>FrameScope</strong> and the fiber test jumper can be as<br />
much as 5 km apart or 10 km overall fiber length.When<br />
singlemode probes are used, the <strong>FrameScope</strong> and fiber test<br />
jumper can be as much as 25 km apart or 50 km overall. All<br />
maximum lengths are barring excessive loss.<br />
Singlemode Fiber SmartProbes use a laser light source that requires<br />
warming up before use. Before calibrating or testing with singlemode fiber<br />
probes, always connect the probes, turn on the <strong>FrameScope</strong> (and<br />
DualRemote, if used), and wait five minutes for most accurate readings.<br />
<strong>Agilent</strong> <strong>FrameScope</strong> <strong>350</strong> User’s Manual 123
4 Fiber Testing<br />
Calibrating the Tester<br />
Calibrating the Tester<br />
Before you begin a test, the <strong>FrameScope</strong> and DualRemote<br />
pair must be calibrated. Calibration allows the <strong>FrameScope</strong><br />
to compensate for slight anomalies in its measurement<br />
hardware or that of the companion DualRemote unit.<br />
Calibrating for Double-Ended Testing<br />
NOTE<br />
Method A<br />
This method is commonly called method A or the 2- jumper<br />
method and is usually recommended for singlemode fiber.<br />
Use the same calibration method whether you are testing two fibers or just<br />
one fiber. Singlemode Fiber SmartProbes use a laser light source that<br />
requires warming up before use. Before calibrating or testing with<br />
singlemode fiber probes, always connect the probes, turn on the<br />
<strong>FrameScope</strong> (and DualRemote, if used), and wait five minutes for most<br />
accurate readings.<br />
1 Insert a Fiber SmartProbe + in the <strong>FrameScope</strong>, and a<br />
Fiber SmartProbe + in the DualRemote. They should both<br />
be either multimode or singlemode.<br />
2 Connect test jumpers to the two Fiber SmartProbes.<br />
3 Connect the test jumpers to each other, using two<br />
couplers. Connect the <strong>FrameScope</strong> transmitter to the<br />
DualRemote detector, and vice versa.<br />
4 Turn on the <strong>FrameScope</strong> and DualRemote.<br />
5 The <strong>FrameScope</strong> detects a Fiber SmartProbe + , and<br />
displays the following window:<br />
124 <strong>Agilent</strong> <strong>FrameScope</strong> <strong>350</strong> User’s Manual
Fiber Testing 4<br />
Calibrating the Tester<br />
6 On the Fiber Main Menu, press Calibration. The Fiber<br />
Calibration screen displays.<br />
7 Choose Double Ended, and press Next. The Fiber<br />
Detection screen displays.<br />
8 When the message below the diagram reads, “Ready to<br />
Calibrate,” press OK. The Calibration window opens.<br />
9 When the window reads, “Calibration Successful,” press<br />
OK in the window. The Fiber Main Menu displays.<br />
Remove the couplers and use the coupler ends of the<br />
jumpers when changing connections. Leave the cable<br />
connections to the FiberProbes intact<br />
Method B<br />
Method B or the 1- jumper method is usually recommended<br />
for multimode fiber.<br />
<strong>Agilent</strong> <strong>FrameScope</strong> <strong>350</strong> User’s Manual 125
4 Fiber Testing<br />
Calibrating the Tester<br />
NOTE<br />
1 Insert a Fiber SmartProbe + in the <strong>FrameScope</strong>, and a<br />
Fiber SmartProbe + in the DualRemote. They should both<br />
be multimode.<br />
2 Connect a single fiber of each of two duplex test jumpers<br />
to the two Fiber SmartProbes with the transmitter of each<br />
connected to the detector of the other with no coupler.<br />
3 Turn on the <strong>FrameScope</strong> and DualRemote, if necessary.<br />
4 On the Fiber Main Menu, press Calibration. The Fiber<br />
Calibration screen displays as above.<br />
5 Choose Double Ended, and press Next. The Fiber<br />
Detection screen displays as above.<br />
6 When the message below the diagram reads, “Ready to<br />
Calibrate,” press OK. The Calibration window opens.<br />
7 When the window reads, “Calibration Successful,” press OK in the<br />
window. The Fiber Main Menu displays. Leave the transmitter<br />
connection to the fiber probe intact. Remove both detector<br />
connections and replace with the previously unused fiber<br />
of the duplex test jumper on each probe.<br />
Method C<br />
Method C is recommended for multi- fiber and small form<br />
factor (SFF) connectors. Because the multi- fiber/SFF<br />
connectors are polarized connecters, ensure that you have<br />
selected the proper connector type in the Autotest Setup<br />
screen, see “Choosing the Connector Type” on page 139.<br />
1 Insert a Fiber SmartProbe + in the <strong>FrameScope</strong>, and a<br />
Fiber SmartProbe + in the DualRemote. They should both<br />
be either multimode or singlemode.<br />
Singlemode Fiber SmartProbes use a laser light source that requires<br />
warming up before use. Before calibrating or testing with singlemode fiber<br />
probes, always connect the probes, turn on the <strong>FrameScope</strong> (and<br />
DualRemote, if used), and wait five minutes for most accurate readings.<br />
2 Connect special ST or SC to multi-fiber/SFF test jumpers<br />
to the two Fiber SmartProbes. These special transition<br />
jumpers are available from the connector manufacturers.<br />
3 Connect the test jumpers to each other, using a special<br />
reference jumper which mates with the multi-fiber/SFF connector. Special reference jumpers are manufacturer<br />
specific. Contact the connector manufacturer for details.<br />
Connect the <strong>FrameScope</strong> transmitter to the DualRemote<br />
detector, and vice versa.<br />
126 <strong>Agilent</strong> <strong>FrameScope</strong> <strong>350</strong> User’s Manual
Fiber Testing 4<br />
Calibrating the Tester<br />
4 Turn on the <strong>FrameScope</strong> and DualRemote, if necessary.<br />
5 On the Fiber Main Menu, press Calibration. The Fiber<br />
Calibration screen displays as above.<br />
6 Choose Double Ended, and press Next. The Fiber<br />
Detection screen displays as above.<br />
7 When the message below the diagram reads, “Ready to<br />
Calibrate,” press OK. The Calibration window opens.<br />
8 When the window reads, “Calibration Successful,” press<br />
OK in the window. The Fiber Main Menu displays.<br />
Remove the reference jumper to start testing.<br />
Calibrating for Single-Ended Testing<br />
NOTE<br />
1 Insert a Fiber SmartProbe + in the <strong>FrameScope</strong>.<br />
Singlemode Fiber SmartProbes use a laser light source that requires<br />
warming up before use. Before calibrating or testing with singlemode fiber<br />
probes, always connect the probes, turn on the <strong>FrameScope</strong> (and<br />
DualRemote, if used), and wait five minutes.<br />
Connect a test jumper to the Fiber SmartProbe + .<br />
Connect the two ends of the test jumper to each other,<br />
using a coupler.<br />
Turn on the <strong>FrameScope</strong>.<br />
The <strong>FrameScope</strong> detects a Fiber SmartProbe + , and<br />
displays the following window:<br />
<strong>Agilent</strong> <strong>FrameScope</strong> <strong>350</strong> User’s Manual 127
4 Fiber Testing<br />
Calibrating the Tester<br />
2 On the Fiber Main Menu, press Calibration. The Fiber<br />
Calibration screen displays.<br />
3 Choose Single Ended, and press Next. The Fiber<br />
Detection screen displays.<br />
4 When the message below the diagram reads, “Ready to<br />
Calibrate,” press OK. The Calibration window opens.<br />
5 When the window reads, “Calibration Successful,” press<br />
OK in the window. The Fiber Main Menu displays.<br />
128 <strong>Agilent</strong> <strong>FrameScope</strong> <strong>350</strong> User’s Manual
Setting Up an Autotest<br />
Opening the Settings Menu<br />
Choosing the Test Configuration<br />
Fiber Testing 4<br />
Setting Up an Autotest<br />
The tester must be configured for testing at each site by<br />
completing the following procedures.<br />
1 On the Main Menu, press Fiber Autotest. The Fiber<br />
Autotest Setup screen displays.<br />
2 Press Edit Settings. The Fiber Autotest Settings screen<br />
displays.<br />
To choose either single- ended or double- ended testing:<br />
<strong>Agilent</strong> <strong>FrameScope</strong> <strong>350</strong> User’s Manual 129
4 Fiber Testing<br />
Setting Up an Autotest<br />
Setting the Loss Limit<br />
1 On the Fiber Autotest Settings screen, press Setup, then<br />
press Edit. The test Configuration Setup screen displays.<br />
2 Press either Double Ended or Single Ended, then press<br />
OK. The Fiber Autotest Settings screen displays, with the<br />
selected configuration next to Setup.<br />
To set the loss limit for fiber testing:<br />
1 On the Fiber Autotest Settings screen, press Loss Limit,<br />
then Edit. The Loss Limit Setup screen displays.<br />
2 Select either Overall Budget Method or Loss/Length<br />
Method, then press Next. Continue by completing the<br />
steps in the matching section that follows.<br />
130 <strong>Agilent</strong> <strong>FrameScope</strong> <strong>350</strong> User’s Manual
Overall Budget Method<br />
Fiber Testing 4<br />
Setting Up an Autotest<br />
Overall Budget Method configures a fixed loss limit value for<br />
each applicable wavelength. If a multimode SmartProbe is<br />
installed, you are asked to specify overall loss budgets for<br />
850 nm and 1300 nm wavelengths. If a singlemode<br />
SmartProbe is installed, you are asked to specify overall loss<br />
budgets for 1310 nm and 1550 nm wavelengths.<br />
When you select Overall Budget Method and press Next on<br />
the Loss Limit Setup screen, the screen changes to the<br />
following:<br />
1 To set the loss limit for a listed wavelength, press the<br />
wavelength field. The numeric keypad opens.<br />
2 Press the backspace arrow to erase the displayed value,<br />
then enter the new limit value. Press OK. The keypad<br />
closes.<br />
3 Press OK. The Fiber Autotest Settings screen displays.<br />
<strong>Agilent</strong> <strong>FrameScope</strong> <strong>350</strong> User’s Manual 131
4 Fiber Testing<br />
Setting Up an Autotest<br />
Loss/Length Method<br />
When Loss/Length Method is selected, the <strong>FrameScope</strong> <strong>350</strong><br />
calculates the limit based on the length of the cable tested.<br />
You can set values for connectors, loss per connector,<br />
splices, and loss per splice. The connector and splice losses<br />
are added to the loss that is calculated by multiplying the<br />
length of the fiber by the loss/Km specification of the<br />
selected cable, which is shown at the bottom of the Setup<br />
screen.<br />
When you select Loss/Length Method and press Next on<br />
the Loss Limit Setup screen, the screen changes to the<br />
following:<br />
1 To set any of the variable values, press the variable. The<br />
numeric keypad opens.<br />
2 Press the backspace arrow to erase the displayed value,<br />
then enter the new variable value. Press OK. The keypad<br />
closes.<br />
3 Press OK. The Fiber Autotest Settings screen displays.<br />
132 <strong>Agilent</strong> <strong>FrameScope</strong> <strong>350</strong> User’s Manual
Setting the Length Limit<br />
To set the length limit for fiber testing:<br />
Fiber Testing 4<br />
Setting Up an Autotest<br />
1 On the Fiber Autotest Settings screen, press Length<br />
Limit, then press Edit. The Length Limit Setup screen<br />
displays.<br />
2 Press the Fiber Length field. The numeric keypad opens.<br />
3 Press the backspace arrow to erase the displayed value,<br />
then enter the new limit value. Press OK. The keypad<br />
closes.<br />
4 Press OK. The Fiber Autotest Settings screen displays.<br />
<strong>Agilent</strong> <strong>FrameScope</strong> <strong>350</strong> User’s Manual 133
4 Fiber Testing<br />
Setting Up an Autotest<br />
Choosing the <strong>Network</strong> Limit<br />
Entering the Site Name<br />
The <strong>FrameScope</strong> <strong>350</strong> can certify cabling for compliance with<br />
the physical medium dependent (PMD) requirements of<br />
popular network interface technologies such as Ethernet or<br />
ATM. <strong>Network</strong> certification can be performed in addition to<br />
certifying to cabling limits.<br />
A pass result for a particular networking technology<br />
indicates that the tested cable run meets the loss and length<br />
requirements necessary to successfully support<br />
communications between devices of that type.<br />
To choose the network limit:<br />
1 On the Fiber Autotest Settings screen, press <strong>Network</strong><br />
Limits, then press Edit. The <strong>Network</strong>s Setup screen<br />
displays.<br />
2 Press a limit to choose it. When you have placed check<br />
marks next to all types of networks you wish to certify,<br />
press OK. The Fiber Autotest Settings screen displays.<br />
The site name identifies the group of settings used on a job.<br />
134 <strong>Agilent</strong> <strong>FrameScope</strong> <strong>350</strong> User’s Manual
Choosing the Labeling Format<br />
Fiber Testing 4<br />
Setting Up an Autotest<br />
1 On the Fiber Autotest Settings screen, press Site, then<br />
press Edit. The Site Setup screen displays.<br />
2 Select Create a New Site Name, then press Next. (The<br />
OK button changes to a Next button when you select<br />
Create a New Site Name.) The screen changes, to allow<br />
naming the site.<br />
3 Press the Enter New Site Name field. The onscreen<br />
keyboard opens.<br />
4 Press the keyboard keys to enter the site name, then<br />
press OK. The keyboard closes.<br />
The labeling format for fiber is the same as that for copper.<br />
See “Choosing the Labeling Format” on page 89 for more<br />
information.<br />
<strong>Agilent</strong> <strong>FrameScope</strong> <strong>350</strong> User’s Manual 135
4 Fiber Testing<br />
Setting Up an Autotest<br />
Choosing the Cable Type<br />
Cable from different manufacturers has different<br />
transmission characteristics. The <strong>FrameScope</strong> <strong>350</strong><br />
compensates for those differences if you tell it what cable is<br />
used on the job. The color of the cable spool icon indicates<br />
multimode (orange) or singlemode (yellow) fiber.<br />
1 On the Fiber Autotest Settings screen, press the spool<br />
icon, then press Edit. The Cable Setup screen displays.<br />
2 Select the cable manufacturer, and press Next. The Cable<br />
Database screen displays.<br />
3 Select a cable on the list, and press OK. The Fiber<br />
Autotest Setup screen displays, with the selected cable<br />
type next to the spool icon. If you do not see the cable on<br />
list, see the next section.<br />
Adding a new cable type<br />
If you have a cable which is not in the cable database, you<br />
can add a new cable description to the database.<br />
1 If the manufacturer is not present, leave the manufacturer<br />
as Unspecified. If the manufacturer is present in the list,<br />
select it, then press Next. The Cable Database screen is<br />
displayed. In either case you will be offered stored<br />
descriptions of cable types. If one of the stored<br />
descriptions matches the cable being tested select it, then<br />
press OK.<br />
2 If not highlight Add New Description and press Next.<br />
3 Enter the name to be added to the database and press<br />
Next.<br />
136 <strong>Agilent</strong> <strong>FrameScope</strong> <strong>350</strong> User’s Manual
Fiber Testing 4<br />
Setting Up an Autotest<br />
4 Select the fiber construction that is appropriate and press<br />
Next.<br />
5 Enter either the nominal velocity of propagation (NVP) of<br />
the fiber cable, OR the fiber cable’s refractive index<br />
(default values are presented) and press Next. If you do<br />
not know either value, but have a known length of cable,<br />
select Calculate NVP from length and select the Test<br />
Configuration and press Next.<br />
6 If you are calculating NVP from length, enter the fiber<br />
length. You may have to calibrate the tester in the test<br />
configuration you have specified, using appropriate test<br />
jumpers. There is a Quick Setup button for specifying the<br />
test configuration and fiber construction for the NVP<br />
measurement. When the proper connection has been<br />
made, a Measure button will appear. Press Measure and<br />
the NVP as a percentage of the speed of light will be<br />
entered in to NVP window. When completed, press Next.<br />
<strong>Agilent</strong> <strong>FrameScope</strong> <strong>350</strong> User’s Manual 137
4 Fiber Testing<br />
Setting Up an Autotest<br />
Setting the Modal Bandwidth<br />
NOTE<br />
7 Enter the nominal specifications of the fiber. Default<br />
values are presented. Press OK and the Fiber Autotest<br />
Settings screen will display with the new cable<br />
description entered beside the cable spool icon.<br />
Modal bandwidth is a selection only available with multimode fiber. If a<br />
single mode fiber cable is selected above, this selection field is not<br />
present.<br />
With multimode fiber, the signal can be transmitted in<br />
different “modes.” The modal bandwidth is a measurement of<br />
the ability of the fiber cable to pass the signal without<br />
adding additional attenuation. Modal bandwidth is a rating<br />
given to the fiber. The fiber manufacturer should be able to<br />
tell what the modal bandwidth of their fiber is. You should<br />
then select the proper Modal Bandwidth in the <strong>FrameScope</strong><br />
<strong>350</strong> before running the test. To set the modal bandwidth for<br />
optical fiber certification:<br />
1 On the Fiber Autotest Settings screen, press Modal BW,<br />
then Edit. The Modal BW Setup screen displays.<br />
2 Choose the modal bandwidth and press OK. The Fiber<br />
Autotest Setup screen displays, with the chosen<br />
bandwidth next to Modal BW.<br />
138 <strong>Agilent</strong> <strong>FrameScope</strong> <strong>350</strong> User’s Manual
Choosing the Connector Type<br />
Fiber Testing 4<br />
Setting Up an Autotest<br />
Connectors of different types have different transmission<br />
characteristics. The <strong>FrameScope</strong> <strong>350</strong> compensates for those<br />
differences, if you tell it what connectors are used on the<br />
job.<br />
1 On the Fiber Autotest Settings screen, press the connector<br />
icon, then Edit. The Connector Setup screen displays.<br />
2 Press Next. A list of that connector types displays.<br />
3 Press the type of the connector, then press OK. The Fiber<br />
Autotest Setup screen displays, with the selected<br />
connector type next to the connector icon. If you do not<br />
see the connector on the list, see the next section.<br />
<strong>Agilent</strong> <strong>FrameScope</strong> <strong>350</strong> User’s Manual 139
4 Fiber Testing<br />
Setting Up an Autotest<br />
Adding a new connector type<br />
If you have a connector which is not in the connector<br />
database, you can add a new connector description to the<br />
database.<br />
1 If the manufacturer is not present, leave the manufacturer<br />
as Unspecified. If the manufacturer is present in the list,<br />
select it, then press Next. The next Connector Setup<br />
screen is displayed. In either case you will be offered<br />
stored descriptions of connector types. If one of the<br />
stored descriptions matches the connector being tested<br />
select it, then press OK.<br />
2 If not highlight Add New Description and press Next.<br />
3 Enter the name to be added to the database and press<br />
Next.<br />
4 Select the fiber connector type from the list of mono- fiber<br />
connectors and multi- fiber connectors shown or select<br />
Unspecified. Press OK and the Fiber Autotest Settings<br />
screen displays with the new connector description beside<br />
the connector icon.<br />
140 <strong>Agilent</strong> <strong>FrameScope</strong> <strong>350</strong> User’s Manual
Entering the Operator Names<br />
Fiber Testing 4<br />
Setting Up an Autotest<br />
The names of the technicians performing the tests can be<br />
entered, and will appear on the test report.<br />
To enter the test technicians’ names:<br />
1 On the Fiber Autotest Setup screen, press Operators,<br />
then Edit. The Operator Setup screen displays.<br />
2 Choose the <strong>FrameScope</strong> unit’s testing location, either<br />
Telecom Room, Outlet, or Other.<br />
3 Press the <strong>FrameScope</strong> Operator field. The onscreen<br />
keyboard opens, with “<strong>FrameScope</strong> Operator” at the top<br />
or a list of previously entered names will appear with the<br />
keyboard and keypad buttons available.<br />
4 Press the keyboard keys to enter the name of the<br />
technician using the <strong>FrameScope</strong>, then press OK. The<br />
keyboard closes, and the technician’s name appears in the<br />
<strong>FrameScope</strong> Operator field of the Operator Setup screen.<br />
5 Choose the DualRemote unit’s testing location, either<br />
Telecom Room, Outlet, or Other.<br />
6 Press the DualRemote Operator field. The onscreen<br />
keyboard opens, with “DualRemote Operator” at the top<br />
or a list of previously entered names will appear with the<br />
keyboard and keypad buttons available.<br />
7 Press the keyboard keys to enter the name of the<br />
technician using the DualRemote, then press OK. The<br />
keyboard closes, and the technician’s name appears in the<br />
DualRemote Operator field of the Operator Setup screen.<br />
8 Press OK and press Main Menu. The Fiber Main Menu<br />
displays.<br />
<strong>Agilent</strong> <strong>FrameScope</strong> <strong>350</strong> User’s Manual 141
4 Fiber Testing<br />
Running an Autotest<br />
Running an Autotest<br />
NOTE<br />
To run an autotest:<br />
1 Connect the <strong>FrameScope</strong> <strong>350</strong> and Dual Remote <strong>350</strong> to the<br />
ends of the circuit needing certification.<br />
2 On the <strong>FrameScope</strong> Fiber Main Menu, press Fiber<br />
Autotest. The Fiber Autotest Setup screen displays.<br />
3 Press Start Test. The autotest executes.<br />
4 Follow the on screen directions, which may include<br />
swapping fiber connections.<br />
To save the test results, see “Saving Test Results” on<br />
page 104.<br />
When disconnecting fibers for swapping, disconnect at the end of the test<br />
jumpers, not at the Fiber SmartProbe + .<br />
142 <strong>Agilent</strong> <strong>FrameScope</strong> <strong>350</strong> User’s Manual
<strong>Agilent</strong> <strong>N2610A</strong> <strong>FrameScope</strong> <strong>350</strong> <strong>Network</strong> <strong>Performance</strong> Analyzer<br />
User’s Manual<br />
5<br />
Cable Testing in Expert Mode<br />
Testing Overview 145<br />
Changing to Expert Mode 146<br />
The Expert Autotest Setup 147<br />
Choosing an Existing Settings Profile 147<br />
Editing an Existing Settings Profile to Remove a Lock 148<br />
Creating a New Settings Profile 150<br />
Setting the Test Limit 152<br />
Viewing Probe Information 153<br />
Setting <strong>Network</strong> Limits 154<br />
Entering the Site Name 154<br />
Choosing the Labeling Format 156<br />
Choosing the Cable Type 156<br />
Choosing the Connector Type 157<br />
Choosing the Cable Pairing Convention 157<br />
Setting the Measurements 158<br />
Setting the Maximum Frequency 161<br />
Setting the Plot Storage Requirements 161<br />
Setting the Storage Location 162<br />
Setting the Operator Names 162<br />
The Expert Tools Menu 163<br />
Running a Quick Check 163<br />
Certifying a <strong>Network</strong> 165<br />
Blinking the Port 166<br />
Learning the NVP of a Cable 167<br />
Measuring the Cable Length 168<br />
Running COAX and TWINAX Autotests 170<br />
COAX Testing 170<br />
Twinax Testing 172<br />
This chapter describes how to perform cable testing in<br />
Expert Mode using the <strong>Agilent</strong> <strong>FrameScope</strong> <strong>350</strong>.<br />
<strong>Agilent</strong> Technologies<br />
143
5 Cable Testing in Expert Mode<br />
NOTE<br />
Expert Mode allows you a great deal of flexibility and<br />
customization when using the cable test features of the<br />
<strong>FrameScope</strong> <strong>350</strong>. Expert Mode allows you to certify new<br />
network installations for compliance with industry cable<br />
standards, while providing detailed control of test setup and<br />
management.<br />
This chapter describes the Expert Mode <strong>FrameScope</strong> <strong>350</strong> cable test<br />
features. For information on using standard cable testing, see Chapter 3,<br />
“Cable Testing with the <strong>FrameScope</strong> <strong>350</strong>”.<br />
144 <strong>Agilent</strong> <strong>FrameScope</strong> <strong>350</strong> User’s Manual
Testing Overview<br />
Cable Testing in Expert Mode 5<br />
Testing Overview<br />
This section provides an overview of cable testing in Expert<br />
Mode. For additional information on cable testing, see “Cable<br />
Testing Background” on page 81.<br />
Expert Mode uses the same two- tester method as regular<br />
cable testing, employing a <strong>FrameScope</strong> <strong>350</strong> at one end and a<br />
DualRemote <strong>350</strong> at the other.<br />
Telecommunications<br />
Closet<br />
Structured Cabling Link<br />
User Location<br />
Outlet<br />
<strong>FrameScope</strong> DualRemote<br />
The following steps describe the general procedure for<br />
performing Expert Mode cable certification testing.<br />
1 Calibrate the <strong>FrameScope</strong> and DualRemote testers that<br />
you will be using. See “Calibrating the Tester” on page 85.<br />
2 Choose a link or channel test configuration to meet your<br />
application. See “Choosing Your Test Configuration” on<br />
page 81.<br />
3 Switch on the <strong>FrameScope</strong> and DualRemote testers and<br />
connect them to the cabling to be tested. See “Connecting<br />
to the <strong>Network</strong>” on page 22.<br />
4 Put the <strong>FrameScope</strong> <strong>350</strong> into Expert Mode. See “Changing<br />
to Expert Mode” on page 146.<br />
5 Run an AutoTest on the network. See page 147.<br />
6 Create a new settings profile (see page 150) or open an<br />
existing settings profile (see page 147).<br />
<strong>Agilent</strong> <strong>FrameScope</strong> <strong>350</strong> User’s Manual 145
5 Cable Testing in Expert Mode<br />
Changing to Expert Mode<br />
Changing to Expert Mode<br />
To change the <strong>FrameScope</strong> from standard configuration to<br />
Expert mode:<br />
1 On the Main menu, press System. The System Settings<br />
screen displays.<br />
2 On the System Settings screen, press User Interface, then<br />
press Edit. The User Interface Setup screen displays.<br />
3 On the User Interface Setup screen, press Expert Mode<br />
to turn it on (a check mark will appear in the box,) then<br />
press OK. The System Settings screen displays.<br />
146 <strong>Agilent</strong> <strong>FrameScope</strong> <strong>350</strong> User’s Manual
The Expert Autotest Setup<br />
Cable Testing in Expert Mode 5<br />
The Expert Autotest Setup<br />
When in the Expert Mode, additional Autotest setup choices<br />
are available.<br />
Choosing an Existing Settings Profile<br />
A profile is a predefined locked set of Autotest settings,<br />
locked to prevent the user from changing them. Default<br />
settings profiles exist for Cat 5, Cat 5E, Cat 6, Class D, and<br />
Class E. Previously defined settings profiles are added to the<br />
list of default profiles. To select an existing settings profile:<br />
1 In Expert Mode, press Autotest on the Main Menu.<br />
2 In the Autotest Setup screen, press Select Settings<br />
Profile.<br />
<strong>Agilent</strong> <strong>FrameScope</strong> <strong>350</strong> User’s Manual 147
5 Cable Testing in Expert Mode<br />
The Expert Autotest Setup<br />
NOTE<br />
3 In the Profile Setup screen, press the desired profile. If<br />
the scroll bar is not full length, use the scroll rocker to<br />
scroll down to see more stored profiles<br />
4 Press OK when done.<br />
5 Press Start Test to run the Autotest.<br />
Locked settings are displayed with a padlock icon along the right edge of<br />
the Autotest Settings screen, reached by pressing Autotest, then pressing<br />
Edit Settings. If a locked setting needs to be changed, edit the profile as<br />
described below. Realize that you are violating the existing profile settings<br />
selection when doing this.<br />
When selecting a setting profile, only the locked settings are set by the<br />
selection. Unlocked settings need to be verified as appropriate for the<br />
environment being tested.<br />
Editing an Existing Settings Profile to Remove a Lock<br />
You may also edit or delete existing profiles, including the<br />
Default profiles. It is recommended that you do not edit nor<br />
delete the Default profiles, as you must reload the software<br />
to get them back in their original form to meet the<br />
standards. To create a profile similar to a default profile,<br />
first select the desired default profile to set the locked<br />
settings. Then create a new profile as described in the next<br />
section.<br />
To edit an existing settings profile:<br />
1 In Expert Mode, press Autotest. On the Autotest Settings<br />
screen, press Edit Settings, then press Profile, then press<br />
Edit.<br />
148 <strong>Agilent</strong> <strong>FrameScope</strong> <strong>350</strong> User’s Manual
Cable Testing in Expert Mode 5<br />
The Expert Autotest Setup<br />
1 On the Profile Setup Screen, press the selected profile,<br />
then press Update Selected, then press Next.<br />
2 Change the lock settings by pressing the appropriate<br />
boxes. The check marks toggle with subsequent presses.<br />
Then press Next. If the Test Probe setting is locked, you<br />
will see the center screen below, which will prompt you<br />
to select the <strong>Performance</strong> Grade of the probe as well as<br />
the Probe Test Count Limit, if desired. Then press Next.<br />
If the Test Probe setting is not locked you will go directly<br />
to the Password Screen, where you can choose to<br />
password protect your profile.<br />
3 If you choose to password protect your profile, you will<br />
be prompted to enter the password. Once you are<br />
satisfied with your password selection, press OK to return<br />
to the Autotest Settings screen, where the locks will be<br />
shown. If it is password protected, you will now be<br />
prompted to enter the password in order to modify this<br />
profile.<br />
<strong>Agilent</strong> <strong>FrameScope</strong> <strong>350</strong> User’s Manual 149
5 Cable Testing in Expert Mode<br />
The Expert Autotest Setup<br />
Creating a New Settings Profile<br />
A new profile may be created either directly on the<br />
<strong>FrameScope</strong> <strong>350</strong> or on a PC using ScopeData Pro and<br />
subsequently downloaded into the <strong>FrameScope</strong> <strong>350</strong>. To<br />
create a settings profile directly on the <strong>FrameScope</strong> <strong>350</strong>:<br />
1 You must configure all the Autotest Settings to the<br />
desired settings prior to creating a new profile. Profiles<br />
created on the <strong>FrameScope</strong> <strong>350</strong> use the existing settings<br />
for all the parameters. See the remainder of this section<br />
to configure the other settings.<br />
2 In Expert Mode, press Autotest. On the Autotest Settings<br />
screen, press Edit Settings, then press Profile, then press<br />
Edit.<br />
3 On the Profile Setup Screen, press Create New Profile,<br />
then press Next. Press anywhere in the Profile Name area<br />
to open a keyboard to allow you to enter the new profile<br />
150 <strong>Agilent</strong> <strong>FrameScope</strong> <strong>350</strong> User’s Manual
Cable Testing in Expert Mode 5<br />
The Expert Autotest Setup<br />
name. After entering the new name, press OK, then press<br />
Next.<br />
4 Change the lock settings by pressing the appropriate<br />
boxes. The check marks toggle with subsequent presses.<br />
Then press Next. If the Test Probe setting is locked, you<br />
will see the center screen below, which will prompt you<br />
to select the <strong>Performance</strong> Grade of the probe as well as<br />
the Probe Test Count Limit, if desired. Then press Next.<br />
If the Test Probe setting is not locked you will go directly<br />
to the Password Screen, where you can choose to<br />
password protect your profile.<br />
5 If you choose to password protect your profile, you will<br />
be prompted to enter the password. Once you are<br />
satisfied with your password selection, press OK to return<br />
to the Autotest Settings screen, where the locks will be<br />
shown. If it is password protected, you will now be<br />
<strong>Agilent</strong> <strong>FrameScope</strong> <strong>350</strong> User’s Manual 151
5 Cable Testing in Expert Mode<br />
The Expert Autotest Setup<br />
Setting the Test Limit<br />
prompted to enter the password in order to modify this<br />
profile.<br />
The Expert Mode allows you to set the test limit according<br />
to several standards. To set the test limit to a certain<br />
standard:<br />
1 In Expert Mode, press Autotest on the Main menu.<br />
2 On the Autotest Setup screen press Edit Settings. On the<br />
Autotest Settings screen press the icon second from the<br />
top of the list that looks like a page with a number or<br />
letter superimposed on it.<br />
3 Then on the Limit Setup screen, select the desired cabling<br />
system performance grade.<br />
152 <strong>Agilent</strong> <strong>FrameScope</strong> <strong>350</strong> User’s Manual
NOTE<br />
Viewing Probe Information<br />
Cable Testing in Expert Mode 5<br />
The Expert Autotest Setup<br />
The scroll bar on the right of the screen shows the location of the data<br />
shown and is not a functional scroll bar. To scroll use the scroll rocker at<br />
the lower right of the <strong>FrameScope</strong>.<br />
4 Then press Next. The next Limit Setup screen allows you<br />
to select Link or Channel test configuration.<br />
The <strong>FrameScope</strong> can display details about the probes<br />
inserted in the tester. If the probes are SmartProbes, the<br />
information includes the number of tests the probes have<br />
performed.<br />
To view detailed information on the probe currently<br />
inserted:<br />
1 In Expert mode, press Autotest on the Main Menu. The<br />
Autotest Setup screen displays.<br />
2 On the Autotest Setup screen, press Edit Settings. The<br />
Autotest Settings screen shows a menu of parameters and<br />
functions.<br />
3 Press the name of the probe, then press View. The Probe<br />
Information screen displays, with information on the<br />
probe inserted in the <strong>FrameScope</strong>.<br />
4 If you desire to check the probe test count before each<br />
test, press Check Probe Test Count and enter the limit<br />
to be tested against.<br />
5 To view information on the probe installed in the<br />
DualRemote, press the DualRemote tab. The Probe<br />
<strong>Agilent</strong> <strong>FrameScope</strong> <strong>350</strong> User’s Manual 153
5 Cable Testing in Expert Mode<br />
The Expert Autotest Setup<br />
Setting <strong>Network</strong> Limits<br />
Entering the Site Name<br />
Information screen displays information about the probe<br />
in the DualRemote after running an Autotest.<br />
6 If you desire to check the DualRemote probe test count<br />
before each test, press Check Probe Test Count and<br />
enter the limit to be tested against.<br />
The <strong>FrameScope</strong> <strong>350</strong> can determine compliance with signal<br />
to noise ratio (SNR) requirements for a variety of popular<br />
LAN technologies. To do this:<br />
1 In Expert Mode, press Autotest on the Main Menu. The<br />
Autotest Settings screen displays.<br />
2 On the Autotest Setup screen press Edit Settings.<br />
3 On the Autotest Settings screen press <strong>Network</strong> Limits.<br />
Then press Edit.<br />
4 On the <strong>Network</strong>s Setup screen press on the appropriate<br />
technology for which you want to certify the tested<br />
cabling. A red check will appear in each technology<br />
selected. Other includes a variety of legacy network<br />
standards.<br />
The site name identifies the group of settings used on a job,<br />
and can be applied to test records for that site.<br />
To enter the site name:<br />
154 <strong>Agilent</strong> <strong>FrameScope</strong> <strong>350</strong> User’s Manual
NOTE<br />
Cable Testing in Expert Mode 5<br />
The Expert Autotest Setup<br />
1 On the Autotest Setup screen, press Site, then press Edit.<br />
The Site Setup screen displays.<br />
2 Press Create a New Site Name, then press Next. (The<br />
OK button changes to a Next button when you select<br />
Create a New Site Name.) The screen changes, to allow<br />
naming the site.<br />
To change the name or labeling format for an existing site, press the site<br />
name on the list, then press Edit/View and Next.<br />
3 Press the icon under Enter New Site Name. The onscreen<br />
keyboard opens.<br />
4 Press the keyboard keys to enter the site name, then<br />
press OK. The keyboard closes.<br />
<strong>Agilent</strong> <strong>FrameScope</strong> <strong>350</strong> User’s Manual 155
5 Cable Testing in Expert Mode<br />
The Expert Autotest Setup<br />
Choosing the Labeling Format<br />
Choosing the Cable Type<br />
NOTE<br />
The labeling format for Expert Mode is the same as that<br />
previously described in Chapter 3, “Cable Testing with the<br />
<strong>FrameScope</strong> <strong>350</strong>”. See “Choosing the Labeling Format” on<br />
page 89 for more information.<br />
Cable from different manufacturers has different<br />
transmission characteristics. The <strong>FrameScope</strong> <strong>350</strong><br />
compensates for those differences if you tell it what cable is<br />
used on the job. A grey cable spool icon indicates UTP<br />
cabling, a black cable spool icon indicates shielded cabling.<br />
1 On the Autotest Setup screen, press the cable spool icon,<br />
then press Edit. The Cable Setup screen displays.<br />
2<br />
The scroll bar on the right of the screen shows the location of the data<br />
shown and is not a functional scroll bar. To scroll use the scroll button at<br />
the lower right of the <strong>FrameScope</strong>.<br />
3 Select the cable manufacturer, and press Next. The Cable<br />
Database screen displays.<br />
4 Select a cable on the list, and press OK. The Autotest<br />
Setup screen displays, with the selected cable type next to<br />
the cable spool icon. If the cable is not in the cable<br />
database, see “Adding a new cable type” on page 96.<br />
156 <strong>Agilent</strong> <strong>FrameScope</strong> <strong>350</strong> User’s Manual
Choosing the Connector Type<br />
NOTE<br />
Cable Testing in Expert Mode 5<br />
The Expert Autotest Setup<br />
Connectors from different manufacturers have different<br />
transmission characteristics. The <strong>FrameScope</strong> <strong>350</strong><br />
compensates for those differences, if you tell it what<br />
connectors are used on the job.<br />
1 On the Autotest Setup screen, press the connector icon,<br />
then press Edit. The Connector Setup screen displays.<br />
The scroll bar on the right of the screen shows the location of the data<br />
shown and is not a functional scroll bar. To scroll use the scroll button at<br />
the lower right of the <strong>FrameScope</strong>.<br />
2 Press the manufacturer of the connector, then Next. A list<br />
of that manufacturer’s connectors displays.<br />
3 Press the name of the connector, then press OK. The<br />
Autotest Setup screen displays, with the selected<br />
connector type next to the connector icon. If the<br />
connector type is not in the connector database, see<br />
“Adding a new connector type” on page 99.<br />
Choosing the Cable Pairing Convention<br />
To identify the correct pair in the test results, the<br />
<strong>FrameScope</strong> must be told what cable pairing convention is<br />
used. For example, if the 3,6 pair fails a test, it would be<br />
“Pair 2” if using T568A pairing, but it would be “Pair 3” if<br />
using T568B pairing.<br />
<strong>Agilent</strong> <strong>FrameScope</strong> <strong>350</strong> User’s Manual 157
5 Cable Testing in Expert Mode<br />
The Expert Autotest Setup<br />
Setting the Measurements<br />
1 On the Autotest Setup screen, press Cable Pairing, then<br />
press Edit. The Cable Pairing Setup screen displays.<br />
Press the cable pairing convention used on the job, then<br />
press OK. The Autotest Setup screen displays, with the cable<br />
pairing convention named.<br />
In Expert Mode, you have the ability to specify in detail<br />
what measurements are used to determine the certification<br />
status of your test. In addition, there are choices for<br />
optional features.<br />
1 In Expert Mode, press Autotest on the Main menu.<br />
2 On the Autotest Setup screen press Edit Settings. On the<br />
Autotest Settings screen press Measurements. The first<br />
Measurements Setup screen identifies the required<br />
measurements for the limits you have selected. It is<br />
possible to disable the measurements, but it is not<br />
recommended. Press Next to view the optional<br />
158 <strong>Agilent</strong> <strong>FrameScope</strong> <strong>350</strong> User’s Manual
Cable Testing in Expert Mode 5<br />
The Expert Autotest Setup<br />
measurements you may want to add to your test. Add<br />
them by pressing the name or box.<br />
3 After you have made your optional choices, press Next to<br />
allow you to enable test result analysis functions. It is<br />
recommended that you should choose Manufacturer<br />
Specific Compensation when you are performing Category<br />
6 channel testing. Press Next when done.<br />
4 The next Measurements Setup screen allows you to choose<br />
between Summary ELFEXT data and Complete ELFEXT<br />
data storage modes. If you have storage space and/or you<br />
will wish to recertify in the future using the stored data,<br />
the Complete ELFEXT Mode is recommended. When<br />
complete, press Next.<br />
5 The next Measurement Setup Screen allows the user to<br />
apply the 3 dB attenuation rule, which provides for<br />
special consideration of measurements where the<br />
attenuation is less than 3 dB or in certain ISO cases, 4<br />
dB. This rule applies to both NEXT and Return Loss in<br />
<strong>Agilent</strong> <strong>FrameScope</strong> <strong>350</strong> User’s Manual 159
5 Cable Testing in Expert Mode<br />
The Expert Autotest Setup<br />
the ISO case, but only to Return Loss in the TIA case.<br />
The <strong>FrameScope</strong> <strong>350</strong> automatically sets this choice based<br />
upon the standard chosen previously. It also implements<br />
the 4 dB appropriately even though it is called the 3 dB<br />
rule. When you are satisfied with the choice, press Next.<br />
6 The last Measurements Setup screen allows you to skip<br />
the automatic fault location calculation. This does not<br />
prevent you from using the locator in the Results Details<br />
function, but prevents the calculation on each test,<br />
including the passing tests. When this selection has been<br />
made, press Next to return to the Autotest Settings<br />
screen.<br />
160 <strong>Agilent</strong> <strong>FrameScope</strong> <strong>350</strong> User’s Manual
Setting the Maximum Frequency<br />
NOTE<br />
Cable Testing in Expert Mode 5<br />
The Expert Autotest Setup<br />
The <strong>FrameScope</strong> <strong>350</strong> allows you to select the maximum<br />
range for swept frequency measurements. The choices<br />
depend somewhat on the standard selected previously, for<br />
example for Category 6, the 100 MHz choice is not available.<br />
To set the maximum frequency:<br />
1 In Expert Mode, press Autotest on the Main menu.<br />
2 On the Autotest Setup screen press Edit Settings. On the<br />
Autotest Settings screen press Max Frequency. On the<br />
Frequency Setup screen select the maximum frequency of<br />
the data being stored.<br />
The reason to select the lowest frequency is to decrease test time and<br />
decrease memory storage. The additional optional data is for information<br />
only, unless you wish to preserve the data for possible later recertification<br />
at a higher frequency standard with ScopeData Pro software on a PC. If<br />
you have not saved the higher frequency data, the recertification may not<br />
be available. For example, if you test to the Category 5E (Class D) standard,<br />
but have limited your maximum frequency to 100 MHz, then you will not be<br />
able to recertify later with the stored data to Category 6 (Class E) which<br />
requires data to 250 MHz.<br />
Setting the Plot Storage Requirements<br />
Another storage choice is available, whether to save plots or<br />
not. Saving plots stores the entire swept frequency<br />
measurement. Summary data is the worst case value for<br />
each test and is the minimum required for standards<br />
compliance. To set the data being stored:<br />
1 In Expert Mode, press Autotest on the Main menu.<br />
<strong>Agilent</strong> <strong>FrameScope</strong> <strong>350</strong> User’s Manual 161
5 Cable Testing in Expert Mode<br />
The Expert Autotest Setup<br />
NOTE<br />
Setting the Storage Location<br />
Setting the Operator Names<br />
2 On the Autotest Setup screen press Edit Settings. On the<br />
Autotest Settings screen press Save, then Edit to bring up<br />
the Save Mode Setup screen. Press Summary Data Only<br />
or Full Data Set.<br />
If you save summary data only, you will not be able to recertify later with<br />
the saved data, since the plots will not be part of the stored data used for<br />
recertification by ScopeData Pro.<br />
This is the same function as that shown in the System<br />
Settings screen. Also when a CompactFlash card is<br />
inserted, this function will automatically set the storage<br />
location to the CompactFlash card. For more details, see<br />
“Using CompactFlash Cards” on page 113.<br />
The names of the technicians performing the tests can be<br />
entered, and will appear on the test report. This is the same<br />
function as that shown in the System Settings section. If it<br />
has been done already there, it is reflected here. For more<br />
details, see “Entering the Operator Names” on page 100.<br />
162 <strong>Agilent</strong> <strong>FrameScope</strong> <strong>350</strong> User’s Manual
The Expert Tools Menu<br />
Running a Quick Check<br />
Cable Testing in Expert Mode 5<br />
The Expert Tools Menu<br />
The Expert mode Tools menu includes the following:<br />
• Quick Check tests the continuity and length of a cable run. See<br />
Running a Quick Check, on page 163.<br />
• Certify <strong>Network</strong>s lets you choose standards for certification of the<br />
network. See Certifying a <strong>Network</strong>, on page 165.<br />
• Blink Port blinks the LED on a circuit at an Ethernet hub or switch<br />
port. This helps locate the far end of a circuit. See Blinking the Port, on<br />
page 166.<br />
• Learn NVP allows the user to determine the NVP (Nominal Velocity of<br />
Propagation) of a sample of cable. See Learning the NVP of a Cable, on<br />
page 167.<br />
• Measure Length measures the length of each pair of a cable whose type<br />
is in the Cable Database. See Measuring the Cable Length, on<br />
page 168.<br />
To open the Tools menu:<br />
1 Change to Expert mode (see page - 146).<br />
2 On the Main Menu, press Tools. The Tools Menu displays.<br />
The Quick Check function tests a cable run for shorts,<br />
opens, shield integrity, correct termination, and length.<br />
To run a Quick Check:<br />
<strong>Agilent</strong> <strong>FrameScope</strong> <strong>350</strong> User’s Manual 163
5 Cable Testing in Expert Mode<br />
The Expert Tools Menu<br />
1 On the Tools menu (see “The Expert Tools Menu” on<br />
page 163), press Quick Check. The test runs, and a Pass<br />
or Fail screen displays.<br />
Viewing Details of Quick Check Results<br />
OR<br />
The <strong>FrameScope</strong> can display detailed information about both<br />
passing and failing results of a Quick Check.<br />
To view results details:<br />
2 On the Quick Check PASS or FAIL screen, press Details.<br />
The Wiremap Data screen displays. The results may be<br />
saved if desired.<br />
164 <strong>Agilent</strong> <strong>FrameScope</strong> <strong>350</strong> User’s Manual
Certifying a <strong>Network</strong><br />
Cable Testing in Expert Mode 5<br />
The Expert Tools Menu<br />
The Expert mode Tools menu includes Certify <strong>Network</strong>,<br />
which lets you test a cable for conformance to different<br />
network standards. To certify a network:<br />
1 Connect the <strong>FrameScope</strong> and DualRemote to the cable.<br />
2 On the Expert mode Tools Menu (see page - 163), press<br />
Certify <strong>Network</strong>. The Certify <strong>Network</strong>s Setup screen<br />
displays.<br />
3 Press a standard in the list to select it. A checkmark<br />
appears next to each selected standard.<br />
4 To test the network to the selected standards, press Start<br />
Test. The test executes, and <strong>FrameScope</strong> displays a Pass<br />
or Fail screen.<br />
You can save and view details of the test results as with any<br />
test by pressing Details. See “Saving Test Results” on<br />
page 104, and “Viewing Result Details” on page 107.<br />
<strong>Agilent</strong> <strong>FrameScope</strong> <strong>350</strong> User’s Manual 165
5 Cable Testing in Expert Mode<br />
The Expert Tools Menu<br />
Blinking the Port<br />
To locate the switch or hub a cable is connected to, the<br />
<strong>FrameScope</strong> <strong>350</strong> can blink the switch or hub port. The<br />
technician using the <strong>FrameScope</strong> at the wall plate end of the<br />
circuit blinks the indicator on the panel at the hub or switch<br />
end. To blink the port:<br />
1 On the Tools menu (see “The Expert Tools Menu” on<br />
page 163), press Blink Port. The Blink Port screen<br />
displays.<br />
2 Press Start. The port begins blinking, and the Start<br />
button changes to a Stop button.<br />
3 To stop the blinking, press Stop. The blinking stops.<br />
166 <strong>Agilent</strong> <strong>FrameScope</strong> <strong>350</strong> User’s Manual
Learning the NVP of a Cable<br />
Cable Testing in Expert Mode 5<br />
The Expert Tools Menu<br />
The <strong>FrameScope</strong> can determine the NVP (Nominal Velocity of<br />
Propagation) of a cable, for use in certification testing. NVP<br />
is expressed as a percentage of the speed of light. you must<br />
use a sample of the cable at least 50 feet (15 meters) long.<br />
Longer cable samples produce more accurate results.<br />
To learn the NVP:<br />
1 Measure the length of a sample of the cable.<br />
2 Connect the cable sample to the <strong>FrameScope</strong>. Do not<br />
connect the DualRemote.<br />
3 On the Expert mode Tools menu (see page - 163), press<br />
Learn NVP. The Learn NVP screen displays.<br />
4 Press the Cable Length field. The numeric keyboard<br />
opens.<br />
5 Press the backspace arrow to erase any value in the<br />
number field, then enter the length of the cable sample,<br />
<strong>Agilent</strong> <strong>FrameScope</strong> <strong>350</strong> User’s Manual 167<br />
72
5 Cable Testing in Expert Mode<br />
The Expert Tools Menu<br />
Measuring the Cable Length<br />
in or meters. Press OK. The keyboard closes, and the<br />
Learn NVP screen displays new number in the Cable<br />
Length field.<br />
6 Press Calculate. The <strong>FrameScope</strong> calculates the NVP of<br />
the sample cable, and displays it in the NVP field.<br />
The <strong>FrameScope</strong> <strong>350</strong> can measure the length of an attached<br />
cable if the cable type is in its database.<br />
To measure the length of a cable:<br />
1 Connect the <strong>FrameScope</strong> to the cable. Do not attach the<br />
DualRemote.<br />
2 On the Tools menu, press Measure Length. The Measure<br />
Length screen displays.<br />
168 <strong>Agilent</strong> <strong>FrameScope</strong> <strong>350</strong> User’s Manual
NOTE<br />
Cable Testing in Expert Mode 5<br />
The Expert Tools Menu<br />
3 Press Select. The Cable Setup screen displays.<br />
4 Select the cable manufacturer, and press Next. The Cable<br />
Database screen displays.<br />
The reason to select the cable type is that in order for the <strong>FrameScope</strong> <strong>350</strong><br />
to accurately measure length, it needs the proper NVP value stored with<br />
the cable specifications.<br />
5 Select a cable on the list, and press OK. The Measure<br />
Length screen displays, with the selected cable type<br />
shown.<br />
6 Press Measure. The <strong>FrameScope</strong> calculates the length of<br />
the cable, and displays the length of each twisted pair on<br />
the Measure Length screen.<br />
<strong>Agilent</strong> <strong>FrameScope</strong> <strong>350</strong> User’s Manual 169
5 Cable Testing in Expert Mode<br />
Running COAX and TWINAX Autotests<br />
Running COAX and TWINAX Autotests<br />
COAX Testing<br />
The <strong>FrameScope</strong> <strong>350</strong> and the DualRemote <strong>350</strong> support both<br />
Coaxial and Twinaxial standards. This section will instruct<br />
you how to test to these standards.<br />
Coaxial cable (also called Coax) consists of an insulated<br />
central conducting wire wrapped in another cylindrical<br />
conducting wire. Both of these wires are encased in an<br />
insulating layer and an outer protective layer. Coax is<br />
typically used in carrying high- speed data and in CATV.<br />
Testing of coaxial cable checks only for length and cable<br />
integrity. Because of this, there is no need to calibrate<br />
before the Autotest. Only a subset of the tester settings<br />
applies to Coax testing. These settings are shown on the<br />
screens below.<br />
1 Insert the Coax probe in the <strong>FrameScope</strong> <strong>350</strong>’s<br />
SmartProbe port and connect it to the coaxial cable to be<br />
tested. The <strong>FrameScope</strong> <strong>350</strong> will automatically detect it<br />
and change several settings. There is no need to use the<br />
DualRemote <strong>350</strong> in certifying Coax cables. Press the<br />
Autotest button on the Main Menu to bring up the<br />
Autotest Setup screen. Press the Edit Settings button to<br />
change any settings.<br />
170 <strong>Agilent</strong> <strong>FrameScope</strong> <strong>350</strong> User’s Manual
NOTE<br />
Cable Testing in Expert Mode 5<br />
Running COAX and TWINAX Autotests<br />
It may be necessary for you to add a new description to the cable database<br />
(add name, specify 1 pair for cable pair count, then select Coax; then,<br />
either specify the cable’s NVP or select Calculate NVP from length; finally,<br />
add or select the target performance grade for the cable, if applicable<br />
(otherwise, Unspecified)).<br />
2 When the Coax probe is inserted a default Coax cable is<br />
automatically selected. You can change to a different Coax<br />
cable in the Autotest Settings screen.<br />
3 The <strong>FrameScope</strong> <strong>350</strong> is capable of certifying 10Base- 2 and<br />
10Base- 5 network operation over Coax. By selecting<br />
Other in the <strong>Network</strong> Limits of the Autotest Settings<br />
screen, or in the Summary screen of the Certify <strong>Network</strong>s<br />
screen, you can enable the certification of these networks.<br />
4 Press the Start Test button from the Autotest Setup<br />
screen to perform the Coax Autotest (or Certify <strong>Network</strong><br />
test).<br />
Results<br />
The Coax Autotest evaluates length and cable integrity.<br />
These results are shown in both the diagram at the top of<br />
the screen and the table at the bottom. Delay and NVP<br />
information are also shown. The results of coax network<br />
certification are also shown in the bottom section of the<br />
result screen. Press the Details button to display the<br />
Wiremap Data screen containing additional information<br />
about the test.<br />
<strong>Agilent</strong> <strong>FrameScope</strong> <strong>350</strong> User’s Manual 171
5 Cable Testing in Expert Mode<br />
Running COAX and TWINAX Autotests<br />
Twinax Testing<br />
NOTE<br />
Twinaxial (also called Twinax) cables are able to carry high<br />
frequencies and are most often used for data transmissions<br />
and video applications. Twinax consists of one twisted pair<br />
and a metallic shield.<br />
Testing of Twinaxial cable checks only for length and cable<br />
integrity. Because of this, there is no need to calibrate<br />
before the Autotest. Only a subset of the tester settings<br />
applies to Twinax testing. These settings are shown on the<br />
screens below.<br />
1 Insert the Twinax probe in the <strong>FrameScope</strong> <strong>350</strong>’s<br />
SmartProbe port and connect it to the Twinax cable to be<br />
tested. Press the Autotest button on the Main Menu to<br />
bring up the Autotest Setup screen shown above. When<br />
the Twinax probe is inserted a default Twinax cable is<br />
automatically selected. Press the Edit Settings button to<br />
change any settings.<br />
The <strong>FrameScope</strong> <strong>350</strong> does not specify any networking standards that run<br />
on Twinax cable. Any attempt to run a Certify <strong>Network</strong>s test on a Twinax<br />
cable will trigger an error message stating that none of the networks<br />
selected are configured to run on this type of cable<br />
2 Press the Start Test button from the Autotest Setup<br />
screen to perform the Twinax Autotest<br />
172 <strong>Agilent</strong> <strong>FrameScope</strong> <strong>350</strong> User’s Manual
Results<br />
Cable Testing in Expert Mode 5<br />
Running COAX and TWINAX Autotests<br />
The Twinax Autotest evaluates length and cable integrity.<br />
Twinax cable integrity includes the detection of a properly<br />
connected shield. These results are shown in both the<br />
diagram at the top of the screen and the table at the<br />
bottom. Delay and NVP information are also shown. Pressing<br />
the Details button shows more information about the test.<br />
<strong>Agilent</strong> <strong>FrameScope</strong> <strong>350</strong> User’s Manual 173
5 Cable Testing in Expert Mode<br />
Running COAX and TWINAX Autotests<br />
174 <strong>Agilent</strong> <strong>FrameScope</strong> <strong>350</strong> User’s Manual
<strong>Agilent</strong> <strong>N2610A</strong> <strong>FrameScope</strong> <strong>350</strong> <strong>Network</strong> <strong>Performance</strong> Analyzer<br />
User’s Manual<br />
6<br />
Expert Fiber Testing<br />
About Fiber Expert Mode 176<br />
Changing to Expert Mode 177<br />
Viewing Probe Information 178<br />
The Fiber Tools Menu 180<br />
Using the Loss Meter 180<br />
Measuring Length and Delay 181<br />
Using the Power Meter 181<br />
Using Trace Mode 182<br />
Learning the NVP of a Fiber 182<br />
<strong>Agilent</strong> Technologies<br />
175
6 Expert Fiber Testing<br />
About Fiber Expert Mode<br />
About Fiber Expert Mode<br />
<strong>FrameScope</strong>’s Expert Mode includes many configuration and<br />
testing options not included in the standard test<br />
configurations.<br />
176 <strong>Agilent</strong> <strong>FrameScope</strong> <strong>350</strong> User’s Manual
Changing to Expert Mode<br />
Expert Fiber Testing 6<br />
Changing to Expert Mode<br />
To change the <strong>FrameScope</strong> tester from standard<br />
configuration to Expert Mode:<br />
1 On the Fiber Main menu, press System. The System<br />
Settings screen displays.<br />
2 On the System Settings screen, press User Interface, then<br />
press Edit. The User Interface Setup screen displays.<br />
On the User Interface Setup screen, press Expert Mode to<br />
turn it on, then press OK. The System Settings screen<br />
displays.<br />
<strong>Agilent</strong> <strong>FrameScope</strong> <strong>350</strong> User’s Manual 177
6 Expert Fiber Testing<br />
Viewing Probe Information<br />
Viewing Probe Information<br />
The <strong>FrameScope</strong> can display details about the probes<br />
installed in the tester.<br />
To view detailed information on the installed probes:<br />
1 In Expert mode, press Fiber Autotest on the Main Menu.<br />
The Fiber Autotest Setup screen displays.<br />
2 On the Fiber Autotest Setup screen, press Edit Settings.<br />
The Fiber Autotest Settings screen displays.<br />
178 <strong>Agilent</strong> <strong>FrameScope</strong> <strong>350</strong> User’s Manual
Expert Fiber Testing 6<br />
Viewing Probe Information<br />
3 Press the name of the probe, then View. The Probe<br />
Information screen displays, with information on the<br />
probe installed in the <strong>FrameScope</strong>.<br />
4 To view information on the probe installed in the<br />
DualRemote, press the DualRemote tab. The Probe<br />
Information screen displays information about the probe<br />
in the DualRemote.<br />
<strong>Agilent</strong> <strong>FrameScope</strong> <strong>350</strong> User’s Manual 179
6 Expert Fiber Testing<br />
The Fiber Tools Menu<br />
The Fiber Tools Menu<br />
Using the Loss Meter<br />
The Expert mode Fiber Tools menu contains the following:<br />
Loss Meter This tool continuously measures and reports<br />
the loss on connected fiber cables.<br />
Length & Delay This tool measures the length and<br />
propagation delay of connected fiber cables.<br />
Power Meter This tool measures the power level reaching<br />
the Fiber SmartProbe from a light source connected to<br />
the fiber cable.<br />
Trace Mode This activates the transmitter on the Fiber<br />
SmartProbe, to verify that light reaches the other end of a<br />
connected cable.<br />
Learn Fiber NVP This tool teaches the <strong>FrameScope</strong> the<br />
NVP of a cable sample.<br />
To open the Fiber Tools menu:<br />
1 Change to Expert mode. (See Changing to Expert Mode,<br />
on page 177.)<br />
2 On the Expert Mode Main Menu, press Fiber Tools. The<br />
Fiber Tools screen displays.<br />
To use the Loss Meter:<br />
1 On the Fiber Tools menu, press Loss Meter. The Fiber<br />
Loss Meter screen displays.<br />
2 To clear the values in the data table at the center of the<br />
screen, press Clear Peak.<br />
180 <strong>Agilent</strong> <strong>FrameScope</strong> <strong>350</strong> User’s Manual
Measuring Length and Delay<br />
Using the Power Meter<br />
Expert Fiber Testing 6<br />
The Fiber Tools Menu<br />
3 To write the current data table to the results database,<br />
press Save.<br />
4 To select the test configuration or to specify the fiber<br />
type, press Quick Setup.<br />
To use the Length & Delay tool:<br />
1 On the Fiber Tools menu, press Length & Delay. The<br />
Fiber Length Test screen displays. If a valid fiber<br />
connection is present, a Measure button appears.<br />
2 To begin the test, press Measure.<br />
3 To select the test configuration, fiber type, or NVP, press<br />
Quick Setup.<br />
To use the Power Meter:<br />
1 On the Fiber Tools menu. press Power Meter. You may be<br />
prompted to calibrate upon entering this tool. This is not<br />
the same calibration as the one used for testing. This<br />
calibration is just for the Fiber Power Meter. After<br />
calibration the Fiber Power Meter displays.<br />
<strong>Agilent</strong> <strong>FrameScope</strong> <strong>350</strong> User’s Manual 181
6 Expert Fiber Testing<br />
The Fiber Tools Menu<br />
Using Trace Mode<br />
Learning the NVP of a Fiber<br />
2 To set the current power value as a reference, press Set<br />
Reference. The difference is shown in the Delta field. The<br />
actual measurement is shown in the Optical Power field.<br />
3 To write the current data table to the results database,<br />
press Save.<br />
4 To calibrate the Power Meter, press Calibrate.<br />
To turn on the Fiber SmartProbe’s transmitter, on the Fiber<br />
Tools menu, press Trace Mode. The Fiber Trace Mode<br />
screen displays and indicates that the transmitter is active.<br />
To learn the NVP of a fiber cable sample:<br />
182 <strong>Agilent</strong> <strong>FrameScope</strong> <strong>350</strong> User’s Manual
Expert Fiber Testing 6<br />
The Fiber Tools Menu<br />
1 Connect a known length sample of the fiber to the Fiber<br />
SmartProbe. The sample must be at least 50 feet (15<br />
meters) long.<br />
2 On the Fiber Tools menu, press Learn Fiber NVP. The<br />
Learn Fiber NVP screen displays. Use the Quick Setup to<br />
help configure the cable for single ended or double ended<br />
test configuration and to provide fiber construction<br />
details prior to the test. You may need to calibrate using<br />
the test jumper depending on which test configuration<br />
you choose. If you need to calibrate, use the Calibration<br />
tool on the Main Menu.<br />
3 Press the Fiber Length field. The numeric keyboard opens.<br />
4 Enter the length of the sample fiber, and press OK to<br />
close the keyboard. Make sure to use the correct length<br />
units (feet or meters.)<br />
When measuring two fibers, enter the average length of<br />
the two.<br />
<strong>Agilent</strong> <strong>FrameScope</strong> <strong>350</strong> User’s Manual 183
6 Expert Fiber Testing<br />
The Fiber Tools Menu<br />
When measuring one length of fiber looped back to the<br />
<strong>FrameScope</strong>, enter the entire length of the fiber.<br />
5 Press Measure to learn the NVP of the fiber sample. The<br />
NVP displays in the NVP (%) field of the Learn Fiber NVP<br />
screen.<br />
184 <strong>Agilent</strong> <strong>FrameScope</strong> <strong>350</strong> User’s Manual
<strong>Agilent</strong> <strong>N2610A</strong> <strong>FrameScope</strong> <strong>350</strong> <strong>Network</strong> <strong>Performance</strong> Analyzer<br />
User’s Manual<br />
7<br />
System Operations<br />
The Status Display Area 186<br />
The System Menu 187<br />
System Information 188<br />
Storage Setup 189<br />
Battery Status 190<br />
Time and Date Setup 191<br />
User Interface Setup 192<br />
Operator Setup 193<br />
Touchscreen Calibration 194<br />
Serial Baud Rate Setup 195<br />
Restore Default Settings 196<br />
Calibration Information 198<br />
Printer Setup 199<br />
<strong>Network</strong> Settings 200<br />
Remote Control 203<br />
RFC 2544 Test 204<br />
SNMP Settings 205<br />
Demo Mode 206<br />
This chapter describes the various system operations of the<br />
<strong>FrameScope</strong> <strong>350</strong>.<br />
<strong>Agilent</strong> Technologies<br />
185
7 System Operations<br />
The Status Display Area<br />
The Status Display Area<br />
The status display shows the current time set on the<br />
<strong>FrameScope</strong> <strong>350</strong>, talkset status, battery status, and storage<br />
status.<br />
Clock Display<br />
The clock shows the time of day. It can be set in the Time<br />
and Date section of the System settings menu.<br />
<strong>Network</strong> Connection Status<br />
Talk Set<br />
<strong>FrameScope</strong> icon: When in the <strong>Network</strong> tab, the<br />
<strong>FrameScope</strong> icon appears. If a red X is shown on the<br />
connection, it means the <strong>FrameScope</strong> is not<br />
connected to the network.<br />
Talkset icon: The talkset icon appears when a<br />
talkset is plugged in.<br />
Battery/Power Display<br />
Storage Status<br />
Ac Power icon: This icon appears when the ac<br />
power adapter is connected to the <strong>FrameScope</strong> and<br />
an ac power source. The number next to the icon is<br />
the percent of full battery charge.<br />
Battery Charge icon: When the <strong>FrameScope</strong><br />
operates using battery power, this icon shows the<br />
current battery state. The percentage figure is the<br />
amount of charge remaining in the battery.<br />
Storage icon: The storage icon indicates where test results<br />
are saved and how full the CF card or internal memory is.<br />
= Results are saved to a compact flash card. In the<br />
example, the card is half full. A red X on the icon<br />
means that the compact flash card is not installed.<br />
= Results are saved to internal memory. In the<br />
example, the internal memory is 65% full.<br />
186 <strong>Agilent</strong> <strong>FrameScope</strong> <strong>350</strong> User’s Manual
The System Menu<br />
System Operations 7<br />
The System Menu<br />
The <strong>FrameScope</strong> <strong>350</strong> System Menu is displayed by pressing<br />
System in either the Cable or <strong>Network</strong> Main Menu, whether<br />
in Expert Mode or not. The Cable tab System Menu:<br />
However, the System Menu has different entries if entered<br />
via the <strong>Network</strong> tab. The Save to: and Operators settings are<br />
deleted and <strong>Network</strong> Settings, Remote Control, and SNMP<br />
Settings are added. The <strong>Network</strong> tab System Menu:<br />
<strong>Agilent</strong> <strong>FrameScope</strong> <strong>350</strong> User’s Manual 187
7 System Operations<br />
System Information<br />
System Information<br />
Pressing System Information then pressing View on either<br />
System Settings menu displays the <strong>FrameScope</strong> serial<br />
number, software and hardware revision numbers. If the<br />
DualRemote has been attached and calibrated, it displays the<br />
same information for the DualRemote.<br />
188 <strong>Agilent</strong> <strong>FrameScope</strong> <strong>350</strong> User’s Manual
Storage Setup<br />
System Operations 7<br />
Storage Setup<br />
The <strong>Network</strong> tab requires a CompactFlash card so there are<br />
no choices in the <strong>Network</strong> System Settings.<br />
The Cable tab allows you to select where the test results are<br />
stored. Press Save to: and then press Edit. Choose either<br />
the Internal Flash or the CFlash Card.<br />
<strong>Agilent</strong> <strong>FrameScope</strong> <strong>350</strong> User’s Manual 189
7 System Operations<br />
Battery Status<br />
Battery Status<br />
To view the current battery status press Power then press<br />
View. If the DualRemote is connected and calibrated, both<br />
the <strong>FrameScope</strong> Battery Status and the DualRemote Battery<br />
Status are available. The display also shows an estimated<br />
remaining battery time.<br />
The DualRemote battery status is updated every time a<br />
calibration or test is run. It is not updated in real time.<br />
190 <strong>Agilent</strong> <strong>FrameScope</strong> <strong>350</strong> User’s Manual
Time and Date Setup<br />
System Operations 7<br />
Time and Date Setup<br />
To set the time and date on the <strong>FrameScope</strong>, press Time<br />
and Date, then press Edit. The Time and Date Setup screen<br />
allows you to set the Month, Day, Year, and Time as well as<br />
the display method for each.<br />
<strong>Agilent</strong> <strong>FrameScope</strong> <strong>350</strong> User’s Manual 191
7 System Operations<br />
User Interface Setup<br />
User Interface Setup<br />
The User Interface Setup screen is were the following<br />
choices are made:<br />
Length Units - Feet or Meters<br />
Expert Mode - ON/OFF (only when accessed from the Cable<br />
tab)<br />
Enable Speaker ON/OFF<br />
Enable Touch Click ON/OFF<br />
Enable Sleep Timeout ON/OFF - A screen touch will wake<br />
the screen. When enabled the Sleep Interval setting bar is<br />
displayed.<br />
Sleep Interval (Minutes) how many minutes (1- 15) without a<br />
screen touch or button press until the unit goes to sleep.<br />
Backlight Brightness Scale of 1 to 15<br />
Contrast Scale of 1 to 15<br />
192 <strong>Agilent</strong> <strong>FrameScope</strong> <strong>350</strong> User’s Manual
Operator Setup<br />
System Operations 7<br />
Operator Setup<br />
In the Cable test mode, you can set the Operators by<br />
pressing Operators then pressing Edit. You can indicate<br />
where the operator is for each of the <strong>FrameScope</strong> and<br />
DualRemote and what their name is.<br />
<strong>Agilent</strong> <strong>FrameScope</strong> <strong>350</strong> User’s Manual 193
7 System Operations<br />
Touchscreen Calibration<br />
Touchscreen Calibration<br />
If it seems that the <strong>FrameScope</strong> <strong>350</strong> is not responding<br />
correctly to taps on the touch screen, you may need to<br />
calibrate the touch screen to bring it into alignment with the<br />
underlying display.<br />
To calibrate the touch screen:<br />
1 Ensure that you have the stylus available.<br />
2 On the Main Menu, press System. The System Settings<br />
screen displays.<br />
3 On the System Settings screen, press Calibrate Touch<br />
Screen, then press Edit. A Calibration screen displays.<br />
4 Using the stylus, press the screen where the onscreen<br />
instructions direct.<br />
5 When the calibration is complete, the System Settings<br />
screen displays.<br />
An alternate way into the screen calibration menu is:<br />
1 Turn the unit on.<br />
2 When it has finished booting up, hit the Scroll key with<br />
the sequence UP- DOWN- DOWN- UP.<br />
This will go directly to the touchscreen calibration<br />
window. This method should be used when it appears<br />
that normal screen presses are misinterpreted to the<br />
point that you can’t enter the calibration screen.<br />
194 <strong>Agilent</strong> <strong>FrameScope</strong> <strong>350</strong> User’s Manual
Serial Baud Rate Setup<br />
System Operations 7<br />
Serial Baud Rate Setup<br />
You can specify what serial baud rate the serial port of the<br />
<strong>FrameScope</strong> uses for uploading test records. Press Serial<br />
Baud Rate: then press Edit. On the Serial Baud Rate Setup<br />
screen select one of 115.2K, 38.4K, or 19.2K and press OK.<br />
<strong>Agilent</strong> <strong>FrameScope</strong> <strong>350</strong> User’s Manual 195
7 System Operations<br />
Restore Default Settings<br />
Restore Default Settings<br />
The following procedure describes how to restore the<br />
<strong>FrameScope</strong> <strong>350</strong> to the configuration values that were set<br />
when your unit was shipped from the factory.<br />
1 From the Main Menu on either the Cable or <strong>Network</strong> tab,<br />
press the System button. The System Settings screen is<br />
displayed.<br />
2 Use the Scroll button to select Restore Default Settings.<br />
3 Press the Edit button or press the OK button to call the<br />
Restore Defaults screen.<br />
196 <strong>Agilent</strong> <strong>FrameScope</strong> <strong>350</strong> User’s Manual
System Operations 7<br />
Restore Default Settings<br />
4 If you want to clear the Operator List, press the Clear<br />
Operator List checkbox.<br />
5 If you want to clear custom test limits, press the Delete<br />
Custom Limits checkbox.<br />
6 If you want to clear data in the internal flash and return<br />
to the default settings and profiles of the <strong>FrameScope</strong>,<br />
press the Format Internal Flash checkbox.<br />
7 Press OK to restore the factory- programmed settings and<br />
clear the items you selected in steps 4 to 6.<br />
8 Because this will erase any current settings, you are<br />
asked to confirm. In the subsequent confirmation dialog<br />
boxes press Yes to accept the resets. Press No to cancel<br />
the resets and return to the System Settings screen.<br />
<strong>Agilent</strong> <strong>FrameScope</strong> <strong>350</strong> User’s Manual 197
7 System Operations<br />
Calibration Information<br />
Calibration Information<br />
You may display the calibration information by pressing<br />
Calibration Information and View. The Calibration<br />
Information screen displays the factory calibration date for<br />
both the <strong>FrameScope</strong> and DualRemote as well as the last<br />
Field Calibration date.<br />
198 <strong>Agilent</strong> <strong>FrameScope</strong> <strong>350</strong> User’s Manual
Printer Setup<br />
System Operations 7<br />
Printer Setup<br />
The <strong>FrameScope</strong> <strong>350</strong> can print labels directly to a Brady<br />
TLS2200 label printer. The labeling parameters are set using<br />
the procedure “Choosing the Labeling Format” on page 89.<br />
When the <strong>FrameScope</strong> is configured as described in the<br />
following procedure, a label for the tested cable will be<br />
printed after saving a test result.<br />
To configure the <strong>FrameScope</strong> <strong>350</strong> to print to the Brady label<br />
printer:<br />
1 On the Main Menu, press System. The System Settings<br />
screen displays.<br />
2 On the System Settings screen, press Autoprint, then<br />
Edit. The Printer Setup screen displays.<br />
3 Press Autoprint to enable the Autoprint function. A<br />
checkmark shows that the function is enabled.<br />
4 Connect the N2605A- 050 interface cable to the serial<br />
ports of the <strong>FrameScope</strong> <strong>350</strong> and Brady TLS2200.<br />
5 Turn the Brady printer on.<br />
6 Press the Func and Exit keys on the printer<br />
simultaneously. This sets the printer to Peripheral mode.<br />
<strong>Agilent</strong> <strong>FrameScope</strong> <strong>350</strong> User’s Manual 199
7 System Operations<br />
<strong>Network</strong> Settings<br />
<strong>Network</strong> Settings<br />
The <strong>Network</strong> Settings screen shows a summary of the network<br />
configuration. This screen may also be accessed by<br />
pressing on the <strong>FrameScope</strong> icon on the right of the Main<br />
Menu. This includes the following:<br />
The <strong>Network</strong> Settings screen can be reached by pressing on<br />
the <strong>FrameScope</strong> Icon on the <strong>Network</strong> tab Main Menu or by<br />
pressing System from the <strong>Network</strong> tab Main Menu and then<br />
pressing <strong>Network</strong> Settings and then Edit.<br />
The information displayed includes Host Name (<strong>FrameScope</strong><br />
<strong>350</strong> name, which by default is FRSCOPE plus the last three<br />
hex bytes of the MAC address, but it can be changed,) MAC<br />
address of the <strong>FrameScope</strong> <strong>350</strong> (This is a factory setting<br />
that identifies <strong>FrameScope</strong> uniquely among all Ethernet<br />
devices.), information assigned by DHCP or manually,<br />
<strong>Network</strong> Connection (Auto or Manual,) and whether Active<br />
Discovery and Measure Length are enabled or disabled. To<br />
change any of the settings, press Edit Settings.<br />
IP Settings The first <strong>Network</strong> Settings Setup screen allows<br />
you to select using DHCP to automatically configure the<br />
<strong>FrameScope</strong> when connected to the network, or to manually<br />
configure. If you manually configure, you are required to at<br />
least enter a valid IP address and a valid subnet mask.<br />
IP Address – This value uniquely identifies the<br />
<strong>FrameScope</strong> in the TCP/IP network.<br />
Subnet Mask – This value is combined with the IP<br />
Address to define the subnet to which the <strong>FrameScope</strong><br />
belongs.<br />
200 <strong>Agilent</strong> <strong>FrameScope</strong> <strong>350</strong> User’s Manual
System Operations 7<br />
<strong>Network</strong> Settings<br />
Default Gateway – This is the default gateway (router)<br />
the <strong>FrameScope</strong> will use to communicate with devices<br />
on other subnets.<br />
Press Next when satisfied with your choices.<br />
The second <strong>Network</strong> Settings Setup screen allows you to<br />
change the Host Name from the default, enter a DNS<br />
Domain, and to provide DNS and WINS server addresses.<br />
Host Name This name will be used to identify the<br />
<strong>FrameScope</strong> in NetBIOS and <strong>FrameScope</strong> protocols. The<br />
name defaults to ‘FRSCOPE’ plus the last 6 hexadecimal<br />
digits of the MAC Address. It may be changed to any name<br />
desired.<br />
DNS and NetBIOS Settings Devices on the network may be<br />
referred to by name. In the Domain Name System (DNS), the<br />
<strong>FrameScope</strong> asks DNS servers to convert the name to an IP<br />
address. When NetBIOS names are used, the <strong>FrameScope</strong><br />
asks WINS servers to convert the name to an IP address.<br />
The DNS Domain and the DNS and WINS servers can be<br />
learned through DHCP and may be entered manually by the<br />
user. If the user enters a DNS Domain, it will be used in<br />
place of the DHCP supplied value. If the user enters DNS or<br />
WINS servers, they will be used in preference to the DHCP<br />
supplied values. When satisfied with all the settings, press<br />
Next to get the third <strong>Network</strong> Settings Setup screen.<br />
<strong>Network</strong> Connection Since network hardware may function<br />
at a variety of speeds and modes, the <strong>FrameScope</strong> has the<br />
ability to auto- negotiate its speed and mode when it is<br />
connected to the network. The auto- negotiation attempts to<br />
configure the devices for the fastest network connection<br />
<strong>Agilent</strong> <strong>FrameScope</strong> <strong>350</strong> User’s Manual 201
7 System Operations<br />
<strong>Network</strong> Settings<br />
NOTE<br />
supported. If necessary, the user can manually set the<br />
<strong>FrameScope</strong> for 10 or 100 Mbps and full or half duplex<br />
mode. This may be used for instance to prove that a 10/100<br />
switch can properly support the 10 Mbps speed. When<br />
satisfied with the settings, press Next get the last <strong>Network</strong><br />
Settings Setup screen.<br />
Active Discovery (Enable / Disable) When the <strong>FrameScope</strong> is<br />
attached to a switch port it only sees broadcast traffic and<br />
traffic targeted for the <strong>FrameScope</strong>. When ‘Active Discovery’<br />
is enabled the <strong>FrameScope</strong> requests information from<br />
devices on the network to increase the amount of<br />
information the <strong>FrameScope</strong> can learn from the network.<br />
Active Discovery will affect the network and, in some cases, will trigger<br />
some alarms. Use at your own risk.<br />
Measure Length (Enable / Disable) If ‘Measure Length’ is<br />
enabled, each time the <strong>FrameScope</strong> is attached to the<br />
network, it measures the length of the cable. This steps takes<br />
approximately 3 seconds. This step can be skipped by<br />
disabling ‘Measure Length’ in the ‘<strong>Network</strong> Settings Setup’<br />
wizard. When satisfied, press OK.<br />
202 <strong>Agilent</strong> <strong>FrameScope</strong> <strong>350</strong> User’s Manual
Remote Control<br />
System Operations 7<br />
Remote Control<br />
The <strong>FrameScope</strong> can be controlled through its web interface.<br />
Before this interface can be used, it must be enabled<br />
through the Remote Control Setup wizard. This wizard also<br />
lets the user choose the level of security which will be used<br />
on the web interface. A User Name and a Password may be<br />
entered and a Port other than the default (80) may be used.<br />
If the Port is changed, then it must be specified when<br />
accessing the <strong>FrameScope</strong>. For instance, if the <strong>FrameScope</strong>’s<br />
address is 209.6.108.252, it would normally be accessed with<br />
the following URL:<br />
http://209.6.108.252/<br />
If the port is changed to 8080, the following URL would be<br />
used:<br />
http://209.6.108.252:8080/<br />
When the Remote Control settings have changed, the<br />
<strong>FrameScope</strong> must be rebooted to use the new settings.<br />
<strong>Agilent</strong> <strong>FrameScope</strong> <strong>350</strong> User’s Manual 203
7 System Operations<br />
RFC 2544 Test<br />
RFC 2544 Test<br />
Two <strong>FrameScope</strong>s are needed for RFC 2544 tests: round- trip<br />
latency test and point- to- point throughput test. One<br />
<strong>FrameScope</strong> is the master and the other is the slave, which<br />
is placed in the network point under test. The slave<br />
<strong>FrameScope</strong> has to be pre- set for RFC 2544 tests. For steps<br />
on slave <strong>FrameScope</strong> settings, see “Setting the slave<br />
<strong>FrameScope</strong> for RFC 2544 Tests” on page 62.<br />
204 <strong>Agilent</strong> <strong>FrameScope</strong> <strong>350</strong> User’s Manual
SNMP Settings<br />
System Operations 7<br />
SNMP Settings<br />
The <strong>FrameScope</strong> <strong>350</strong> uses the default community “public”<br />
and the default port 161 for SNMP access. You may expand<br />
the SNMP communities and port numbers to use during<br />
active discovery, SNMP queries, and the Locate Switch Tool.<br />
Press SNMP Settings on the <strong>Network</strong> System Settings screen<br />
then press Edit. Enter the additional information and press<br />
OK.<br />
<strong>Agilent</strong> <strong>FrameScope</strong> <strong>350</strong> User’s Manual 205
7 System Operations<br />
Demo Mode<br />
Demo Mode<br />
The <strong>FrameScope</strong> <strong>350</strong> may be put in a Demo mode for<br />
training or demonstration purposes. In the <strong>Network</strong> tab, the<br />
Demo mode provides for a network consisting of several<br />
stations, servers, a router, two switch/bridges, and 5 SNMP<br />
agents. All functions are demoable without connecting to a<br />
live network. Autotests of all functions are simulated.<br />
In the Cable tab, the Demo mode provides for a wiremap<br />
failure, a cable test failure, and a cable test pass on<br />
consecutive Autotests.<br />
The Demo mode may be enabled and disabled by pressing<br />
Demo Mode: on the System Settings menu from either<br />
<strong>Network</strong> or Cable tab, then pressing Edit. When satisfied,<br />
press OK.<br />
206 <strong>Agilent</strong> <strong>FrameScope</strong> <strong>350</strong> User’s Manual
<strong>Agilent</strong> <strong>N2610A</strong> <strong>FrameScope</strong> <strong>350</strong> <strong>Network</strong> <strong>Performance</strong> Analyzer<br />
User’s Manual<br />
8<br />
<strong>Network</strong> <strong>Performance</strong> Analyzer<br />
Reference<br />
<strong>Network</strong> Connection 209<br />
<strong>Network</strong> Database 211<br />
Station List 211<br />
Device Details 211<br />
Active Discovery Process 212<br />
<strong>Network</strong> <strong>Performance</strong> Autotest 214<br />
Autotest Setup 214<br />
The Default Autotest Suite 215<br />
Editing Tests 215<br />
Deleting Tests 215<br />
Adding Tests 216<br />
DHCP Server 217<br />
DNS Server 219<br />
WINS Server (NetBIOS Name Server) 221<br />
NT File Server 222<br />
NFS File Server 222<br />
Novell Server 230<br />
Web Server 225<br />
E-mail Server 227<br />
Novell Server 230<br />
FTP Server 230<br />
SNMP Agent 230<br />
Primary Domain Controller 230<br />
Backup Domain Controller 230<br />
Router 230<br />
Workstation 230<br />
Autotest Results 231<br />
Statistics 233<br />
Overall Statistics 233<br />
Top Transmitters 234<br />
Error Mix 234<br />
Protocol Mix 235<br />
<strong>Agilent</strong> Technologies<br />
207
8 <strong>Network</strong> <strong>Performance</strong> Analyzer Reference<br />
<strong>Network</strong> Tools 236<br />
Ping 236<br />
Trace Route 236<br />
SNMP Query 237<br />
Locate Switch Port 237<br />
<strong>Performance</strong> Tests 237<br />
Traffic Generation 238<br />
Remote Control 240<br />
Memory Requirements 242<br />
208 <strong>Agilent</strong> <strong>FrameScope</strong> <strong>350</strong> User’s Manual
<strong>Network</strong> Connection<br />
<strong>Network</strong> <strong>Performance</strong> Analyzer Reference 8<br />
<strong>Network</strong> Connection<br />
Before the <strong>FrameScope</strong> <strong>350</strong> is attached to a network, it is<br />
constantly checking for a connection. When the <strong>FrameScope</strong><br />
<strong>350</strong> detects that it has been plugged into a network device it<br />
does the following:<br />
Measures the length of the cable (optional). This feature<br />
can be disabled through the <strong>Network</strong> Settings wizard.<br />
After the connection is made, the length of the cable is<br />
displayed on the network map on the Main Menu.<br />
Listens for a link pulse or traffic to determine which<br />
cable pairs are being used for transmit and receive. If this<br />
operation fails, a dialog pops up informing the user of the<br />
error, and the <strong>FrameScope</strong> <strong>350</strong> continues to listen for a<br />
link. This condition usually means that the network device<br />
is not turned on, or the connection from the <strong>FrameScope</strong><br />
<strong>350</strong> to the device is faulty.<br />
Auto- negotiates wire speed and mode (optional). The user<br />
can manually set the speed and mode (half or full duplex)<br />
through the <strong>Network</strong> Settings wizard. The wire speed and<br />
mode are displayed on the network map on the Main<br />
Menu and on the <strong>Network</strong> Settings Window.<br />
Uses DHCP to obtain the following (optional):<br />
IP address<br />
IP subnet mask<br />
Default gateway<br />
DNS server<br />
NetBIOS node type<br />
NetBIOS Name Server (WINS)<br />
The user can manually set these parameters through the<br />
<strong>Network</strong> Settings wizard. These parameters are displayed<br />
on the <strong>Network</strong> Settings Window. If DHCP fails, a dialog<br />
pops up informing the user and asking if DHCP should<br />
be retried or if the <strong>FrameScope</strong> <strong>350</strong> should give up.<br />
DHCP may fail if the DHCP server is not accessible from<br />
the <strong>FrameScope</strong> <strong>350</strong>’s connection point or if the DHCP<br />
server’s security is configured to deny access by<br />
unknown devices.<br />
<strong>Agilent</strong> <strong>FrameScope</strong> <strong>350</strong> User’s Manual 209
8 <strong>Network</strong> <strong>Performance</strong> Analyzer Reference<br />
<strong>Network</strong> Connection<br />
Test the Default Gateway and the DNS and WINS servers.<br />
If any of these devices is not working, an error is<br />
recorded in the Error Log. The Default Gateway is tested<br />
by ARPing for its MAC address. The DNS and WINS<br />
servers are tested by looking up the <strong>FrameScope</strong> <strong>350</strong>’s<br />
host name.<br />
When all of this has finished, the <strong>FrameScope</strong> <strong>350</strong> is ready<br />
to monitor the network and perform network testing.<br />
NOTE<br />
If the operator directly connects the <strong>FrameScope</strong> <strong>350</strong> to the<br />
DualRemote <strong>350</strong> using just a cable (no hubs or other<br />
network devices), the <strong>FrameScope</strong> <strong>350</strong> detects this condition<br />
and switches to cable test mode.<br />
210 <strong>Agilent</strong> <strong>FrameScope</strong> <strong>350</strong> User’s Manual
<strong>Network</strong> Database<br />
Station List<br />
Device Details<br />
<strong>Network</strong> <strong>Performance</strong> Analyzer Reference 8<br />
<strong>Network</strong> Database<br />
The <strong>FrameScope</strong> <strong>350</strong> listens to the network traffic and<br />
actively interrogates network devices to learn about attached<br />
hosts, servers, switches and routers. This information is<br />
stored in the <strong>Network</strong> Database. The database may be<br />
saved to or retrieved from CompactFlash or may be<br />
uploaded to a PC through the web interface.<br />
The <strong>Network</strong> Database is organized into the following groups<br />
where each station is listed by name, if known, and address:<br />
Local Stations lists stations with any of the following:<br />
IP addresses on the same subnet as the <strong>FrameScope</strong>.<br />
IPX addresses in the same broadcast domain.<br />
MAC address, but no IP or IPX address.<br />
Remote Stations lists stations with any of the following:<br />
IP addresses not on the same subnet as the<br />
<strong>FrameScope</strong>.<br />
IPX addresses on the other side of a router<br />
Servers Lists stations that supply services, grouped by<br />
service<br />
Routers Lists stations that advertise routing capabilities or<br />
transmit traffic from remote stations.<br />
<strong>FrameScope</strong>s - Lists other <strong>FrameScope</strong>s found.<br />
Switches/Bridges Lists stations who support bridge MIBs<br />
through SNMP.<br />
SNMP Agents Lists stations who are running SNMP agents.<br />
The operator can get more detailed information about any<br />
device by selecting it from one of these lists.<br />
The <strong>Network</strong> Database includes details learned about each<br />
device. The detailed information includes the following,<br />
where appropriate:<br />
<strong>Agilent</strong> <strong>FrameScope</strong> <strong>350</strong> User’s Manual 211
8 <strong>Network</strong> <strong>Performance</strong> Analyzer Reference<br />
<strong>Network</strong> Database<br />
DNS, NetBIOS and SNMP System name<br />
MAC address<br />
<strong>Network</strong> addresses: IP and IPX<br />
Services provided by the device (DHCP, DNS, etc.)<br />
Protocols used by the device (IP, IPX, etc.)<br />
While the device details are displayed, the following statistics<br />
pertaining to the device are also available by pressing the<br />
Statistics button:<br />
Unicasts, where the % is the percentage of all unicasts<br />
Broadcasts, where the % is the percentage of all<br />
broadcasts<br />
Multicasts, where the % is the percentage of all multicasts<br />
Errors, where the % is the percentage of all errors<br />
The <strong>FrameScope</strong> <strong>350</strong> also provides a set of tools for<br />
accessing a device from the detailed view. These tools<br />
include:<br />
Ping<br />
Active Discovery Process<br />
Locate Switch Port<br />
Trace Route (IP Only)<br />
SNMP query (IP Only)<br />
MAC Loopback (<strong>FrameScope</strong> <strong>350</strong> Only)<br />
Active Discovery Query order for <strong>FrameScope</strong> <strong>350</strong><br />
1 Every 60 seconds:<br />
Get SNMP name and bridge info<br />
2 Done once:<br />
Broadcast PING<br />
3 Every 600 seconds:<br />
Broadcast a DHCP discover message.<br />
212 <strong>Agilent</strong> <strong>FrameScope</strong> <strong>350</strong> User’s Manual
4 Every 60 seconds:<br />
<strong>Network</strong> <strong>Performance</strong> Analyzer Reference 8<br />
<strong>Network</strong> Database<br />
Broadcast a <strong>FrameScope</strong> announcement (UDP to/from<br />
port 52341)<br />
Broadcast RIP v1 and v2 routing table requests<br />
5 Every 300 seconds:<br />
Send an ARP for each IP address in the subnet range<br />
For every ARP response received, send an ICMP echo<br />
request<br />
6 Every 300 seconds:<br />
Reset IP services<br />
7 Every 30 seconds (and whenever a new IP address is<br />
learned)<br />
Discover IP Services<br />
a. Discover Domain Controller<br />
b. Discover Domain Browsers<br />
c. For each IP station in the station list which has<br />
not been probed yet:<br />
1) Query the DNS servers to get the hostname for<br />
the IP address.<br />
2) ARP the IP address<br />
3) Start a TCP connect to the LPD port to check<br />
for an IP printer server.<br />
4) Use SNMP to request the system name<br />
5) Use SNMP to request the subnet mask<br />
6) Start a TCP connect to the HTTP port to<br />
check for a web server<br />
d. For each MAC in the station list<br />
1) Mark as router any MAC that has more than<br />
one IP address associated, one of which is<br />
marked as remote<br />
8 Every 60 Seconds:<br />
Broadcast an IPX SAP Request<br />
<strong>Agilent</strong> <strong>FrameScope</strong> <strong>350</strong> User’s Manual 213
8 <strong>Network</strong> <strong>Performance</strong> Analyzer Reference<br />
<strong>Network</strong> <strong>Performance</strong> Autotest<br />
<strong>Network</strong> <strong>Performance</strong> Autotest<br />
Autotest Setup<br />
The Autotest is used to measure connectivity and response<br />
time of important network resources. Each network resource<br />
is tested using target- specific access methods to<br />
communicate with these resources.<br />
The Autotest Setup screen can be reached by pressing on the<br />
Autotest button on the <strong>Network</strong> tab Main Menu.<br />
The Autotest contains a suite of tests that can verify<br />
multiple features on multiple devices. Each test within the<br />
Autotest suite verifies a specific feature on a specific device.<br />
For instance, one device may act as both a DHCP server and<br />
a DNS server. An Autotest suite used to test this device<br />
would contain a DHCP server test and a DHCP server test<br />
for this device. The same Autotest suite can also contain<br />
tests for other devices.<br />
214 <strong>Agilent</strong> <strong>FrameScope</strong> <strong>350</strong> User’s Manual
The Default Autotest Suite<br />
Editing Tests<br />
Deleting Tests<br />
<strong>Network</strong> <strong>Performance</strong> Analyzer Reference 8<br />
<strong>Network</strong> <strong>Performance</strong> Autotest<br />
The <strong>FrameScope</strong> boots up with the suite selected.<br />
When the suite is selected, the <strong>FrameScope</strong><br />
automatically creates an Autotest suite from the servers<br />
listed in the <strong>Network</strong> Database.<br />
Each test has parameters that specify the test’s behavior and<br />
coverage. For instance, there is a well- known port for web<br />
servers to listen on, but a web server may have been<br />
configured to listen at a different port. So, the port number<br />
is provided as a parameter with the well- known port<br />
number as the default. User names and passwords are also<br />
included as parameters for tests that can provide extra<br />
coverage by logging in to a server. The extra coverage may<br />
include reading a file or retrieving E- mail. Each server has a<br />
default test that can be performed without the user<br />
providing any set up information so that a new test can be<br />
configured with minimal effort. After selecting a specific<br />
name or address, the Edit button starts up a wizard which<br />
allows the test's parameters to be modified. See the<br />
description of each test below for more information.<br />
The Delete button operates on the selected test or test<br />
heading. If a test is selected when the Delete button is<br />
pressed, the test is removed from the Autotest suite. If a<br />
heading such as 6 Print Server is selected, all of the print<br />
server tests will be removed from the suite.<br />
<strong>Agilent</strong> <strong>FrameScope</strong> <strong>350</strong> User’s Manual 215
8 <strong>Network</strong> <strong>Performance</strong> Analyzer Reference<br />
<strong>Network</strong> <strong>Performance</strong> Autotest<br />
Adding Tests<br />
The Add button will start up a wizard which is used to add<br />
tests to the test suite.<br />
If the <strong>Network</strong> Database contains devices with features not<br />
covered by any test in the test suite, tests for these features<br />
will be listed under Untested Servers. One of these tests<br />
may be added to the Autotest suite by selecting the test and<br />
pressing OK. All of these tests may be added to the suite by<br />
pressing the Add All radio button and pressing OK.<br />
216 <strong>Agilent</strong> <strong>FrameScope</strong> <strong>350</strong> User’s Manual
DHCP Server<br />
<strong>Network</strong> <strong>Performance</strong> Analyzer Reference 8<br />
<strong>Network</strong> <strong>Performance</strong> Autotest<br />
Another way to add a test to the suite is to press the<br />
Create New radio button and press Next.<br />
1 A list of test types is presented on the next screen.<br />
2 Select the type of test and press Next.<br />
3 Test specific parameters may be edited on the next<br />
screens as discussed below under each test heading.<br />
The DHCP Server test verifies that the DHCP server<br />
responds to a request for an IP address and other optional<br />
items. If any optional information is requested, the server<br />
response would be checked for all of the requested information.<br />
Setup<br />
The IP address of the DHCP Server to test is entered on the<br />
first DHCP Server test setup screen. All DHCP responses<br />
received during this test are compared against this address<br />
to verify that responses are being received from this server.<br />
The next setup screen is used to specify which optional<br />
<strong>Agilent</strong> <strong>FrameScope</strong> <strong>350</strong> User’s Manual 217
8 <strong>Network</strong> <strong>Performance</strong> Analyzer Reference<br />
<strong>Network</strong> <strong>Performance</strong> Autotest<br />
items should be requested from the DHCP Server. The last<br />
setup screen provides a list of the measurements performed<br />
during this test.<br />
Any of the thresholds used to rate the performance of each<br />
of these measurements may be viewed and modified by<br />
selecting it from this list and selecting Edit. The measurements<br />
taken during this test are:<br />
PING Response The time it takes to perform an ICMP Echo<br />
test on the server.<br />
218 <strong>Agilent</strong> <strong>FrameScope</strong> <strong>350</strong> User’s Manual
DNS Server<br />
<strong>Network</strong> <strong>Performance</strong> Analyzer Reference 8<br />
<strong>Network</strong> <strong>Performance</strong> Autotest<br />
Server Response The total time for negotiating for an IP<br />
address from the DHCP Server<br />
The DNS Server test verifies that the server can look up a<br />
name or an IP address.<br />
Test Setup<br />
The first setup screen is used to enter the IP address of the<br />
DNS server to test and to enter the name or address that<br />
will be sent to the DNS server in the request. If no name or<br />
address is provided, the DNS server is requested to look up<br />
its own address and return a name.<br />
The last setup screen provides a list of the measurements<br />
performed during the test. Any of the thresholds used to<br />
rate the performance of each of these measurements may be<br />
<strong>Agilent</strong> <strong>FrameScope</strong> <strong>350</strong> User’s Manual 219
8 <strong>Network</strong> <strong>Performance</strong> Analyzer Reference<br />
<strong>Network</strong> <strong>Performance</strong> Autotest<br />
viewed and modified by selecting it from this list and selecting<br />
Edit as shown in the DHCP server.<br />
The measurements taken during this test are:<br />
PING Response The time it takes to perform an ICMP Echo<br />
test on the server.<br />
Server Response The request/response time for converting a<br />
name or address into an address or name.<br />
220 <strong>Agilent</strong> <strong>FrameScope</strong> <strong>350</strong> User’s Manual
WINS Server (NetBIOS Name Server)<br />
<strong>Network</strong> <strong>Performance</strong> Analyzer Reference 8<br />
<strong>Network</strong> <strong>Performance</strong> Autotest<br />
The WINS Server test verifies that the server can convert a<br />
name to an IP address.<br />
Test Setup<br />
The first setup screen is used to enter the IP address of the<br />
WINS server to test and to enter the name that will be sent<br />
to the WINS server in the request.<br />
The last setup screen provides a list of the measurements<br />
performed during the test. Any of the thresholds used to<br />
rate the performance of each of these measurements may be<br />
viewed and modified by selecting it from this list and selecting<br />
Edit as shown in the DHCP server.<br />
The measurements taken during this test are:<br />
PING Response The time it takes to perform an ICMP Echo<br />
test on the server.<br />
Server Response The request/response time for converting a<br />
name into an address.<br />
<strong>Agilent</strong> <strong>FrameScope</strong> <strong>350</strong> User’s Manual 221
8 <strong>Network</strong> <strong>Performance</strong> Analyzer Reference<br />
<strong>Network</strong> <strong>Performance</strong> Autotest<br />
NT File Server<br />
NFS File Server<br />
Include domain name in the<br />
User Name entry, for example,<br />
abc@agilent.com.sg.<br />
The file server tests provide the following basic operations:<br />
Check server availability by logging- in to the server or<br />
with a partial log- in if a username and password are<br />
required for log-in but have not been provided by the<br />
user.<br />
The following operations are optional. If any of these<br />
operations is requested, the user must enter the full path<br />
name to the file (or directory) on the server:<br />
Test Setup<br />
Log in to the server.<br />
Read from an existing file.<br />
Write to, read from, and delete a file.<br />
The first file server setup screen requests a name or address<br />
as well as login information needed to access the server.<br />
222 <strong>Agilent</strong> <strong>FrameScope</strong> <strong>350</strong> User’s Manual
<strong>Network</strong> <strong>Performance</strong> Analyzer Reference 8<br />
<strong>Network</strong> <strong>Performance</strong> Autotest<br />
The next setup screen allows selection of the file actions to<br />
be tested.<br />
The last setup screen provides a list of the measurements<br />
performed during the test. Any of the thresholds used to<br />
rate the performance of each of these measurements may be<br />
viewed and modified by selecting it from this list and<br />
selecting Edit. Note that the scroll bar on the right of the<br />
screen only shows the location of the screen shown. Use the<br />
Scroll rocker to scroll through the list. The time responses<br />
are modified as shown in the DHCP server.<br />
<strong>Agilent</strong> <strong>FrameScope</strong> <strong>350</strong> User’s Manual 223
8 <strong>Network</strong> <strong>Performance</strong> Analyzer Reference<br />
<strong>Network</strong> <strong>Performance</strong> Autotest<br />
The measurements taken during this test are:<br />
Name Lookup The request/response time for converting a<br />
name into an address.<br />
PING Response The time it takes to perform an ICMP Echo<br />
test on the server.<br />
Connect Time/Mount Time The time it takes to connect to the<br />
NT file server, or mount the NFS server.<br />
Write Rate The bytes per second rating of the write<br />
operation.<br />
Read Rate The bytes per second rating of the read<br />
operation.<br />
Delete Time The time it takes to delete the file.<br />
Disconnect Time The time it takes to disconnect from the file<br />
server.<br />
224 <strong>Agilent</strong> <strong>FrameScope</strong> <strong>350</strong> User’s Manual
Web Server<br />
<strong>Network</strong> <strong>Performance</strong> Analyzer Reference 8<br />
<strong>Network</strong> <strong>Performance</strong> Autotest<br />
Examples of modifying rates and time are shown below:<br />
The Web Server test verifies that server is accessible and<br />
measures the download time of the first get operation.<br />
Test Setup<br />
The first setup screen is used to enter the URL of the web<br />
server to test. The second setup screen provides an<br />
opportunity to request a proxy server and to name it. The<br />
last setup screen provides a list of the measurements<br />
performed during the test. Any of the thresholds used to<br />
<strong>Agilent</strong> <strong>FrameScope</strong> <strong>350</strong> User’s Manual 225
8 <strong>Network</strong> <strong>Performance</strong> Analyzer Reference<br />
<strong>Network</strong> <strong>Performance</strong> Autotest<br />
rate the performance of each of these measurements may be<br />
viewed and modified by selecting it from this list and<br />
selecting Edit.<br />
The measurements taken during this test are:<br />
Name Lookup The request/response time for converting a<br />
name into an address.<br />
PING Response The time it takes to perform an ICMP Echo<br />
test on the server.<br />
1st Response The time it takes to acknowledge the GET<br />
command.<br />
Receive Rate The rate in bytes per second for the download<br />
of the first data in response to the get command.<br />
226 <strong>Agilent</strong> <strong>FrameScope</strong> <strong>350</strong> User’s Manual
E-mail Server<br />
<strong>Network</strong> <strong>Performance</strong> Analyzer Reference 8<br />
<strong>Network</strong> <strong>Performance</strong> Autotest<br />
The E- mail Server test verifies that the E- mail server is<br />
accessible and measures the access time and download rate<br />
of E- mail.<br />
Test Setup<br />
The first setup screen is used to enter the name or address<br />
of the E- mail server and enter the user name and password,<br />
if desired. The second setup screen is used to enter the<br />
operations to be tested and the send and receive methods as<br />
well as the ports used. Default port addresses are provided<br />
<strong>Agilent</strong> <strong>FrameScope</strong> <strong>350</strong> User’s Manual 227
8 <strong>Network</strong> <strong>Performance</strong> Analyzer Reference<br />
<strong>Network</strong> <strong>Performance</strong> Autotest<br />
NOTE<br />
The last setup screen provides a list of the measurements<br />
performed during the test. Any of the thresholds used to<br />
rate the performance of each of these measurements may be<br />
viewed and modified by selecting it from this list and<br />
selecting Edit.<br />
If e-mail server and e-mail domain names differ, the entry for User Name<br />
has to include its domain name. For example, if the e-mail server name is<br />
“pop3.agilent.com.sg” and the e-mail domain name is “agilent.com.sg”,<br />
enter “abc@agilent.com.sg” in the User Name field.<br />
The measurements taken during this test are:<br />
Name Lookup The request/response time for converting a<br />
name into an address.<br />
PING Response The time it takes to perform an ICMP Echo<br />
test on the server.<br />
Write Time The time it takes to write to the server.<br />
228 <strong>Agilent</strong> <strong>FrameScope</strong> <strong>350</strong> User’s Manual
<strong>Network</strong> <strong>Performance</strong> Analyzer Reference 8<br />
<strong>Network</strong> <strong>Performance</strong> Autotest<br />
Relay Time The time it takes to relay through the server and<br />
be available to read.<br />
Read Time The time it takes to read the E- mail using either<br />
POP3 or SMTP.<br />
These times may all be modified by selecting the<br />
measurement and pressing Edit.<br />
<strong>Agilent</strong> <strong>FrameScope</strong> <strong>350</strong> User’s Manual 229
8 <strong>Network</strong> <strong>Performance</strong> Analyzer Reference<br />
<strong>Network</strong> <strong>Performance</strong> Autotest<br />
Novell Server<br />
Print Server<br />
FTP Server<br />
SNMP Agent<br />
Primary Domain Controller<br />
Backup Domain Controller<br />
Router<br />
Workstation<br />
These tests verifies that the named device is accessible and<br />
measures the name lookup time and the ping response time.<br />
Test Setup<br />
The first setup screen is used to enter the name or address<br />
of the device to be tested.<br />
The last setup screen provides a list of the measurements<br />
performed during the test. Any of the thresholds used to<br />
rate the performance of each of these measurements may be<br />
viewed and modified by selecting it from this list and<br />
selecting Edit.<br />
230 <strong>Agilent</strong> <strong>FrameScope</strong> <strong>350</strong> User’s Manual
Autotest Results<br />
<strong>Network</strong> <strong>Performance</strong> Analyzer Reference 8<br />
<strong>Network</strong> <strong>Performance</strong> Autotest<br />
The measurements taken during all these tests are:<br />
Name Lookup The request/response time for converting a<br />
name into an address.<br />
PING Response The time it takes to perform an ICMP Echo<br />
test on the device.<br />
While the test is running, the overall status of each server<br />
test is displayed. As each test completes, it is given a<br />
performance metric. When all of the tests are completed, the<br />
overall performance metric is calculated and presented to<br />
the user. Details about each test result may be viewed. As an<br />
example of the details available, a web server test may<br />
<strong>Agilent</strong> <strong>FrameScope</strong> <strong>350</strong> User’s Manual 231
8 <strong>Network</strong> <strong>Performance</strong> Analyzer Reference<br />
<strong>Network</strong> <strong>Performance</strong> Autotest<br />
require a DNS lookup, a PING response, a first response,<br />
and a page read operation. The status and time for each of<br />
these operations is presented in the detailed view.<br />
The Autotest may be left running in a loop with a<br />
programmable delay between each iteration of the autotest.<br />
This feature may be used to find problems that may only<br />
occur at certain times of the day. In this case, the response<br />
times for each test are recorded and the current, average,<br />
minimum and maximum response times for each test are<br />
displayed after each test. When the autotest is finished, the<br />
response times for any test may be plotted.<br />
232 <strong>Agilent</strong> <strong>FrameScope</strong> <strong>350</strong> User’s Manual
Statistics<br />
Overall Statistics<br />
<strong>Network</strong> <strong>Performance</strong> Analyzer Reference 8<br />
Statistics<br />
The first view into statistics provides the overall network<br />
health. The operator can drill down into the statistics to get<br />
more and more detailed information. Some of the more<br />
detailed information is gathered by software that may not<br />
have enough bandwidth to process 100% of the frames. So a<br />
value is presented for the percent of frames processed in<br />
these cases.<br />
The current and maximum values of each statistic are<br />
displayed. Graphs of the each statistic are also displayed in<br />
strip charts. The interval at which the graph is updated is<br />
programmable so that the graph can cover the last 5 minutes<br />
in detail up to the last 24 hours with less details. The<br />
operator can obtain more information about any of these<br />
statistics by selecting it.<br />
Utilization Utilization values are displayed as percent of<br />
total network bandwidth. Pressing this statistic switches to a<br />
list of Top Transmitters.<br />
Unicasts The number of unicast frames or the percent of<br />
the utilization used up by unicast frames. Pressing this<br />
statistic switches to a list of Top Unicast Transmitters.<br />
<strong>Agilent</strong> <strong>FrameScope</strong> <strong>350</strong> User’s Manual 233
8 <strong>Network</strong> <strong>Performance</strong> Analyzer Reference<br />
Statistics<br />
Top Transmitters<br />
Error Mix<br />
Multicasts The number of multicast frames or the percent<br />
of the utilization used up by broadcast frames. Pressing this<br />
statistic switches to a list of Top Multicast Transmitters.<br />
Pressing any of the Top Transmitters brings up the Station<br />
Detail screen for that station.<br />
Broadcasts The number of broadcast frames or the percent<br />
of the utilization used up by broadcast frames. Pressing this<br />
statistic switches to a list of Top Broadcast Transmitters.<br />
Pressing any of the Top Transmitters brings up the Station<br />
Detail screen for that station.<br />
Errors The number of frames with errors or the percent of<br />
the utilization used up by frames with errors. Pressing this<br />
statistic switches to the Error Mix. Pressing on one of the<br />
Error Mix, will switch to a list of the Top Transmitter of<br />
that error type. Pressing any of the Top Transmitters brings<br />
up the Station Detail screen for that station.<br />
Collisions The number of collisions or the percent of the<br />
utilization used up by collisions.<br />
A list of stations, sorted by a specific statistic is displayed.<br />
The statistic used for sorting is set when the list is created.<br />
For instance, if the user enters the Top Transmitters by<br />
pressing the Jabbers statistic in the Statistics screen the Top<br />
Jabber Transmitters is displayed. Pressing any of the Top<br />
Transmitters brings up the Station Detail screen for that<br />
station.<br />
Long Frames Any frame over 1518 bytes with a valid CRC<br />
and alignment. Pressing this statistic gets you to the Top<br />
Long Frame Transmitters.<br />
Short Frames Any frame under 64 bytes long with a valid<br />
CRC and alignment. Pressing this statistic gets you to the<br />
Top Short Frame Transmitters.<br />
Jabbers Any frame over 1518 bytes with a CRC or<br />
alignment error. Pressing this statistic gets you to the Top<br />
Jabber Transmitters.<br />
234 <strong>Agilent</strong> <strong>FrameScope</strong> <strong>350</strong> User’s Manual
Protocol Mix<br />
<strong>Network</strong> <strong>Performance</strong> Analyzer Reference 8<br />
Statistics<br />
CRC/Alignment Errors Any valid sized frame with a CRC or<br />
alignment error. Pressing this statistic gets you to the Top<br />
Transmitters with an invalid CRC or alignment.<br />
Selecting the protocol option gets you to the Top<br />
Transmitters of that protocol. Pressing any of the Top<br />
Transmitters brings up the Station Detail screen for that<br />
station.<br />
IP<br />
IPX<br />
ARP<br />
RARP<br />
Banyan<br />
DECnet<br />
SNA<br />
AppleTalk<br />
NetBIOS<br />
Spanning Tree<br />
Other<br />
<strong>Agilent</strong> <strong>FrameScope</strong> <strong>350</strong> User’s Manual 235
8 <strong>Network</strong> <strong>Performance</strong> Analyzer Reference<br />
<strong>Network</strong> Tools<br />
<strong>Network</strong> Tools<br />
Ping<br />
Trace Route<br />
The Ping tool is used to verify access to devices on a<br />
network. The current, minimum, maximum and average<br />
response times are displayed along with a count for the<br />
number of times there was no response.<br />
This tool may be run in IP or IPX mode. The IP Ping sends<br />
ICMP Echo frames to the target device. The IPX Ping can<br />
use either Diagnostic Responder or Ping frames.<br />
The operator may alter the following parameters:<br />
Target Device Address The target device may be selected<br />
from a list or entered as a name or address. If an IP device<br />
is specified by a name, DNS and WINS are used to translate<br />
the name into an IP address. Names in IPX mode are<br />
translated using the SAP protocol.<br />
Frame Size Length of the frame, in bytes, including the FCS.<br />
Number of Frames Number of frames to send. If Continuous<br />
is selected, the <strong>FrameScope</strong> sends frames until the tool is<br />
stopped.<br />
Time to Live (IP Only) The maximum number of routers to<br />
traverse to the target device.<br />
Don’t Fragment (IP Only) Selecting this option sets the Don’t<br />
Fragment flag in the IP frame. This flag tells routers along<br />
the path that this frame should not be divided into smaller<br />
fragments.<br />
The Trace Route tool is used to determine the route taken to<br />
a slave device. A list of routers found along the path to the<br />
slave device is displayed along with a count of the number<br />
of hops to each router and the response time for each<br />
router.<br />
The operator may alter the following parameters:<br />
236 <strong>Agilent</strong> <strong>FrameScope</strong> <strong>350</strong> User’s Manual
SNMP Query<br />
Locate Switch Port<br />
<strong>Performance</strong> Tests<br />
<strong>Network</strong> <strong>Performance</strong> Analyzer Reference 8<br />
<strong>Network</strong> Tools<br />
Slave device IP address The slave device may be selected<br />
from a list or entered as a name or IP address. If the device<br />
is specified by a name, DNS and WINS are used to translate<br />
the name into an IP address.<br />
Maximum Hop Count The maximum number of routers to<br />
traverse while tracing out the route.<br />
This tool uses SNMP to retrieve the following information<br />
from the device. This information is usually provided by IT<br />
services.<br />
MIB II System Group<br />
System description<br />
Up time<br />
Contact<br />
System name<br />
Location<br />
This tool is used to determine the switch port to which a<br />
device is connected. SNMP is used to look for switches in<br />
the network. Each of these switches are probed to see if the<br />
device shows up in the switch’s tables. All of the switch<br />
ports which are mapped to the devices MAC address are<br />
displayed. There is no order to the list for multiple results,<br />
so you cannot interpret the results as a direct path.<br />
The <strong>Performance</strong> Tests tool is used to verify the performance<br />
of a network between two network points. These tests are IP<br />
and MAC loopback tests, RFC 2544 throughput and latency<br />
tests. For details on each test, go to “<strong>Performance</strong> Tests” on<br />
page 53. Some points to note are:<br />
All loopback and RFC 2544 tests require a second<br />
Framescope as a slave device.<br />
The MAC loopback test only works within the subnet<br />
(does not work across routers).<br />
<strong>Agilent</strong> <strong>FrameScope</strong> <strong>350</strong> User’s Manual 237
8 <strong>Network</strong> <strong>Performance</strong> Analyzer Reference<br />
<strong>Network</strong> Tools<br />
Traffic Generation<br />
A hardware based traffic generation tool is provided to<br />
enable network testing under heavily loaded conditions.<br />
Hardware- based timers control the transmission of the user<br />
specified frames into the network.<br />
The operator may change any of the following properties of<br />
the traffic being generated:<br />
Frame Length The number of bytes in the frame, including<br />
the FCS. This number ranges from 64- 1518 unless long or<br />
short frames are specified. If the Short Frames box is<br />
checked, the frame size ranges from 40- 63. If the Long<br />
Frames box is checked, the frame size ranges from<br />
1519- 5000.<br />
Frame Rate The rate at which frames are transmitted by the<br />
<strong>FrameScope</strong>. Changing the Frame Rate causes the Utilization<br />
to be recalculated.<br />
Utilization The percent of the Ethernet bandwidth which<br />
the <strong>FrameScope</strong> should fill up. This value ranges from 0<br />
which causes no frames to be transmitted to 100 which<br />
causes the <strong>FrameScope</strong> to completely load the network<br />
connection. Changing the Utilization causes the Frame Rate<br />
to be recalculated.<br />
# Frames or Continuous Specifies the number of frames the<br />
<strong>FrameScope</strong> should generate when the Start button is<br />
pressed. If Continuous is selected, the <strong>FrameScope</strong> begins<br />
generating frames when the Start button is pressed and<br />
does not stop until the Stop button is pressed or the Traffic<br />
Generator tool is exited.<br />
Errors Frames with errors may be generated. The error<br />
types include CRC error, short frame or long frame.<br />
Frame Type<br />
802.3/802.2<br />
Ethernet/IP<br />
SNAP/IP<br />
Ethernet/IPX<br />
802.3/IPX<br />
802.2/IPX<br />
238 <strong>Agilent</strong> <strong>FrameScope</strong> <strong>350</strong> User’s Manual
SNAP/IPX<br />
<strong>Network</strong> <strong>Performance</strong> Analyzer Reference 8<br />
<strong>Network</strong> Tools<br />
Source MAC Choices include this <strong>FrameScope</strong>’s MAC or<br />
simulate multiple (10, 100 or 200) stations. The simulated<br />
MACs use the values 00- 0C- 65- 01- 00- XX where XX<br />
increments from 01 to C8 (hex).<br />
Destination MAC To send a frame to a station on the local<br />
LAN, enter its MAC address. If the destination address is set<br />
to FF- FF- FF- FF- FF- FF, the frame will be received by all<br />
devices on the LAN. To send a frame across a router, the<br />
router’s MAC address should be used.<br />
Source IP or IPX Source network address, if required. If<br />
Source MAC is set to simulate multiple stations, then the<br />
Source IP is incremented along with the MAC. For instance,<br />
if the <strong>FrameScope</strong> is set up to generate Ethernet/IP frames<br />
from multiple simulated stations with IP Address set to<br />
209.6.108.202, then the first two frames would be addressed<br />
as follows:<br />
Frame Number MAC Address IP Address<br />
1 00-0C-65-01-00-01 209.6.108.202<br />
2 00-0C-65-01-00-02 209.6.108.203<br />
Destination IP or IPX Destination network address, if<br />
required.<br />
<strong>Agilent</strong> <strong>FrameScope</strong> <strong>350</strong> User’s Manual 239
8 <strong>Network</strong> <strong>Performance</strong> Analyzer Reference<br />
Remote Control<br />
Remote Control<br />
A web server is implemented in the <strong>FrameScope</strong> <strong>350</strong> to<br />
provide a means to control and monitor the <strong>FrameScope</strong> <strong>350</strong><br />
via a web browser.<br />
The <strong>FrameScope</strong>’s home page provides links to the following<br />
<strong>FrameScope</strong> functions:<br />
Station List Links to the current list of stations. This is the<br />
same list that is accessible on the <strong>FrameScope</strong> through the<br />
Tools - > <strong>Network</strong> Database buttons.<br />
Autotest Results Links to the current autotest results.<br />
Test Database Links to a list of stored test results from the<br />
following test tools:<br />
Autotest Database - links to a list of stored <strong>Network</strong><br />
Autotest results.<br />
RFC 2544 Test Database - links to a list of RFC 2544<br />
throughput and latency test results.<br />
Tools Test Database - links to a list of MAC and IP<br />
loopback test results.<br />
Statistics Database - links to a list of saved statistics<br />
data.<br />
240 <strong>Agilent</strong> <strong>FrameScope</strong> <strong>350</strong> User’s Manual
NOTE<br />
<strong>Network</strong> <strong>Performance</strong> Analyzer Reference 8<br />
Remote Control<br />
These results may be viewed directly as web pages or the<br />
result file may be uploaded to a PC. The result file contains<br />
all of the results for the test in Comma Separated Value<br />
(CSV) format for use in spreadsheet programs.<br />
If the <strong>FrameScope</strong> is currently running one of the tools (Autotest, RFC<br />
2544, IP/MAC Loopback or Statistics) in any of the <strong>FrameScope</strong> screens,<br />
its respective stored data or test results in the <strong>FrameScope</strong> cannot be<br />
displayed. For example, if you are running Statistics on the <strong>FrameScope</strong>,<br />
you cannot view the Statistics database from the remote screen.<br />
<strong>Network</strong> Database Links to a list of stored station lists.<br />
These station lists may be uploaded to the PC. The station<br />
lists are stored in Comma Separated Value (CSV) format for<br />
use in spreadsheet or database programs.<br />
Remote Control Links to a page which shows an image of<br />
the <strong>FrameScope</strong>’s display. Clicking on this image has the<br />
effect of pressing the <strong>FrameScope</strong>’s display. The display is<br />
updated when the user of the web interface clicks on the<br />
screen or every 10 seconds if no screen operations are<br />
performed.<br />
Error Log Links to a list of errors found on the network.<br />
<strong>Agilent</strong> <strong>FrameScope</strong> <strong>350</strong> User’s Manual 241
8 <strong>Network</strong> <strong>Performance</strong> Analyzer Reference<br />
Memory Requirements<br />
Memory Requirements<br />
The <strong>FrameScope</strong> <strong>350</strong> requires a CompactFlash card to<br />
store test results and network station lists. The amount of<br />
memory that each Autotest result takes up depends on the<br />
number of test and the number of iterations that you set<br />
before starting the test. The results require about 600 bytes<br />
per test plus 150 bytes per iteration for each test. There is a<br />
limit of 100 tests and a limit of 100 iterations. Therefore, the<br />
maximum results size is about 1.5 MB.<br />
The Autotest suite storage requirement is only <strong>350</strong> bytes per<br />
test, so the maximum size is about 35 KB.<br />
The station list storage requirement is 250 bytes per station<br />
with a maximum of about 1500 stations, so the maximum<br />
size is 375 KB.<br />
The <strong>FrameScope</strong> <strong>350</strong> does not use any of the 4MB of<br />
internal Flash memory for network test result storage. The<br />
cable test results can be stored in the internal Flash<br />
memory.<br />
The following table lists approximate record storage<br />
capacities when configured for a 32 MB removable<br />
CompactFlash card and for comparison, a 192 MB card. All<br />
sizes of CompactFlash will work as <strong>FrameScope</strong> <strong>350</strong><br />
<strong>Network</strong> Autotest results storage.<br />
Saved Test Results Capacities, assuming a 1 MB used for test suites and station lists<br />
Autotest # Iterations Size of<br />
record<br />
Capacity (# of<br />
Records)<br />
32 MB<br />
CFlash<br />
Card<br />
192 MB<br />
CFlash<br />
Card<br />
10 Autotests 1 60 KB 516 3183<br />
10 Autotests 100 156 KB 198 1224<br />
100<br />
Autotests<br />
100<br />
Autotests<br />
1 600 KB 51 318<br />
100 1.56 MB 19 122<br />
242 <strong>Agilent</strong> <strong>FrameScope</strong> <strong>350</strong> User’s Manual
<strong>Agilent</strong> <strong>N2610A</strong> <strong>FrameScope</strong> <strong>350</strong> <strong>Network</strong> <strong>Performance</strong> Analyzer<br />
User’s Manual<br />
9<br />
Cable Tester Reference<br />
Measurements 244<br />
WireMap 244<br />
Length 244<br />
Propagation Delay and Skew 245<br />
Near End Crosstalk (NEXT) 245<br />
Attenuation 245<br />
Return Loss 246<br />
Equal Level Far End Crosstalk (ELFEXT) 246<br />
Attenuation to Crosstalk Ratio (ACR) 247<br />
Power Sum NEXT (PSNEXT) 247<br />
Power Sum ELFEXT (PSELEXT) 247<br />
Power Sum ACR (PSACR) 247<br />
Resistance 247<br />
Ambient Noise 247<br />
Calibration 248<br />
Measurement Calibration 248<br />
Memory Requirements 250<br />
This chapter describes the cable tester features of the<br />
<strong>Agilent</strong> <strong>FrameScope</strong> <strong>350</strong>.<br />
<strong>Agilent</strong> Technologies<br />
243
9 Cable Tester Reference<br />
Measurements<br />
Measurements<br />
WireMap<br />
Length<br />
The <strong>FrameScope</strong> <strong>350</strong> makes the following test measurements.<br />
See “Setting the Measurements” on page 158 for more<br />
details.<br />
WireMap testing checks for proper continuity and<br />
termination of cables. The test identifies the following faults:<br />
Short circuit<br />
Open circuit<br />
Reversed pairs<br />
Transposed pairs<br />
Split pairs<br />
Shield continuity faults<br />
The DualRemote or WireMap Adapter is used for wiremap<br />
testing. For details on the WireMap Adapter, see “WireMap<br />
Adapter Testing” on page 117. For details on the<br />
<strong>FrameScope</strong> DualRemote, see “The DualRemote <strong>350</strong>” on<br />
page 252.<br />
Length measurements determine the electrical length of cable<br />
runs up to 1100 feet (335 meters). Accurate length<br />
measurements require accurate NVP settings. Choosing a<br />
cable type from the <strong>FrameScope</strong>’s database automatically<br />
loads NVP settings, or the NVP for a cable can be measured<br />
on a sample (“Learning the NVP of a Cable” on page 167).<br />
Length Measurement Specifications<br />
Accuracy ± 4% or ± 2 feet (0.6 M), whichever is greater<br />
Resolution ± 1 foot (0.3 M) < 100M<br />
Minimum Distance 0 feet (0 M)<br />
Maximum Distance 1,100 feet (335 M)<br />
244 <strong>Agilent</strong> <strong>FrameScope</strong> <strong>350</strong> User’s Manual
Propagation Delay and Skew<br />
Near End Crosstalk (NEXT)<br />
Attenuation<br />
Cable Tester Reference 9<br />
Measurements<br />
The Propagation Delay test measures the one- way<br />
propagation delay over each pair of the tested cable run.<br />
Skew is the difference in propagation delay between the<br />
pairs with the longest and shortest delay in a cable.<br />
Propagation Delay and Skew Measurement Specifications<br />
Accuracy ± 4% or ± 1 nanoseconds, whichever is greater<br />
Resolution ± 1 nanoseconds<br />
Minimum Delay 0 nanoseconds<br />
Maximum Delay 2,000 nanoseconds<br />
Delay Skew The difference in nanoseconds between the longest<br />
and shortest measured propagation delay among the<br />
four pairs of a single cable run<br />
NEXT measures near end coupling between pairs in the<br />
tested cable run, at both ends of a cable, over 6 pair<br />
combinations.<br />
NEXT Measurement Specifications<br />
Frequency Range 1 – <strong>350</strong> MHz<br />
Frequency Step Sizes 125 kHz, 250 kHz, 500 kHz, 1 MHz, set automatically<br />
based on selected standards<br />
Resolution 0.1 dB<br />
Dynamic Range 90 dB or 25 dB beyond Category6 basic link limit,<br />
whichever is higher<br />
Baseline Accuracy 40% better than TIA Level III requirement *<br />
* TIA level III measurement parameter and tester accuracy requirements per<br />
TIA Category 6 Draft – Addendum to TIA-568-B and ISO/IEC 61935-1 draft<br />
amendment 1, 10/99<br />
Attenuation measures the decrease in signal strength over<br />
the length of all pairs in a cable.<br />
Attenuation Measurement Specifications<br />
Frequency Range 1 – <strong>350</strong> MHz<br />
<strong>Agilent</strong> <strong>FrameScope</strong> <strong>350</strong> User’s Manual 245
9 Cable Tester Reference<br />
Measurements<br />
Return Loss<br />
Frequency Step Size 125 kHz, 250 kHz, 500 kHz, 1 MHz, set automatically<br />
based on selected standards<br />
Resolution 0.1 dB<br />
Dynamic Range 90 dB<br />
Baseline Accuracy 40% better than TIA Level III requirement *<br />
* TIA level III measurement parameter and tester accuracy requirements per<br />
TIA Category 6 Draft – Addendum to TIA-568-B and ISO/IEC 61935-1 draft<br />
amendment 1, 10/99<br />
Return Loss measures the degradation of signal over all four<br />
pairs from each end of the tested cable run.<br />
Return Loss Measurement Specifications<br />
Frequency Range 1 – <strong>350</strong> MHz<br />
Frequency Step Size 125 kHz, 250 kHz, 500 kHz, 1 MHz, set automatically<br />
based on selected standards<br />
Resolution 0.1 dB<br />
Dynamic Range 35 dB<br />
Baseline Accuracy 40% better than TIA Level III requirement *<br />
* TIA level III measurement parameter and tester accuracy requirements per<br />
TIA Category 6 Draft – Addendum to TIA-568-B and ISO/IEC 61935-1 draft<br />
amendment 1, 10/99<br />
Equal Level Far End Crosstalk (ELFEXT)<br />
ELFEXT measures far end coupling between pairs in the<br />
tested cable, for all pair combinations.<br />
ELFEXT Measurement Specifications<br />
Frequency Range 1 – <strong>350</strong> MHz<br />
Frequency Step Size 125 kHz, 250 kHz, 500 kHz, 1 MHz, set automatically<br />
based on selected standards<br />
Resolution 0.1 dB<br />
Dynamic Range 90 dB or 40 dB beyond Category 6 link limit<br />
whichever is higher<br />
Baseline Accuracy 40% better than TIA Level III requirement *<br />
* TIA level III measurement parameter and tester accuracy requirements per<br />
TIA Category 6 Draft – Addendum to TIA-568-B and ISO/IEC 61935-1 draft<br />
amendment 1, 10/99<br />
246 <strong>Agilent</strong> <strong>FrameScope</strong> <strong>350</strong> User’s Manual
Attenuation to Crosstalk Ratio (ACR)<br />
Power Sum NEXT (PSNEXT)<br />
Power Sum ELFEXT (PSELEXT)<br />
Power Sum ACR (PSACR)<br />
Resistance<br />
Ambient Noise<br />
Cable Tester Reference 9<br />
Measurements<br />
The ratio of the measured attenuation and the near end<br />
crosstalk (NEXT) at each frequency point.<br />
Computed for each pair by calculating a power sum total of<br />
the pair- to- pair NEXT from the three other pairs.<br />
Computed for each pair by calculating a power sum total of<br />
the pair- to- pair ELFEXT from the three other pairs.<br />
The ratio of the measured attenuation and the computed<br />
power sum near end crosstalk (PSNEXT) at each frequency<br />
point.<br />
The dc loop resistance for each pair in the tested cable run.<br />
Resistance Measurement Specifications<br />
Range 5 – 1,000 Ω<br />
Accuracy ± 5%<br />
The ambient noise spectrum of each pair immediately after<br />
the autotest.<br />
Ambient Noise Measurement Specifications<br />
Frequency Range 1 – <strong>350</strong> MHz<br />
Sensitivity 0.1 mV RMS<br />
Accuracy ± 5%<br />
<strong>Agilent</strong> <strong>FrameScope</strong> <strong>350</strong> User’s Manual 247
9 Cable Tester Reference<br />
Calibration<br />
Calibration<br />
Measurement Calibration<br />
Remote Calibration<br />
Remote calibration establishes a common zero reference for<br />
the <strong>FrameScope</strong> <strong>350</strong> and its associated DualRemote <strong>350</strong>,<br />
before any end- to- end measurements are taken.<br />
You must perform a remote calibration if you use your<br />
<strong>FrameScope</strong> <strong>350</strong> with a different DualRemote <strong>350</strong>, or if you<br />
upgrade the software in either the <strong>FrameScope</strong> or<br />
DualRemote. The <strong>FrameScope</strong> stores the serial number<br />
information of the DualRemote that it has been calibrated<br />
with. Before each measurement, the <strong>FrameScope</strong> checks the<br />
serial numbers of the DualRemote to which it is connected.<br />
If the <strong>FrameScope</strong> does not have remote calibration data<br />
stored for the detected DualRemote, a warning appears,<br />
asking you to calibrate the DualRemote.<br />
<strong>Agilent</strong> Technologies recommends running the remote<br />
calibration once a day, at the beginning of a testing session.<br />
Environmental Calibration (Internal)<br />
Environmental calibration compensates for the effects of<br />
ambient temperature and voltage variations. The <strong>FrameScope</strong><br />
<strong>350</strong> and DualRemote <strong>350</strong> use internal calibration paths to<br />
connect the signal source and measurement circuits,<br />
establishing a local calibration reference before each<br />
measurement. No operator involvement is required.<br />
Field Verification of Baseline Accuracy<br />
The Self- Test probe (part # N2594A- 015) can be used in the<br />
field to verify the baseline accuracy of a <strong>FrameScope</strong> <strong>350</strong> or<br />
DualRemote <strong>350</strong>. The Self- Test probe uses the SmartProbe<br />
port interface to automate the required setups for this<br />
function.<br />
To run a Self Test on the <strong>FrameScope</strong> <strong>350</strong>:<br />
1 Make sure that the <strong>FrameScope</strong> <strong>350</strong> display displays the<br />
main menu.<br />
2 Insert the Self- Test probe in the SmartProbe port<br />
3 Press the OK key. A PASS or FAIL screen displays.<br />
248 <strong>Agilent</strong> <strong>FrameScope</strong> <strong>350</strong> User’s Manual
Cable Tester Reference 9<br />
Calibration<br />
The PASS screen indicates that the <strong>FrameScope</strong>’s baseline<br />
calibration data is valid.<br />
If a FAIL screen displays, contact <strong>Agilent</strong> Technical Support.<br />
To run a self test on the DualRemote <strong>350</strong>:<br />
1 Insert the Self- Test probe in the SmartProbe port of the<br />
DualRemote <strong>350</strong>.<br />
2 Press the OK key. The Pass/Fail LED on the front panel<br />
of the DualRemote <strong>350</strong> indicates the outcome of the self<br />
test.<br />
If the self test fails, the DualRemote <strong>350</strong> requires a new<br />
baseline calibration or repair. Contact <strong>Agilent</strong> Technical<br />
Support.<br />
<strong>Agilent</strong> <strong>FrameScope</strong> <strong>350</strong> User’s Manual 249
9 Cable Tester Reference<br />
Memory Requirements<br />
Memory Requirements<br />
Autotest Type Configuration Stored NEXT<br />
Frequency<br />
Points<br />
Category 5E or 6<br />
without plots<br />
Category 5E or 6<br />
without plots<br />
Category 5E<br />
with plots saved<br />
Category 6<br />
with plots saved<br />
Category 6<br />
with plots saved<br />
The amount of memory that each test result takes up<br />
depends on the options that you set before starting the test.<br />
Generally, if you save plots with each test, test result files<br />
are larger than if you omit plots. When you save plots, the<br />
size of the result file depends on the maximum frequency<br />
selected, and on how many additional measurements each<br />
autotest includes.<br />
The <strong>FrameScope</strong> <strong>350</strong> allocates approximately 4MB of internal<br />
Flash memory for test result storage. The exact amount of<br />
memory available depends on the size of the <strong>FrameScope</strong><br />
<strong>350</strong> software.<br />
The following table lists approximate record storage<br />
capacities for the internal Flash memory when configured<br />
for 4MB and for a 32 MB removable CompactFlash card<br />
(Type I) and for comparison, a 192 MB card. Use a 8MB (or<br />
higher) CompactFlash card for extra storage.<br />
Saved Test Capacities<br />
Capacity (# of Records)<br />
Internal 4 MB<br />
Flash<br />
32 MB<br />
CFlash Card<br />
192 MB<br />
CFlash<br />
Card Type I<br />
None 12 1,200 9,900 59,550<br />
Ambient noise sweep on<br />
and network tests<br />
12 1,150 9,250 55,700<br />
Plots to 100 MHz 6288 94 750 4,500<br />
Plots to 250 MHz 9816 60 480 2,880<br />
Plots to <strong>350</strong> MHz;<br />
Ambient noise spectrum,<br />
<strong>Network</strong>s (All Options ON)<br />
NOTE<br />
12,204 45 360 2,150<br />
The <strong>FrameScope</strong> is compatible with CompactFlash Type I cards<br />
only, with storage size of 8MB and above.<br />
250 <strong>Agilent</strong> <strong>FrameScope</strong> <strong>350</strong> User’s Manual
<strong>Agilent</strong> <strong>N2610A</strong> <strong>FrameScope</strong> <strong>350</strong> <strong>Network</strong> <strong>Performance</strong> Analyzer<br />
User’s Manual<br />
10<br />
DualRemote <strong>350</strong> Reference<br />
The DualRemote <strong>350</strong> 252<br />
Control Buttons 252<br />
Indicators 253<br />
This chapter describes the features of the <strong>Agilent</strong><br />
DualRemote <strong>350</strong>.<br />
<strong>Agilent</strong> Technologies<br />
251
10 DualRemote <strong>350</strong> Reference<br />
The DualRemote <strong>350</strong><br />
The DualRemote <strong>350</strong><br />
Control Buttons<br />
The DualRemote <strong>350</strong> performs the same tests as the<br />
<strong>FrameScope</strong> <strong>350</strong>, and is controlled by the <strong>FrameScope</strong>. The<br />
DualRemote displays information using LED indicators.<br />
Pair status indicators<br />
Warning indicators<br />
Test progress and result<br />
indicators<br />
Diagnostic indicators<br />
Power indicator<br />
Power button<br />
OK button<br />
Scroll button<br />
The DualRemote <strong>350</strong> has the same control buttons on its<br />
face as the <strong>FrameScope</strong> <strong>350</strong>.<br />
Power The Power button turns the unit on and off.<br />
OK Pressing the OK button does nothing.<br />
252 <strong>Agilent</strong> <strong>FrameScope</strong> <strong>350</strong> User’s Manual
Indicators<br />
CAUTION<br />
DualRemote <strong>350</strong> Reference 10<br />
The DualRemote <strong>350</strong><br />
Scroll The Scroll button scrolls through the diagnostic<br />
indications.<br />
Pair Status Indicators<br />
The pair status indicators turn green or red at the end of a<br />
test to show the status of each pair. A red indicator means<br />
the associated pair failed the current test.<br />
Warning Indicators<br />
The warning indicators denote conditions that might prevent<br />
or impair testing.<br />
Hub/NIC Detected The Hub/NIC Detected indicator means<br />
the DualRemote <strong>350</strong> is connected to a hub/Switch port or<br />
NIC port, instead of to a port connected to the <strong>FrameScope</strong><br />
<strong>350</strong>. [This function is not yet supported.]<br />
Voltage Warning The voltage warning indicator means the<br />
DualRemote <strong>350</strong> is connected to a line which has a<br />
potentially damaging voltage present. This condition usually<br />
occurs when attempting to test a line that is connected to a<br />
telephone switch.<br />
If you see this indicator, immediately disconnect the DualRemote<br />
from the line. Failure to disconnect the line can permanently damage<br />
the DualRemote <strong>350</strong>.<br />
Calibration Required The Calibration Required indicator<br />
means the DualRemote <strong>350</strong> is not calibrated to the<br />
<strong>FrameScope</strong> <strong>350</strong>. The autotest will not execute until the<br />
calibration is done.<br />
Battery The battery indicator shows the current state of the<br />
DualRemote <strong>350</strong> battery charge.<br />
When an external charger is supplying power to the<br />
DualRemote:<br />
The Battery indicator is steady green when the battery is<br />
charging.<br />
The Battery indicator flashes green when the battery is<br />
fully charged.<br />
<strong>Agilent</strong> <strong>FrameScope</strong> <strong>350</strong> User’s Manual 253
10 DualRemote <strong>350</strong> Reference<br />
The DualRemote <strong>350</strong><br />
CAUTION<br />
When no external charger is connected to the DualRemote:<br />
The Battery indicator is dark when the battery is<br />
operating normally.<br />
The Battery indicator is red when the battery charge is<br />
low.<br />
Use only the 12V charger/adapter supplied with your <strong>FrameScope</strong><br />
and DualRemote. Using any other charger/adapter can damage your<br />
<strong>FrameScope</strong> equipment and void your warranty.<br />
Test Progress and Result Indicators<br />
Progress The Progress indicators show approximately how<br />
much of the current test is complete 1/3, 2/3, and complete.<br />
Pass/Fail The Pass/Fail indicator turns green when the test<br />
passes, or red when the test fails.<br />
Diagnostics<br />
The Diagnostics section of the DualRemote <strong>350</strong> front panel<br />
provides more detailed information about failing test results.<br />
WS and DR Indicate at which end of the tested cable the<br />
measurement failed.<br />
WS lights when a failure occurs at the <strong>FrameScope</strong> end of<br />
the circuit.<br />
DR lights when a failure occurs at the DualRemote end of<br />
the circuit.<br />
WS and DR both light when failures occur at both ends of<br />
the circuit. To determine which failures occurred at which<br />
end of the circuit, use the Scroll button.<br />
A column of diagnostic indicators shows details about the<br />
cause(s) of a test failure. The failures indicated on the<br />
DualRemote <strong>350</strong> are:<br />
WireMap Turns red when a fault with the cable connections<br />
is detected.<br />
Split Pairs Turns red when a split pair is detected.<br />
Length/Delay/Skew Turns red when cable length, signal<br />
delay, or skew are outside the passing limits.<br />
254 <strong>Agilent</strong> <strong>FrameScope</strong> <strong>350</strong> User’s Manual
DualRemote <strong>350</strong> Reference 10<br />
The DualRemote <strong>350</strong><br />
NEXT Turns red when near end pair- to- pair or power sum<br />
crosstalk faults are detected.<br />
Attenuation Turns red when attenuation is outside passing<br />
limits.<br />
ELFEXT Turns red when far- end pair- to- pair or power sum<br />
crosstalk faults are detected.<br />
Return Loss Turns red when the return signal loss exceeds<br />
passing limits.<br />
Other turns red when any other failing test results occur. If<br />
the cable run has multiple test failure causes, the Scroll<br />
button scrolls between diagnostic indications. The current<br />
selection blinks. The pair indicators and WS or DR<br />
indicators associated with the selected failure also blink.<br />
Power<br />
The Power indicator turns green when the DualRemote <strong>350</strong><br />
is powered on.<br />
<strong>Agilent</strong> <strong>FrameScope</strong> <strong>350</strong> User’s Manual 255
10 DualRemote <strong>350</strong> Reference<br />
The DualRemote <strong>350</strong><br />
256 <strong>Agilent</strong> <strong>FrameScope</strong> <strong>350</strong> User’s Manual
<strong>Agilent</strong> <strong>N2610A</strong> <strong>FrameScope</strong> <strong>350</strong> <strong>Network</strong> <strong>Performance</strong> Analyzer<br />
User’s Manual<br />
11<br />
Specifications<br />
Physical 258<br />
Environmental 259<br />
Electrical 260<br />
Ports 261<br />
SmartProbe test port 261<br />
Serial port 261<br />
USB-B port 261<br />
Talkset connector (3.6 mm phone jack) 261<br />
CompactFlash card slot 261<br />
Display 262<br />
Fiber SmartProbe+ 263<br />
<strong>Agilent</strong> Technologies<br />
257
9 Specifications<br />
Physical<br />
Physical<br />
The <strong>FrameScope</strong> <strong>350</strong> and DualRemote <strong>350</strong> are the same size,<br />
and weigh the same.<br />
Size 9.125” x 4.625” x 2.625” HWD (23.17 x 11.75 x 6.66<br />
cm)<br />
Weight 2.86 lbs. (1.3 kg)<br />
258 <strong>Agilent</strong> <strong>FrameScope</strong> <strong>350</strong> User’s Manual
Environmental<br />
Indoor / Outdoor Intended for indoor use; not weatherized<br />
Operating<br />
temperature range<br />
Storage temperature<br />
range<br />
0 to 40° C (32 to 104° F)<br />
–10 to 55° C (14 to 131° F)<br />
Maximum humidity 80% for temperatures to 31° C (88° F)<br />
Altitude To 3000 meters<br />
Pollution degree 2<br />
Specifications 9<br />
Environmental<br />
<strong>Agilent</strong> <strong>FrameScope</strong> <strong>350</strong> User’s Manual 259
9 Specifications<br />
Electrical<br />
Electrical<br />
WARNING<br />
NOTE<br />
Battery A removable rechargeable Nickel Metal Hydride<br />
(NiMH) battery pack typically provides 5-6 hours of<br />
operation between charges, depending on use and<br />
power management settings. An internal fast<br />
charger recharges the NiMH battery pack in less<br />
than 5 hours. Extra battery packs are available.<br />
Battery pack specification: (Part Number<br />
N2605A-135) 7.2 Vdc 3800 mAh<br />
External power Power converter: External ac to dc power converter<br />
(Part Number N2595A-110 for 110 VAC models, Part<br />
Number N2595A-210 for 220 VAC models) supplies<br />
12 Vdc, 1.2 A to the <strong>FrameScope</strong> <strong>350</strong> or DualRemote<br />
<strong>350</strong> power connector. Power connector polarity:<br />
Positive (+) on the outer sleeve; Negative (-) on the<br />
tip.<br />
Mains supply voltage Must be within 10% of nominal voltage<br />
Installation<br />
overvoltage<br />
Category II<br />
Use only the ac adapter supplied in the <strong>FrameScope</strong> Kit. Using<br />
other power adapters may damage the tester, and will void its<br />
warranty.<br />
This device complies with part 15 of the FCC rules. Operation is subject to<br />
the following two conditions: (1) This device may not cause harmful<br />
interference, and (2) this device must accept any interference received,<br />
including interference that may cause undesired operation.<br />
If this equipment is used in a manner not specified by the manufacturer,<br />
the protection provided by the equipment may be impaired and successful<br />
operation cannot be guaranteed.<br />
260 <strong>Agilent</strong> <strong>FrameScope</strong> <strong>350</strong> User’s Manual
Ports<br />
SmartProbe test port<br />
Serial port<br />
USB-B port<br />
Specifications 9<br />
Ports<br />
Attachment point for test probes. Interface contains high<br />
performance signal channels for measurement functions and<br />
two- way control interface for reading and controlling active<br />
test probes.<br />
Allows the <strong>FrameScope</strong> <strong>350</strong> or DualRemote <strong>350</strong> to connect<br />
to PCs or printers. Connector is an 8- pin micro- DIN. Pinout:<br />
<strong>FrameScope</strong> <strong>350</strong> and DualRemote <strong>350</strong>. The USB- B port<br />
allows the <strong>FrameScope</strong> <strong>350</strong> or DualRemote <strong>350</strong> to connect to<br />
a PC equipped with a USB port.<br />
Talkset connector (3.6 mm phone jack)<br />
CompactFlash card slot<br />
Din 8 pin # Signal DB9 pin # DB25 pin #<br />
1 DTR 4 20<br />
2 RXD 2 3<br />
3 GND 5 7<br />
4 NOT USED<br />
5 TXD 3 2<br />
6-8 NOT USED<br />
<strong>FrameScope</strong> <strong>350</strong> and DualRemote <strong>350</strong>. Supports two- way<br />
voice communication between <strong>FrameScope</strong> and DualRemote<br />
operators over cable run under test. Accepts <strong>Agilent</strong> talkset<br />
(Part Number N2605A- 137).<br />
Provides removable non- volatile storage for test result files.<br />
Supports standard CompactFlash Type I storage cards,<br />
with densities from 8MB to as high as 512MB. Data stored<br />
in standard format compatible with PCMCIA- ATA<br />
specification.<br />
<strong>Agilent</strong> <strong>FrameScope</strong> <strong>350</strong> User’s Manual 261
9 Specifications<br />
Display<br />
Display<br />
6.625” (16.83 cm) diagonal backlit color LCD. Resolution: 240<br />
(H) x 640 (V). The display is capable of displaying text and<br />
graphics in up to 256 colors.<br />
262 <strong>Agilent</strong> <strong>FrameScope</strong> <strong>350</strong> User’s Manual
Specifications 9<br />
Fiber SmartProbe+<br />
Fiber SmartProbe +<br />
General FiberSmartProbe+850nm, Fiber SmartProbe+ 1300nm Fiber SmartProbe+ 1310nm, Fiber SmartProbe+ 1550nm<br />
Size 2.4” x 1.6” x 0.8”<br />
2.4” x 1.6” x 0.8”<br />
(6.0 cm x 4.0 cm x 2.5 cm)<br />
(6.0 cm x 4.0 cm x 2.5 cm)<br />
Optical Connectors ST® x 2 SC x 2<br />
Power Source Draws power from WireScope 155 or<br />
Draws power from WireScope 155 or<br />
DualRemote 155 via intelligent test port interface DualRemote 155 via intelligent test port interface<br />
Operating Temperature 0 o to 40 o C 0 o to 40 o C<br />
Storage Temperature - 10 o to 55 o C - 10 o to 55 o C<br />
Operating Humidity 10 to 90% non-condensing 10 to 90% non-condensing<br />
Maximum Relative Humidity 80% for temperatures up to 31 C, decreasing 80% for temperatures up to 31 C, decreasing<br />
linearly to 50% relative humidity at 40 C<br />
linearly to 50% relative humidity at 40 C<br />
Altitude Up to 2000 meters Up to 2000 meters<br />
Detector FiberSmartProbe+850nm, Fiber SmartProbe+ 1300nm Fiber SmartProbe+ 1310nm, Fiber SmartProbe+ 1550nm<br />
Receive Wavelengths 850 and 1300nm 1310nm and 1550nm<br />
Measurement Accuracy +/-0.2dB @ -20dBm +/-0.2dB @ -20dBm<br />
Dynamic Range 0 to –40 dBm 0 to –40 dBm<br />
Detector Type Germanium Germanium<br />
Transmitter FiberSmartProbe+850nm, Fiber SmartProbe+ 1300nm Fiber SmartProbe+ 1310nm, Fiber SmartProbe+ 1550nm<br />
Power Output (into 62.5/125 multimode fiber)<br />
(into 9/125 singlemode fiber)<br />
-10dBm (850nm), -15dBm (1300nm)<br />
-3 dBm (1310nm and 1550nm)<br />
Source Type LED Stabilized Class 1 LASER 2 product in accordance<br />
with EN 60825.1 and FDA 21 CFR 1040.10.<br />
Center Wavelength 1310nm +/- 30nm, 1550nm +/- 30nm<br />
Spectral Bandwidth (RMS) < 5nm<br />
Stability N/A +/- 0.1dB, 1Hr. @ 25 C<br />
Stabilization Time N/A < 5 min.<br />
Cable Length FiberSmartProbe+850nm, Fiber SmartProbe+ 1300nm Fiber SmartProbe+ 1310nm, Fiber SmartProbe+ 1550nm<br />
Accuracy (whichever is greater) +/- 4% or +/- 1.5 meters +/- 4% or +/- 1.5 meters<br />
Resolution +/- 1.5 meters +/- 1.5 meters<br />
Distance 1 Range 0 – 4 km for 3.75 dB/km @ 850nm<br />
0 – 10 km for 1.50 dB/km @ 1300nm<br />
0 – 50 km for 0.5dB/km @ 1310nm and 1550nm<br />
Propagation Delay FiberSmartProbe+850nm, Fiber SmartProbe+ 1300nm Fiber SmartProbe+ 1310nm, Fiber SmartProbe+ 1550nm<br />
Accuracy (whichever is greater) +/- 4% or +/- 6 nanoseconds +/- 4% or +/- 6 nanoseconds<br />
Resolution +/- 6 nanoseconds +/- 6 nanoseconds<br />
Range 0 – 300 microseconds 0 – 300 microseconds<br />
1 Assumes double-ended configuration with –15dB maximum multimode<br />
link loss and 25dB maximum singlemode link loss. Divide by two for<br />
single-ended configuration.<br />
• ST is a registered trademark of AT&T<br />
2 For safety the transmitter should never be viewed directly with the naked eye, a lens, or<br />
magnifying device.<br />
KLASSE 1 LASER PRODUKT<br />
<strong>Agilent</strong> <strong>FrameScope</strong> <strong>350</strong> User’s Manual 263
9 Specifications<br />
Fiber SmartProbe+<br />
264 <strong>Agilent</strong> <strong>FrameScope</strong> <strong>350</strong> User’s Manual
<strong>Agilent</strong> <strong>N2610A</strong> <strong>FrameScope</strong> <strong>350</strong> <strong>Network</strong> <strong>Performance</strong> Analyzer<br />
User’s Manual<br />
12<br />
Glossary<br />
Glossary 266<br />
<strong>Agilent</strong> Technologies<br />
265
9 Glossary<br />
Glossary<br />
Glossary<br />
ARP Address Resolution Protocol - A broadcast protocol<br />
used to discover the low level (MAC) address that<br />
corresponds to the higher level (IP, IPX, etc.) address.<br />
Auto Discovery Proactively requesting information about the<br />
network. Also called Active Discovery.<br />
Auto Negotiation The process of querying a switch or hub<br />
port to connect at the highest possible rate. The options<br />
include 10 or 100 Mbit Ethernet at half or full duplex.<br />
Bridge A device used to expand a local area network by<br />
forwarding frames between data link layers associated with<br />
two separate cables. See also router.<br />
Broadcast A transmission addressed to all stations on a<br />
network.<br />
Collision The error that occurs when two stations attempt<br />
to transmit at the same time on an Ethernet network.<br />
CRC Error Cyclic Redundancy Check - An error detection<br />
scheme using a number derived from the data that is<br />
transmitted in the packet. The number is calculated by the<br />
sending station and stored in the packet. The receiving<br />
station, upon receipt of the packet recalculates the number<br />
and compares it to the stored value. If they are not the<br />
same, then the packet has changed erroneously during the<br />
transmission.<br />
Community A string or password for retrieving SNMP data<br />
from a station or device.<br />
Default Gateway The preferred system for providing access<br />
outside the local subnet. A gateway is a form of Router. In<br />
order for a station to access the stations on other subnets or<br />
the Internet, it must know the address of the system that<br />
controls access, this system is the Default Gateway.<br />
Default Router The router to which a packet will be sent if<br />
no specific entry in its route table directs it elsewhere.<br />
266 <strong>Agilent</strong> <strong>FrameScope</strong> <strong>350</strong> User’s Manual
Glossary 9<br />
Glossary<br />
DHCP Dynamic Host Configuration Protocol - a procedure<br />
which allows devices that are entering or re- entering the<br />
network to request that certain parameters are automatically<br />
assigned to them. DHCP assigns a unique IP address. A<br />
device may request a subnet mask, default router address,<br />
name server address, and other parameters and addresses.<br />
DHCP server Any of several kinds of devices that provide<br />
DHCP services. These commonly include file servers and<br />
routers.<br />
Diagnostic Responder IPX echo tool (ping).<br />
DNS Domain Name Server or Domain Name Services. A<br />
capability used widely within both the Internet and<br />
corporate networks that resolves (or matches) names with IP<br />
addresses. For example, if a workstation needs to retrieve a<br />
web page from abc.com, a request containing the name<br />
abc.com is sent to a domain name server. That server, or<br />
another acting on its behalf, will respond with the IP<br />
address of the host at which the web page is stored.<br />
DNS Domain A Internet naming hierarchy such as<br />
<strong>Agilent</strong>.com<br />
Domain Controller In an NT environment, the domain<br />
controller has the responsibility for storing certain<br />
information about users, resources and devices on the<br />
network. There will be a primary domain controller and a<br />
backup domain controller. These are referred to as the PDC<br />
and BDC, respectively.<br />
E-Mail Electronic Mail - A system of sending messages and<br />
files across the network from one user to another.<br />
E-mail Server A device that stores incoming and outgoing<br />
E- mail messages. The protocol most often used for retrieving<br />
messages from the E- mail server to a user’s workstation is<br />
POP3 (Post Office Protocol #3). Conversely, the protocol<br />
most often used to send E- mail messages from the<br />
workstation to the E- mail server is SMTP (Simple Mail<br />
Transfer Protocol.) SMTP is also used in order that the<br />
source and destination E- mail servers may exchange E- mails.<br />
File Server A generic term for a device that provides files<br />
upon request. It overlaps other commonly used terms such<br />
as Novell server, NT server, and Unix server, which are more<br />
<strong>Agilent</strong> <strong>FrameScope</strong> <strong>350</strong> User’s Manual 267
9 Glossary<br />
Glossary<br />
specific because they indicate the operating system running<br />
in the file server. File servers often provide other functions<br />
such as remote access, DHCP, or security related services.<br />
Frame Data organized in bytes encapsulated with a header<br />
and a trailer containing information regarding the data.<br />
Frame and packet are sometime used interchangeably.<br />
Frame Type The format of the frame. Some examples are:<br />
SNAP/IP, SNAP/IPX, 802.3/802.2, EthernetII/IP,<br />
EthernetII/IPX, 802.3/IPX, 802.2/IPX.<br />
FTP File Transfer Protocol - Internet protocol for<br />
transferring files from one computer to another.<br />
Hop A data link through a bridge or router between<br />
stations on a network. For example: <strong>Agilent</strong>.com is 6 hops<br />
away from my PC.<br />
ICMP Internet Control Message Protocol - The IP layer<br />
protocol for handling errors and control messages.<br />
IP Internet Protocol. The protocol developed and used in<br />
the Internet. It is now used in nearly all public and private<br />
networks. It provides an addressing structure that allows<br />
relaying of packets in a manner that is logically separated<br />
from the underlying physical network. It is a connectionless,<br />
best effort protocol designed to work across dissimilar<br />
networks.<br />
IP address A four- byte address always written in decimal<br />
with each byte separated by dots. This is an address<br />
normally assigned through software and associated with a<br />
hardware address of a network interface card. It can also be<br />
associated with a resource on the network such as an SNMP<br />
agent.<br />
IPX Internetwork Packet Exchange - Novell Netware’s<br />
network layer protocol, it handles network addressing,<br />
routing and packets.<br />
Locate Using SNMP, report the switch or hub port that a<br />
station is connected to.<br />
268 <strong>Agilent</strong> <strong>FrameScope</strong> <strong>350</strong> User’s Manual
Glossary 9<br />
Glossary<br />
MAC address The unique address of each hardware<br />
component, NIC card, hub, switch, etc., on a network. These<br />
are assigned by the manufacturer of the networking<br />
equipment when the hardware is produced.<br />
MAC Loopback The process of transmitting and receiving<br />
packets at the MAC layer and reporting delay, the quantity<br />
transmitted and received as well as any errors which occur.<br />
MIB Management Information Base - A set of parameters<br />
that are available and sometimes customizable that an SNMP<br />
management station can query. Used to report status or<br />
configuration information of components of a network.<br />
Multicast A subset of a Broadcast where a packet is only<br />
delivered to a subset of all possible destinations that share a<br />
multicast address.<br />
NFS Server <strong>Network</strong> File System - A Sun Microsystems<br />
protocol allowing computers on the same network use data<br />
stored on other computers as if it were on local disks. An<br />
NFS server is usually a UNIX server.<br />
Novell server A device that provides services such as file<br />
services and print services in a network where a Novell<br />
operating system is being used.<br />
Ping A commonly used test which determines whether a<br />
device can be reached. Generally, from a command line a<br />
user types ping a.b.c.d to determine whether the<br />
device at IP address a.b.c.d can be reached. The response<br />
is often an indication of the success of the test and a time<br />
stamp designating the length of the query- response, usually<br />
in milliseconds. The ping tests reachability by sending an<br />
ICMP echo request to the destination and waiting for a<br />
reply.<br />
POP Post Office Protocol - E- mail post office protocol that<br />
allows a single user host system to connect and download<br />
E- mail.<br />
RIP Routing Information Protocol - An interior gateway<br />
protocol that allows groups of hosts on a LAN share routing<br />
information.<br />
Router A device that forwards traffic between subnets or<br />
connected networks.<br />
<strong>Agilent</strong> <strong>FrameScope</strong> <strong>350</strong> User’s Manual 269
9 Glossary<br />
Glossary<br />
RMON Remote Monitoring - Using SNMP to read or control<br />
remote probes for network monitoring and troubleshooting.<br />
SAP Request Service Advertisement Protocol - A Netware<br />
protocol for publicizing the current network address of<br />
available services.<br />
Server A computer or service that is shared among stations<br />
on the network. Any device in the network that provides<br />
services upon request.<br />
SMTP Simple Mail Transfer Protocol - The Internet<br />
electronic mail protocol used to transfer mail between hosts.<br />
SNMP Simple <strong>Network</strong> Management Protocol - A standard<br />
protocol used to manage nodes on an IP network.<br />
SNMP Agent Devices that are being managed in a network<br />
can contain an SNMP agent. A network management<br />
program or device sends a query to the agent. The agent<br />
retrieves the requested value from a database stored in the<br />
managed device and sends the reply. SNMP agents often<br />
retrieve and reply with statistics about the managed device.<br />
Examples include utilization values on ports, address tables<br />
that are stored, and vendor profiles. The protocol used to<br />
communicate the information is the Simple <strong>Network</strong><br />
Management Protocol (SNMP).<br />
Station A computer on the network.<br />
Statistics The measurement of key network parameters such<br />
as utilization, frame and protocol traffic.<br />
Subnet A portion of the network that shares a network<br />
address with other subnets.<br />
Subnet Mask A bit mask used to identify which bits in an<br />
IP address apply to the subnet.<br />
Time to live A field in an IP packet which indicates how long<br />
the packet should be allowed to exist before being discarded.<br />
Traceroute A Ping like tool that reports the number of hops<br />
to the destination as well as the time delays to each hop<br />
along the way. Traceroute is useful for locating bottlenecks<br />
in network traffic.<br />
270 <strong>Agilent</strong> <strong>FrameScope</strong> <strong>350</strong> User’s Manual
Glossary 9<br />
Glossary<br />
Type of Service A field in an IP packet that controls the<br />
quality of service that the packet requires. The internet is a<br />
“best effort” network, using the Type of Service bits, higher<br />
grades of service can be requested. If the network equipment<br />
supports better service i.e. VoIP, the better service will be<br />
provided.<br />
Unicast A frame sent to a specific single destination.<br />
UNIX server A device providing services in a network and<br />
running a version of the Unix operating system. A UNIX<br />
server is usually an NFS server.<br />
Utilization A measure of how much of the network’s<br />
bandwidth is being used. It is usually expressed as a percent<br />
of the maximum line speed in the network. For example, if<br />
the network’s current usage is at 2 Mb/sec and the<br />
bandwidth available (line speed) is 100 Mb/sec., we say the<br />
utilization is 2%.<br />
Web Browser The program running in a client host when<br />
someone is interacting with a web server. It is the software<br />
used to browse the Internet.<br />
Web Server A network server that contains files that<br />
describe Internet pages. The pages are usually developed in<br />
a language named Hypertext Markup Language (HTML). A<br />
company’s home page is an example of an HTML file that<br />
can be retrieved from a web server.<br />
WINS Server A type of name server used in the Microsoft<br />
NT environment. WINS stand for Windows Internet Name<br />
Services. It is a variation of DNS.<br />
WireScope <strong>Agilent</strong> Technologies’ category 6 / class E cable<br />
tester.<br />
<strong>Agilent</strong> <strong>FrameScope</strong> <strong>350</strong> User’s Manual 271
9 Glossary<br />
Glossary<br />
272 <strong>Agilent</strong> <strong>FrameScope</strong> <strong>350</strong> User’s Manual
INDEX<br />
A<br />
ac adapter<br />
specifications, 260<br />
ACR measurement, 247<br />
Active Discovery, 212<br />
ambient noise measurement, 247<br />
attenuation measurement, 245<br />
B<br />
Backlight, 192<br />
Backup Domain Controller test, 230<br />
Battery<br />
charging, 20<br />
indicator on DualRemote, 253<br />
Status, 190<br />
blinking hub port, 166<br />
C<br />
Cable Pairing, 157<br />
Calibration<br />
for copper tests, 85<br />
for fiber tests,method A, 124<br />
for fiber tests,method B, 125<br />
for fiber tests,method C, 126<br />
Information, 198<br />
touchscreen, 194<br />
certifying network, 165<br />
CompactFlash card<br />
configuring, 113<br />
icon, 186<br />
installing, 113<br />
slot, 10<br />
Contrast, 192<br />
copper tools menu, 163<br />
D<br />
Database<br />
network, 73, 211<br />
test, 71<br />
Date Setup, 191<br />
Default Settings, restore, 196<br />
detailed test results, viewing, 107<br />
DHCP Server test, 217<br />
DNS Server test, 219<br />
DualRemote, 252<br />
E<br />
ELFEXT measurement, 246<br />
E-mail Server test, 227<br />
Error Log, 69<br />
expert mode<br />
changing, 192<br />
copper, 146<br />
fiber, 176<br />
<strong>Agilent</strong> <strong>FrameScope</strong> <strong>350</strong> User’s Manual 273<br />
F<br />
faults, locating, 108, 111<br />
fiber length and delay, 181<br />
fiber loss meter, 180<br />
fiber NVP, learning, 182<br />
fiber power meter, 181<br />
fiber tools menu, 180<br />
fiber trace mode, 182<br />
file server tests, 222<br />
FTP server test, 230<br />
H<br />
Hub Port, blinking, 67, 166<br />
L<br />
Labeling, 156<br />
learning copper NVP, 167<br />
learning fiber NVP, 182<br />
length measurement, 244<br />
List, station, 211<br />
locating faults, 108, 111<br />
Lock, 148<br />
loss meter, fiber, 180<br />
M<br />
MAC Loopback, 54<br />
measurements, 244<br />
ACR, 247<br />
ambient noise, 247<br />
attenuation, 245<br />
ELFEXT, 246<br />
length, 244<br />
NEXT, 245<br />
power sum ACR, 247<br />
propagation delay, 245<br />
PSELEXT, 247<br />
PSNEXT, 247<br />
resistance, 247<br />
return loss, 246<br />
wiremap, 244<br />
Memory Requirements<br />
Cable test, 250<br />
<strong>Network</strong> test, 242
N<br />
<strong>Network</strong><br />
certifying, 165<br />
connecting to, 22<br />
connection, 209<br />
Limits, 154<br />
Testing Overview, 26<br />
network resources list, 28<br />
<strong>Network</strong> Tools Menu, 236<br />
NEXT measurement, 245<br />
NFS File Server test, 222<br />
Novell server test, 230<br />
NVP<br />
learning copper, 167<br />
learning fiber, 182<br />
O<br />
Operators, 193<br />
P<br />
pass/fail<br />
indicator on DualRemote, 254<br />
Ping, 38<br />
plots, viewing, 108<br />
power meter, fiber, 181<br />
power sum ACR measurement, 247<br />
Primary Domain Controller test, 230<br />
Print Server test, 230<br />
profile, 147, 150<br />
propagation delay measurement, 245<br />
PSELEXT measurement, 247<br />
PSNEXT measurement, 247<br />
R<br />
Remote Control, 240<br />
resistance measurement, 247<br />
return loss measurement, 246<br />
Router test, 230<br />
S<br />
Saving plots, 161<br />
Scroll button, 10<br />
serial baud rate, 195<br />
Site Name, 154<br />
Sleep Timeout, 192<br />
SNMP<br />
Agent test, 230<br />
Queries, 44<br />
Speaker, 192<br />
Statistics, 47<br />
Status Display, 186<br />
Storage Setup, 189<br />
Switch Ports, locating, 76<br />
System Information, 188<br />
274 <strong>Agilent</strong> <strong>FrameScope</strong> <strong>350</strong> User’s Manual 5988-7142EN<br />
T<br />
Tab<br />
cable, 17<br />
network, 16<br />
Test Limit, 152<br />
test results<br />
interpreting, 108<br />
Time Setup, 191<br />
tools menu<br />
copper, 163<br />
fiber, 180<br />
network, 236<br />
Touch Click, 192<br />
trace mode, fiber, 182<br />
Trace Route, 41<br />
Traffic Generator, 50<br />
U<br />
User Interface Setup, 192<br />
V<br />
viewing plots, 108<br />
W<br />
Web Server test, 225<br />
WINS Server test, 221<br />
wiremap measurement, 244<br />
Workstation test, 230