From Efficient Markets Theory to Behavioral Finance
From Efficient Markets Theory to Behavioral Finance
From Efficient Markets Theory to Behavioral Finance

Create successful ePaper yourself
Turn your PDF publications into a flip-book with our unique Google optimized e-Paper software.
86 Journal of Economic Perspectives<br />
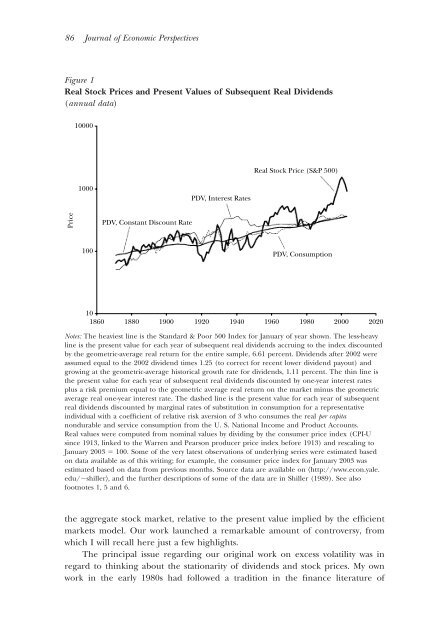
Figure 1<br />
Real S<strong>to</strong>ck Prices and Present Values of Subsequent Real Dividends<br />
(annual data)<br />
10000<br />
Real S<strong>to</strong>ck Price (S&P 500)<br />
1000<br />
PDV, Interest Rates<br />
Price<br />
PDV, Constant Discount Rate<br />
100<br />
PDV, Consumption<br />
10<br />
1860<br />
1880<br />
1900<br />
1920<br />
1940<br />
1960<br />
1980<br />
2000 2020<br />
Notes: The heaviest line is the Standard & Poor 500 Index for January of year shown. The less-heavy<br />
line is the present value for each year of subsequent real dividends accruing <strong>to</strong> the index discounted<br />
by the geometric-average real return for the entire sample, 6.61 percent. Dividends after 2002 were<br />
assumed equal <strong>to</strong> the 2002 dividend times 1.25 (<strong>to</strong> correct for recent lower dividend payout) and<br />
growing at the geometric-average his<strong>to</strong>rical growth rate for dividends, 1.11 percent. The thin line is<br />
the present value for each year of subsequent real dividends discounted by one-year interest rates<br />
plus a risk premium equal <strong>to</strong> the geometric average real return on the market minus the geometric<br />
average real one-year interest rate. The dashed line is the present value for each year of subsequent<br />
real dividends discounted by marginal rates of substitution in consumption for a representative<br />
individual with a coefficient of relative risk aversion of 3 who consumes the real per capita<br />
nondurable and service consumption from the U. S. National Income and Product Accounts.<br />
Real values were computed from nominal values by dividing by the consumer price index (CPI-U<br />
since 1913, linked <strong>to</strong> the Warren and Pearson producer price index before 1913) and rescaling <strong>to</strong><br />
January 2003 100. Some of the very latest observations of underlying series were estimated based<br />
on data available as of this writing; for example, the consumer price index for January 2003 was<br />
estimated based on data from previous months. Source data are available on http://www.econ.yale.<br />
edu/shiller, and the further descriptions of some of the data are in Shiller (1989). See also<br />
footnotes 1, 5 and 6.<br />
the aggregate s<strong>to</strong>ck market, relative <strong>to</strong> the present value implied by the efficient<br />
markets model. Our work launched a remarkable amount of controversy, from<br />
which I will recall here just a few highlights.<br />
The principal issue regarding our original work on excess volatility was in<br />
regard <strong>to</strong> thinking about the stationarity of dividends and s<strong>to</strong>ck prices. My own<br />
work in the early 1980s had followed a tradition in the finance literature of