LIQUID SCINTILLATION COUNTING
LIQUID SCINTILLATION COUNTING
LIQUID SCINTILLATION COUNTING

Create successful ePaper yourself
Turn your PDF publications into a flip-book with our unique Google optimized e-Paper software.
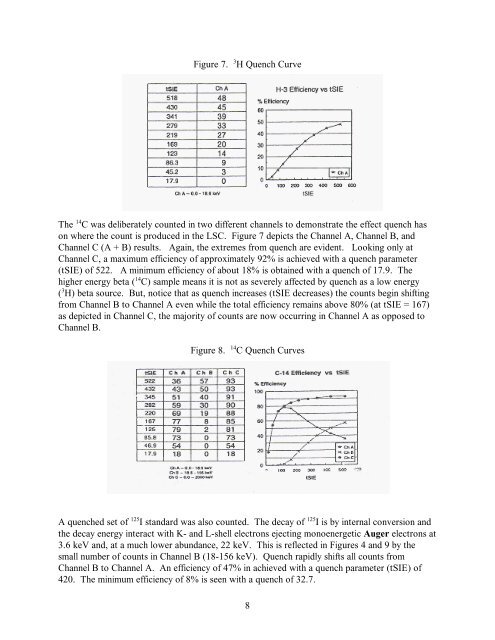
Figure 7. 3 H Quench Curve<br />
The 14 C was deliberately counted in two different channels to demonstrate the effect quench has<br />
on where the count is produced in the LSC. Figure 7 depicts the Channel A, Channel B, and<br />
Channel C (A + B) results. Again, the extremes from quench are evident. Looking only at<br />
Channel C, a maximum efficiency of approximately 92% is achieved with a quench parameter<br />
(tSIE) of 522. A minimum efficiency of about 18% is obtained with a quench of 17.9. The<br />
higher energy beta ( 14 C) sample means it is not as severely affected by quench as a low energy<br />
( 3 H) beta source. But, notice that as quench increases (tSIE decreases) the counts begin shifting<br />
from Channel B to Channel A even while the total efficiency remains above 80% (at tSIE = 167)<br />
as depicted in Channel C, the majority of counts are now occurring in Channel A as opposed to<br />
Channel B.<br />
Figure 8. 14 C Quench Curves<br />
A quenched set of 125 I standard was also counted. The decay of 125 I is by internal conversion and<br />
the decay energy interact with K- and L-shell electrons ejecting monoenergetic Auger electrons at<br />
3.6 keV and, at a much lower abundance, 22 keV. This is reflected in Figures 4 and 9 by the<br />
small number of counts in Channel B (18-156 keV). Quench rapidly shifts all counts from<br />
Channel B to Channel A. An efficiency of 47% in achieved with a quench parameter (tSIE) of<br />
420. The minimum efficiency of 8% is seen with a quench of 32.7.<br />
8