LIQUID SCINTILLATION COUNTING
LIQUID SCINTILLATION COUNTING
LIQUID SCINTILLATION COUNTING

Create successful ePaper yourself
Turn your PDF publications into a flip-book with our unique Google optimized e-Paper software.
UNIVERSITY OF WISCONSIN - MILWAUKEE<br />
ENVIRONMENTAL HEALTH, SAFETY AND RISK MANAGEMENT<br />
RADIATION SAFETY PROGRAM<br />
<strong>LIQUID</strong> <strong>SCINTILLATION</strong> <strong>COUNTING</strong><br />
Liquid scintillation counting is an analytical technique which is defined by the incorporation of the<br />
radiolabeled analyte into uniform distribution with a liquid chemical medium capable of converting<br />
the kinetic energy of nuclear emissions into light energy. Although the liquid scintillation counter<br />
is a sophisticated laboratory counting system used the quantify the activity of particulate emitting<br />
(ß and a) radioactive samples, it can also detect the auger electrons emitted from 51 Cr and 125 I<br />
samples.<br />
<strong>LIQUID</strong> <strong>SCINTILLATION</strong> PRINCIPLES<br />
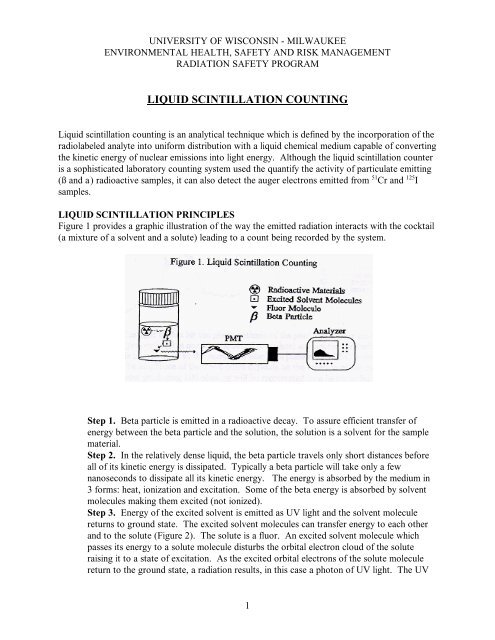
Figure 1 provides a graphic illustration of the way the emitted radiation interacts with the cocktail<br />
(a mixture of a solvent and a solute) leading to a count being recorded by the system.<br />
Step 1. Beta particle is emitted in a radioactive decay. To assure efficient transfer of<br />
energy between the beta particle and the solution, the solution is a solvent for the sample<br />
material.<br />
Step 2. In the relatively dense liquid, the beta particle travels only short distances before<br />
all of its kinetic energy is dissipated. Typically a beta particle will take only a few<br />
nanoseconds to dissipate all its kinetic energy. The energy is absorbed by the medium in<br />
3 forms: heat, ionization and excitation. Some of the beta energy is absorbed by solvent<br />
molecules making them excited (not ionized).<br />
Step 3. Energy of the excited solvent is emitted as UV light and the solvent molecule<br />
returns to ground state. The excited solvent molecules can transfer energy to each other<br />
and to the solute (Figure 2). The solute is a fluor. An excited solvent molecule which<br />
passes its energy to a solute molecule disturbs the orbital electron cloud of the solute<br />
raising it to a state of excitation. As the excited orbital electrons of the solute molecule<br />
return to the ground state, a radiation results, in this case a photon of UV light. The UV<br />
1
light is absorbed by fluor molecules which emit blue light flashes upon return to ground<br />
state. Nuclear decay events produce approximately 10 photons per keV of energy. The<br />
energy is dissipated in a period of time on the order of 5 nanoseconds. The total number<br />
of photons from the excited fluor molecules constitutes the scintillation. The intensity of<br />
the light is proportional to the beta particle’s initial energy.<br />
Figure 2. Illustration of the Collision Process<br />
Step 4. Blue light flashes hit the photo cathode of the photo multiplier tube (PMT).<br />
Electrons (proportional in number the blue light pulses) are ejected producing an electrical<br />
pulse that is proportional to the number of blue light photons. A LSC normally has two<br />
PMT’s. The amplitude of the PMT pulse depends on the location of the event within the<br />
vial. An event producing 100 photons will be represented by a larger pulse if the event is<br />
closer to the PMT than if the event is more remote. The signal from each PMT is fed into<br />
a circuit which produces an output only if the 2 signals occur together, that is within the<br />
resolving time of the circuit, approximately 20 nanoseconds (coincidence circuit). By<br />
summing the amplitude of the pulses from each PMT, an output is obtained which is<br />
proportional to the total intensity of the scintillation. This analog pulse rises to its<br />
maximum amplitude and falls to zero.<br />
Step 5. The amplitude of the electrical pulse is converted into a digital value and the<br />
digital value, which represents the beta particle energy, passes into the analyzer where it is<br />
compared to digital values for each of the LSC’s channels. Each channel is the address of<br />
a memory slot in a multi-channel analyzer which consists of many storage slots or channels<br />
concerting the energy range from 0-2000 keV.<br />
Step 6. The number of pulses in each channel is printed out or displayed on a CRT. In<br />
this manner, the sample is analyzed and the spectrum can be plotted to provide<br />
information about the energy of the radiation or the amount of radioactive material<br />
dissolved in the cocktail.<br />
2
LSC TERMINOLOGY<br />
Chemiluminescence<br />
Chemical<br />
Quenching<br />
Cocktail<br />
Compton<br />
Scattering<br />
CPM<br />
Discriminator<br />
DPM<br />
Efficiency<br />
Fluor<br />
Fluorescence<br />
Luminescence<br />
Random single photon events which are generated as a result of the<br />
chemical interaction of the sample components. Except at high rates, most<br />
chemiluminescence events are excluded by the coincidence circuit.<br />
A reduction in the scintillation intensity seen by the photomultiplier tubes<br />
due to materials present in the scintillation solution that interfere with the<br />
processes leading to the production of light. The result is fewer photons<br />
per keV of beta particle energy and usually a reduction in counting<br />
efficiency.<br />
The scintillation fluid; a mixture of 3 chemicals (solvent, emulsifier, and<br />
fluor) which produces light flashes when it absorbs the energy of<br />
particulate radioactive decay.<br />
Elastic scattering of photons (x/-rays) by electrons. In each such process<br />
the electron gains energy and recoils and the photon loses energy. This is<br />
one of the three ways photons lose energy upon interacting with matter,<br />
and is the usual method with photons of intermediate energy and materials<br />
of low atomic number. Named for Arthur H. Compton, the American<br />
physicist who discovered it in 1923.<br />
Counts per minute. This is the number of light flashes or counts the LSC<br />
registered per minute. The number of decays produced by the radioactivity<br />
is usually more than the number of counts registered.<br />
An electronic circuit which distinguishes signal pulses according to their<br />
pulse height or voltage. It is often used to exclude noise or background<br />
radiation counts.<br />
Disintegration per minute. The sample’s activity in units of nuclear decays<br />
per minute.<br />
The ratio, CPM/DPM, of measured counts to the number of decays which<br />
occurred during the measurement time.<br />
A chemical component of the liquid scintillation cocktail that absorbs the<br />
UV light emitted by the solvent and emits a flash of blue light.<br />
The emission of light resulting from the absorption of incident radiation and<br />
persisting only as long as the stimulating radiation is continued.<br />
A general term applied to the emission of light by causes other than high<br />
temperature.<br />
3
Optical<br />
Quenching<br />
PMT<br />
Phosphor<br />
Photoluminescence<br />
Pulse<br />
Quenching<br />
QIP<br />
Secondary<br />
Scintillator<br />
Solvent<br />
A reduction in the scintillation intensity seen by the photomultiplier tubes<br />
due to absorption of the scintillation light either by materials present in<br />
scintillation solution or deposited on the particle energy and usually a<br />
reduction in counting efficiency.<br />
The Photo-Multiplier Tube is an electron tube that detects the blue light<br />
flashes from the fluor and converts them into an electrical pulse.<br />
A luminescent substance or material capable of emitting light when<br />
stimulated by radiation.<br />
Delayed and persistent emission of single photons of light following<br />
activation by radiation such as ultraviolet.<br />
Electrical signal of the PMT; its size is proportional to the radiation energy<br />
absorbed by the cocktail.<br />
Anything which interferes with the conversion of decay energy emitted<br />
from the sample vial into blue light photons. This usually results in<br />
reduction in counting efficiency.<br />
The Quenching Index Parameter is a value that indicates the sample's level<br />
of quenching. Another parameter that describes the amount of quenching<br />
present is the transformed Spectral Index of External Standard (tSIE) or<br />
"H" number.<br />
Material in the scintillation cocktail which absorbs the emitted light of the<br />
primary scintillator and remits it at a longer wavelength, nearer the<br />
maximum spectral sensitivity of the photomultiplier tubes. It is added to<br />
improve the counting efficiency of the sample.<br />
A chemical component of the liquid scintillation cocktail that dissolves the<br />
sample, absorbs excitation energy and emits UV light which is absorbed by<br />
the fluors.<br />
LSC EXTERNAL SETTINGS<br />
LSC’s come in a variety of shapes and types and manufacturers may use different terminology,<br />
however, the following basic external controls are commonly found on most systems.<br />
Gain<br />
A control used to adjust the height of the signal received by the detecting system.<br />
The gain control for newer LSC’s is often automatically set for the particular<br />
radionuclide selected.<br />
4
LLD<br />
ULD<br />
The lower level discriminator setting is used to discriminate against (i.e., not<br />
count) betas with energy below that setting. This setting is also used to decrease<br />
system noise which often occurs in the region below 3 keV.<br />
The upper level discriminator setting is used to discriminate against any beta<br />
energy higher than that setting.<br />
A particular LSC may have other external controls depending on the counter type and model.<br />
Read the instruments operating manual to gain familiarity with the controls and operating<br />
characteristics.<br />
CONSIDERATIONS IN ISOTOPIC ANALYSIS<br />
The beta particle must have sufficient energy to produce at least 2 photons in the cocktail and one<br />
must interact with each PMT. Below a few keV of energy the yield of photons, under ideal<br />
conditions, is 7-8 photons per keV. The photo cathode of the PMT is not 100% efficient. The<br />
conversion efficiency from a photon to a photoelectron is only about 30%. The coincidence<br />
threshold occurs below 1 keV.<br />
The use of LSC for alpha emitters is attractive because it offers counting efficiencies of 100% and<br />
simplicity of sample preparation. Most alpha radionuclides emit high-energy particles in the range<br />
of 4 - 6 MeV. A characteristic property of alpha particle interaction with liquid scintillation media<br />
is a low scintillation or photon yield as compared to beta or even gamma emitters (light yield is<br />
about a factor of 10 lower). Almost all the kinetic energy associated with an alpha emission is<br />
given up to the media in a relatively short distance. The relative scintillation yield from this<br />
depends upon specific ionization potentials. The higher the specific ionization potentials, the<br />
lower the relative photon yield. Result is poor alpha radionuclide energy resolution. Even<br />
though alpha emission is monoenergetic, the pulse height distributions are broad (Figure 3).<br />
Figure 3. Alpha Spectrum of 241 Americium<br />
5
The organic scintillators used in LSC’s have a lower gamma ray absorption coefficient than<br />
inorganic (NaI) scintillators. The photoelectric effect is small when E > 300 keV and Compton<br />
scattering becomes the main absorption process. The pulse thus depends upon gamma energy.<br />
For E < 20 keV, the photoelectric effect in which all gamma energy transferred to a single<br />
electron, predominates. For 20 keV < E < 100 keV, both the photoelectric and Compton effects<br />
contribute. And, for 100 keV < E < 3000 keV, the Compton effects predominates. But for 125 I,<br />
counting efficiency can be as high as 76% in a typical emulsifier type LSC (Figure 4).<br />
Figure 4. Spectrum Plot of 125 I Using LSC<br />
QUENCH<br />
Quench is a reduction in system efficiency as a result of energy loss in the liquid scintillation<br />
solution. Because of quench, the energy spectrum detected from the radionuclide appears to shift<br />
toward a lower energy (Figure 5). The three major types of quench encountered are photon,<br />
chemical, and optical quench. Photon quenching occurs with the incomplete transfer of beta<br />
particle energy to solvent molecules. Chemical, sometimes called impurity, quenching causes<br />
energy losses in the transfer from solvent to solute. Optical or color quenching causes the<br />
attenuation of photons produced in solute.<br />
Figure 5. Effect of Quenching on an Energy Spectrum<br />
6
Chemical quenching absorbs beta energy before it is converted to photons while color quenching<br />
results from the passage of photons through the medium. Color quenching depends on the color<br />
of the interfering chemical and path length that the photon must travel (Figure 6). In a chemically<br />
quenched sample, all energy radiations appear to be equally affected whereas, for a colored<br />
sample, events that take place close to one PMT will give rise to a large pulse and a smaller pulse<br />
in the other PMT. By summation, the pulses are added so the resultant pulse height may be as<br />
large as from unquenched, only the # of events will be significantly reduced. Thus, at equal<br />
quench levels, the pulse height of colored samples are spread over a wider range than chemical<br />
quench samples.<br />
Figure 6. Chemical vs Color Quench<br />
Because quench affects the efficiency of sample detection, quench could have a significant impact<br />
on your LSC results. To better understand the importance of quench on your work note these<br />
three different quench curves and the resulting efficiencies. These quench standards were counted<br />
on a Packard 1900 LSC at the University of Wisconsin - Madison. On a different system it is<br />
likely that the quench numbers and resultant efficiencies will be a little different, but not the<br />
general effects of quench. The Packard allows the user to select keV regions of interest. For this<br />
demonstration the three channels selected were: Channel A, 0.0 - 18.7 keV, Channel B 18.6 - 156<br />
keV, and Channel C 0.0 - 2000 keV.<br />
Two of the standards counted were 3 H (Figure 7) and 14 C (Figure 8). Channel A encompassed<br />
the entire energy region for 3 H. Channel B was selected as a region from the top of Channel A to<br />
the maximum possible energy of 14 C, 156 keV. Channel C was selected as the entire region (up<br />
to 2000 keV).<br />
The 3 H results are shown in Figure 7. Note the extremes of values for the quenching parameter<br />
(tSIE). A maximum efficiency of approximately 48% is achieved with a quench parameter (tSIE)<br />
of 518. The minimum efficiency of 0.33% is obtained with a quench of 17.9. Thus a quench of 45<br />
or below would result in essentially background counts (efficiency ~ 3%).<br />
7
Figure 7. 3 H Quench Curve<br />
The 14 C was deliberately counted in two different channels to demonstrate the effect quench has<br />
on where the count is produced in the LSC. Figure 7 depicts the Channel A, Channel B, and<br />
Channel C (A + B) results. Again, the extremes from quench are evident. Looking only at<br />
Channel C, a maximum efficiency of approximately 92% is achieved with a quench parameter<br />
(tSIE) of 522. A minimum efficiency of about 18% is obtained with a quench of 17.9. The<br />
higher energy beta ( 14 C) sample means it is not as severely affected by quench as a low energy<br />
( 3 H) beta source. But, notice that as quench increases (tSIE decreases) the counts begin shifting<br />
from Channel B to Channel A even while the total efficiency remains above 80% (at tSIE = 167)<br />
as depicted in Channel C, the majority of counts are now occurring in Channel A as opposed to<br />
Channel B.<br />
Figure 8. 14 C Quench Curves<br />
A quenched set of 125 I standard was also counted. The decay of 125 I is by internal conversion and<br />
the decay energy interact with K- and L-shell electrons ejecting monoenergetic Auger electrons at<br />
3.6 keV and, at a much lower abundance, 22 keV. This is reflected in Figures 4 and 9 by the<br />
small number of counts in Channel B (18-156 keV). Quench rapidly shifts all counts from<br />
Channel B to Channel A. An efficiency of 47% in achieved with a quench parameter (tSIE) of<br />
420. The minimum efficiency of 8% is seen with a quench of 32.7.<br />
8
Figure 9. 125 I Quench Curves<br />
The point of this discussion: Quench is important. You must understand the impact of quench<br />
and how the system you are using represents it if you want to obtain viable results. Quench<br />
calibration delimits the valid ranges for quantifying a sample. Samples with quench numbers<br />
outside the calibration range will raise a flag which indicates the value is out of range. The<br />
conversion to dpm will be made, but will be an extrapolation from the highest/lowest recorded<br />
quench value.<br />
CHEMILUMINESCENCE/PHOTOLUMINESCENCE<br />
Luminescence is a single photon event and is registered as a count due to the probability of having<br />
coincidence events at high luminescence activity. Although LSC’s employ a coincidence circuit,<br />
luminescence events stimulate each PMT within the resolving time of the coincidence circuits.<br />
Chemiluminescence is the production of light as a result of a chemical reaction between<br />
components of the scintillation sample in the absence of radioactive material. This most typically<br />
occurs when samples of alkaline pH and/or samples containing peroxides are mixed with<br />
emulsifier-type scintillation cocktails, when alkaline tissue solubilizers are added to emulsifier type<br />
scintillation cocktails, or when oxidizing agents are present in the sample. Reactions are usually<br />
exothermic and result in the production of a large number of single photons. Photoluminescence<br />
results in the excitation of the cocktail and/or vial by UV light (e.g., exposure to sunlight or UV<br />
lights). Chemiluminescence has a relatively slow decay time (from 0.5 hr to > 1 day depending on<br />
the temperature) while photoluminescence decays more rapidly (usually < 0.1 hr).<br />
The luminescence spectrum has a pulse height distribution which overlaps the 3 H spectrum. The<br />
maximum pulse height corresponds to approximately 6 keV and the spectrum is (chemical)<br />
quench independent. The equivalent of a few keV of beta particle energy, the maximum number<br />
of events will occur between 0 and 2 keV and remain there independent of quenching. Contrary<br />
to popular belief, cooling the luminescent scintillation samples reduces the photon intensity to low<br />
levels, but interference is still present and provides false indication of luminescence control.<br />
9
STATIC ELECTRICITY<br />
Static electricity on liquid scintillation vials is a single photon event with pulse height limited to<br />
about 10 keV. Many items used in the liquid scintillation counter environment are conducive to<br />
the development of static charges. In general, glass vials have less problems with static than<br />
plastic vials; small vials in adapters are particularly prone to static charge build up. Most systems<br />
offer an option which employs a static charge device or and electrostatic controller.<br />
SAMPLE VOLUME/DUAL PHASE SAMPLES<br />
As the sample volume decreases, light output falls on less efficient areas of the PMT, so energy<br />
detection becomes less efficient with low volumes. When 2 phases are present, each phase will<br />
have its own counting efficiency.<br />
CALIBRATION OF LSC<br />
LSC efficiency depends on the degree of quenching, the nature of the sample, the scintillator used<br />
and the preparation method. Not all particulate (a,ß) radiations are detected equally well by the<br />
LSC. Usually the higher the beta particle energy the higher the efficiency of the counter. To use<br />
the system’s efficiencies for dpm calculation, a particular LSC counter must first be calibrated for<br />
the type of sample that it will analyze. Although there are several methods by which LSCs can be<br />
calibrated, the external standard method described below is the most widely used method of<br />
efficiency calibration.<br />
C<br />
A 10 vial standard set (Figure 10) each containing the same amount of radioactivity (i.e.,<br />
dpm) but mixed with increasing amounts of a quenching agent (e.g., nitromethane, C-Cl 4 )<br />
is used. Quenching agents absorb the radiation energy and, instead of emitting a pulse of<br />
UV light, they radiate infrared so the fluors do not get excited. Thus, the more quenched<br />
the sample, the fewer the counts detected in the desired channel. The reduced amount of<br />
light emitted per radiation energy absorbed usually results in a shifting of the spectrum to<br />
lower channels.<br />
Figure 10. Set of 3 H Quenched Standards<br />
Each vial contains 194,433 dpm -- 3 H<br />
10
Table 1. Typical LLD, ULD and Gain Values<br />
Isotope<br />
LLD (keV)<br />
ULD (keV)<br />
Max Energy Optimum Max Energy Optimum<br />
Beckman # 1 Gain 2<br />
3 H 0 0 18.6 12 400 50%<br />
14 C 0 12 156 156 670 6%<br />
32 P 0 5 1700 1700 1000 2%<br />
1<br />
The LLD and ULD can be set using keV or channel controls. The configuration of Beckman LSC’s uses channel<br />
controls and the corresponding channel numbers are listed.<br />
2<br />
The gain control for newer LSC’s is automatically set<br />
C<br />
C<br />
C<br />
The quenched standards are placed into a LSC tray which is then placed into the LSC. Set<br />
the LLD, ULD (or channel # for Beckman LSCs) and Gain as appropriate (Table 1), and<br />
initiate counting. Note that for statistical reasons, the ULD for 3 H is usually set to a lower<br />
value than the endpoint of the 3 H spectrum.<br />
The number of counts registered (cpm) for each standard vial and the amount of sample<br />
quench (QIP) are determined by the counter and printed out.<br />
Because all standards contain the same amount of activity, the efficiency, the ratio<br />
cpm/dpm, of the counter for each of the various levels of quenching can be plotted as in<br />
the graph in Figure 6.<br />
SAMPLE ACTIVITY “DPM” DETERMINATION<br />
C Count your samples, the counts per minute and the quench level are printed out for each<br />
sample.<br />
C Look up the efficiency for each sample at its quench level from the calibration curve<br />
(Figure 6).<br />
C To determine the activity (dpm) from the reported counts per minute (cpm), divide the<br />
number of counts by the efficiency (i.e., dpm = cpm/eff). Most new counters, if set up<br />
properly, will perform this calculation for you for 1 or 2 isotopes. If dual label dpm<br />
calculation is required a quenched standard set for each isotope must be run and that data<br />
stored in the counter.<br />
OPERATING PROCEDURES FOR LS COUNTERS<br />
C Read the instruments operating manual to gain familiarity with the controls and operating<br />
characteristics of the machine.<br />
C Place samples into LSC vials and add the correct amount of liquid scintillation cocktail<br />
(e.g., 5, 10, 15 or 20 ml, as appropriate). Include a background vial which contains<br />
scintillation cocktail and a non-radioactive sample similar in make-up (e.g., geometry) to<br />
your radioactive samples.<br />
11
C<br />
C<br />
C<br />
C<br />
Place your sample vials with background vial into the LSC tray (or belt) and place into the<br />
LSC.<br />
Set count time, noting that shorter count times give poor counting statistics.<br />
Set your LLD, ULD, and Gain as appropriate and begin your counting.<br />
Unless the counter is programed to calculate dpm you will need to calculate the true<br />
radioactivity of the sample in units of dpm by dividing the sample cpm by the counter<br />
efficiency for that energy of the sample (i.e., dpm = cpm/eff). As previously discussed, the<br />
counter efficiency may be different for different vials depending on the amount of<br />
quenching present.<br />
BECKMAN LSC CONSIDERATIONS<br />
All LSCs operate in the same manner, but different manufacturers may use different terminology<br />
or offer more options than others. Some systems allow the user to select the regions of interest<br />
by selecting a keV range of interest. Others offer several options (channel or keV). Most of the<br />
comments made so far apply to Packard style counting systems, where the user selects the energy<br />
regions. The channels correspond to energy in 0.5 keV increments; that is, the 4000 channels are<br />
each ½keV wide, so the system can detect energies from 1-2000 keV.<br />
If you are using a Beckman counting system, usually the channel option is the default option for<br />
the window setting. Beckman counting systems have 1000 channels and the energy is related to<br />
the equation:<br />
Channel # = 72 + 280 log 10 (E max )<br />
where E max is in keV. Thus the ULD channel settings on a Beckman LSC to detect the maximum<br />
possible beta energy for 3 H, 14 C/ 35 S and 32 P would be approximately 400, 670 and 1000<br />
respectively.<br />
CERENKOV <strong>COUNTING</strong><br />
Some beta emitting isotopes can be analyzed on an LSC without using any cocktail. The<br />
liturature of several manufacturer’s discusses counting high energy (E max > 800 keV) beta emitters<br />
without cocktail or with only a little water, using a technique called Cerenkov counting.<br />
When high energy beta particles travel faster than the speed of light relative to the medium they<br />
are traversing (e.g., water, etc.) Cerenkov radiation (i.e., light) is produced. Cerenkov radiation is<br />
the blue light that you see when you look into a reactor pool. Cerenkov radiation allow some<br />
beta emitting radionuclides to be analyzed with a liquid scintillation counter without using any<br />
cocktail. For Cerenkov radiation to be produced, the beta particle must exceed a minimum<br />
threshold energy (E th ) which is calculated by:<br />
E th = 511 n - 511<br />
% n 2 - 1<br />
In this equation, 511 is the rest mass of an electron in keV and n is the refractive index of the<br />
medium (i.e., n glass = 1.5, n water = 1.33). Consider, for example, using water instead of cocktail.<br />
12
Then, for water, E th = 263 keV. If you were counting filter papers in glass vials, then E th = 175<br />
keV.<br />
Given these energy constraints, 32 P, 36 Cl and 90 Sr/ 90 Y have sufficient energy to be analyzed using<br />
Cerenkov counting. From a practical point of view, the only beta emitting radionuclide likely to<br />
be analyzed by Cerenkov counting is 32 P which emits a beta particle with E max = 1710 keV.<br />
Because beta particles are emitted in a spectrum of energies, approximately 86% of the 32 P beta<br />
particles have energies exceeding E th = 263 keV for counting in water. With proper LSC<br />
adapters, researchers could directly analyze their samples in 0.5 and 1.5 ml microfuge tubes.<br />
Consider an example of Cerenkov counting of a 32 P labeled compound that a laboratory counted.<br />
The lab used 5 mCi in a 10 ml aliquot of [alpha-P-32]UTP. The radioactive sample was placed in<br />
a 20 ml glass vial and counted with various quantities of water added (Table 2). The samples<br />
were counted at ambient tempurature using a Packard system with the counting window/region<br />
set at 5 - 1700 keV. The activity used was estimated by counting an identical sample in LSC<br />
cocktail and assuming 90% efficiency. As seen from Table 2, counting 32 P in a 20 ml glass vial,<br />
with 4 -12 ml of added water gives optimum efficiency. However, note that relatively good<br />
efficiencies were obtained for all samples. Typically the counting efficiency of 32 P in 4 -12 ml of<br />
water is expected to be approximately 40 - 50% compared to the efficiency obtained by using<br />
LSC cocktail for the same 32 P sample of nearly 100%.<br />
Table 2. Cerenkov Efficiencies<br />
mm water<br />
% efficiency<br />
0 30.8<br />
1 42.2<br />
2 44.1<br />
4 48<br />
8 46.8<br />
12.8 46.9<br />
16 46.3<br />
As with any counting method, Cerenkov counting has advantages and disadvantages. Advantages<br />
include simple sample preparation, (i.e., only add water, the volume is not too critical), less<br />
expensive (i.e., no LSC cocktail employed), and waste can be treated as solid if no water was<br />
used or as aqueous if water was used. Disadvantages include lower efficiency, higher color<br />
quench, volume dependence (particularly if using less than 2 ml of water), and medium<br />
dependence (e.g., glass/plastic vials, water, air, etc.)<br />
13
The biggest factor preventing universal use of Cerenkov counting is beta energy. In order to<br />
achieve adequate efficiency, the average beta energy (E ave .aE max ) must be greater than the<br />
required threshold energy, E th . Thus, from a practical point of view, this criteria limits Cerenkov<br />
counting to beta emitters with maximum energies greater than 1 MeV. The only commonly used<br />
radionuclide fitting this criteria is 32 P.<br />
References<br />
Beckman Instruments, LS 1801, 3801, 5801 Series Liquid Scintillation Systems Operating<br />
Manual, 1985.<br />
Packard Instrument Company, Liquid Scintillation Analysis; Science and Technology, Rev. C,<br />
1986.<br />
Packard Instrument Company, Tri-Carb Liquid Scintillation Analyzers: Models 2100TR/2300TR,<br />
Operations Manual, 1995.<br />
University of Wisconsin - Madison, Radiation Safety for Radiation Workers Handbook, 1998.<br />
14