Panel Threshold Effect Analysis between Capital Structure and ...
Panel Threshold Effect Analysis between Capital Structure and ...
Panel Threshold Effect Analysis between Capital Structure and ...

Create successful ePaper yourself
Turn your PDF publications into a flip-book with our unique Google optimized e-Paper software.
<strong>Panel</strong> <strong>Threshold</strong> <strong>Effect</strong> <strong>Analysis</strong> <strong>between</strong> <strong>Capital</strong> <strong>Structure</strong><br />
<strong>and</strong> Operating Efficiency of Chinese Listed Companies<br />
Chien-Chung Neih, Ph.D. *<br />
Tamkang University<br />
Lihong Lu<br />
Renmin University of China<br />
Abstract<br />
This paper, aiming to test whether there exists an optimal debt ratio, employs panel<br />
threshold regression model to examine threshold effects of financial leverage on<br />
operating efficiency (<strong>and</strong> firm value) of Chinese listed firms. The findings are that<br />
there exists triple threshold effect <strong>and</strong> the coefficients are all positive <strong>and</strong> significant<br />
for four regimes. These results identify that the operating efficiency is positively<br />
related to debt level. However, the positive effect decreases when debt ratio increases<br />
since the results show that the lower the debt to asset ratio, the higher the impact<br />
coefficient. Our result is consistent with ‘Trade-off Theory of <strong>Capital</strong> <strong>Structure</strong>’ <strong>and</strong><br />
‘Agency Theory’ <strong>and</strong> provides an implication that financial managers should use<br />
financial leverage wisely to improve the operating efficiency in order to maximize the<br />
firm value <strong>and</strong> investors should refer to the debt ratio to make investment decisions.<br />
As corporate bond market hasn’t been well developed in China <strong>and</strong> firm’s debt<br />
financing mainly depends on commercial banks, our result is helpful for loan<br />
managers in banks.<br />
Keywords: <strong>Capital</strong> structure, Financial leverage, Debt financing, Operating efficiency,<br />
<strong>Panel</strong> threshold effect<br />
* Corresponding author: Department <strong>and</strong> Graduate Institute of Banking <strong>and</strong> Finance, Tamkang<br />
University, Taipei, Taiwan. TEL: 886 - 2-26215656 ext. 2591. FAX: 886-2-26214755. E-mail:<br />
niehcc@mail.tku.edu.tw.
1. Introduction<br />
1.1 <strong>Capital</strong> <strong>Structure</strong> Theories<br />
How can we get stable financing sources <strong>and</strong> minimize the capital cost How can we<br />
run our business everlastingly <strong>and</strong> maximize the shareholders’ wealth Financing<br />
strategy is always the most important decision for financial managers. Generally<br />
speaking, sources of corporate financing mainly come from equity <strong>and</strong> debt securities.<br />
The firm’s mix of different securities is know as capital structure. How to find the best<br />
combination that maximizes the firm value is the objective of capital structure<br />
theories.<br />
Modigliani <strong>and</strong> Miller (1958)’s ‘capital structure irrelevance theory’ states that the<br />
firm’s overall market value <strong>and</strong> the WACC is independent of capital structure in a<br />
perfect market without taxation. However, the free-tax perfect market doesn’t hold in<br />
the real world. Modigliani <strong>and</strong> Miller(1963) proposed the modified ‘<strong>Capital</strong> structure<br />
relevance theory’, which analyzed the present value of interest tax shields at the<br />
corporate level <strong>and</strong> found that ‘the higher the debt ratio, the higher the firm value’.<br />
Miller (1977) extends the MM model to personal as well as corporate taxes, <strong>and</strong><br />
introduced the ‘Miller theory’, which considered the relative tax advantage of debt<br />
over equity.<br />
Nevertheless, over borrowing will lead to financial distress <strong>and</strong> even bankruptcy. ‘The<br />
trade-off theory’ balances the tax advantage of borrowing against the costs of<br />
financial distress <strong>and</strong> states there exists the optimal capital structure. The value of the<br />
firm with borrowing equals the value if all-equity –financed plus the present value of<br />
tax shield <strong>and</strong> minus the present value of costs of financial distress. Costs of financial<br />
distress can be broken down to bankruptcy costs <strong>and</strong> costs of financial distress short<br />
of bankruptcy. Bankruptcy costs include direct costs such as court fees <strong>and</strong> indirect<br />
costs reflecting the difficulty of managing a company undergoing the liquidation or<br />
reorganization. In financial stress short of bankruptcy, conflicts of interest <strong>between</strong><br />
bondholders <strong>and</strong> stockholders may lead to poor operating <strong>and</strong> investment decisions.<br />
Jensen <strong>and</strong> Meckling(1976) analyze the agency costs led by the conflicts of interest<br />
among managers, shareholders <strong>and</strong> creditors during a financial stress <strong>and</strong> their<br />
implication for financing policy. Jensen (1986) finds that managers of firms with<br />
unused borrowing power <strong>and</strong> large free cash flows are more likely to undertake<br />
low-benefit or even value-destroying mergers so higher debt ratio can reduce agency<br />
cost <strong>and</strong> increase firm value.<br />
Ross(1977) proposed ‘the signaling theory’, which states that ‘Information<br />
1
Asymmetry’ exists <strong>between</strong> managers <strong>and</strong> investors so the increase of debt ratio will<br />
be taken as a positive signal to the investors <strong>and</strong> hence increase the firm value. Myers<br />
<strong>and</strong> Majluf(1984) proposed ‘the pecking-order theory’, which states that firms use<br />
internal financing when available <strong>and</strong> choose debt over equity when external<br />
financing is required. After that, Lakshimi <strong>and</strong> Myers(1999) <strong>and</strong> Chirinko <strong>and</strong><br />
Anuja(2000) tested static tradeoff against pecking order theory.<br />
Scholars have done a lot of research about the determinants of capital structure choice.<br />
Kim <strong>and</strong> Sorensen (1986) find that firms with higher insider ownership have greater<br />
debt ratios than firms with lower insider ownership. They also find that high-growth<br />
firms use less debt rather than more debt, high-operating firms use more debt rather<br />
than less debt, <strong>and</strong> firm size appears to be uncorrelated to the level of debt. Titman<br />
<strong>and</strong> Wessels(1988) state that the short-term debt ratio has a negative relationship with<br />
the firm size. Bergman <strong>and</strong> Callen (1991) states there exists negative relationship<br />
<strong>between</strong> the ratio of intangible assets to total assets <strong>and</strong> the debt ratio. Burgman(1996)<br />
states that the multinational corporate capital structure was influenced by political risk,<br />
foreign exchange rate risk <strong>and</strong> high agency cost. Erwan (2001) studies the relationship<br />
<strong>between</strong> asset liquidity <strong>and</strong> capital structure.<br />
The empirical research on the optimal capital structure includes: Castanias (1983)<br />
finds that ex ante default costs are large enough to induce the typical firm to hold an<br />
optimum mix of debt <strong>and</strong> equity. Br<strong>and</strong>ley, et al. (1984) developed a theoretical model<br />
which highlights three firm-specific factors that influence the firm’s optimal capital<br />
structure: the variability of firm value, the level of non-debt tax shields, <strong>and</strong> the<br />
magnitude of the costs of financial distress. In the paper, Br<strong>and</strong>ley, et al examines<br />
cross-sectional data <strong>and</strong> finds that firm leverage ratios are related inversely to<br />
earnings volatility. Altman(1984) compares the present value of expected bankruptcy<br />
costs with the present value of expected tax benefits from interest payments on<br />
leverage <strong>and</strong> concludes that the potential impact of bankruptcy costs on firm valuation<br />
<strong>and</strong> capital structure issues is very important. Lel<strong>and</strong> <strong>and</strong> Toft(1996) examine the<br />
optimal capital structure of a firm that can choose both the amount <strong>and</strong> maturity of its<br />
debt. They find that short term debt does not exploit complete tax benefits but reduces<br />
agency cost compared to long term debt so the tax advantage of debt must be<br />
balanced against bankruptcy <strong>and</strong> agency costs in determining the optimal maturity of<br />
the capital structure. Philosophov (1999) develops a probabilistic Bayesian approach<br />
to assess the optimal debt to equity ratio, which affects both corporate returns <strong>and</strong><br />
probabilities of bankruptcy to maximize the corporate value. Erik(2002) examines the<br />
debt ratios around the tender offers, <strong>and</strong> finds that the debt ratio may have to be<br />
2
higher than optimal as predicted by the static trade-off model, in which tax benefits<br />
are traded off against financial distress costs in order to effectively deter takeovers.<br />
However, there are still empirical evidences to support ‘<strong>Capital</strong> <strong>Structure</strong> Irrelevance<br />
Theory’. Flath <strong>and</strong> Knoeber (1980) finds that cross-sectional variation in capital<br />
structure was best explained by differences in operating risk, including that related to<br />
the regulatory process, <strong>and</strong> not by inter-industry differences in the tax advantage to<br />
interest, which were quite small. The general increase in interest as a percentage of<br />
EBIT that occurred <strong>between</strong> the earlier <strong>and</strong> later periods, was strongly related to the<br />
very great temporal increase in the tax advantage to interest that occurred <strong>between</strong> the<br />
two periods.<br />
1.2 Chinese Stock Market <strong>and</strong> Financing Behavior of Listed Firms<br />
There are two stock markets in China. One is Shanghai Stock Market; the other is<br />
Shenzhen Stock Market. They were established in 1990 <strong>and</strong> 1991 respectively. The<br />
establishment of stock markets was the dem<strong>and</strong> of the economy reform. Open market<br />
brought severe competition <strong>and</strong> SOEs 1 began to lose money. State owned banks<br />
encountered non-performing loans problems, operational difficulties <strong>and</strong> high risks,<br />
which cannot meet SOEs financing needs. One purpose of the establishment of stock<br />
markets is to stimulate the reform of SOEs. Therefore, most listed firms are SOEs,<br />
which have great influences on local economy. Having been used to get supporting<br />
from the government, managers of SOEs have no idea about the cost of capital. This<br />
free cash mentality is also related to the high uncertainty of transitional economy. In a<br />
trail-<strong>and</strong>-error process of economic reform, people cannot predict future according to<br />
their experiences. Having no clear expectations about the future, they tend to take into<br />
consideration only current cost <strong>and</strong> benefit in decision-making.<br />
The development of the stock market is under strict regulation of the government.<br />
These regulations include quota restrictions <strong>and</strong> authorization system. Authorization<br />
system means that firms can go public only with the approval from the government.<br />
The quota system restricts the shares can be issued by a listed firm. Furthermore,<br />
government also restricts the issuing price. 2 As a result, going public is peculiar right<br />
1 SOEs: State Owned Enterprises<br />
2 Prior to Dec. 1996, quota system restricts the amount of shares can be issued in each province. The<br />
local government of province chooses the SOEs to go public, <strong>and</strong> report to CSRC for approval. In order<br />
to increase the number of firms to be listed, the local government always limits the size of the assets<br />
going public. In Dec. 1996, the quota system changed to restrict the number of firms to be listed.<br />
Restrictions on issuing price is based on a predetermined range of P/E, which is 15 to 20. The<br />
authorization system ceased to be effective in 2000. Restrictions on issuing price were also canceled in<br />
2002.<br />
3
to lucky firms. On the other side, corporate bond market has not been well developed<br />
which makes issuing corporate bonds very difficult for firms. All in all, Chinese firms<br />
have limited financing sources <strong>and</strong> access to stock market is a scarce resource.<br />
Free cash mentality, limited financing resources induce the epidemic of ‘the thirst of<br />
capital’. We can find many symptoms of the epidemic, such as, many firms provide<br />
rights offering shortly after IPO, a lot of the money raised in listed firms is left unused,<br />
firms manipulate earnings in every way to meet the qualification of rights offering<br />
<strong>and</strong> etc. Referring to the capital structure, the debt ratio of Chinese listed firms is<br />
relatively low.<br />
Though the long term ignores of capital cost <strong>and</strong> debt financing, Chinese listed firms<br />
should pay more attention to their capital structure <strong>and</strong> financing behavior. With the<br />
development of capital market, with the mature of investors, with the reform of<br />
Chinese government, if listed firms still pay no attention the capital cost <strong>and</strong> capital<br />
structure, they will be beaten in the open <strong>and</strong> severe competition. Chinese listed firms<br />
should find their optimal capital structure to reduce cost of capital <strong>and</strong> maximize firm<br />
value. Compared to equity financing, debt financing can bring tax shield to reduce the<br />
cost of capital. What’s more, increasing of debt financing can reduce agency cost <strong>and</strong><br />
improve corporate governance. For Chinese investors, debt financing is a positive<br />
signal. Thus I predict debt financing can improve firm’s operating efficiency.<br />
However, on the other side, over borrowing can lead to financial distress <strong>and</strong> even<br />
bankruptcy. Hence, firms should carefully trade off costs <strong>and</strong> benefits of debt<br />
financing <strong>and</strong> find optimal debt ratio. This paper intends to examine the relationship<br />
<strong>between</strong> debt financing <strong>and</strong> operating efficiency.<br />
Chinese scholars have done some empirical research about the relationship <strong>between</strong><br />
the capital structure <strong>and</strong> firm value. Wang (2003) applied multiple regression analysis<br />
<strong>and</strong> concluded that debt financing has positive impact on firm value. Nevertheless,<br />
when I used the same method but different sample, completely different result is<br />
found. Accordingly, I thought it is better for us to use non-linear method than linear<br />
regression to study the relationship <strong>between</strong> capital structure <strong>and</strong> operating efficiency.<br />
This paper applies panel threshold regression model developed by Hansen (1996) to<br />
test whether there exists an optimal debt ratio. When debt ratio is below the threshold<br />
value, it has a positive relationship with firm’s operating efficiency, which means, at<br />
this time, managers can increase firm’s operating efficiency <strong>and</strong> firm value by<br />
increasing debt ratio. Contrarily, when debt ratio is above the threshold value, a<br />
negative relationship exists. If managers increase the debt ratio, operating efficiency<br />
4
<strong>and</strong> firm value will decrease.<br />
The rest of this paper is organized as follows. Section 2 describes the data resource<br />
<strong>and</strong> variables selection. Section 3 introduces panel threshold regression model,<br />
including empirical model, estimation method, testing process, asymptotic<br />
distribution of threshold estimate <strong>and</strong> etc. Section 4 presents empirical results <strong>and</strong><br />
analysis. Section 5 concludes.<br />
2. Data Resource <strong>and</strong> Variables Selection<br />
This study analyzes a sample consisting of 821 A-shares listed firms traded on the<br />
SHSE <strong>and</strong> SZSE over December 1998-December 2002 interval. It is panel data. The<br />
total number of observations is 4105. Firms which were listed after 1998 are not<br />
included in the sample. All financial data we uses in this paper comes from CSMAR.<br />
We choose ROA (Return on asset) as dependent variable. As we know, Tobin Q is a<br />
good indicator of firm value. However, Tobin q cannot well assess Chinese listed firm<br />
value because of the peculiar features of Chinese stock market. With the exception of<br />
a few listed firm that do not involve state ownership, all Chinese listed firms are<br />
restructured SOEs. For the government to have an effective control over state assets<br />
<strong>and</strong> SOEs, shares of a firm are typically split into state shares, legal-entity shares, <strong>and</strong><br />
tradable shares, with the restriction that state <strong>and</strong> legal-entity shares cannot be traded<br />
publicly. State shares are those owned by the central or local government. Legal-entity<br />
shares are those held by domestic legal entities, such as listed companies, SOEs,<br />
banks, etc. So it is difficult for us to evaluate the market value of non-tradable shares.<br />
What’s more, the market value of debt <strong>and</strong> replacement cost is also difficult for<br />
valuation. Therefore, we choose the accounting indicator ROA to evaluate the firm’s<br />
operating efficiency <strong>and</strong> firm value. To fix notation, let v be the ratio of return on<br />
asset.<br />
The independent variable is debt ratio, which is computed by ‘book value of total<br />
liabilities’ divided by ‘book value of total assets’. In this paper, debt ratio is also the<br />
threshold variable. Let d be debt ratio.<br />
Table 1. Descriptive summary of ROA <strong>and</strong> Debt Ratio.<br />
25%<br />
75%<br />
Minimum<br />
percentile<br />
Medium<br />
percentile Maximum Average<br />
Debt ratio 0.005535 0.306142638 0.42795837 0.5547367 13.58267 0.453161<br />
ROA -13.0837 0.014648006 0.04189124 0.0674998 0.812518 0.023634<br />
5
3. Model<br />
This paper applies <strong>Panel</strong> <strong>Threshold</strong> Regression <strong>Analysis</strong> developed by Hansen (1999)<br />
to test the threshold effect for panel data.<br />
3.1 <strong>Threshold</strong> Autoregressive Model<br />
Tong (1978) proposed <strong>Threshold</strong> Autoregressive model, thereafter, this non-linear<br />
time series model becomes very popular for economic <strong>and</strong> financial research.<br />
When we estimate <strong>Threshold</strong> Autoregressive Model, first we should test whether there<br />
exists threshold effect. If we accept the null hypothesis, the threshold effect doesn’t<br />
exist. Again, the existence of nuisance will make the testing statistic follow<br />
non-st<strong>and</strong>ard distribution, which was called ‘Davies’ Problem 3 . Hansen (1999)<br />
suggests that a bootstrap method to compute the asymptotic distribution of testing<br />
statistics in order to test the significance of threshold effect. Furthermore, when the<br />
null hypothesis doesn’t hold, which means, the threshold effect does exist, Chan<br />
(1993) proves that OLS estimation of threshold is super consistent, <strong>and</strong> then derive<br />
the asymptotic distribution. However, nuisance influences this distribution <strong>and</strong> make<br />
it non-st<strong>and</strong>ard. Hansen (1999) uses simulation likelihood ratio test to derive the<br />
asymptotic distribution of testing statistic for a threshold.<br />
Hansen (1999) proposes to use two-stage OLS method to estimate the panel threshold<br />
model. On the first stage, for any given threshold (γ ) , we compute the sum of square<br />
errors (SSR) separately. On the second stage, we find the estimation of γ by<br />
minimization of the sum of squares. At last, we can use the estimation of threshold to<br />
estimate the coefficient for every regime <strong>and</strong> do analysis.<br />
3.2 <strong>Threshold</strong> Model Construction<br />
In this paper, we want to examine whether threshold effect exists <strong>between</strong> the<br />
financial leverage <strong>and</strong> firm’s operating efficiency. According to ‘Trade-off Theory of<br />
<strong>Capital</strong> <strong>Structure</strong>’, when debt ratio increases, the interest tax shield increases;<br />
however, on the other side, costs of financial distress increase to counteract the<br />
positive effect of debt ratio to firm value. Thus I hypothesize that there exists an<br />
optimal debt ratio, <strong>and</strong> try to use threshold model to estimate this ratio which can help<br />
us underst<strong>and</strong> the relationship <strong>between</strong> financial leverage <strong>and</strong> operating efficiency as<br />
3 Davies’ Problem is one that testing statistics follow non-st<strong>and</strong>ard distribution because of the<br />
existence of the nuisance (Davies, 1997,1998). Afterwards, Andrews <strong>and</strong> Ploberger(1994) <strong>and</strong><br />
Hansen(1996) tested again to solve the problem.<br />
6
well as help financial managers, loan managers <strong>and</strong> investors make decisions.<br />
So we set up single threshold model as follows.<br />
v = µ + α d I d ≤ γ ) + α d I ( d > γ ) + ε<br />
(1)<br />
Where<br />
vit<br />
it<br />
i<br />
1<br />
it<br />
(<br />
it<br />
2<br />
it<br />
represents the ratio of return on assets; d , the threshold variable,<br />
represents the ratio of debts to assets;<br />
heterogeneity of companies under different operating conditions;<br />
function. The errors<br />
with mean zero <strong>and</strong> finite variance<br />
different periods.<br />
i<br />
it<br />
it<br />
it<br />
µ , the fixed effect, represents the<br />
I(⋅) is the indicator<br />
ε<br />
it<br />
is assumed to be independent <strong>and</strong> identically distributed (iid)<br />
2<br />
σ<br />
Another compact representation of (1) is to set<br />
α = α , α )<br />
( ′<br />
1 2<br />
; i represents different companies; t represents<br />
<strong>and</strong><br />
d<br />
it<br />
⎡d<br />
= ⎢<br />
⎣d<br />
it<br />
it<br />
I(<br />
d<br />
I(<br />
d<br />
it<br />
it<br />
≤ γ ) ⎤<br />
> γ )<br />
⎥<br />
⎦<br />
so that (1) equals<br />
v<br />
it<br />
= µ + α′<br />
d ( γ ) + ε<br />
(2)<br />
i<br />
it<br />
it<br />
The observations are divided into two ‘regimes’ depending on whether the threshold<br />
variable d is smaller or larger than the threshold γ . The regimes are distinguished<br />
it<br />
by differing regression slopes, α 1<br />
<strong>and</strong> α<br />
2<br />
. We will use known v <strong>and</strong><br />
estimate the parameters<br />
2<br />
γ , α <strong>and</strong> σ .<br />
it<br />
dit<br />
to<br />
3.3 Estimation<br />
Note that taking averages of (2) over the time index t produces<br />
v<br />
it<br />
= µ + α′<br />
d ( γ ) + ε<br />
(3)<br />
it<br />
it<br />
it<br />
where<br />
v<br />
=<br />
1<br />
T<br />
∑<br />
i<br />
v it<br />
T t=<br />
1<br />
1<br />
ε<br />
=<br />
i<br />
T<br />
∑<br />
T t=<br />
1<br />
ε , <strong>and</strong><br />
T<br />
⎡ 1<br />
⎤<br />
⎢ ∑ dit<br />
I(<br />
dit<br />
≤ γ )<br />
T<br />
1<br />
T<br />
⎥<br />
t=<br />
1<br />
d ( ) = ∑ = ⎢<br />
⎥<br />
i<br />
γ dit<br />
( γ )<br />
T<br />
T t=<br />
1 ⎢ 1<br />
⎥<br />
⎢ ∑ dit<br />
I(<br />
dit<br />
> γ ) ⎥<br />
⎣T<br />
t=<br />
1<br />
⎦<br />
Taking the difference <strong>between</strong> (2) <strong>and</strong> (3) yields<br />
v<br />
it<br />
* *<br />
= α ′ γ ) + ε (4)<br />
*<br />
it<br />
d it<br />
(<br />
it<br />
where<br />
Let<br />
v<br />
*<br />
it<br />
= v<br />
it<br />
*<br />
*<br />
− vi<br />
dit<br />
( γ ) = dit<br />
( γ ) − di<br />
( γ ) ε<br />
it<br />
= ε<br />
it<br />
− ε<br />
i<br />
7
*<br />
*<br />
*<br />
⎡v<br />
⎤ ⎡<br />
i2<br />
d ′ ⎤<br />
2(<br />
γ ) ⎡<br />
i<br />
ε ⎤<br />
i2<br />
* ⎢ ⎥ * ⎢ ⎥ * ⎢ ⎥<br />
vi<br />
= ⎢M ⎥ d<br />
i<br />
( γ ) = ⎢M<br />
⎥ ε<br />
i<br />
= ⎢M<br />
⎥<br />
⎢ * ⎥<br />
⎣v<br />
⎢ * ⎥<br />
iT ⎦ ⎣d<br />
( γ )′<br />
⎢ * ⎥<br />
iT ⎦ ⎣ε<br />
iT ⎦<br />
denote the stacked data <strong>and</strong> errors for an individual ,with one time period deleted.<br />
∗ ∗<br />
∗<br />
Then let V , D (γ ) <strong>and</strong> e denote the data stacked over all individuals.<br />
V<br />
*<br />
*<br />
*<br />
⎡v<br />
⎤ ⎡<br />
1<br />
d ⎤<br />
1<br />
( γ )<br />
⎢ ⎥ ⎢ ⎥<br />
⎢M<br />
⎥ ⎢M<br />
⎥<br />
= ⎢ *<br />
v ⎥ *<br />
i<br />
⎢ *<br />
D ( γ ) = d ⎥<br />
i<br />
( γ ) , e<br />
⎢ ⎥ ⎢ ⎥<br />
⎢M<br />
⎥ ⎢M<br />
⎥<br />
⎢ * ⎥ ⎢ * ⎥<br />
⎢⎣<br />
vn<br />
⎥⎦<br />
⎢⎣<br />
dn<br />
( γ ) ⎥⎦<br />
Use this notation, (4) is equivalent to<br />
*<br />
*<br />
⎡ε<br />
⎤<br />
1<br />
⎢ ⎥<br />
⎢M<br />
⎥<br />
⎢ *<br />
= ε ⎥<br />
i<br />
⎢ ⎥<br />
⎢M<br />
⎥<br />
⎢ * ⎥<br />
⎢⎣<br />
ε<br />
n ⎥⎦<br />
* *<br />
*<br />
V = D γ ) α + e<br />
(5)<br />
it<br />
it<br />
(<br />
it<br />
For any given γ , the slope coefficient α can be estimated by ordinary least squares<br />
(OLS). That is,<br />
ˆ α(<br />
γ ) = ( D<br />
*<br />
( γ )′<br />
D<br />
*<br />
( γ ))<br />
−1<br />
*<br />
D ( γ ) V<br />
*<br />
The vector of regression residuals is<br />
*<br />
* *<br />
eˆ ( γ ) = V − D ( γ ) ˆ( α γ )<br />
(7)<br />
<strong>and</strong> the sum of squared errors is<br />
* *<br />
* * * * −1<br />
* *<br />
SSE<br />
1<br />
( γ ) = eˆ<br />
( γ )′<br />
eˆ<br />
( γ ) = V ( I − D ( γ )( D ( γ )′<br />
D ( γ )) D ( γ )′)<br />
V (8)<br />
Chan(1993) <strong>and</strong> Hansen (1999) recommend estimation of γ by lease squares. This<br />
is easier to achieve by minimization of the concentrated sum of squared errors (7).<br />
Hence the least squares estimators of γ is<br />
ˆ γ = arg min SSE ( )<br />
(9)<br />
1<br />
γ<br />
(6)<br />
Once γˆ is obtained, the slope coefficient estimate is<br />
ˆ α = ˆ( α ˆ) γ . The residual vector is<br />
*<br />
e ˆ*<br />
= eˆ<br />
( ˆ) γ <strong>and</strong> residual variance<br />
2 2 1<br />
* 1<br />
ˆ σ = ˆ σ ( ˆ) γ = eˆ *′<br />
( ˆ)ˆ γ e ( ˆ) γ = SSE1(<br />
ˆ) γ<br />
(10)<br />
n(<br />
T −1)<br />
n(<br />
T −1)<br />
where n indexes the number of sample, T indexed the periods of sample.<br />
3.4 Testing for a threshold<br />
This paper hypothesizes that there exists threshold effect <strong>between</strong> the debt ratio <strong>and</strong><br />
operating efficiency. It is important to determine whether the threshold effect is<br />
statistically significant. The null hypothesis <strong>and</strong> alternative hypothesis can be<br />
8
epresented as follows<br />
⎧H<br />
⎨<br />
⎩H<br />
0<br />
1<br />
: α = α<br />
1<br />
: α ≠ α<br />
1<br />
2<br />
2<br />
When the null hypothesis holds, the coefficient α<br />
1<br />
= α<br />
2 , the threshold effect doesn’t<br />
exist. When the alternative hypothesis holds, the coefficient α1 ≠ α<br />
2 , the threshold<br />
effect exists <strong>between</strong> the debt ratio <strong>and</strong> operating efficiency.<br />
Under the null hypothesis of no threshold, the model is<br />
v = µ + α′<br />
1<br />
d ( γ ) + ε<br />
(11)<br />
it<br />
i<br />
it<br />
After the fixed-effect transformation is made, we have<br />
it<br />
* * *<br />
V = α′d γ ) + e<br />
(12)<br />
it<br />
1<br />
it<br />
(<br />
it<br />
The regression parameter is estimated by OLS, yielding estimate<br />
~α 1 , residuals<br />
* ~e ~ * ~ *<br />
<strong>and</strong> sum of squared errors<br />
0<br />
= e e<br />
SSE<br />
′<br />
Hansen (1999) suggests that we use the F Test Approach to test the existence of<br />
threshold effect, <strong>and</strong> use the sup-Wald statistic to test the null hypothesis.<br />
F = sup F(<br />
γ )<br />
(13)<br />
F(<br />
γ )<br />
( SSE<br />
− SSE ( γ )) /1<br />
SSE<br />
.<br />
− SSE ( ˆ) γ<br />
0 1<br />
0 1<br />
= =<br />
(14)<br />
2<br />
SSE<br />
ˆ<br />
1(<br />
ˆ) γ / n(<br />
T −1)<br />
σ<br />
Under the null hypothesis, some coefficients (e.g. the pre-specified threshold γ ) do<br />
not exist, therefore, the unisance exists. According to Davies’ problem (1977,1987),<br />
the F statistic becomes non-st<strong>and</strong>ard distribution. Hansen (1996) shows that a<br />
bootstrap procedure attains the first-order asymptotic distribution, so p-values<br />
constructed from the bootstrap are asymptotically valid. Treat the regressors <strong>and</strong><br />
threshold variable as given, holding their values fixed in repeated bootstrap<br />
d it<br />
samples. Take the regression residuals<br />
*<br />
eˆit<br />
, <strong>and</strong> group them by individual:<br />
* ∗ ∗ ∗<br />
∗ ∗ ∗<br />
e (ˆ e , eˆ<br />
, L , eˆ<br />
) . Treat the sample { e , e , L ˆ }<br />
ˆi<br />
=<br />
i1<br />
i2<br />
iT<br />
ˆ1<br />
ˆ2<br />
e n<br />
as the empirical distribution to<br />
be used for bootstrapping. Draw a sample size of n from the empirical distribution <strong>and</strong><br />
use these errors to create a bootstrap sample under . Using the bootstrap sample,<br />
estimate the model under the null (12) <strong>and</strong> alternative (4) <strong>and</strong> calculate the bootstrap<br />
value of the likelihood ratio statistic F ( γ ) (14). Repeat this procedure a large<br />
number of times <strong>and</strong> calculate the percentage of draws for which the simulated<br />
H 0<br />
9
statistic exceeds the actual. This is the bootstrap estimate of the asymptotic p-value<br />
for F (γ ) under . The null of no threshold effect is rejected if the p-value is<br />
H 0<br />
smaller than the desired critical value.<br />
~<br />
P = P( F ( γ ) > F(<br />
γ ) ζ )<br />
(15)<br />
where<br />
ζ<br />
is the conditional mean of<br />
~<br />
F ( γ ) > F(<br />
γ )<br />
.<br />
3.5 Asymptotic distribution of threshold estimate<br />
Chan (1993) <strong>and</strong> Hansen (1999) have shown that when there is a threshold effect<br />
α<br />
1<br />
≠ α 2<br />
, ˆ γ<br />
is consistent for<br />
γ 0 , <strong>and</strong> that the asymptotic distribution is highly<br />
non-st<strong>and</strong>ard. Hansen (1999) argues that the best way to form confidence intervals for<br />
γ is to form the ‘no-rejection region’ using the likelihood ratio statistic for tests on<br />
γ . To test the hypothesis<br />
⎧H<br />
⎨<br />
⎩H<br />
0<br />
1<br />
: γ = γ<br />
: γ ≠ γ<br />
0<br />
0<br />
We construct the testing model<br />
SSE1( γ ) − SSE1(<br />
ˆ) γ<br />
LR<br />
1(<br />
γ ) =<br />
2<br />
ˆ σ<br />
(16)<br />
Hansen (1999) points out that when LR ) is too large <strong>and</strong> the p-value exceeds the<br />
1<br />
( γ 0<br />
confidence interval, the null hypothesis is rejected 4 . Besides, Hansen (1999) indicates<br />
that under some specific assumptions 5 <strong>and</strong> H<br />
0<br />
: γ = γ<br />
0<br />
,<br />
LR<br />
1<br />
( γ ) = dζ<br />
(17)<br />
as n → ∞ , where ζ is a r<strong>and</strong>om variable with distribution function<br />
2<br />
P( ζ ≤ x ) = (1 − exp( − x ))<br />
(18)<br />
2<br />
The asymptotic p-value can be estimated under the likelihood ratio. According to the<br />
proof of Hansen(1999), the distribution function (18) has the inverse<br />
c ( α)<br />
= −2log(1<br />
− 1−α<br />
)<br />
(19)<br />
from which it is easy to calculate critical values. For a given asymptotic level α , the<br />
null hypothesis γ = γ<br />
0<br />
rejects if LR1 ( γ ) exceeds c (α ) .<br />
4 Note that the statistic (16) is testing a different hypothesis from the statistic (14) introduced in the<br />
previous section. LR 1<br />
( γ 0<br />
) is testing H<br />
0<br />
: γ = γ<br />
0<br />
while F(γ<br />
) is testing H<br />
0<br />
: α<br />
1<br />
= α<br />
2<br />
.<br />
5 Refer to Hansen (1999) Appendix: Assumptions 1-8.<br />
10
3.6 Multiple thresholds Model<br />
If there exist triple thresholds, the model is<br />
v<br />
it<br />
⎧µ<br />
i<br />
+ α1d<br />
⎪<br />
µ<br />
i<br />
+ α<br />
2d<br />
= ⎨<br />
⎪µ<br />
i<br />
+ α<br />
3d<br />
⎪<br />
⎩µ<br />
i<br />
+ α<br />
4d<br />
it<br />
it<br />
it<br />
it<br />
+ ε Lifd<br />
it<br />
+ ε Lifγ<br />
< d<br />
it<br />
+ ε Lifγ<br />
< d<br />
it<br />
+ ε Lifd<br />
it<br />
it<br />
1<br />
2<br />
it<br />
≤ γ<br />
it<br />
1<br />
it<br />
> γ<br />
3<br />
≤ γ<br />
≤ γ<br />
3<br />
2<br />
(20)<br />
where threshold value γ<br />
1<br />
< γ<br />
2<br />
< γ<br />
3<br />
. This can be extended to multiple thresholds<br />
model γ<br />
1, γ<br />
2<br />
, γ<br />
3,<br />
Lγ<br />
n<br />
.<br />
4. Empirical Results<br />
This paper applies the threshold theory proposed by Hansen (1999) <strong>and</strong> hypothesize<br />
that debt ration <strong>and</strong> operating efficiency have asymmetric nonlinear relationship. First<br />
let us test whether there exist the triple thresholds effect. We test single threshold,<br />
double threshold <strong>and</strong> triple threshold effect respectively. The models are as follows.<br />
v<br />
v<br />
it<br />
it<br />
⎧µ<br />
i<br />
+ α1d<br />
= ⎨<br />
⎩µ<br />
i<br />
+ α<br />
2d<br />
⎧µ<br />
i<br />
+ α1d<br />
⎪<br />
= ⎨µ<br />
i<br />
+ α<br />
2d<br />
⎪<br />
⎩µ<br />
i<br />
+ α<br />
3d<br />
it<br />
it<br />
it<br />
it<br />
it<br />
+ ε Lifd<br />
it<br />
+ ε Lifd<br />
it<br />
+ ε Lifd<br />
it<br />
+ ε Lifd<br />
it<br />
it<br />
≤ γ<br />
> γ<br />
≤ γ<br />
+ ε Lifγ<br />
< d<br />
it<br />
it<br />
it<br />
1<br />
it<br />
1<br />
> γ<br />
it<br />
2<br />
≤ γ<br />
2<br />
v<br />
it<br />
⎧µ<br />
i<br />
+ α1d<br />
⎪<br />
µ<br />
i<br />
+ α<br />
2d<br />
= ⎨<br />
⎪µ<br />
i<br />
+ α<br />
3d<br />
⎪<br />
⎩µ<br />
i<br />
+ α<br />
4d<br />
it<br />
it<br />
it<br />
it<br />
+ ε Lifd<br />
it<br />
+ ε Lifγ<br />
< d<br />
it<br />
+ ε Lifγ<br />
< d<br />
it<br />
+ ε Lifd<br />
it<br />
it<br />
1<br />
2<br />
it<br />
≤ γ<br />
it<br />
1<br />
it<br />
> γ<br />
≤ γ<br />
2<br />
, Where γ<br />
1<br />
< γ<br />
2<br />
< γ<br />
3<br />
≤ γ<br />
3<br />
3<br />
The dependent variable<br />
represents ROA, the indicator of operating efficiency.<br />
The independent d represents debt ratio, in this paper<br />
variable.<br />
it<br />
v it<br />
dit<br />
is also threshold<br />
This paper follows the bootstrap method to get the approximation of F statistic <strong>and</strong><br />
then calculate the p-value. Table 2 presents the empirical results of test for single<br />
threshold, double threshold, <strong>and</strong> triple threshold effects. Through 200 bootstrap<br />
replications for each of the three bootstrap tests, we find that the test for a single<br />
threshold is highly significant with a bootstrap p-value of 0.03, the test for a double<br />
threshold is also significant with a p-value of 0.06, <strong>and</strong> the test for a triple threshold is<br />
statistically significant with a p-value of 0.02.The p-value is least for the test of a<br />
triple threshold effect, therefore we conclude that there exists a triple threshold effect<br />
11
etween the debt ratio <strong>and</strong> operating efficiency.<br />
Table 2 Tests for threshold effects<br />
<br />
<br />
F1<br />
<br />
P-Value<br />
<br />
<br />
<br />
••<br />
<br />
<br />
<br />
F2<br />
10.198337<br />
P-Value<br />
<br />
<br />
<br />
0.06 •<br />
<br />
<br />
(9.14, 10.78, 15.28)<br />
<br />
<br />
<br />
F3<br />
10.127469<br />
P-Value 0.02 ••<br />
<br />
<br />
(6.9,8.63,10.96)<br />
• ••<br />
•••<br />
denotes significance at the 10%,5%,1% level respectively.<br />
<br />
<br />
When there exists a triple threshold effect <strong>between</strong> the debt ratio <strong>and</strong> operating<br />
efficiency, all observations are split into four regimes. Table 2 represents the threshold<br />
estimates <strong>and</strong> Table 4 represents the regression slope estimates, conventional OLS<br />
st<strong>and</strong>ard errors, <strong>and</strong> White-corrected st<strong>and</strong>ard errors for four regimes.<br />
Table 3 <strong>Threshold</strong> estimate<br />
Estimate<br />
ˆ1<br />
γ 0.21654495<br />
ˆ2<br />
γ 0.35053867<br />
ˆ3<br />
γ 0.51936048<br />
Table 4 Regression estimates: triple threshold model<br />
Coefficient<br />
estimate<br />
OLS Se<br />
White Se<br />
ˆα<br />
1<br />
•••<br />
0.88791656 0.14039845(6.3) 0.32423321(2.75)<br />
ˆα<br />
•••<br />
0.51746028 0.068485810(7.65) 0.20014241(2.59)<br />
2<br />
12
ˆα<br />
••<br />
3<br />
0.34217229<br />
4<br />
•<br />
0.040440677(8.5) 0.13830329(2.474)<br />
•••<br />
ˆα 0.25437742 0.016846981(15.1) 0.10603472(2.399)<br />
•••<br />
1. denotes at the significance of 1% level.<br />
2.<br />
ˆα d ≤ γˆ<br />
1 is the coefficient estimate for it 1<br />
ˆα ˆ ˆ<br />
3 is the coefficient estimate for<br />
γ<br />
2< d it<br />
≤ γ<br />
3<br />
3. The value in is t–value.<br />
ˆα ˆ γ ˆ<br />
is the coefficient estimate for<br />
1<br />
< d it<br />
≤ γ<br />
2<br />
,<br />
<strong>and</strong><br />
ˆα d > γˆ<br />
4 is the coefficient estimate for it 3<br />
.<br />
, 2<br />
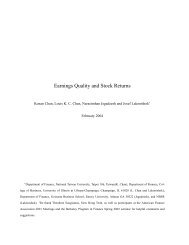
Figure 1. Confidence interval construction in triple threshold model.<br />
The estimated model from empirical research is as follows:<br />
v<br />
it<br />
= µ + 0.89d<br />
i<br />
0.34d<br />
it<br />
it<br />
I ( d<br />
it<br />
I (0.35 < d<br />
≤ 0.22) + 0.52d<br />
it<br />
≤ 0.52) + 0.25d<br />
it<br />
I (0.22 < d<br />
it<br />
I ( d<br />
it<br />
it<br />
≤ 0.35) +<br />
> 0.52) + ε<br />
it<br />
ˆ1<br />
γ , ˆ2 γ ˆ<br />
<strong>and</strong><br />
γ 3 split the observations into four regimes. In the first regime, where<br />
the debt ratio is below 22%, the estimate of coefficient 1<br />
ˆα is 0.89, which means,<br />
when the debt ratio is increased by 1%, ROA will be increased by 0.89%. In the<br />
second regime, where the debt ratio is above 22% but below 35%, the estimate of<br />
coefficient<br />
ˆα<br />
2 is 0.52, which implies, ROA will be increased by 0.52% by 1%<br />
increase of debt ratio. In the third regime, where the debt ratio is above 35% but<br />
below 52%, the estimate of coefficient ˆα 3<br />
is 0.34, that is, when debt ratio is<br />
increased by 1%, ROA will be increased by 0.34%. In the fourth regime, where debt<br />
ratio is above 52%, the estimate of coefficient<br />
ˆα 4 is 0.25, that is, ROA will be<br />
13
increased by 0.25% by 1% increase of debt ratio. According to table 4, the estimates<br />
ˆα<br />
1 ,<br />
ˆα<br />
2 ,<br />
ˆα<br />
3 ,<br />
ˆα<br />
3 are all significant under the 1% level under the consideration of both<br />
homogenous st<strong>and</strong>ard errors <strong>and</strong> heterogeneous st<strong>and</strong>ard errors.<br />
From empirical research we find that the increase of debt ratio can improve the<br />
operating efficiency of firms thus increase firm value. This finding is consistent with<br />
the proposition MM (1963). On the other side, costs of financial distress increase as<br />
the debt ratio increase gradually, which counteracts the positive effect of debt ratio to<br />
operating efficiency. Our finding ˆ α<br />
4<br />
< ˆ α ˆ ˆ<br />
3<br />
< α<br />
2<br />
< α1<br />
is consistent with this view.<br />
This result can also be explained by agency theory. On one h<strong>and</strong>, higher debt ratio<br />
means less free cash flow for managers to manipulate, which can reduce agency cost<br />
<strong>and</strong> increase firm’s operating efficiency. On the other h<strong>and</strong>, when the debt ratio is too<br />
high which leads to financial distress, the conflicts <strong>between</strong> creditors <strong>and</strong> shareholders<br />
will increase the agency costs <strong>and</strong> reduce the operating efficiency. Therefore, we<br />
conclude that if financial managers use financial leverage deliberately, operating<br />
efficiency will be improved <strong>and</strong> firm value will be increased.<br />
5.Conclusions<br />
The paper applies panel threshold regression model to examine whether financial<br />
leverage affects operating efficiency thus affects firm value of Chinese listed firms.<br />
We intend to test whether there exists an optimal debt ratio, which leads to the<br />
asymmetric relationship <strong>between</strong> the debt ratio <strong>and</strong> operating efficiency.<br />
Under the consideration of the special features of Chinese stock market, we choose<br />
ROA as the indicator of the operating efficiency of the firms to test threshold effect<br />
based on their debt to asset ratio. We find that there exists triple threshold effect <strong>and</strong><br />
the coefficients are all positive <strong>and</strong> significant for four regimes. Our results identify<br />
that the operating efficiency is positively related to debt level, with ‘very low debt’<br />
firms having a higher coefficient. but the positive effect decreases when debt ratio<br />
increases. When debt ratio increases, the interest tax shield increases; however, on the<br />
other side, costs of financial distress increase to counteract the positive effect of debt<br />
ratio to firm value. As Chinese listed firms prefer equity financing <strong>and</strong> their debt to<br />
asset ratios are relatively low, the benefits of interest tax shield are higher than costs<br />
of financial distress. This result can also be explained by agency theory. On one h<strong>and</strong>,<br />
higher debt ratio means less free cash flow for managers to manipulate, which can<br />
reduce agency cost <strong>and</strong> increase firm’s operating efficiency. On the other h<strong>and</strong>, when<br />
the debt ratio is too high which leads to financial distress, the conflicts <strong>between</strong><br />
14
creditors <strong>and</strong> shareholders will increase the agency costs <strong>and</strong> reduce the operating<br />
efficiency.<br />
Our results indicate that financial managers should use financial leverage wisely to<br />
improve the operating efficiency in order to maximize the firm value <strong>and</strong> investors<br />
should refer to the debt ratio to make investment decisions. As corporate bond market<br />
has not been well developed in China <strong>and</strong> firm’s debt financing mainly depends on<br />
commercial banks, our result is helpful for loan managers in banks.<br />
References<br />
(1)Bergman, Yaacov Z., <strong>and</strong> Jeffrey L. Callen, 1991, “Opportunistic Underinvestment<br />
in Debt Renegotiation <strong>and</strong> <strong>Capital</strong> <strong>Structure</strong>,” Journal of Financial Economics, 29(1),<br />
137-172<br />
(2)Bradley, Michael, Gregg A. Jarrell, E. Han Kim <strong>and</strong> Wayne H. Mikkelson, 1984,<br />
“On the Existence of an Optimal <strong>Capital</strong> <strong>Structure</strong>: Theory <strong>and</strong> Evidence/Discussion,”<br />
The Journal of Finance, 39(3), 857-871<br />
(3)Burgman, Todd A., 1996, “An empirical examination of multinational corporate<br />
capital structure,” Journal of International Business Studies, 27(3), 553-471<br />
(4)Castanias, Richard, 1983, “Bankruptcy Risk <strong>and</strong> Optimal <strong>Capital</strong> <strong>Structure</strong>,” The<br />
Journal of Finance, 38(5), 1617-1636<br />
(5)Chan, K.S., 1993, “Consistency <strong>and</strong> Limiting Distribution of the Least Squares<br />
Estimator of a Continuous <strong>Threshold</strong> Autoregressive Model,” The Annals of Statistics,<br />
21, 520-533<br />
(6)Chirinko, Robert S. <strong>and</strong> R. Singha Anuja, 2000, “Testing static tradeoff against<br />
pecking order models of capital structure: A critical comment,” Journal of Financial<br />
Economics, 58(3), 417<br />
(7)Davis, R. B., 1977, “Hypothesis testing when a nuisance parameter is present only<br />
under the alternative,” Biometrika, 64, 247-254<br />
(8)Davis, R. B., 1987, “Hypothesis testing when a nuisance parameter is present only<br />
under the alternative,” Biometrika, 74, 33-43<br />
(9)Erik Lie, 2002, “Do firms undertake self-tender offers to optimize capital<br />
structure” The Journal of Business, 75(4), 609-640<br />
(10)Erwan, Morellec, 2001, “Asset liquidity, capital structure, <strong>and</strong> secured debt,”<br />
Journal of Financial Economics, 61(2), 173<br />
(11)Flath, David, <strong>and</strong> Charles R. Knoeber, 1980, “Taxes, Failure Costs, <strong>and</strong> Optimal<br />
Industry <strong>Capital</strong> <strong>Structure</strong>: An Empirical Test,” The Journal of Finance, 35(1), 99<br />
(12)Hansen, B. E., 1996, “Inference when a nuisance parameter is not identified under<br />
the null hypothesis,” Econometrica, 64, 413-430<br />
15
(13)Hansen, B. E., 1999, “<strong>Threshold</strong> effects in non-dynamic panels: Estimation,<br />
testing <strong>and</strong> inference,” Journal of Econometrics, 93, 345-368.<br />
(14)Hansen, B. E., 1986, “Sample splitting <strong>and</strong> threshold estimation,” Econometrica,<br />
2000, 68, 575-603<br />
(15)Jensen, Michael C., “Agency Costs of Free Cash Flow, Corporate Finance, <strong>and</strong><br />
Takeovers,” The American Economic Review, 76, 323-329<br />
(16)Jensen, M.C., <strong>and</strong> W. H. Meckling, “Theory of the firm : Managerial Behavior,<br />
agency cost <strong>and</strong> ownership structure,” Journal of Financial Economics, 1976, 3,<br />
305-360<br />
(17)Kim, Wi Saeng, <strong>and</strong> Eric H. Sorensen, 1986, “Evidence on the Impact of the<br />
Agency Costs of Debt on Corporate Debt Policy,” Journal of Financial <strong>and</strong><br />
Quantitative <strong>Analysis</strong><br />
(18)Lakshmi, Shyam-Sunder, <strong>and</strong> Stewart C. Myers, 1999, “Testing static tradeoff<br />
against pecking order models of capital structure,” Journal of Financial Economics,<br />
51(2), 219-245<br />
(19)Miller, Merton H., 1977, “Dedt <strong>and</strong> Taxes,” Journal of Finance, 32, 261-275<br />
(20)Modigliani, F. <strong>and</strong> Merton H. Miller, 1958, “The cost of capital, corporate finance,<br />
<strong>and</strong> the theory of investment,” American Economic Review, 48, 261-297”<br />
(21)Modigliani, F. <strong>and</strong> Merton H. Miller, 1963, “Corporate income taxes <strong>and</strong> the cost<br />
of capital: A correction,” American Economics Review, 53, 433-443<br />
(22)Myers, Stewart C., <strong>and</strong> Nicholas S. Majluf, 1984, “Corporate Financing <strong>and</strong><br />
Investment Decisions When Firms Have Information That Investors Do Not Have,”<br />
Journal of Financial Economics, 13(2), 187-222<br />
(23)Philosophov, L.V. <strong>and</strong> V.L. Philosophov, 1999, “Optimization of corporate capital<br />
structure: A probabilistic Bayesian approach,” International Review of Financial<br />
<strong>Analysis</strong><br />
(24)Ross, Stephen A., 1977, “The Determination of Financial <strong>Structure</strong>-The Incentive<br />
Signaling Approach,” Bell Journal of Economics, 8(1), 1-23<br />
(25)Titman, Sheridan, <strong>and</strong> Roberto Wessels, 1988, “The Determinants of <strong>Capital</strong><br />
<strong>Structure</strong> Choice,” The Journal of Finance, 43(1), 1-21<br />
(26)Tong, H., On a <strong>Threshold</strong> Model, in C.H. Chen (ed.), Pattern Recognition <strong>and</strong><br />
Signal PROAessing, Amsterdam: Sijthoff & Noordhoff, 1978, 101-141.<br />
(27) Chien-Chung Nieh, <strong>and</strong> Wen-qian Liu, Nonlinear relationship <strong>between</strong> capital<br />
structure <strong>and</strong> operating efficiency of electron industries—<strong>Panel</strong> threshold effect<br />
analysis<br />
(28) Hui Wang, Debt financing, Corporate Governance <strong>and</strong> Firm Value, Chinese<br />
Edition of Economic Review, 2003.8<br />
16