The West Coast Trawl Buyback Program and Ex-Vessel Revenues ...
The West Coast Trawl Buyback Program and Ex-Vessel Revenues ...
The West Coast Trawl Buyback Program and Ex-Vessel Revenues ...

Create successful ePaper yourself
Turn your PDF publications into a flip-book with our unique Google optimized e-Paper software.
<strong>The</strong> <strong>West</strong> <strong>Coast</strong> <strong>Trawl</strong> <strong>Buyback</strong> <strong>Program</strong> <strong>and</strong> <strong>Ex</strong>-<strong>Vessel</strong> <strong>Revenues</strong> at Monterey Bay Ports<br />
A Report to the Pacific States Marine Fisheries Commission (PSMFC)<br />
September 1, 2006<br />
Mike Dalton, NOAA Alaska Fisheries Science Center, Seattle WA<br />
Carrie Pomeroy, California Sea Grant <strong>Ex</strong>tension <strong>Program</strong>, Watsonville CA<br />
Summary<br />
This report describes recent work that relies heavily on PacFIN data for socio-economic analysis of<br />
commercial fisheries in Monterey Bay, California. We demonstrate how PacFIN data are used to frame a<br />
research question, identify a sample <strong>and</strong> population, <strong>and</strong> evaluate results. We apply this research<br />
methodology, in a limited way, to the recent <strong>West</strong> <strong>Coast</strong> groundfish trawl buyback program. Results show<br />
this program had modest effects on total ex-vessel revenues of the trawlers that l<strong>and</strong>ed at Monterey Bay<br />
ports in 2003 <strong>and</strong> 2004, with a total loss of about $230,000, or 19% from 2003 levels, but the distribution<br />
of revenues among vessels changed substantially. In particular, 4 of the 5 groundfish trawlers with<br />
l<strong>and</strong>ings at Monterey Bay ports in 2003, <strong>and</strong> successful bids in the buyback auction, were among the<br />
most active trawlers at these ports in 2003, with average ex-vessel revenues nearly double those of other<br />
trawlers in that year. <strong>The</strong>se 5 vessels were permanently retired at the end of 2003, which appears to have<br />
created an opportunity for other trawlers. <strong>The</strong> group of 8 trawlers that l<strong>and</strong>ed at Monterey Bay ports in<br />
2003 <strong>and</strong> 2004 saw their average ex-vessel revenues nearly double in 2004 from 2003 levels, while the<br />
group of 9 that l<strong>and</strong>ed at these ports in 2004, but not 2003, had substantially lower average ex-vessel<br />
revenues. <strong>The</strong>se results raise questions about the range of factors that affect trawlers’ coastwide fishing<br />
patterns, <strong>and</strong> how they adapt to <strong>and</strong> are affected by those changes, <strong>and</strong> whether similar effects occurred at<br />
other ports. <strong>The</strong>se questions are beyond the scope of this report, but could be addressed using PacFIN<br />
data, coupled with targeted field research to tap into the experience <strong>and</strong> knowledge of people that<br />
participated in the buyback program, <strong>and</strong> those that remained in the fishery.<br />
1. Introduction<br />
Recent <strong>and</strong> pending federal marine management actions on the U.S. <strong>West</strong> <strong>Coast</strong>, from groundfish<br />
regulations to marine reserves <strong>and</strong> National Marine Sanctuary management plan revisions, have<br />
highlighted the critical need for socioeconomic information on marine resource uses <strong>and</strong> associated<br />
communities. <strong>The</strong> need for this information is both practical <strong>and</strong> legal. In practical terms, because<br />
resource users affect <strong>and</strong> are affected by management, socioeconomic information can be used to inform<br />
<strong>and</strong> enhance the effectiveness of management design, implementation <strong>and</strong> evaluation. In legal terms, the<br />
Magnuson-Stevens Fishery Conservation <strong>and</strong> Management Act (MSFCMA, <strong>and</strong> amendments), the<br />
National Environmental Policy Act (NEPA), <strong>and</strong> the Regulatory Flexibility Act (RFA) require<br />
consideration of the "human dimensions" in the design <strong>and</strong> implementation of federal actions that affect<br />
the human <strong>and</strong> biophysical environments.<br />
In central California, the site of three National Marine Sanctuaries (NMSs) <strong>and</strong> diverse federally- <strong>and</strong><br />
state-managed fisheries, socioeconomic information to assess the impacts of management actions has<br />
been critically lacking. Among the types of information needed are qualitative <strong>and</strong> quantitative analyses<br />
of the social <strong>and</strong> economic characteristics of <strong>and</strong> relationships among fishing operations, processors <strong>and</strong><br />
providers of goods <strong>and</strong> services, <strong>and</strong> the economic value they generate. Data to support these analyses are<br />
not readily available from any single source. Rather, they must be collected from a diversity of primary<br />
sources such as fishery participants <strong>and</strong> support businesses (e.g., through interviews <strong>and</strong> observation), <strong>and</strong><br />
1
secondary sources including grey <strong>and</strong> refereed literatures on fisheries <strong>and</strong> communities, management<br />
documents, federal census <strong>and</strong> labor statistics, <strong>and</strong> records of fish l<strong>and</strong>ings.<br />
L<strong>and</strong>ings data are especially important because they uniquely account for the l<strong>and</strong>ing <strong>and</strong> receiving<br />
patterns of fishing vessels <strong>and</strong> buyers. <strong>The</strong>y provide information on each trip or l<strong>and</strong>ing for each vessel<br />
including the date, vessel, species, gear, port <strong>and</strong> buyer, l<strong>and</strong>ed weight <strong>and</strong> ex-vessel value. For the US<br />
<strong>West</strong> <strong>Coast</strong>, l<strong>and</strong>ings data are collected <strong>and</strong> managed by each state (California, Oregon <strong>and</strong> Washington).<br />
In addition, the data for all three states are maintained by the Pacific States Marine Fisheries Commission<br />
in the Pacific Fisheries Information Network (PacFIN) database, to support the coordination of interstate<br />
<strong>and</strong> federal fishery management. Access to these data is essential to i) the design of valid <strong>and</strong><br />
scientifically robust research strategies; ii) the complete <strong>and</strong> valid assessment of impacts on fisheries,<br />
fishery participants <strong>and</strong> fishing communities; <strong>and</strong> iii) the evaluation of research results for their validity,<br />
reliability, representativeness <strong>and</strong> generalizability.<br />
To address the socio-economic information needs outlined above, we conducted a series of socioeconomic<br />
studies on the fisheries of the Monterey Bay in Central California. For these projects, PacFIN<br />
data were necessary in the design <strong>and</strong> evaluation of our survey methods, <strong>and</strong> in particular, the data<br />
collection instruments (e.g. interview forms, economic worksheets). <strong>The</strong> first project, sponsored by the<br />
Monterey County Office of Economic Development, estimated the direct economic value of the<br />
commercial fishing industry at Moss L<strong>and</strong>ing Harbor, characterized its fisheries <strong>and</strong> fishery participants,<br />
<strong>and</strong> identified a set of issues that affect the local fisheries’ viability <strong>and</strong> vitality (Pomeroy <strong>and</strong> Dalton<br />
2003). We exp<strong>and</strong>ed on the initial Moss L<strong>and</strong>ing project for Monterey County in two subsequent studies:<br />
Market Channels <strong>and</strong> Value Added to Fish L<strong>and</strong>ed at Monterey Bay Area Ports 1 , <strong>and</strong> Measuring Impacts<br />
on Fishing Communities: A Framework for Integrated Socioeconomic Assessment, supported,<br />
respectively, by California Sea Grant (SG) <strong>and</strong> NOAA’s Saltonstall-Kennedy (SK) program.<br />
For the initial Moss L<strong>and</strong>ing project, we were unable to obtain permission to use the disaggregated<br />
PacFIN data to generate a sample of fishery participants, but were able to use PacFIN data to compute<br />
benchmark summaries of l<strong>and</strong>ings <strong>and</strong> revenues for the sample of skippers, fish buyers, <strong>and</strong> fishery<br />
related business operators we interviewed. We integrated summary expenditure data from the interviews<br />
with revenue summaries from PacFIN to calculate input-output (I/O) coefficients. <strong>The</strong>se coefficients <strong>and</strong><br />
port level revenue summaries from PacFIN enabled us to estimate total expenditures at the port on<br />
different inputs for fishing operations for the SK study. For the SK project, we also collected field data on<br />
the characteristics, <strong>and</strong> expenditures of households <strong>and</strong> other businesses at Moss L<strong>and</strong>ing. We are using<br />
these <strong>and</strong> our commercial fishery field data to construct a social accounting matrix (SAM) for Moss<br />
L<strong>and</strong>ing, <strong>and</strong> compare it to the IMPLAN SAM for Monterey County. This comparison is important<br />
because the IMPLAN SAM is the source of economic impact multipliers that are used, for example, in the<br />
Fisheries Economic Assessment Model (FEAM). However, work in the SK project shows the countylevel<br />
IMPLAN SAM misses important economic differences in the fishing industry <strong>and</strong> other components<br />
of the economies at Moss L<strong>and</strong>ing <strong>and</strong> port of Monterey.<br />
For the SG <strong>and</strong> SK projects, we also exp<strong>and</strong>ed our field data collection to include a larger sample of fish<br />
buyers. This work required updating the benchmark to reflect recent changes in all fisheries. However,<br />
individual features of the sample data needed to be well understood before results from the sample can be<br />
1 <strong>The</strong> overarching goal of this study was to help inform the assessment of potential social <strong>and</strong> economic<br />
impacts of fishery management <strong>and</strong> other measures <strong>and</strong> events on the fisheries <strong>and</strong> fishing communities<br />
of the three major Monterey Bay Area (MBA) ports: Moss L<strong>and</strong>ing, Monterey <strong>and</strong> Santa Cruz. Specific<br />
objectives were to: i) describe the spatial organization of processing activities for fish l<strong>and</strong>ed at MBA<br />
ports; <strong>and</strong> ii) estimate value added in Monterey <strong>and</strong> Santa Cruz Counties to fish l<strong>and</strong>ed at Monterey Bay<br />
ports.<br />
2
credibly used to estimate port level economic patterns. As a census, PacFIN data are the only source of<br />
information available to evaluate the general properties of these samples relative to the behavior of the<br />
entire population.<br />
<strong>The</strong> goal of the present report is to demonstrate <strong>and</strong> evaluate the use of PacFIN data in socio-economic<br />
analyses of the impacts of fishery management actions on fishing communities. Specifically, we sought<br />
to: i) identify populations in the fishing community, ii) develop samples from the population, iii) evaluate<br />
whether the sample is representative of the population, <strong>and</strong> iv) integrate field <strong>and</strong> l<strong>and</strong>ings data to<br />
extrapolate expenditures <strong>and</strong> other economic information from the sample to the entire population.<br />
This report begins with a brief description of the three Monterey Bay Area (MBA) ports <strong>and</strong> associated<br />
fishery activities. <strong>The</strong> following section discusses our methodology, beginning with an overview of our<br />
field <strong>and</strong> archival data collection <strong>and</strong> analysis. We then focus on the procedures used with the PacFIN<br />
data, from identifying <strong>and</strong> sampling fishing populations to integrating field <strong>and</strong> l<strong>and</strong>ings data. In the<br />
following section, we present the results of applying these procedures to assess the impacts of the<br />
groundfish trawl buyback on MBA ports. Next, we discuss the key findings related to the use of PacFIN<br />
data for this analysis. We then conclude with a discussion of the implications of these results locally, <strong>and</strong><br />
their application to other locations <strong>and</strong> contexts.<br />
2. <strong>The</strong> Three Monterey Bay Area Ports <strong>and</strong> Associated Fishery Activities<br />
As can be seen in Fig. 1, Santa Cruz, Moss L<strong>and</strong>ing <strong>and</strong> Monterey harbors mark the northern, eastern <strong>and</strong><br />
southern edges, respectively, of Monterey Bay. Each of these ports has long played a role in commercial<br />
<strong>and</strong> recreational fisheries, as well as the larger community, but has a distinctive history, make-up <strong>and</strong><br />
emphasis. 2 In general, Monterey Bay has been the site of diverse commercial fisheries since the mid<br />
1800s. <strong>The</strong>se fisheries have included albacore, groundfish, salmon, sardine <strong>and</strong> squid, among others,<br />
developed <strong>and</strong> carried out by Anglo, Chinese, Italian, Japanese, Portuguese <strong>and</strong> Vietnamese fishermen<br />
<strong>and</strong> buyers.<br />
Moss L<strong>and</strong>ing Harbor<br />
Prior to the 1930s, only small-scale fishing was conducted at Moss L<strong>and</strong>ing, as whaling <strong>and</strong> shipping<br />
dominated its activities up to that point (Scofield 1954). However, the growth of the sardine fishery, <strong>and</strong> a<br />
1935 “cannery boom,” prompted the construction of jetties <strong>and</strong> dredging of the harbor entrance ”so that<br />
fishing boats could enter the slough <strong>and</strong> have protected water for unloading at the canneries” (Scofield<br />
1954: 92). In the mid 1940s, the California Legislature created the Moss L<strong>and</strong>ing Harbor District as a<br />
political subdivision of the State. Work then proceeded on the harbor channel <strong>and</strong> the development of<br />
sardine canneries <strong>and</strong> reduction plants on the “Isl<strong>and</strong>,” 3 along with shipbuilding <strong>and</strong> repair yards, <strong>and</strong><br />
other support services (Francis 1997). Scofield (1957) reports that by 1952, there were eight canneries<br />
<strong>and</strong> reduction plants, with 30 to 40 purse seiners, occasional trawlers, dozens of small salmon <strong>and</strong><br />
albacore trollers <strong>and</strong> a few setline boats. Others report live bait operations as well. When the Monterey<br />
Bay sardine fishery collapsed in 1952, many purse seiners went south to San Pedro, only to have the<br />
fishery there collapse a few years later (McEvoy 1986). <strong>The</strong> smaller seiners that remained in the<br />
Monterey Bay area continued to fish for sardine, even though it was scarce. Many also shifted some of<br />
their effort to squid <strong>and</strong> other “wetfish” species (i.e., anchovy <strong>and</strong> mackerel) <strong>and</strong> herring.<br />
2 <strong>The</strong> information that follows is based primarily on our recent report on the commercial fishing industry<br />
at Moss L<strong>and</strong>ing Harbor (Pomeroy <strong>and</strong> Dalton 2003), which included a comparison of commercial<br />
fishing activities at the three harbors, augmented by new information from our SG <strong>and</strong> SK projects <strong>and</strong><br />
other sources.<br />
3 <strong>The</strong> Isl<strong>and</strong> is a narrow spit of l<strong>and</strong> that extends northwest from the mainl<strong>and</strong> at Moss L<strong>and</strong>ing.<br />
3
Fig. 1: Map with California Ports <strong>and</strong> Other Geographical Features Cited in this Report.<br />
<strong>The</strong> commercial fishing industry has played a prominent role at Moss L<strong>and</strong>ing Harbor since its<br />
establishment in 1947. <strong>The</strong> Harbor has supported multiple, diverse fisheries, the relative importance of<br />
which has varied over time with changes in environmental, social <strong>and</strong> economic <strong>and</strong> regulatory<br />
conditions. As of 2002, Moss L<strong>and</strong>ing Harbor hosted seven resident commercial fish receivers, about 125<br />
resident <strong>and</strong> 175 non-resident commercial fishing vessels, <strong>and</strong> over a half dozen businesses that provide<br />
goods <strong>and</strong> services to the commercial fishing industry. That year an estimated 13 vessels made groundfish<br />
trawl l<strong>and</strong>ings to 10 buyers. In 2006, six resident fish buyers remained. A small number of commercial<br />
fishing boats offer off-the-boat sales to visitors, <strong>and</strong> one operation specializes in providing bait locally<br />
<strong>and</strong> to retailers beyond Moss L<strong>and</strong>ing.<br />
Recreational fishing also plays an important role at Moss L<strong>and</strong>ing. Two primary commercial sportfishing<br />
operations are based at the harbor, one that carries up to six fishing passengers, <strong>and</strong> a second that operates<br />
two vessels, with capacities of 6 <strong>and</strong> 25 fishing passengers. Moss L<strong>and</strong>ing harbor also hosts many private<br />
sport fishing operations. Many of these boats, <strong>and</strong> many more from outside the harbor, use its launch<br />
ramps to access Monterey Bay fishing grounds for salmon, rockfish <strong>and</strong> albacore.<br />
4
An important function of Moss L<strong>and</strong>ing is to host several fishery-support businesses, many of which have<br />
served commercial <strong>and</strong> recreational fisheries for at least two decades. All of these businesses are based at<br />
Moss L<strong>and</strong>ing, <strong>and</strong> are locally- <strong>and</strong> in most cases family-owned. Moss L<strong>and</strong>ing’s fishery-support<br />
businesses include a fuel dock that has a small marine supply <strong>and</strong> general store, a boatyard that also sells<br />
marine supply items, a marine covers/upholstery shop, electrical, diesel, hydraulic, metalwork <strong>and</strong> other<br />
service providers, <strong>and</strong> a dry storage facility. In addition to these businesses, which play a direct role in the<br />
maintenance <strong>and</strong> operation of commercial fishing operations, fishermen <strong>and</strong> staff of fish receiving<br />
operations frequently eat at Moss L<strong>and</strong>ing restaurants, including one on the Isl<strong>and</strong> <strong>and</strong> several on the<br />
mainl<strong>and</strong>. In addition, many other businesses in the larger Monterey Bay area <strong>and</strong> beyond support <strong>and</strong><br />
depend on the harbor’s fisheries.<br />
In 2002, the harbor employed 10 individuals including a harbor manager/master, an assistant<br />
harbormaster, <strong>and</strong> other administrative <strong>and</strong> maintenance staff, <strong>and</strong> engaged outside contractors for legal,<br />
end-of-year accounting <strong>and</strong> some other services. <strong>The</strong> Harbor provides a number of goods <strong>and</strong> services to<br />
the commercial fishing industry, as well as other harbor users. Primary items provided to the industry are<br />
berthing for commercial fishing vessels <strong>and</strong> associated amenities. Of the approximately 743 berths at the<br />
harbor, some 455 (Superior Court 2002) are located in South Harbor, where commercial fishing activity is<br />
concentrated. (<strong>The</strong> harbor has no moorings.) Because Moss L<strong>and</strong>ing is a commercial port, commercial<br />
fishing vessels that demonstrate at least $5,000 in commercial fishing revenues for the year are given a<br />
discount on berthing fees. Occupancy rates vary considerably throughout the year, especially because of<br />
the seasonality of several fisheries in the Monterey Bay area <strong>and</strong> in other areas fished by Moss L<strong>and</strong>ing<br />
fishermen. However, priority is given to commercial fishing vessels. As of 2002, about 100 vessels were<br />
on the Harbor’s berth waiting list, but none were commercial fishing vessels.<br />
Monterey Harbor<br />
Although Monterey Harbor’s history dates back to the early 17th century, the development of the present<br />
day commercial fishing industry <strong>and</strong> related facilities began in the latter 19th century. Among the early<br />
fisheries that operated at the Harbor <strong>and</strong> stimulated its growth were the salmon, sardine <strong>and</strong> squid<br />
fisheries. In 1916, the City of Monterey purchased the original wharf (known as Fisherman’s Wharf”)<br />
from the Pacific <strong>Coast</strong> Steamship Company, largely to better provide for the needs of the growing sardine<br />
industry as well as the existing freight business there (Monterey Harbor 2003). In 1926, a second wharf,<br />
Municipal Wharf II, was completed. With the collapse of the sardine fishery after World War II,<br />
Fisherman’s Wharf shifted focus to accommodate growing tourism in the area, while Wharf II became the<br />
focus of commercial fishing activity. Additional development continued through the 1960s <strong>and</strong> 1970s. A<br />
marina with 367 berths was completed in 1960, with 29 berths added in 1975. Bulkheads, launch ramps<br />
<strong>and</strong> others facilities were added as well. In late 1996, further improvements were completed as part of a<br />
$5 million Marina Reconstruction Project (Monterey Harbor 2003). <strong>The</strong> Harbor falls under the<br />
jurisdiction of the City of Monterey, which provides guidance to the Harbormaster <strong>and</strong> 11 additional<br />
permanent, full-time staff, who mange the Harbor’s day-to-day operations including marine operations,<br />
maintenance <strong>and</strong> security.<br />
Monterey Harbor provides a range of goods <strong>and</strong> services to commercial <strong>and</strong> recreational fisheries (<strong>and</strong><br />
other harbor users). As of 2002, the Monterey Municipal Marina had 413 slips, 6 end ties, 180 to 185<br />
moorings, <strong>and</strong> an open anchorage where additional vessels may anchor for up to 30 days in any 6-month<br />
period. <strong>The</strong> Harbor also has 45 to 50 dry storage spaces, which are managed by the Monterey Peninsula<br />
Yacht Club. Harbor amenities <strong>and</strong> services also include electricity, water, pump-out stations, two public<br />
launch ramps, two public hoists, restroom, shower <strong>and</strong> laundry facilities, trash disposal, recycling <strong>and</strong><br />
parking. <strong>The</strong> wharf also includes a parking area where fishermen can work on gear.<br />
5
In 2002, Monterey Harbor hosted seven resident wholesale fish companies, 140 commercial fishing<br />
vessels, two major sportfishing operations, <strong>and</strong> several providers of goods <strong>and</strong> services for commercial<br />
<strong>and</strong> sportfisheries. <strong>The</strong> seafood wholesalers that operate on the wharf included four multi-species buyers,<br />
two operations that focus primarily on wetfish, <strong>and</strong> one live fish buyer. 4 Commercial fishing vessels<br />
include wetfish seiners <strong>and</strong> squid light boats, salmon trollers, groundfish trawlers (five with recorded<br />
l<strong>and</strong>ings that year) <strong>and</strong> a few hook-<strong>and</strong>-line, longline <strong>and</strong> trap vessels that target rockfish, halibut <strong>and</strong><br />
other species. Two marine supply businesses, two boatyards <strong>and</strong> a fuel dock that serve the industry are<br />
located at the harbor as well.<br />
Santa Cruz Harbor<br />
<strong>The</strong> Santa Cruz Port District was created pursuant to a County election in 1950, to “provide <strong>and</strong> manage<br />
small craft harbor facilities in Santa Cruz County” (Santa Cruz Gr<strong>and</strong> Jury 2002), to operate as a regional<br />
facility for “recreation, commercial fishing <strong>and</strong> as a harbor of refuge” (Santa Cruz County Gr<strong>and</strong> Jury<br />
2002: 7-11). <strong>The</strong> harbor was not built, however, until after the 1958 passage of federal legislation that<br />
authorized the Santa Cruz Small Craft Harbor <strong>and</strong> Beach Erosion Project (Santa Cruz Harbor 2003).<br />
Construction of the South Harbor was completed in 1964; construction of the North Harbor was<br />
completed in 1973. <strong>The</strong> Port District comprises the City of Santa Cruz <strong>and</strong> most of Live Oak <strong>and</strong><br />
Pasatiempo.<br />
<strong>The</strong> commercial fishing industry has had a relatively small but consistent presence at Santa Cruz Harbor.<br />
In 2002, about 100 boats delivered fish at Santa Cruz Harbor, including an estimated 6 groundfish<br />
trawlers (who sold to 7 buyers). <strong>The</strong> Harbor was homeport to about 45 of these commercial fishing<br />
operations, 10 of which sell at least some of their catch directly to the public off the boat. <strong>The</strong> commercial<br />
fleet consists primarily of salmon trollers, along with a smaller number of crab, albacore, halibut, rockfish<br />
<strong>and</strong> sablefish fishing operations. In 2002, the Harbor hosted one resident full-service, multi-species fish<br />
buyer <strong>and</strong> two fresh fish retail markets. In addition, three to four other buyers regularly purchased fish<br />
from boats at Santa Cruz Harbor, <strong>and</strong> another 30 to 40 did so less frequently each year between 1998 <strong>and</strong><br />
2005.<br />
Recreational fishing has a significant presence at the harbor as well. Four fishing charter businesses<br />
presently operate out of the harbor (Santa Cruz Harbor 2006). In addition, an estimated 1,200 private<br />
boats, many of them geared for recreational fishing, have permanent berths at the harbor. 5 Port Director<br />
Brian Foss recently estimated that the harbor sees 10,000 launches per year for recreational salmon<br />
fishing alone.<br />
<strong>The</strong> fishery-support businesses based at the harbor included a boatyard, electrical, hydraulic <strong>and</strong> metal<br />
work services, a marine covers shop, a marine supply store, a fuel dock, <strong>and</strong> two dive firms. <strong>The</strong> resident<br />
buyer also manages ice sales on behalf of the harbor. A marine surveyor <strong>and</strong> a small grocery store are<br />
located a block from the harbor. <strong>The</strong> harbor itself provides many goods <strong>and</strong> services <strong>and</strong> has made several<br />
improvements over the past few years that are useful to the commercial <strong>and</strong> recreational fisheries. <strong>The</strong>se<br />
include electricity, water, trash disposal, recycling <strong>and</strong> sewage disposal, oil recycling <strong>and</strong> dump stations, a<br />
dry storage lot <strong>and</strong> parking. Among recent capital improvements at the harbor are an ice production plant,<br />
a new lighthouse <strong>and</strong> an oil reclamation facility. In addition, <strong>and</strong> in contrast to Moss L<strong>and</strong>ing <strong>and</strong><br />
Monterey Harbors, Santa Cruz owns <strong>and</strong> maintains a dredging vessel to help address substantial annual<br />
4 <strong>The</strong> number of groundfish buyers is not disclosed to insure confidentiality.<br />
5 <strong>The</strong> information presented in this paragraph is based largely on Port Director Brian Foss’ April 5, 2006<br />
letter to the PFMC regarding the proposed salmon fishery closures for the 2006 season.<br />
6
dredging needs. 6 Berthing at the harbor includes 950 wet slips (split between south <strong>and</strong> north harbor), 280<br />
dryberths <strong>and</strong> 150 small boat racks. Of the harbor’s approximately 1,090 vessels that used these spaces,<br />
15% were commercial fishing vessels, 35% were pleasure powerboats, <strong>and</strong> 50% were pleasure sailboats<br />
(Santa Cruz Port District 2002). About 1,200 vessels are on the waiting list for slips.<br />
Monterey Bay area Commercial fish l<strong>and</strong>ings, 1998-2005<br />
<strong>The</strong> total annual ex-vessel value of l<strong>and</strong>ings at Monterey Bay area (MBA) ports for 1998-2005, shown in<br />
Fig. 2, ranged from $11.1 to 25.4 million (mean = $18 million). <strong>The</strong> top five MBA fisheries by the same<br />
measure were squid seine, salmon troll, CPS seine, groundfish trawl <strong>and</strong> non-trawl groundfish.<br />
Groundfish trawl l<strong>and</strong>ings (non-whiting) accounted for between about $700,000 <strong>and</strong> $2.4 million, or 9 to<br />
28% (mean = 13%) of total MBA ex-vessel revenues. Groundfish trawl l<strong>and</strong>ings declined from about 25<br />
to 7% of the ex-vessel value of MBA l<strong>and</strong>ings from 1998 to 2005, with values of $2.4 million in 1998<br />
<strong>and</strong> a little more than $700,000 in 2003. L<strong>and</strong>ings of non-trawl-caught groundfish have also declined in<br />
absolute <strong>and</strong> relative terms, whereas squid <strong>and</strong> CPS seine <strong>and</strong> salmon l<strong>and</strong>ings have varied with no clear<br />
trend.<br />
<strong>The</strong> number of boats <strong>and</strong> buyers that participated in the region’s groundfish trawl fishery relative to the<br />
total number of participants was small, with an average of 21 vessels <strong>and</strong> 16 buyers involved in the<br />
groundfish trawl fishery, compared to averages of 415 vessels <strong>and</strong> 99 buyers receiving for all fisheries in<br />
the MBA.<br />
<strong>The</strong> three MBA ports differ markedly in terms of their fisheries overall, <strong>and</strong> in their groundfish trawl<br />
activity from 1998 through 2005. Moss L<strong>and</strong>ing consistently had the greatest ex-vessel value of l<strong>and</strong>ings<br />
among the three ports, followed by Monterey <strong>and</strong> Santa Cruz. Somewhat surprisingly, the groundfish<br />
trawl fishery ranked second in average l<strong>and</strong>ed value for both Santa Cruz (after salmon troll) <strong>and</strong> Monterey<br />
(after squid seine), <strong>and</strong> fourth for Moss L<strong>and</strong>ing. At Moss L<strong>and</strong>ing, the squid seine, CPS seine <strong>and</strong><br />
salmon troll fisheries exceeded the groundfish trawl fishery in average l<strong>and</strong>ed value. Monterey’s top<br />
fisheries were: squid seine, groundfish trawl, non-trawl groundfish, salmon troll <strong>and</strong> shrimp/prawn pot. At<br />
Santa Cruz, the salmon troll fishery ranked first, followed by groundfish trawl, crab pot, halibut set net<br />
<strong>and</strong> albacore troll.<br />
Groundfish trawl l<strong>and</strong>ings account for different proportions of l<strong>and</strong>ed value for each port, <strong>and</strong> this<br />
measure has varied over time. <strong>The</strong>y have accounted for between 9 <strong>and</strong> 46% of total l<strong>and</strong>ed value at<br />
Monterey, 3 <strong>and</strong> 29% at Santa Cruz, <strong>and</strong> 8 <strong>and</strong> 19% at Moss L<strong>and</strong>ing. Groundfish trawl l<strong>and</strong>ings as a<br />
proportion of all l<strong>and</strong>ings have declined by more than 80% at Monterey <strong>and</strong> Santa Cruz since 1998. At<br />
Moss L<strong>and</strong>ing, the change has been less dramatic, with a decline of about 30% since 1998.<br />
6 According to harbormaster Brian Foss, Santa Cruz harbor is the only harbor in California that is<br />
financially responsible for its own dredging, which it finances with user fees.<br />
7
Fig. 2: <strong>Ex</strong>-vessel value of l<strong>and</strong>ings at Monterey Bay area ports for top 5 fisheries <strong>and</strong> all else, 1998-2005.<br />
30,000,000<br />
25,000,000<br />
20,000,000<br />
All else<br />
Non-<strong>Trawl</strong> Groundfish<br />
Groundfish trawl<br />
CPS seine<br />
Salmon troll<br />
Squid seine<br />
2005 Dollars<br />
15,000,000<br />
10,000,000<br />
5,000,000<br />
0<br />
1998 1999 2000 2001 2002 2003 2004 2005<br />
<strong>The</strong> MBA ports differ also in terms of the numbers of fishery participants. <strong>The</strong> number of boats<br />
delivering to Moss L<strong>and</strong>ing ranged from 196 to 352 (mean = 272), <strong>and</strong> the number of dealers ranged from<br />
37 to 72 (mean = 55). Of these, an average of 17 vessels <strong>and</strong> 11 buyers were active in the groundfish<br />
trawl fishery between 1998 <strong>and</strong> 2005. Santa Cruz had, on average, 130 vessels with l<strong>and</strong>ings, <strong>and</strong> 38<br />
buyers with receipts, each year, with an average of five vessels <strong>and</strong> buyers involved in the groundfish<br />
trawl fishery each year. For its fisheries as a whole, Monterey had an average of 123 vessels <strong>and</strong> 25<br />
dealers per year. <strong>The</strong> number of participants in the groundfish trawl fishery averaged five vessels <strong>and</strong><br />
three buyers dealers.<br />
3. Using the PacFIN Data to Inform Fisheries Social Science<br />
As described above, the PacFIN data are a critical source of information to support multiple aspects of<br />
fisheries social science research including: i) identifying <strong>and</strong> sampling populations of fishery participants<br />
(i.e., vessels, vessel owners <strong>and</strong> buyers), ii) evaluating samples achieved in field data collection, iii)<br />
developing basic underst<strong>and</strong>ing of fishing <strong>and</strong> receiving patterns in space <strong>and</strong> time, <strong>and</strong> iv) establishing<br />
benchmarks of l<strong>and</strong>ing <strong>and</strong> receiving patterns for evaluating <strong>and</strong> predicting management outcomes.<br />
<strong>The</strong> PacFIN data are the only comprehensive source of information available to identify populations of<br />
active fishing vessels <strong>and</strong> buyers along the US <strong>West</strong> <strong>Coast</strong>. By analyzing the data, one can identify,<br />
characterize <strong>and</strong> count fishery participants (i.e., fishing operations or vessels, <strong>and</strong> buyers) within <strong>and</strong><br />
across ports, fisheries <strong>and</strong> time periods. This information can be used to shape or refine research questions<br />
<strong>and</strong> approaches, <strong>and</strong> to inform <strong>and</strong> support sampling design. This, in turn, can enhance the efficiency <strong>and</strong><br />
efficacy of field research efforts, enabling the researcher to focus limited resources on fishery participants<br />
8
of greatest relevance to the research, <strong>and</strong> significantly reducing the costs of identifying populations as part<br />
of the field effort. Having a complete sampling frame of vessels <strong>and</strong> buyers is a critical step toward<br />
identifying the people involved in these fishing <strong>and</strong> receiving operations, which still requires field effort<br />
because the l<strong>and</strong>ings data do not reliably identify vessel operators or those who run buying operations (or<br />
crew <strong>and</strong> receiving/processing labor). Because the success of field sampling can be highly variable, the<br />
PacFIN data are also useful for determining the extent to which the sampling goal was achieved, <strong>and</strong> the<br />
ways in which the sample does or does not represent the population.<br />
Analysis of the disaggregated PacFIN data is also instrumental for developing basic underst<strong>and</strong>ing of<br />
fishing <strong>and</strong> receiving patterns in space <strong>and</strong> time. This information is useful not only in its own right, but<br />
as a facilitator of field research. By studying fishing patterns within <strong>and</strong> across fisheries <strong>and</strong> communities<br />
over time, field researchers can develop a basic literacy about the fishery, which is often critical for<br />
meaningful interactions with fishery participants. In addition, this knowledge enhances the field<br />
researcher’s ability to critically evaluate information gained in the field.<br />
In addition, the PacFIN data play a key role in economic analyses by providing benchmark values of exvessel<br />
revenues for l<strong>and</strong>ings by port, <strong>and</strong> the dollar value there of fish inputs to both the fishing <strong>and</strong><br />
processing sectors. This information can be linked with field data on expenditures <strong>and</strong> revenues to<br />
develop <strong>and</strong> refine social accounting matrices at the community level to enable the assessment of<br />
management impacts. In addition to providing benchmark data, PacFIN may also be used as a rich source<br />
of panel data, providing a census of individual vessels over time.<br />
In addition to those described above, we have used PacFIN data in other projects in a variety of ways. For<br />
example, for studies of the California squid <strong>and</strong> wetfish fisheries (Pomeroy <strong>and</strong> FitzSimmons 2001,<br />
Pomeroy et al. 2002), we used the PacFIN data to identify <strong>and</strong> sample the population of vessels <strong>and</strong><br />
buyers engaged in the squid <strong>and</strong> CPS finfish fisheries for field interviews. We also used the data to build<br />
our preliminary underst<strong>and</strong>ing of fishing activity in time <strong>and</strong> space, which enabled us to better engage <strong>and</strong><br />
learn from fishery participants. In our study for California Sea Grant of market channels <strong>and</strong> value added<br />
to fish l<strong>and</strong>ed at Monterey Bay ports (Pomeroy <strong>and</strong> Dalton 2005), we used the PacFIN data as a key<br />
source in integrated archival data analysis in order to describe the fish receiving, processing <strong>and</strong> other<br />
value-adding activities for the region's primary fisheries including groundfish, squid <strong>and</strong> wetfish, salmon<br />
<strong>and</strong> albacore, <strong>and</strong> crab. When PacFIN data were not available to develop a sampling frame of MBA fish<br />
receivers, we resorted to a more labor-intensive <strong>and</strong> far less reliable approach that combined review of<br />
our previous research <strong>and</strong> archival sources, discussions with industry contacts <strong>and</strong> others knowledgeable<br />
of fish receiving <strong>and</strong> h<strong>and</strong>ling in the area, <strong>and</strong> interviews with the Santa Cruz, Moss L<strong>and</strong>ing <strong>and</strong><br />
Monterey harbormasters. Once we obtained permission to use the disaggregated PacFIN data, we were<br />
able to evaluate the sample for its representativeness. We used the data similarly to evaluate the sample of<br />
fishing operations in our recent studies of the commercial fishing industry at Moss L<strong>and</strong>ing harbor <strong>and</strong> of<br />
the larger Moss L<strong>and</strong>ing community (Pomeroy <strong>and</strong> Dalton 2003).<br />
4. An Application of PacFIN Data to Investigate Effects of the Groundfish <strong>Trawl</strong> <strong>Buyback</strong> on <strong>Ex</strong>-<br />
<strong>Vessel</strong> <strong>Revenues</strong> at Monterey Bay Ports<br />
Introduction<br />
This section of the report describes a simple method <strong>and</strong> results of estimating economic effects of the<br />
<strong>West</strong> <strong>Coast</strong> groundfish trawl buyback program in 2003 on ex-vessel revenues of vessels with l<strong>and</strong>ings at<br />
Monterey Bay ports. <strong>The</strong> method compares information from PacFIN on l<strong>and</strong>ings <strong>and</strong> ex-vessel revenues<br />
in 2003 <strong>and</strong> 2004. According to the Limited Entry Permit database managed by NMFS Northwest<br />
Regional (NWR) Office, 274 vessels held permits in the <strong>West</strong> <strong>Coast</strong> limited entry groundfish trawl<br />
fishery at the start of 2003. <strong>The</strong> November 2, 2003 Federal Register notice indicates that 92 groundfish<br />
9
trawl vessels were permanently retired at the end of the year through the Fishing Capacity Reduction<br />
<strong>Program</strong>, also known as the buyback. This type of program reduces the number of vessels, <strong>and</strong> all else<br />
equal, could imply a loss in total ex-vessel revenues. However, trip limits changed from 2003 to 2004,<br />
due to both a reduction in the number of vessels <strong>and</strong> because trip limits for individual groundfish trawlers<br />
are set in bi-monthly increments to meet a total allowable catch (TAC) for the entire <strong>West</strong> <strong>Coast</strong>.<br />
<strong>The</strong>refore, changes in the trips may be decomposed into effects due to changes in the number of vessels,<br />
<strong>and</strong> effects due to changes in the TAC. <strong>The</strong> TAC varies because of rebuilding plans, <strong>and</strong> information<br />
from new or updated stock assessments. In addition, ex-vessel prices may have responded to the buyback,<br />
<strong>and</strong> thus, also affected ex-vessel revenues. <strong>The</strong> combined effects of the reduction in trawl permits after<br />
the 2003 fishery, changes in the TAC for various species, <strong>and</strong> ex-vessel prices imply that effects at a port<br />
(or group of ports) are ambiguous.<br />
To analyze effects of the buyback on the three Monterey Bay ports (Moss L<strong>and</strong>ing, Monterey, <strong>and</strong> Santa<br />
Cruz), we used PacFIN data to produce distributions of l<strong>and</strong>ings <strong>and</strong> ex-vessel revenues for groundfish<br />
species covered by trip limits in the years before <strong>and</strong> after the trawl buyback. For analysis, we selected<br />
vessels that recorded l<strong>and</strong>ings at the three MBA ports with groundfish trawl gear in 2003 <strong>and</strong> 2004. <strong>The</strong><br />
most important statistic in our analysis is total ex-vessel revenues for this group. In total, 20 vessels fit<br />
this description in 2003; of these, 5 (25%) had winning bids in the buyback program <strong>and</strong> were<br />
permanently retired from fishing after the 2003 season. Nine of the 20 groundfish trawlers (45%) had<br />
l<strong>and</strong>ings at Monterey Bay ports again in 2004, <strong>and</strong> 8 more recorded l<strong>and</strong>ings there that did not in 2003,<br />
for a total of 17 active groundfish trawl vessels in 2004. Overall, ex-vessel revenues for these vessels<br />
decreased by about $230,000 (all values in year 2000 dollars) from the end of 2003 to the end of 2004, or<br />
by about 18% compared to the 2003 value. We decomposed the change in ex-vessel revenues between<br />
2003 <strong>and</strong> 2004 into effects of ex-vessel prices <strong>and</strong> l<strong>and</strong>ings. This decomposition shows that ex-vessel<br />
prices generally went up after the buyback, but most of the change in ex-vessel revenues was due to a<br />
decrease in l<strong>and</strong>ings, <strong>and</strong> a direct effect of the buyback may have been 3 fewer groundfish trawlers with<br />
l<strong>and</strong>ings at Monterey Bay ports in 2004.<br />
<strong>The</strong> most striking result of this analysis is the change in the competitive ranking of trawlers in the<br />
analysis. In 2003, 4 of the 5 vessels with winning bids were among the most active trawlers at Monterey<br />
Bay ports, with average ex-vessel revenues from groundfish trawls in California of about $110,000, while<br />
other trawlers that l<strong>and</strong>ed at Monterey Bay ports in 2003 had revenues closer on average to $60,000.<br />
However after the buyback, 9 trawlers from the group that l<strong>and</strong>ed at Monterey Bay ports in 2003 l<strong>and</strong>ed<br />
there again in 2004, <strong>and</strong> this time earned average revenues of $110,000. <strong>The</strong> average of the other 8<br />
trawlers that l<strong>and</strong>ed there in 2004 was closer to $40,000. Although an investigation of how <strong>and</strong> why these<br />
changes occurred is beyond the scope of this report, several factors should be considered. <strong>The</strong> group of<br />
trawlers with recent l<strong>and</strong>ings likely had a competitive edge over other vessels, in terms of both knowledge<br />
of, <strong>and</strong> access to, the fishing grounds <strong>and</strong> markets. To take this line of reasoning a step further, an<br />
increase in trip limits that followed the buyback may have been an opportunity for the group of vessels<br />
with l<strong>and</strong>ings in the prior year to gain a greater share of the market, which could explain the change in<br />
their revenues from 2003 to 2004.<br />
To analyze the potential economic effects of the increase in trip limits from the buyback, we evaluated the<br />
different sets of trip limits in 2003 <strong>and</strong> 2004. Potential ex-vessel revenues (i.e. the value of the trip limits<br />
under prevailing ex-vessel prices) under the 2004 trip limits are greater than in 2003, by about 7% if the<br />
differences are evaluated using 2004 real ex-vessel prices, <strong>and</strong> by about 20% if 2003 real prices are used.<br />
<strong>The</strong>se results suggest that effects of the increase in trip limits on l<strong>and</strong>ings were probably modest, <strong>and</strong><br />
thus, effects on l<strong>and</strong>ings were small in comparison to other factors. <strong>The</strong> final stage of our analysis<br />
confirms this point by developing a simple microeconomic model of what happens if one trip limit is<br />
binding on profit maximizing behavior in a multi-species fishery. PacFIN data show that trip limits were<br />
10
only filled by the most active trawlers during a few periods of the year. Thus, trip limits did not appear to<br />
be a binding constraint for vessels with l<strong>and</strong>ings at Monterey Bay ports in 2003 <strong>and</strong> 2004.<br />
Based on these results, we conclude that the buyback program had at most modest effects on the value of<br />
total ex-vessel revenues for l<strong>and</strong>ings at Monterey Bay ports, with a reduction of l<strong>and</strong>ings that was partly<br />
offset by an increase in prices. However, the buyback program did have important effects on the market<br />
structure at these ports by removing some of the most active vessels. <strong>The</strong> rest of this part of the report<br />
contains sections that describe data <strong>and</strong> the analysis, which is divided into subsections that describe a<br />
decomposition of changes in ex-vessel revenues, potential ex-vessel revenues under alternative sets of trip<br />
limits, <strong>and</strong> an economic model that compares average l<strong>and</strong>ings to trip limits.<br />
Data<br />
To conduct our analysis, we used three sources of archival data. Data on l<strong>and</strong>ings <strong>and</strong> ex-vessel revenues<br />
used in this report include the fish ticket data for all l<strong>and</strong>ings at California ports (shown in in Fig. 1) from<br />
1998 through 2003, extracted from the PacFIN database in July 2006. <strong>Vessel</strong>s with winning bids in the<br />
trawl buyback program were published in the Federal Register in November 2003. Electronic data on the<br />
2003 <strong>and</strong> 2004 bi-monthly cumulative trip limits, including the final in-season adjustments, for <strong>West</strong><br />
<strong>Coast</strong> groundfish were obtained from NMFS NWR Office.<br />
Analysis<br />
We compared a benchmark based on the 2003 PacFIN data to the observed (i.e. actual) outcome in 2004,<br />
<strong>and</strong> calculated several hypothetical outcomes for 2004 that are based on simple decompositions of<br />
observed data <strong>and</strong> trip limits. We compared l<strong>and</strong>ings of each vessel in each trip period to the trip limit,<br />
<strong>and</strong> observed differences among vessels, but these differences may be consistent with our assumptions.<br />
Our economic analysis takes a simple view of the fishery in 2003, <strong>and</strong> assumes the group of 20 trawlers<br />
that l<strong>and</strong>ed at Monterey Ports (Moss L<strong>and</strong>ing, Monterey, Santa Cruz, <strong>and</strong> other Monterey Bay area ports<br />
in PacFIN) in the benchmark period is a representative sample of vessels that may be summarized in<br />
terms of average values for variables that are included in the analysis. By representative, we mean that<br />
each vessel is assumed to have solved an identical optimization problem in terms of its responses to<br />
regulatory constraints, ex-vessel prices, climate, <strong>and</strong> other factors. With this type of assumption, the<br />
aggregate distribution of l<strong>and</strong>ings for a group of vessels may be similar over species <strong>and</strong> ports, if <strong>and</strong> only<br />
if, the underlying dynamic optimization problem solved by each vessel operator in the model has an<br />
equivalent structure.<br />
Dalton <strong>and</strong> Ralston (2006) formally tested this type of hypothesis for several California ports as part of a<br />
study of spatial management in California’s groundfish trawl fishery. <strong>The</strong>y considered the assumption of<br />
using pooled time series data in a dynamic microeconomic model of fishing effort for 10 ports in<br />
California’s limited entry groundfish trawl fishery. That analysis of covariance, which used data from<br />
1981-2001, did not reject the model with pooled data for either Moss L<strong>and</strong>ing or Monterey, <strong>and</strong> Santa<br />
Cruz did not receive a sufficient number of l<strong>and</strong>ings to conduct the test. <strong>The</strong> number of observations (i.e.<br />
nonzero l<strong>and</strong>ings) in a given sample period is an important property of the data for this report, <strong>and</strong> the<br />
most apparent difference among time series for individual vessels is the presence <strong>and</strong> frequency of zero<br />
values. This issue is common to all data on <strong>West</strong> <strong>Coast</strong> trawlers. Developing a rigorous statistical<br />
approach for situations where time series data are ridden with zero values was a goal of the Dalton <strong>and</strong><br />
Ralston study, but in this report, we settle for descriptive statistics (i.e. means), over all values including<br />
zeros for each selection of vessels from PacFIN, <strong>and</strong> these statistics are used with basic microeconomics<br />
to analyze the data. <strong>The</strong> simpler approach is acceptable here because we are concerned mainly with two<br />
consecutive years of data, before <strong>and</strong> after a major structural change in the fishery (i.e. the reduction of 92<br />
11
vessels, or 1/3 of the total coastwide fleet), <strong>and</strong> our interest for this report is not yet in long run dynamic<br />
effects.<br />
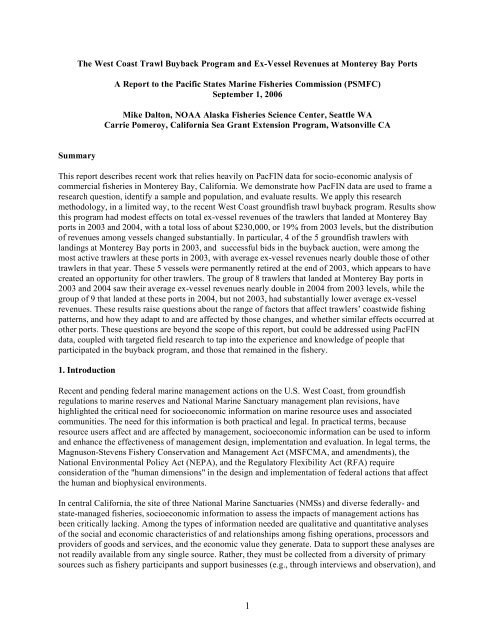
Fig. 3: Total <strong>Ex</strong>-<strong>Vessel</strong> <strong>Revenues</strong> in California of <strong>Trawl</strong>ers that L<strong>and</strong>ed at Monterey Bay Ports, 1998-<br />
2005.<br />
4<br />
3.5<br />
Monterey Bay Groundfish<br />
Other Ports Groundfish<br />
Monterey Bay Other Fish<br />
Other Ports Other Fish<br />
3<br />
2000 Dollars (millions)<br />
2.5<br />
2<br />
1.5<br />
1<br />
0.5<br />
0<br />
1998 1999 2000 2001 2002 2003 2004 2005<br />
We queried PacFIN to select a separate group of vessels for each year 1998-2005 with l<strong>and</strong>ings at the<br />
three major MBA ports <strong>and</strong> other ports in the Santa Cruz/Monterey area (OCM). We examined l<strong>and</strong>ings<br />
for each group at these ports <strong>and</strong> at other California ports. Our analysis is limited to groundfish trawlers,<br />
<strong>and</strong> in particular, the selection criteria were narrowed to three specific gear codes: Groundfish <strong>Trawl</strong><br />
(GFT), Large Footrope (GFL), <strong>and</strong> Small Footrope (GFS). For the group of trawlers in each year, we<br />
calculated ex-vessel revenues for species covered by the groundfish regulations, <strong>and</strong> for all other species,<br />
which include crabs, s<strong>and</strong>abs, <strong>and</strong> sharks, among others. Fig. 3 shows these distributions for each year.<br />
Major restrictions were imposed on the <strong>West</strong> <strong>Coast</strong> groundfish fishery after 1998, <strong>and</strong> ex-vessel revenues<br />
were similar during the period 2001-2003. However after the buyback, ex-vessel revenues fell by about<br />
$230,000 or 19% from 2003, <strong>and</strong> to 2004. <strong>The</strong> reduction in l<strong>and</strong>ings of groundfish in Monterey Bay from<br />
groundfish trawling is noticeable, <strong>and</strong> the increase in l<strong>and</strong>ings of other species is not enough to<br />
compensate for this loss. Below, we investigate whether the reduction in revenues from 2003 to 2004<br />
appears to be primarily due to the buyback, regulations, or changes in ex-vessel prices.<br />
<strong>Buyback</strong> Winners <strong>and</strong> <strong>Vessel</strong>s with L<strong>and</strong>ings at Monterey Bay Ports in 2003<br />
As a first step of our analysis, we linked the trawl buyback winner’s list to the group of 20 vessels in<br />
PacFIN with l<strong>and</strong>ings at Monterey Bay ports in 2003, <strong>and</strong> identified 5 vessels that were on both lists. One<br />
of these reported zero groundfish l<strong>and</strong>ings in 2003, but the other 4 were active <strong>and</strong> came close to the trip<br />
limits in some periods on Dover sole, Flatfish, Sablefish, Thornyheads, or other targets. L<strong>and</strong>ings patterns<br />
are complementary across vessels in some cases. For example, three vessels were close to the trip limit on<br />
Dover sole in some periods. In contrast, another vessel did not come close to the limit for Dover, but did<br />
come close to trip limits on Flatfish. A general result is that while the most active vessels were<br />
12
constrained by one or more trip limits in different periods, total l<strong>and</strong>ings for these 5 vessels were well<br />
below the sum total of their trip limits for each period.<br />
13
Fig. 4: Average 2003 <strong>Ex</strong>-<strong>Vessel</strong> <strong>Revenues</strong> of <strong>Buyback</strong> Winners (5) <strong>and</strong> Other <strong>Trawl</strong>ers (15) from<br />
Grounfish L<strong>and</strong>ings with <strong>Trawl</strong> Gear at All California Ports.<br />
30,000<br />
25,000<br />
<strong>Buyback</strong><br />
Other<br />
2000 Dollars<br />
20,000<br />
15,000<br />
10,000<br />
5,000<br />
0<br />
Dover<br />
Flatfish<br />
Longspine<br />
Other Fish<br />
Petrale<br />
Sablefish<br />
Slope Rockfish<br />
Shortspine<br />
Fig. 5: Average 2003 <strong>Ex</strong>-<strong>Vessel</strong> <strong>Revenues</strong> of <strong>Buyback</strong> Winners (5) <strong>and</strong> Other <strong>Trawl</strong>ers (15) from<br />
Grounfish L<strong>and</strong>ings with <strong>Trawl</strong> Gear at California Ports for All Fish.<br />
90,000<br />
80,000<br />
<strong>Buyback</strong><br />
Other<br />
70,000<br />
2000 Dollars<br />
60,000<br />
50,000<br />
40,000<br />
30,000<br />
20,000<br />
10,000<br />
0<br />
Avila<br />
Santa Cruz<br />
Eureka<br />
Moss L<strong>and</strong>ing<br />
Monterey<br />
Princeton<br />
San Francisco<br />
14
Results in Fig. 4 compare average ex-vessel revenues for the major species (or species groups) l<strong>and</strong>ed by<br />
the 5 buyback winners to other trawlers that l<strong>and</strong>ed at Monterey Bay ports during 2003. <strong>The</strong> major<br />
species are those with an average value of at least $1,000 per vessel in 2003. Species <strong>and</strong> species groups<br />
not presented in Fig. 4 are Arrowtooth, Bocaccio, Chilipepper, Canary Rockfish, Lingcod, Nearshore<br />
Rockfish, Shelf Rockfish, Splitnose Rockfish, <strong>and</strong> Widow Rockfish. <strong>The</strong> most interesting result in Fig. 4<br />
is that buyback winners earned more on average in every category except all other fish. Overall, winners’<br />
average ex-vessel revenues in 2003 were almost $110,000 per vessel, while other trawlers’ ex-vessel<br />
revenues averaged about $60,000. Total ex-vessel revenues for the entire group of trawlers that l<strong>and</strong>ed at<br />
Monterey Bay ports in 2003, for the three specific gear types listed above, are $1.2 million.<br />
Results in Fig. 5 show the geographic distribution of average ex-vessel revenues among California ports<br />
for the 5 buyback winners <strong>and</strong> for the other 15 vessels with l<strong>and</strong>ings at Monterey Bay ports in 2003. Note<br />
that 75% of the winners’ ex-vessel revenues occurred at Moss L<strong>and</strong>ing, 18% at Eureka, 7% at Princeton,<br />
less than 1% Avila <strong>and</strong> Santa Cruz, <strong>and</strong> zero at Monterey <strong>and</strong> San Francisco. For the other vessels in Fig.<br />
5, 48% of their revenues occurred at Moss L<strong>and</strong>ing, 26% at Monterey, 20% at Princeton, 5% at San<br />
Francisco, 2% at Santa Cruz, <strong>and</strong> none at Avila or Eureka.<br />
<strong>Vessel</strong>s with L<strong>and</strong>ings at Monterey Bay Ports in 2004<br />
In 2004, 17 trawlers l<strong>and</strong>ed at Monterey Bay ports, <strong>and</strong> 9 of these had l<strong>and</strong>ings there in 2003, but the<br />
other 8 did not. Results in Fig. 6 show that distinct changes occurred after the buyback. <strong>The</strong> total number<br />
of trawlers to l<strong>and</strong> at these ports in 2004 was 15% lower than in 2003. <strong>The</strong> 9 trawlers that l<strong>and</strong>ed at these<br />
ports both in 2003 <strong>and</strong> 2004 had, on average, much higher revenues in 2004 than those of the group of 8.<br />
Species presented in Fig. 6 yielded average ex-vessel revenues of at least $1,000 to one of the groups in<br />
2004. Average ex-vessel revenues in 2004 were about $110,000 for the group that l<strong>and</strong>ed at Monterey<br />
Bay ports in both 2003 <strong>and</strong> 2004, <strong>and</strong> $30,000 for the group that did not.<br />
Results in Fig. 6, combined with those in Fig. 4, imply that the group of trawlers with l<strong>and</strong>ings at<br />
Monterey Bay ports in 2003 <strong>and</strong> 2004 had below average revenues in 2003, <strong>and</strong> then moved up to replace<br />
vessels retired under the buyback. In fact, average ex-vessel revenues of this group in 2004 are equal in<br />
real terms to the buyback recipients in 2003. Since 5 buyback recipients l<strong>and</strong>ed at Monterey Bay ports in<br />
2003, <strong>and</strong> 9 trawlers are in the group that l<strong>and</strong>ed at these ports in both 2003 <strong>and</strong> 2004, this difference<br />
contributed to higher ex-vessel revenues at these ports in 2004. However, the group of 8 trawlers that<br />
l<strong>and</strong>ed at these ports in 2004 but not 2003 had much lower average ex-vessel revenues, <strong>and</strong> as stated<br />
above, total ex-vessel revenues for these vessels as a group fell in real terms, by about $230,000 between<br />
2003 <strong>and</strong> 2004.<br />
Results in Fig. 7 show the geographic distribution of ex-vessel revenues for trawlers that l<strong>and</strong>ed at<br />
Monterey Bay ports in 2004. <strong>The</strong> groups of vessels that are compared in Fig. 7 <strong>and</strong> Fig. 6 are the same,<br />
between the group that had l<strong>and</strong>ings at Monterey Bay ports in 2003, <strong>and</strong> a group that did not. Note that<br />
trawlers with l<strong>and</strong>ings at Monterey Bay ports in both 2003 <strong>and</strong> 2004 in Fig. 6 <strong>and</strong> Fig. 7 are a subset of<br />
the other trawlers in Fig. 4 <strong>and</strong> Fig. 5. Some properties of the geographic distribution of l<strong>and</strong>ings by this<br />
subset in 2003 apparently carried over to 2004. For example, 45% of ex-vessel revenues for the group<br />
with l<strong>and</strong>ings in both 2003 <strong>and</strong> 2004 occurred at Moss L<strong>and</strong>ing in 2004, 26% at Monterey, 20% at<br />
Princeton, <strong>and</strong> less than 2% at Santa Cruz, which are similar to values for this same group in 2003.<br />
Otherwise, 13% of revenues for this group of trawlers occurred at San Francisco in 2004, compared to 5%<br />
the previous year. <strong>The</strong> other trawlers with l<strong>and</strong>ings at Monterey Bay ports in 2004, but not 2003, recorded<br />
84% of their ex-vessel revenues at Moss L<strong>and</strong>ing in 2004, which is similar to the buyback winners the<br />
year before, followed by 7% at Santa Cruz, 5% at Princeton, 3% at Avila, <strong>and</strong> less than 2% at Ventura,<br />
Santa Barbara, <strong>and</strong> Monterey.<br />
15
Fig. 6: Average 2004 <strong>Ex</strong>-<strong>Vessel</strong> <strong>Revenues</strong> from Grounfish L<strong>and</strong>ings at All California Ports of the 2004-<br />
Only Group of <strong>Trawl</strong>ers (9), <strong>and</strong> the 2003-04 Group of <strong>Trawl</strong>ers (8).<br />
40,000<br />
35,000<br />
2004-Only 2003-04<br />
30,000<br />
2000 Dollars<br />
25,000<br />
20,000<br />
15,000<br />
10,000<br />
5,000<br />
0<br />
Chilipepper<br />
Dover Sole<br />
Flatfish<br />
Longspine<br />
Other Fish<br />
Petrale<br />
Sablefish<br />
Slope Rockfish<br />
Shortspine<br />
Fig. 7: Average 2004 <strong>Ex</strong>-<strong>Vessel</strong> <strong>Revenues</strong> from All Fish at California Ports of the 2004-Only Group of<br />
<strong>Trawl</strong>ers (9), <strong>and</strong> the 2003-04 Group of <strong>Trawl</strong>ers (8).<br />
2000 Dollars<br />
60,000<br />
55,000<br />
50,000<br />
45,000<br />
40,000<br />
35,000<br />
30,000<br />
25,000<br />
20,000<br />
15,000<br />
10,000<br />
5,000<br />
0<br />
2004-Only 2003-04<br />
Avila<br />
Santa Cruz<br />
Monterey<br />
Moss L<strong>and</strong>ing<br />
Princeton<br />
Santa Barbara<br />
San Francisco<br />
Ventura<br />
16
Results above compare actual (i.e. observed) outcomes in terms of l<strong>and</strong>ings <strong>and</strong> ex-vessel revenues in<br />
2003 <strong>and</strong> 2004. <strong>The</strong> next set of results uses data from 2003 as a benchmark for analyzing what might have<br />
happened in 2004 if the buyback had not occurred (i.e. the counterfactual). We use the simplest st<strong>and</strong>ard<br />
empirical methodology that is available for this purpose, namely an algebraic decomposition of the<br />
observed change in total ex-vessel revenues from 2003 to 2004 into effects of a change in prices,<br />
compared to a change in l<strong>and</strong>ings.<br />
Decompositions of the Change in <strong>Revenues</strong> from 2003 to 2004 with <strong>Ex</strong>-<strong>Vessel</strong> Prices<br />
Effects of the buyback program on ex-vessel prices at Monterey Bay ports does not seem predictable from<br />
first principles because of the ambiguity due to geographic factors described in the introduction. In<br />
general, trip limits for trawlers changed both because of the buyback (i.e. fewer vessels over which to<br />
allocate TAC), <strong>and</strong> because of factors unrelated to the buyback program such as changes in the TAC due<br />
to new information about the stock, or due to changes in information about bycatch rates from the<br />
observer program.<br />
Tab. 1: Total Real <strong>Ex</strong>-<strong>Vessel</strong> <strong>Revenues</strong>, L<strong>and</strong>ings, <strong>and</strong> <strong>Ex</strong>-<strong>Vessel</strong> Prices 2003-2004 (Year 2000 $;<br />
l<strong>and</strong>ings in pounds, round weight; values not reported where N
<strong>The</strong> total change in ex-vessel revenues from 2003 to 2004 may be decomposed into an effect of the<br />
change in l<strong>and</strong>ings, <strong>and</strong> an effect of the change in ex-vessel prices. For example, let P t denote the price<br />
level, <strong>and</strong> Q t l<strong>and</strong>ings, in year t. An algebraic decomposition of the change in ex-vessel revenues into a<br />
sum of changes in terms of P t <strong>and</strong> Q t is given by the formula:<br />
P Q ! P Q = P ( Q ! Q ) + Q ( P ! P ).<br />
(1)<br />
2004 2004 2003 2003 2003 2004 2003 2004 2004 2003<br />
After omitting species with l<strong>and</strong>ings by fewer than 3 trawlers in either 2003 or 2004, the total change in<br />
ex-vessel revenues for the two years is a decrease of about $226,000. Evaluating the changes in l<strong>and</strong>ings<br />
using 2003 ex-vessel prices (i.e. the first term on the right-h<strong>and</strong> side of Eq. 1) in the decomposition<br />
formula above implies a decrease in ex-vessel revenues of about $238,000. <strong>The</strong> offset from the increase in<br />
prices using 2004 l<strong>and</strong>ings (i.e. the second term on the right-h<strong>and</strong> side) must add up to the total change,<br />
<strong>and</strong> so the offset term is equal to about $12,000. However, the choice of base year weights in the formula<br />
above was arbitrary, <strong>and</strong> the years used to compare the changes in l<strong>and</strong>ings <strong>and</strong> prices makes a difference.<br />
Using P 2004 in the first term, <strong>and</strong> Q 2003 in the second term, implies the first term is equal to a decrease of<br />
almost $288,000. Again, the second term must add up to the total change, <strong>and</strong> its value in this case is an<br />
increase of about $62,000, which makes sense because 2003 l<strong>and</strong>ings are greater for several species.<br />
Trip Limits in 2003-2004 <strong>and</strong> Potential <strong>Ex</strong>-<strong>Vessel</strong> <strong>Revenues</strong><br />
As discussed previously, vessels that hold a permit in the <strong>West</strong> <strong>Coast</strong> Limited Entry Groundfish <strong>Trawl</strong><br />
Fishery are managed using a system of bi-monthly trip limits for each vessel that are set by the Council<br />
<strong>and</strong> NMFS not to exceed a TAC for the entire coast. Consequently, a direct effect of the 33% reduction in<br />
the number of trawl permits (<strong>and</strong> vessels) was a 51% increase in the level of trip limits during 2004. In<br />
addition, trip limits were affected by changes in managers’ perceptions of stock status (e.g. rebuilding<br />
plans for overfished stocks, new stock assessment results), <strong>and</strong> by updates in estimates of bycatch rates<br />
from the <strong>West</strong> <strong>Coast</strong> Observer <strong>Program</strong>. A direct measure of these differences is obtained by comparing<br />
potential ex-vessel revenues under the trip limits in 2003 <strong>and</strong> 2004.<br />
We conducted a detailed analysis of trip limits in 2003 <strong>and</strong> 2004 with information in documents that are<br />
available on the NMFS NWR website (http://www.nwr.noaa.gov/Groundfish-Halibut/Groundfish-<br />
Fishery-Management/Regulations). Tables in these documents are complicated, particularly in 2004,<br />
because trip limits vary by area, gear type, <strong>and</strong> species. Consequently, we used a few simplifying<br />
assumptions to make sense of the trip limits in our analysis. First, we only considered trip limits in the<br />
southern area (typically south of Cape Mendocino, <strong>and</strong> south of Point Reyes for Slope Rockfish in 2003),<br />
<strong>and</strong> applied these to all vessels in our analysis, despite some l<strong>and</strong>ings that occurred at Eureka in 2003 (see<br />
Fig. 5). Compared to 2004, calculating annual total trip limits was relatively straightforward in 2003,<br />
because these did not distinguish among gear types.<br />
In 2004, trip limits for large <strong>and</strong> small footrope types of trawl gear were different during parts of the year<br />
for species or species groups in Tab. 2 that included, or were closely associated with, overfished stocks,<br />
specifically Bocaccio, Chilipepper, Canary Rockfish, Lingcod, Nearshore Rockfish, Shelf Rockfish, <strong>and</strong><br />
Widow Rockfish. To make the situation even more complicated, different categories of fish or gear were<br />
combined during some parts of the year. For example, Widow Rockfish was included with Shelf Rockfish<br />
in the July-September period, <strong>and</strong> there was no distinction between different size foot ropes for<br />
Chilipepper during the October-December period, but a distinction was made during other parts of the<br />
year. Finally, adjustments were made in some cases to the trip limits in the middle of the bi-monthly trip<br />
period, as occurred at the September 2004 Council meetings. <strong>The</strong>se complications made a precise<br />
comparison of annual trip limits in 2003 <strong>and</strong> 2004 at a disaggregated level impossible. Our major<br />
simplifying assumption was to use the trip limit in 2004 for either the large or small footrope, based on<br />
18
whichever had the greater value. We also ignored issues related to seasonal variations of trip limits, <strong>and</strong><br />
simply added up the six bi-monthly trip limits to get a vessel-level value for total l<strong>and</strong>ings of each species<br />
over the course of a year. <strong>The</strong>se assumptions mean that caution should be used in interpreting the results<br />
below, but even an intra-annual analysis (e.g. at the level of bi-monthly trip limits) would face similar<br />
aggregation problems.<br />
Annual trip limits presented in Tab. 2 are the totals of the bi-monthly limits over the course of a year.<br />
Annual trip limits for trawlers at Monterey Bay ports are presented in the first two columns of the table,<br />
<strong>and</strong> the third column has the 2004 values scaled to match 2003 levels. <strong>The</strong> simplest, <strong>and</strong> perhaps most<br />
natural, c<strong>and</strong>idate for a scaling factor is the ratio of 2004 trawlers divided by the number of 2003 trawlers,<br />
or about 2/3. This scaling factor implies a set of counterfactual trip limits.<br />
Tab.2: Per <strong>Vessel</strong> Annual Trip Limits (pounds), Potential <strong>Revenues</strong> in 2003 <strong>and</strong> 2004 <strong>Ex</strong>-<strong>Vessel</strong> Prices<br />
(XP; Year 2000 $/pound).<br />
Trip Limits<br />
Potential <strong>Revenues</strong><br />
2003 2004 2003 2004 XP 2004 2004*2/3 2003 XP<br />
Arrowtooth<br />
Bocaccio 0 1,500 0 0 758 501 668<br />
Chillipepper 44,000 20,345 13,427 17,775<br />
Canary 2,000 1,700 1,822 1,342 1,141 753 1,022<br />
Cowcod 0 0 0 0 0 0 0<br />
Dover 181,000 271,000 53,535 46,004 68,878 45,460 52,902<br />
Flatfish 420,000 248,000 131,862 182,774 107,924 71,230 51,388<br />
Lingcod 5,200 4,900 4,740 4,515 4,254 2,808 2,948<br />
Longspine 58,500 102,000 39,053 37,813 65,931 43,514 44,942<br />
Other Fish<br />
Nearshore Rockfish 3,600 3,000 3,651 8,120 6,767 4,466 2,008<br />
Petrale Sole<br />
Sablefish 47,000 84,000 40,469 32,510 58,102 38,348 47,737<br />
Shelf Rockfish 3,600 3,600 2,205 3,040 3,040 2,007 1,455<br />
Slope Rockfish 180,000 280,000 57,743 60,884 94,709 62,508 59,282<br />
Splitnose 180,000 280,000 39,715 70,723 110,014 72,609 40,774<br />
Shortspine 58,500 24,800 49,414 91,626 38,843 25,636 13,826<br />
Widow Rockfish 2,600 1,209 798 1,092<br />
Total 424,209 539,351 581,915 384,064 337,818<br />
Per <strong>Vessel</strong> Difference from 2003 0 115,143 157,707 -40,144 -86,390<br />
Group Total 8,484,173 10,787,028 9,892,563 6,529,091 5,742,911<br />
Group Difference from 2003 0 2,302,855 1,408,390 -1,955,081 -2,741,262<br />
<strong>The</strong>re are several ways to calculate potential ex-vessel revenues based on the trip limits in Tab. 2. <strong>The</strong><br />
most obvious way is to assume a hypothetical efficient vessel that l<strong>and</strong>s the full limit of each species, <strong>and</strong><br />
evaluate those l<strong>and</strong>ings at contemporaneous ex-vessel prices. We present values in both 2003 <strong>and</strong> 2004<br />
real prices to reflect our underlying uncertainty about whether the observed price changes were directly<br />
due to the buyback, or to other factors. A column with potential ex-vessel revenues for 2003, evaluated<br />
with 2003 prices, is given in Tab. 2, followed by a column with the 2003 trip limits evaluated at 2004 ex-<br />
19
vessel prices (XP). <strong>The</strong> next column gives potential revenues of 2004 trip limits <strong>and</strong> prices, followed by a<br />
column with the counterfactual trip limits in 2004 prices, <strong>and</strong> finally to complete the table, the last<br />
column of Tab. 2 has the counterfactual trip limits evaluated at 2003 prices.<br />
<strong>The</strong> bottom part of Tab. 2 calculates total ex-vessel revenues in each case, ignoring undefined values (e.g.<br />
Arrowtooth), <strong>and</strong> the difference of each value from the 2003 benchmark. Since ex-vessel prices were<br />
higher in 2004, the value of 2003 benchmark trip limits, evaluated at 2004 prices, is greater than with<br />
2003 prices, in total by about $115,000. In fact, the 2004 trip limits are potentially worth more than those<br />
in 2003 to an individual vessel by almost $158,000, but the counterfactual trip limits (i.e. scaled to 2003<br />
levels) are worth about $40,000 less. Using 2003 prices decreases their value further.<br />
Next in Tab. 2, recall that 20 groundfish trawlers recorded l<strong>and</strong>ings at Monterey Bay ports in 2003, <strong>and</strong><br />
there were 17 such vessels in 2004. Scaling per vessel values in the first two columns of the revenues<br />
portion in Tab. 2 by a factor of 17, <strong>and</strong> other values in this portion by 20, gives estimates of total exvessel<br />
revenues for an entire group of vessels with l<strong>and</strong>ings at Monterey Bay ports under various<br />
combinations of regulations <strong>and</strong> prices in 2003 <strong>and</strong> 2004. <strong>The</strong> bottom line of Tab. 2 gives the difference<br />
of total ex-vessel revenues for a group of 17 trawlers in 2004 under the various cases, <strong>and</strong> total revenues<br />
of the 20 vessels in 2003. Note that using 2004 prices adds $2.3 million to the value of 2003 trip limits,<br />
<strong>and</strong> using 2004 trip limits adds another $1.4 million to potential ex-vessel revenues.<br />
Scaling 2004 trip limits in Tab. 2 to a counterfactual level that matches the number of trawlers in 2003<br />
reduces potential ex-vessel revenues by almost $2.0 million, <strong>and</strong> the value of this modification to trip<br />
limits, evaluated in 2003 prices, is $2.7 million less than the benchmark value of potential ex-vessel<br />
revenues for 2003. Corresponding values are relatively close for the effects of prices, <strong>and</strong> the direct effect<br />
of the buyback, in terms of the change in the number vessels, on trip limits. <strong>The</strong>se results imply that, at<br />
least in terms of potential ex-vessel revenues, the change in ex-vessel prices from 2003 to 2004 had about<br />
the same size effect on potential ex-vessel revenues as did the change in trip limits between these years,<br />
scaled by the appropriate number of active trawlers. Similar calculations could be done for each species.<br />
Multi-Species Production Model <strong>and</strong> Projections of <strong>Ex</strong>-<strong>Vessel</strong> <strong>Revenues</strong><br />
In the final stage of analysis, we formulated a simple multi-species model of ex-vessel profits under trip<br />
limits, <strong>and</strong> calibrated the model to data for 2003, with the intent of using the model to project MBA exvessel<br />
revenues in 2004 without the buyback. Unfortunately, an assumption in the model, that a trip limit<br />
for at least one species is binding, fails to be satisfied (even approximately) for the vessels included in this<br />
analysis. Nonetheless, the model is useful for demonstrating how economic theory applies to the analysis<br />
in this report, <strong>and</strong> in particular, how the purely empirical result of a relatively small impact on ex-vessel<br />
revenues from the buyback is probably accurate.<br />
We describe the model for two species, which is sufficient because it easily generalizes. Assume that<br />
l<strong>and</strong>ing y 1<br />
! 0 <strong>and</strong> y<br />
2<br />
! 0 pounds of species 1 <strong>and</strong> 2 (respectively) has costs given by a function<br />
f ( y , y ) = ( y ) ( y ) such that !, " > 1. We use the behavioral assumption of profit maximization, <strong>and</strong><br />
! "<br />
1 2 1 2<br />
data on l<strong>and</strong>ings from the 2003 benchmark, to calibrate parameters in the cost function. This assumption<br />
may not be satisfied in practice, which is something to explore in fieldwork.<br />
Given ex-vessel prices for each species of p1<br />
<strong>and</strong> p 2<br />
, the profit function of an individual trawler is<br />
#( y , y ) = p y + p y $ ( y ) ( y ) .<br />
(2)<br />
! "<br />
1 2 1 1 2 2 1 2<br />
20
We assume that each trawler maximizes profits subject to trip limits x<br />
i<br />
! 0 , which implies<br />
constraints y i<br />
! x i<br />
for i = 1,2 . Unconstrained solutions to this maximization problem must satisfy a firstorder<br />
condition that implies y 1<br />
<strong>and</strong> y 2<br />
are on a ray through the origin of the form<br />
y<br />
# p ! $<br />
= % & y .<br />
' (<br />
1<br />
2 1<br />
p2"<br />
(3)<br />
In a deterministic model, a vessel operator would maximize profits by increasing y 1<br />
<strong>and</strong> y 2<br />
along the ray<br />
implied by profit maximization until yi<br />
= xi<br />
for at least one species. An example is represented<br />
graphically in Fig. 8. In the figure, there are two rays from the origin. <strong>The</strong> slope of one ray is given by the<br />
ratio of trip limits, x2 / x<br />
1<br />
, <strong>and</strong> the slope of the other is defined in equation (3) above. In the figure, the<br />
slope defined by the ratio of trip limits is greater than the slope of the ray implied by profit maximization,<br />
<strong>and</strong> thus, the optimal choice is to fill the trip limit for species 1, <strong>and</strong> to leave part of the trip for species 2<br />
unused.<br />
Fig. 8: Geometric Representation of Profit Maximization <strong>and</strong> Trip Limits for 2 Species.<br />
y<br />
2<br />
y<br />
! x "<br />
= # $ y<br />
% &<br />
2<br />
2 1<br />
x1<br />
Unused Trip Limit<br />
For Species 2<br />
x<br />
2<br />
y<br />
# p ! $<br />
= % & y<br />
' (<br />
1<br />
2 1<br />
p2"<br />
x<br />
1<br />
y<br />
1<br />
<strong>The</strong> general condition for filling the trip limit of species 1 may be expressed in terms of a ratio of<br />
potential ex-vessel revenues:<br />
!<br />
p x<br />
.<br />
2 2<br />
" # p1x<br />
(4)<br />
1<br />
21
In this case, y1 = x1<br />
is optimal <strong>and</strong> the unused portion of the trip limit for species 2 is given geometrically<br />
by the residual amount in Fig. 8, or algebraically by<br />
# p1!<br />
$<br />
z2 = x2 % & ' x1.<br />
( p2"<br />
)<br />
(5)<br />
Data in Tab. 1 on total ex-vessel revenues in 2003 are used to calibrate the ratio ! /" . Without loss of<br />
generality, we use Dover sole as the numeraire (i.e. Dover is used as species 1 for each comparison to the<br />
other species listed in Tab. 1), <strong>and</strong> note that (2) implies that<br />
!<br />
p y<br />
.<br />
2 2<br />
" = p1 y<br />
(6)<br />
1<br />
A comparison of the calibrated values from (5) to the test condition in (3) implies that, on average in<br />
2003, the calibrated value of ! /" is less than the corresponding ratio of potential ex-vessel revenues for<br />
each of the species, or groups of fish, that were considered in this part of the analysis: Canary, Flatfish,<br />
Lingcod, Longspine, Nearshore Rockfish, Sablefish, Shelf Rockfish, Slope Rockfish, Splitnose, <strong>and</strong><br />
Shortspine. In other words, this analysis implies that trawlers on average were more constrained by the<br />
trip limit for Dover sole in 2003 than the others. Similarly, the calibrated value of ! /" is less than the<br />
corresponding ratio of potential ex-vessel revenues for each of the species, or groups of fish in 2004. Note<br />
that scaling the 2004 trip limits by 2/3, a counterfactual without the buyback, would not affect this result.<br />
<strong>The</strong> upshot of comparisons using the test condition (3) is that the geometric reasoning illustrated in Fig. 8<br />
may be translated into a simple algebraic projection of ex-vessel revenues by rearranging (2), <strong>and</strong><br />
substituting in the trip limit for Dover sole:<br />
p y<br />
# ! $<br />
= % &<br />
' " (<br />
p x .<br />
2 2 1 1<br />
(7)<br />
As above, the projection in (6) can be based on ex-vessel prices from 2003 or 2004, but note that only the<br />
price of the numeraire, in this case Dover sole, is used to project ex-vessel revenues for the other species.<br />
Obviously, (6) represents an extremely simple projection methodology, <strong>and</strong> its primary virtue is a<br />
transparent link to economic theory. While theoretically sound, there is an empirical flaw in (6) because<br />
the aggregate trip limit for Dover, x<br />
1<br />
, is not close to being met in the benchmark, which is another area to<br />
explore in field work. A summary of the aggregate experience with trip limits of trawlers that l<strong>and</strong>ed at<br />
Monterey ports is provided below.<br />
22
Tab. 3: Percentage (%) of Trip Limits Filled by Average L<strong>and</strong>ings at Monterey Bay area ports in 2003<br />
for trawlers with non-zero l<strong>and</strong>ings in each species (group). Species without trip limits, or for which<br />
average l<strong>and</strong>ings are less than 10% of the respective trip limit, in one or more periods in 2003 (e.g. Petrale<br />
sole), are not included in the table.<br />
Number T1 T2 T3 T4 T5 T6 Total<br />
Dover 12 46.1 65.2 48.5 41.4 58.7 48.5 51.2<br />
Flatfish 18 12.0 12.1 15.0 3.3 12.2 6.0 10.1<br />
Lingcod 16 13.4 8.3 9.2 7.9 12.7 1.2 8.8<br />
Longspine 14 49.4 32.0 28.9 26.8 38.3 34.6 34.1<br />
Sablefish 14 45.0 48.2 30.7 39.4 38.4 35.2 38.6<br />
Shelf Rockfish 12 16.6 19.5 25.9 7.7 14.2 12.5 16.1<br />
Slope Rockfish 14 25.3 10.2 4.7 2.6 9.6 9.8 10.4<br />
Shortspine 14 19.7 15.7 10.3 7.0 9.8 10.1 11.6<br />
Results in Tab. 3 show the percentage of each trip limit that is filled by the average amount of l<strong>and</strong>ings in<br />
2003, only for vessels that reported l<strong>and</strong>ings. <strong>The</strong> last column in Tab. 3 adds the mean values for each trip<br />
period, <strong>and</strong> divides these by the corresponding aggregate annual trip limit for 2003 from Tab. 2. <strong>The</strong> main<br />
point of Tab. 3 is to show that trawlers with l<strong>and</strong>ings at Monterey Bay ports in 2003 were not constrained<br />
in many cases by trip limits. Other factors that may have been constraining include dem<strong>and</strong> for fish<br />
l<strong>and</strong>ed at these ports, the costs of fishing, environmental conditions, or other factors. However, an<br />
analysis of these factors is beyond the scope of this report.<br />
Conclusions<br />
This report discusses <strong>and</strong> illustrates the use of disaggregated PacFIN data to assess the impacts of<br />
management actions. We have used a few simple empirical methods to evaluate the effects of a trawl<br />
buyback program in 2003 for the <strong>West</strong> <strong>Coast</strong> limited entry groundfish fishery. Overall, ex-vessel revenues<br />
for l<strong>and</strong>ings of groundfish by trawlers at Monterey Bay ports decreased after the buyback but several<br />
factors were involved. First, the number of vessels that l<strong>and</strong>ed groundfish using trawl gear went down by<br />
15%, which we presume is a direct effect of the buyback. However, the potential effect on ex-vessel<br />
revenues of changes in trip limits used to regulate individual trawlers was smaller, <strong>and</strong> in general, the<br />
corresponding expansion of trip limits does not appear to have noticeably affected ex-vessel revenues,<br />
primarily because the trip limits only appear to be binding for a few of the most active vessels, <strong>and</strong> only<br />
then, during some time periods. A decomposition of the change in ex-vessel revenues from the end of<br />
2003 through 2004 showed that ex-vessel prices on average went up, <strong>and</strong> thus, a decrease in l<strong>and</strong>ings due<br />
to the change in the number of vessels seems to be the primary explanation for the modest loss in the exvessel<br />
value of groundfish l<strong>and</strong>ings by trawlers at Monterey Bay ports.<br />
<strong>The</strong> analysis in this report raises some interesting questions that deserve further attention. <strong>The</strong> most<br />
interesting is about the trawlers that l<strong>and</strong>ed at Monterey Bay ports in both 2003 <strong>and</strong> 2004. <strong>The</strong>se vessels<br />
had some of the lowest ex-vessel revenues in 2003 of the entire group of groundfish trawlers that l<strong>and</strong>ed<br />
at Monterey Bay ports in that year, while vessels that went on to have winning bids in the buyback<br />
program had some of the highest. <strong>Trawl</strong>ers that l<strong>and</strong>ed at Monterey Bay ports in both years went on to<br />
have ex-vessel revenues on par with the buyback winners the year before, <strong>and</strong> trawlers that had not l<strong>and</strong>ed<br />
at MBA ports in 2003 took their place as the low-revenue vessels. An interesting question to follow up<br />
this analysis is whether this same pattern occurred at other ports, <strong>and</strong> to investigate the newcomers’<br />
fishing activities in 2003. A related set of questions pertains to investigating the cause of the weak effects<br />
that we observed in response to the increased trip limits, <strong>and</strong> whether these were specific to Monterey Bay<br />
23
ports. <strong>The</strong>se ports received fewer l<strong>and</strong>ings by groundfish trawlers than some ports further north, <strong>and</strong> thus,<br />
dem<strong>and</strong> for groundfish there might be limited. Alternatively, unfilled trip limits may have been a<br />
temporary state of affairs, but data in the report show that ex-vessel revenues of groundfish trawlers that<br />
l<strong>and</strong>ed at Monterey Bay ports fell again in 2005.<br />
Pursuit of these questions through exp<strong>and</strong>ed analysis of the l<strong>and</strong>ings data together with interviews of<br />
buyback winners <strong>and</strong> those who remained in the fishery would be a logical next step in this process. <strong>The</strong><br />
exp<strong>and</strong>ed l<strong>and</strong>ings data analysis would focus on the longer-term (retrospective <strong>and</strong> prospective) <strong>and</strong><br />
broader spatial patterns of buyback winners <strong>and</strong> remaining trawlers for both groundfish <strong>and</strong> nongroundfish<br />
species. <strong>The</strong> l<strong>and</strong>ings data analysis (in concert with other archival data used here) could be<br />
used to address several questions, including:<br />
• What were the fishing patterns (i.e., distribution of l<strong>and</strong>ings among ports) for trawlers during the<br />
six years prior to the buyback, <strong>and</strong> in the period after the buyback<br />
• What was the distribution of l<strong>and</strong>ings across ports before <strong>and</strong> after the buyback<br />
• Did participants deliver to different subsets of ports before <strong>and</strong> after the buyback<br />
• How did these two sets of patterns vary within the pre-buyback <strong>and</strong> post-buyback periods<br />
Fieldwork would then entail interviews with those who participated in the buyback <strong>and</strong> those who did not,<br />
to characterize both groups of fishery participants <strong>and</strong> their operations, their fishing strategies (in terms of<br />
species targeted, timing <strong>and</strong> location), the factors that influence their use of those strategies, including<br />
how, if at all, the buyback led them to alter their strategies, <strong>and</strong> how their social <strong>and</strong> economic well-being<br />
has changed since the buyback. Questions to guide this work include:<br />
• How do buyback participants <strong>and</strong> those who remain in the fishery compare in terms of their<br />
demographics, fishing experience, fishing practices <strong>and</strong> operations (e.g., vessel size, gear, crew<br />
size).<br />
• Have the buyback participants remained in fishing or left<br />
• What fisheries or other activities are they engaged in<br />
• What factors (e.g., environmental conditions, regulations, market access <strong>and</strong> prices) influence<br />
where they fish <strong>and</strong> the species they target, <strong>and</strong> how<br />
• How has the buyback affected their strategies for adapting to change in these factors<br />
• How have their operating costs changed since the buyback<br />
Although a focused, region-specific study would be fruitful, a larger study of the statewide or, better,<br />
coastwide trawl fishery would afford the most reliable <strong>and</strong> valid underst<strong>and</strong>ing of buyback impacts.<br />
In addition to further illuminating the implications of this buyback (<strong>and</strong> perhaps other management<br />
actions), this work would further demonstrate the efficacy of using the l<strong>and</strong>ings data to inform field<br />
studies to measure management impacts, <strong>and</strong> in turn, the development of better models to predict fishery<br />
responses to management actions.<br />
Acknowledgements<br />
24
Funding for this project was provided by the Pacific States Marine Fisheries Commission, under contract<br />
No. 05-48. Related projects, including those sponsored by California Sea Grant, the Monterey County<br />
Office of Economic Development, <strong>and</strong> NOAA’s Saltonstall-Kennedy Grant <strong>Program</strong>, were drawn upon to<br />
inform our analysis. Dave Colpo (PSMFC) provided the PacFIN data retrieval. William Daspit (PSMFC)<br />
provided an electronic copy of the buyback winner’s list. Yvonne De Reynier (NWR) provided electronic<br />
copies of the trip limits for 2003-2004, including the final in-season adjustments. We gratefully<br />
acknowledge these inputs to our analysis.<br />
References<br />
Dalton, M., <strong>and</strong> S. Ralston. 2006. Empirical evaluation of regional scale marine reserves <strong>and</strong> the<br />
groundfish trawl fishery. California Sea Grant College <strong>Program</strong>. Research Completion Reports. Paper<br />
MA06_01. http://repositories.cdlib.org/csgc/rcr/MA06_01/<br />
Foss, B. 2006. Letter from Santa Cruz Port Director Brain Foss to the PFMC regarding the proposed<br />
salmon fishery closures for the 2006 season. April 5, 2006.<br />
Francis, L.J. 1997. Moss L<strong>and</strong>ing: Transition through time. Prepared for the Monterey Bay Aquarium<br />
Research institute (MBARI). Moss L<strong>and</strong>ing: MBARI.<br />
McEvoy, A. 1986. <strong>The</strong> fisherman's problem: Ecology <strong>and</strong> law in the California fisheries, 1850-1980. New<br />
York: Cambridge University Press.<br />
Monterey Harbor District. 2003. Monterey Harbor History. www.monterey.org/harbor/history.html.<br />
Accessed April 2003<br />
Pomeroy, C., <strong>and</strong> M. Dalton. 2003. Socio-Economics of the Moss L<strong>and</strong>ing Commercial Fishing Industry.<br />
Report to the Monterey County Office of Economic Development <strong>and</strong> the Moss L<strong>and</strong>ing Study Steering<br />
Committee. 121 p.<br />
Pomeroy, C., <strong>and</strong> M. Dalton. 2005. Market Channels <strong>and</strong> Value Added to Fish L<strong>and</strong>ed at Monterey Bay<br />
Ports. California Sea Grant College <strong>Program</strong>. Research Completion Reports. Paper MA05_01.<br />
http://repositories.cdlib.org/csgc/rcr/MA05_01<br />
Pomeroy, C., <strong>and</strong> M. FitzSimmons. 2001. Socio-economic organization of the California market squid<br />
fishery: Assessment for optimal resource management. California Sea Grant Project Report.<br />
Pomeroy, C., M. Hunter <strong>and</strong> M. Los Huertos. 2002. Socio-economic profile of the California wetfish<br />
industry. in D.B. Pleschner, ed., California's "Wetfish" Industry: Its Importance Past, Present <strong>and</strong> Future.<br />
Santa Barbara, CA: California Seafood Council. (www.ca-seafood.org/news/wetfish)<br />
Santa Cruz County Gr<strong>and</strong> Jury. 2002. Review of the Santa Cruz Port District. Santa Cruz County Gr<strong>and</strong><br />
Jury 2001-2002 Final Report. Santa Cruz: Santa Cruz County. Pp. 7-10-7-14. www.co.santacruz.ca.us/grndjury/gjFinalReport01-02.pdf<br />
Santa Cruz Harbor. http://www.santacruzharbor.org/, accessed April 2003 <strong>and</strong> August 2006.<br />
Scofield, W.L. 1954 California fishing ports. Fish Bulletin No. 96. Sacramento: California Department of<br />
Fish <strong>and</strong> Game.<br />
25