Download - IMAWESA
Download - IMAWESA
Download - IMAWESA

Create successful ePaper yourself
Turn your PDF publications into a flip-book with our unique Google optimized e-Paper software.
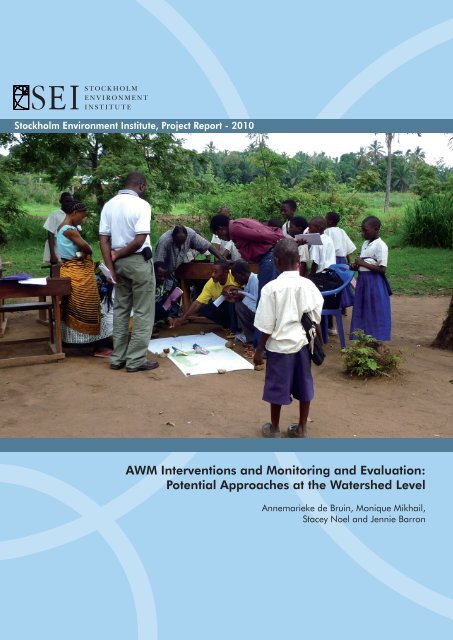
Stockholm Environment Institute, Project Report - 2010<br />
AWM Interventions and Monitoring and Evaluation:<br />
Potential Approaches at the Watershed Level<br />
Annemarieke de Bruin, Monique Mikhail,<br />
Stacey Noel and Jennie Barron
AWM Interventions and Monitoring and Evaluation:<br />
Potential Approaches at the Watershed Level<br />
Annemarieke de Bruin, Monique Mikhail,<br />
Stacey Noel and Jennie Barron
Stockholm Environment Institute<br />
Kräftriket 2B<br />
SE 106 91 Stockholm<br />
Sweden<br />
Tel: +46 8 674 7070<br />
Fax: +46 8 674 7020<br />
Web: www.sei-international.org<br />
Head of Communications: Robert Watt<br />
Publications Manager: Erik Willis<br />
Layout: Richard Clay<br />
Cover Photo: ©<br />
This publication may be reproduced in whole or in part and in any<br />
form for educational or non-profit purposes, without special permission<br />
from the copyright holder(s) provided acknowledgement<br />
of the source is made. No use of this publication may be made for<br />
resale or other commercial purpose, without the written permission<br />
of the copyright holder(s).<br />
Copyright © October 2010<br />
by Stockholm Environment Institute
Contents<br />
Acknowledgements<br />
Abstract<br />
iv<br />
v<br />
1 Introduction 1<br />
2 Overview of the concepts 2<br />
2.1 Monitoring 2<br />
2.2 Evaluation 2<br />
2.3 Looking beyond the planned intervention 3<br />
3 Designing the M&E Framework 5<br />
3.1 Setting up the information questions 5<br />
3.2 Selection of indicators 5<br />
3.3 Measuring the indicators 7<br />
4 A synthesised framework and its applications 9<br />
4.1 Indicator themes for AWM interventions 9<br />
4.2 M&E frameworks of two organisations implementing AWM interventions 11<br />
4.3 Example of a baseline assessment 13<br />
5 Conclusions 14<br />
References 15<br />
Appendices 17<br />
Appendix A: Indicator themes and measures at impact level 17<br />
Appendix B: Indicator themes and measures at project level 20<br />
Appendix C: IDE suggested indicators for M&E 22<br />
Appendix D: Measures used in two IDE-India evaluations 24<br />
Appendix E: Measures used in baseline assessment of resource-based livelihoods 26<br />
Appendix F: Methodology for synthesised frameworks 28
Acknowledgements<br />
This review was carried out as part of the Agricultural<br />
Water Solutions (AgWater Solutions) project<br />
coordinated by the International Water Management<br />
Institute (IWMI). The work was funded by the Bill &<br />
Melinda Gates Foundation. Support for Jennie Barron<br />
was also provided by FORMAS. We appreciate the<br />
contributions from individuals and organisations which<br />
helped by providing documentation for this synthesis.<br />
We would also like to thank the reviewers for their<br />
valuable comments.<br />
iv
Abstract<br />
Agricultural Water Management (AWM)<br />
interventions for development need a welldesigned<br />
monitoring and evaluation framework that<br />
captures the holistic picture of its planned and unplanned<br />
effects on the watershed, or landscape, and livelihoods<br />
of people. An M&E framework is context-specific and<br />
should be developed with local stakeholders to inform<br />
the desired effects and acceptable and unacceptable<br />
limits and thresholds of change. Inclusion of impact<br />
indicators in an AWM M&E framework in addition<br />
to project indicators can help the project capture<br />
and learn from impacts beyond the project area and<br />
timeframe. This will help to fully assess potential<br />
and actual positive and negative changes, including<br />
possible “negative externalities”. Since budgets for<br />
M&E are often limited, it is important to tailor the<br />
M&E framework to the specific goals and context of<br />
the project.<br />
In this report, we present relevant indicator themes that<br />
have been synthesised from several other organisations’<br />
M&E frameworks. Each synthesised M&E framework<br />
has its own specificity, and the indicators it utilises<br />
may be too theme-specific for every AWM project.<br />
However, the synthesised indicator themes represented<br />
in this report can be used to: 1) analyse existing M&E<br />
frameworks to identify gaps or areas of improvement;<br />
2) provide a starting point for thinking about necessary<br />
project-specific indicators; and 3) as a starting point for<br />
developing a baseline assessment.<br />
v
stockholm environment institute<br />
1 Introduction<br />
recent attempt to synthesise impacts of Agricultural<br />
A Water Management (AWM) interventions (Barron<br />
et al., 2010; Joshi et al., 2008) suggests that when these<br />
interventions aim to achieve change for livelihood<br />
improvement in developing contexts, there are multidimensional<br />
effects on natural, social, human, physical<br />
and financial capitals. AWM interventions are designed<br />
to both enhance agricultural production for poverty<br />
alleviation and maintain or enhance environmental<br />
sustainability. Bachelor et al. (2003), however, describe<br />
how the impacts of AWM interventions on livelihoods<br />
and on land and water resources at the larger watershed<br />
scale are not well understood. Effects on, for example,<br />
the wider hydrology of the watershed or on livelihoods<br />
of different groups of people have often been left<br />
unnoticed with, in some cases, long-term negative<br />
effects on future livelihoods (Bachelor et al., 2003;<br />
McCartney et al., 2007). Working together with local<br />
people is required to ensure the multi-dimensional<br />
effects of AWM interventions contribute to change that<br />
is both desirable and sustainable.<br />
Monitoring and evaluation (M&E) frameworks that<br />
are utilised in AWM projects aim to inform shortterm<br />
management of interventions in order to mitigate<br />
negative side effects during the project and in the<br />
long term. However, “monitoring practices often fall<br />
short of their potential for learning in complex rural<br />
development issues that involve collaborative action<br />
by a changing configuration of stakeholders” (Guijt,<br />
2008). AWM interventions particularly work within<br />
a complex context: taking place within a defined<br />
hydrologic unit of a watershed they also take place<br />
within political and social networks that can either<br />
reach far beyond the watershed or occur on a smaller<br />
spatial scale within the watershed. Few M&E systems<br />
attempt to assess impacts beyond the direct project<br />
implementation boundaries (World Bank, 2008).<br />
Further, when evaluation takes place it is often focused<br />
on either biophysical or socio-economic impacts at the<br />
spatial and temporal scale of adoption (i.e. during or<br />
just after project implementation) (Barron et al., 2010).<br />
Rarely does AWM project M&E focus on capturing<br />
both biophysical and socio-economic impacts.<br />
Despite large investments in AWM interventions to<br />
address rural poverty, the impacts remain inconsistently<br />
reported in many projects and initiatives. A World<br />
Bank toolkit (2008), created specifically to assist M&E<br />
in AWM projects, reviewed AWM projects globally<br />
and found several common flaws: projects usually do<br />
not distinguish between monitoring and evaluation;<br />
project M&E often inadequately covered progression<br />
toward overarching goals like poverty alleviation<br />
and the Millennium Development Goals; projects<br />
often only focus on project indicators; and over half<br />
of the projects reviewed did not have any baseline<br />
information with which to compare project impact.<br />
In an effort to address some of these concerns, this<br />
document presents guidelines that can help new and<br />
ongoing AWM intervention projects develop their M&E<br />
framework, taking into account the multi-dimensional<br />
effects of these interventions. First, the report discusses<br />
available communication processes and methods<br />
that can help facilitate learning from changes in the<br />
complex AWM intervention environment. Second,<br />
relevant indicator themes are presented that have<br />
been synthesised from several other organisations’<br />
M&E frameworks. The themes are intended to guide<br />
information flows between stakeholders to assess and<br />
learn from the social, human, financial, physical and<br />
environmental impacts that occur at farm, community<br />
and watershed level, the meso-scale (1-10,000 km 2 ).<br />
Third, to illustrate how these indicator themes can be<br />
used, the M&E frameworks of a global level and a local<br />
level organisation are reviewed and an illustration of a<br />
baseline assessment conducted using the synthesised<br />
indicator list is presented.<br />
1
awm interventions and monitoring and evaluation<br />
2 Overview of the concepts<br />
There is a wealth of monitoring and evaluation<br />
guidelines for project and program management,<br />
many of which are useful for developing M&E to<br />
assess potential multi-dimensional impacts of AWM.<br />
The references at the end of this report are only a<br />
small selection. These guidelines describe four main<br />
purposes for monitoring and evaluation:<br />
• to document the process of implementation;<br />
• to facilitate decision-making by project<br />
management;<br />
• to take remedial action; and<br />
• to learn from experience and provide feedback<br />
(MDF, 2003).<br />
Both monitoring and evaluation are processes<br />
that should be adjusted throughout the project or<br />
programme to address changes such as involved actors<br />
drop out and/or new ones join in, the political situation<br />
shifts, or unforeseen environmental limits are reached.<br />
M&E activities should be part of the project design and<br />
have their own budget assigned. When done correctly,<br />
formal and informal discussions about gathered data<br />
and further analysis by partners and stakeholders can<br />
inform future decisions.<br />
2.1 Monitoring<br />
Monitoring should be thought of as “an evolving<br />
methodology for structuring information flows and<br />
knowledge production and use” (Guijt, 2008). It is not<br />
simply a data-gathering exercise focused on quantitative<br />
data. To monitor in a useful and efficient way, both the<br />
information needs of and the information collected<br />
by the various involved stakeholders must be clearly<br />
determined. First, knowing what data is available from<br />
different sources such as other organisations, academic<br />
literature, and/or reports from previous projects will<br />
help to decide what data is still necessary to collect.<br />
This ensures the project budget is used most efficiently.<br />
Second, to establish context-relevant indicators, many<br />
have advocated for the use of ‘participatory impact<br />
M&E’, which is involvement of stakeholders and<br />
participants in the design, collection and analysis of<br />
data. Participatory M&E can improve the accuracy and<br />
relevance of the data that is collected, it can help to<br />
build local institutional capacity, and can enhance the<br />
capacity of local people to record and analyse change<br />
(IFAD, 2002). It is also found to be more cost-effective<br />
because it utilises local capabilities while increasing<br />
the likelihood that the results of data collection will be<br />
used (Stroud, 2004). Participatory M&E also has the<br />
potential to facilitate learning, but only if it is done in<br />
a context specific way that aims to build trust between<br />
stakeholders and where the intervention takes M&E<br />
as an evolving methodology that guides information<br />
flows (Guijt, 2008; IFAD, 2002). One potential<br />
downside of participatory M&E is that it increases the<br />
burden for local people if the time required for data<br />
collection is significant (Guijt, 1998). This may make<br />
M&E more difficult to sustain in the longer term, due<br />
to its voluntary nature (Stroud, 2004).<br />
There are many references about how to undertake<br />
and set up participatory M&E (IFAD, 2002; Herweg<br />
and Steiner, 2002; Guijt, 1999, Guijt 2008). These<br />
guidelines clarify that adapting to a changing<br />
context should ultimately be done by the participants<br />
themselves because any AWM intervention project<br />
will conclude after a period of time. Planning regular<br />
feedback meetings with stakeholders of the project can<br />
direct changes that need to be made in the activities<br />
conducted by the project. It can also help to reflect<br />
on the measures that are used, the indicators that are<br />
missing, and indicators that capture unnecessary<br />
information. Through joint analysis of data, the<br />
relationships developed can increase learning for all<br />
stakeholders.<br />
2.2 Evaluation<br />
Evaluation, on the other hand, is a systematic and<br />
objective assessment of the design, implementation<br />
and results of an ongoing or completed project,<br />
programme, or policy (OECD, 1991) in order to assess<br />
its relevance, efficiency, effectiveness, impact and<br />
sustainability. To be able to evaluate changes over<br />
time within the wider context of the watershed and<br />
livelihood strategies as shown in figure 1, a baseline<br />
assessment is needed at the start of the project or even<br />
before the design of the intervention. Evaluation can<br />
then be carried out at intervals during the project and<br />
after completion (Hernández, 1995) by comparing<br />
the baseline with monitoring information to assess<br />
the positive and negative impacts of both the direct<br />
implementation area and areas beyond the project<br />
boundary (MDF, 2003).<br />
2
stockholm environment institute<br />
While it is ideal to collect baseline data on a large<br />
number of useful indicators both of project beneficiaries<br />
and people living in areas beyond the project boundary,<br />
in some interventions it is not clear which households<br />
will become a beneficiary and who could be part of<br />
a control group. It can be that the beneficiaries are<br />
self-selecting because only when farmers purchase<br />
a technology do they become part of the project.<br />
In order to create a baseline for evaluation, the data<br />
could be collected for randomly selected households<br />
in an area. When the area of work of the project grows<br />
over time another baseline assessment can be done<br />
when a threshold of, for example, a minimum uptake<br />
of technology has occurred. As budgets are often<br />
constrained it is critical to make setting a baseline an<br />
efficient and useful data gathering exercise that after<br />
analysis provides a holistic view of the watershed or<br />
work area.<br />
The particular timing of the evaluation intervals should<br />
be based on the specific goals and design of the project.<br />
Some projects also evaluate the project after a period<br />
of time has elapsed post completion. This can be a<br />
good way to capture long-term impacts that may not<br />
appear during project implementation or upon project<br />
completion. Thus, if evaluating four times you could<br />
include: baseline, ongoing/intermediate, completion,<br />
and post-completion (Palanisami et al., 2009).<br />
There are three principal ways to evaluate the impact<br />
of a project: it can be done through comparing 1) the<br />
situation before the project and at times during and/<br />
or after the project; 2) what has changed compared to<br />
what was planned to change; and 3) data from direct<br />
participants with data from uninvolved stakeholders<br />
living in another area in the watershed or downstream<br />
from the project. In all three methods, different sources<br />
of data can be used: data from other organisations,<br />
academic literature, and/or reports from other projects<br />
in the area.<br />
It is also important to prepare terms of reference for<br />
the organisation conducting the evaluation in order<br />
to ensure that the information collected and analysed<br />
will answer pertinent questions for the different<br />
parties involved (project staff, participants, internal<br />
and external stakeholders, and funders). For example,<br />
funders are less likely to be interested in detailed<br />
surveys and results of how the uptake of the AWM<br />
technology is going. They are interested in more general<br />
information such as the total number of farmers taking<br />
up the technology in the watershed. Project staff and<br />
participants might want to know about the process of<br />
uptake in more detail to inform new activities in areas<br />
where fewer farmers have taken up the technology.<br />
They can then focus their efforts on overcoming the<br />
difficulties farmers face in, for example, getting the<br />
basic material for the technology together.<br />
2.3 Looking beyond the planned<br />
intervention<br />
Researchers have found that even in projects that<br />
were deemed “successful” due to increased crop<br />
production and income, there were also negative side<br />
effects that were not captured for example in cases<br />
in Sub-Saharan Africa described by McCartney et al.<br />
(2007). Small dam projects did not foresee and capture<br />
information about the increase in incidences of malaria<br />
and schistosomiasis. Batchelor et al. (2003), when<br />
describing the watershed development programmes<br />
in South India, assert: “when negative trade-offs are<br />
taken into account, watershed development has either<br />
no significant water-related impact or has a negative<br />
water-related impact on the livelihoods of poorer social<br />
groups and, in particular, poor women and children.”<br />
One potential cause of this disconnect is that most<br />
projects use monitoring to track progress and assess<br />
efficiency and effectiveness of planned activities.<br />
While this is one major use of monitoring, it only<br />
answers the question ‘Are we doing things right’<br />
and fails to capture the broader question ‘Are we<br />
doing the right things’ (Herweg and Steiner, 2002).<br />
Focusing on project indicators ensures capture of the<br />
former question while impact indicators ensure capture<br />
of the latter. Thus, both project and impact indicators<br />
should be included in monitoring and evaluation for<br />
AWM projects in order to identify and learn from<br />
environmental and livelihoods impacts that stretch<br />
beyond the planned intervention. It can help to inform<br />
short-term adaptive management to mitigate negative<br />
side effects during the project and in the long term<br />
(McCartney et al., 2007).<br />
A method called ‘impact monitoring’ has been<br />
developed to help projects include both types of<br />
indicators. Herweg and Steiner (2002) describe the<br />
process of initiating an impact monitoring system:<br />
impact monitoring changes the emphasis from looking<br />
at pre-defined results to looking at actual change<br />
brought about by the project. In addition, frequent<br />
feedback sessions are held with involved stakeholders<br />
to enable better decision-making and priority-setting<br />
during the project (Hernández, 1995). Another<br />
example of an M&E method that looks at impacts of<br />
a project is called ‘Most Significant Change’ (Davies<br />
and Dart, 2004). This method does not use indicators<br />
or impact hypotheses but collects information based on<br />
stories of people answering a question such as ‘During<br />
3
awm interventions and monitoring and evaluation<br />
Box 1: Major Considerations to Capture Impacts with M&E<br />
To accomplish a shift in focus<br />
from technology adoption to socio-economic<br />
and environmental<br />
impact (Batchelor et al. 2003;<br />
Douthwaite et al., 2003; German<br />
et al., 2006; Stroud, 2004; World<br />
Bank, 2008):<br />
Proper methodology<br />
• Importance of farmer participation/participatory<br />
M&E.<br />
• Need for pre/post assessments<br />
and evaluation.<br />
• Need to compare beneficiary<br />
results with independent<br />
control groups.<br />
• M&E as a process<br />
• M&E should be part of the implementation<br />
process, not just<br />
evaluation at the end.<br />
• M&E during the process<br />
requires a high degree of<br />
flexibility.<br />
• It is an evolving methodology<br />
throughout the project that<br />
aims to facilitate learning.<br />
• Any logical/results frameworks<br />
or indicators lists<br />
should be used more as management<br />
tools or guidelines<br />
than blueprints.<br />
Adaptation<br />
• Insights often come through<br />
identifying farmer innovations.<br />
• Adaptation of the technologies<br />
to local conditions is<br />
critical, instead of delivering<br />
‘finished’ technologies.<br />
• Need to monitor technology<br />
“spillover”.<br />
Social considerations<br />
• Need to embrace a more nuanced<br />
understanding of social<br />
networks and benefits.<br />
• Need to track social innovations<br />
as well as technological<br />
ones.<br />
• M&E should cover institutional<br />
aspects.<br />
• Impact assessments mean different<br />
things to different people.<br />
How to measure impact<br />
are rooted in these different<br />
values (i.e. important to consider<br />
different points of view).<br />
the last month, in your opinion, what was the most<br />
significant change that took place for participants in the<br />
program’ Impact assessment creates more transparent<br />
accountability and helps all involved to gain a greater<br />
understanding of the process (Stroud, 2004). Box 1<br />
delineates some key considerations which can be<br />
specifically relevant for developing M&E for AWM<br />
interventions aimed at large-scale uptake and adoption.<br />
4
stockholm environment institute<br />
3 Designing the M&E Framework<br />
When scaling up AWM technologies, it is important<br />
to ensure sustainability and avoid so-called<br />
“negative externalities”. To accomplish this, cascading<br />
and aggregated impacts by large-scale adoption need<br />
to be captured before and during implementation.<br />
Starting with a well-designed framework helps projects<br />
to appropriately answer questions about the holistic<br />
picture of social, human, environmental, financial and<br />
physical impacts (de Graaff, 2007). The guidelines<br />
(World Bank, 2008; IFAD, 2002; FAO, 1995; DFID,<br />
1999; Layke, 2009; Palanisami et al., 2009; UNEP,<br />
2002; BACP, 2009; de Bruin, 2005; Barron et al.,<br />
2010; MDF, 2002; McCartney et al., 2007; Herweg<br />
and Steiner, 2002) describe several methods for M&E<br />
design, however, all well designed M&E systems<br />
contain a framework of information, questions,<br />
indicators and measures. The framework should suit the<br />
project focus, include different indicators that reflect<br />
the diversity of the project objectives (Palanisami et<br />
al., 2009), and be flexible enough to evolve over time<br />
when changes inside and outside the organisation<br />
take place (Guijt, 2008). There are many existing<br />
approaches that can help to set up the framework such<br />
as the Logical Framework (MDF, 2003), Outcome<br />
Mapping (Earl et al., 2001) (an example of a method<br />
that takes the logical framework a step further) and<br />
Participatory Impact Pathways Analysis that uses an<br />
Outcomes Logic Model (Douthwaite et al., 2007)<br />
(another example of an approach that builds on outcome<br />
mapping). The points made above should however be<br />
taken into account. Projects tend to fill in the matrices<br />
of goals, purpose and activities, indicators and methods<br />
of verification and then leave them untouched until the<br />
project ends five years later. This does not facilitate<br />
learning in the project by different stakeholders.<br />
Also the frameworks can make monitoring feel very<br />
logicical and the intervention a linear process, but<br />
projects work in a complex context with many factors<br />
influencing participants. These framework approaches<br />
can help learning as long as they remain flexible,<br />
context specific and are evaluated over time.<br />
3.1 Setting up the information<br />
questions<br />
Taking into account the different reasons for conducting<br />
M&E, the framework of indicators and measures should<br />
be able to address questions related to the relevance,<br />
effectiveness, efficiency, impact and sustainability of<br />
the project. Examples of these questions (MDF, 2003)<br />
are:<br />
• Has the project addressed the major problems<br />
(priorities) of the main stakeholders<br />
• To what extent has the envisaged improvement<br />
been achieved<br />
• What have been the costs (not only in terms<br />
of dollars but also in terms of dis-benefits) per<br />
produced result and has the time planning been<br />
respected for the various results<br />
• To what extent have the different overall<br />
objectives been achieved What other substantial<br />
indirect effects (positive and negative, planned<br />
and unplanned) can be observed<br />
• How probable is it that the improvements will<br />
continue (to be produced) in the after-project<br />
period<br />
The design and implementation of the framework<br />
should be both context-specific and relevant to all<br />
stakeholders of the project. Before project onset,<br />
scenarios can be discussed with local experts to gain<br />
an understanding of activities that could ameliorate<br />
both positive and negative effects of scaling up the<br />
suggested AWM interventions in the watershed.<br />
Additionally, factors that can mitigate the negative<br />
effects of scale-up should be mapped and discussed.<br />
These steps ensure that the project will be relevant<br />
to the local context and main stakeholders. They also<br />
form a starting point for M&E indicators by asking,<br />
‘what areas are crucial in the watershed and will show<br />
change’ and, ‘what aspects should be monitored to<br />
inform mitigation strategies for the project’<br />
3.2 Selection of indicators<br />
Indicators, when measured, provide information to<br />
answer the relevant information questions about the<br />
project and its impacts. Budget and time constraints<br />
limit what a project is capable of measuring and not all<br />
indicators are equally important to measure. In order<br />
to establish context-relevant indicators and define<br />
the boundaries and thresholds of how much and in<br />
what way the project takes change to be ‘positive’ or<br />
‘negative’, discussion between project stakeholders is<br />
necessary. Box 2 summarises what may be taken into<br />
account when developing the data collection side of<br />
M&E. When designing the appropriate framework,<br />
5
awm interventions and monitoring and evaluation<br />
Box 2: Indicator selection<br />
• When selecting indicators, the following points<br />
should be addressed (de Bruin, 2005):<br />
• A causal relationship between the information<br />
need and the indicator should exist.<br />
• The appropriate methods have to be selected to<br />
measure the indicator.<br />
• These methods should accomplish this with sufficient<br />
accuracy.<br />
• The indicator has to be sensitive enough to represent<br />
a change.<br />
• The criteria should be defined to select the people<br />
that will provide the information.<br />
• Who will collect it The necessary level of participation<br />
should be defined.<br />
• Who will analyse it and when will the results be<br />
discussed with local stakeholders<br />
• The conditions or assumptions under which the<br />
indicator is valid should also be verified.<br />
• The timing of each component of information<br />
collection should be established<br />
several elements must be considered in indicator<br />
selection.<br />
First, spatial and temporal issues must be considered.<br />
It is important to have indicators that take into account<br />
the different spatial levels of impact a project might<br />
have; the indicators should cover the household level,<br />
community level, up-stream and down-stream areas,<br />
and the complete watershed. It is not necessary to<br />
measure each indicator at every scale and with the<br />
same frequency. The timing, spatial resolution and<br />
methodology to measure each selected indicator should<br />
reflect its final use.<br />
Capturing change in external factors is a second<br />
important element to consider during framework<br />
design (see figure 1). An example of an external<br />
factor is climate variability. A project might include<br />
tree planting and try to measure change by looking<br />
at “change in forested area (natural and planted)”.<br />
When a severe drought hits the area and people are<br />
forced to use the wood to make and sell charcoal,<br />
the negative change in forest area should not be fully<br />
attributed to the project. However, project management<br />
should adapt the project strategy to take into account<br />
the effects of the drought. Measuring indicators that<br />
relate to the different levels of project strategy (project<br />
progress, impacts, and external changes) is a way to<br />
ground project impacts in the external context within<br />
which the project is operating. These indicators help to<br />
capture unforeseen consequences or adaptations, and<br />
inform the project about possible negative impacts that<br />
could influence the projects’ success.<br />
Figure 1: A simplified representation of other factors influencing the watershed and livelihoods<br />
context. Arrows indicate the influence of a factor. The dashed line represents time.<br />
6
stockholm environment institute<br />
Thirdly, environmental effects of the technologies<br />
used in an AWM project and the possible up-scaling<br />
of these technologies should be captured and analysed.<br />
Monitoring environmental effects such as changes<br />
in groundwater levels up and down-stream, agrochemical<br />
pollution of water courses, changes in<br />
biodiversity, and greenhouse gas emissions related to<br />
CO 2 and nitrogen can highlight existing and potential<br />
negative side effects of AWM interventions and<br />
point the way toward mitigation strategies. Actively<br />
addressing environmental sustainability in this manner<br />
will increase the likelihood that more positive project<br />
impacts continue after the project period ends. Some<br />
other examples of potentially useful environmental<br />
indicators are shown in Appendices A and B under<br />
‘natural capital’.<br />
A fourth important element is capturing adaptation.<br />
German et al. (2006) argues that the impacts of AWM<br />
are often measured through the number of technologies<br />
developed and introduced into the supply chain,<br />
even though this approach has been long criticised.<br />
This pro-innovation bias encourages a focus on<br />
externally-introduced and fixed technologies which<br />
lack consideration of household and local farming<br />
system characteristics. Projects often fail to capture<br />
the re-invention process that happens after on-farm<br />
adoption. Thus, through solely monitoring adoption,<br />
the full range of impacts such as adaptation and<br />
farmers innovation, may be overlooked (German et<br />
al., 2006). This bias is demonstrated by the fact that all<br />
of the reviewed frameworks (see Section 4.1) did not<br />
include an indicator to capture the adaptation process.<br />
Thus, we included an additional indicator in our list<br />
of synthesised indicator themes in table 1 and added<br />
this in Appendices A and B under “human capital”.<br />
The adoption and adaptation process should not be<br />
considered an “unexpected” impact, but monitored<br />
as part of M&E such that the positive impacts of<br />
adaptation can be absorbed into the intervention itself.<br />
This technology adaptation is a perfect example of<br />
the need for adaptive management shown in figure 1.<br />
M&E provides the feedback loop necessary to learn<br />
from this changed state and incorporate these changes<br />
back into the intervention design.<br />
Lastly, representativeness should be taken into account<br />
when designing M&E. Some areas, livelihoods<br />
strategies or communities may be studied in more detail<br />
than others under the assumption that the change within<br />
these locations or populations is representative of other<br />
similar places or people. Selecting these representative<br />
areas or groups should be done with input from local<br />
people and re-assessed throughout the project duration<br />
to ensure that they are actually representative and not an<br />
anomaly. Section 4.3 provides an example of a baseline<br />
assessment that was set up so that the results of four<br />
in-depth case studies were verified over a larger area<br />
with local people. This resulted in a watershed-level<br />
baseline assessment that saved both time and money.<br />
3.3 Measuring the indicators<br />
Each indicator can be captured by various measures,<br />
and specific measures should be chosen on a projectby-project<br />
basis with stakeholder input. A useful<br />
measure will be one that will capture enough detail,<br />
and not more detail than necessary, for the analysis<br />
to be useful. The level of detail relates to accuracy in<br />
numbers, spatial detail in maps, as well as to the number<br />
of samples or people analysed. Each measure should<br />
contribute to answering an information question.<br />
Where appropriate, measures should be designed to<br />
capture both quantitative and qualitative aspects of the<br />
same indicator.<br />
The qualitative aspects could for example include<br />
perceptions of people on the issue at hand. This<br />
information will help put the collected quantitative<br />
aspects into a context for the analysis. A good example<br />
that shows this added value of capturing perceptions<br />
of people is the assessment of flood impacts. As Peters<br />
et al. (2009) asserts “Mapping of manageability is<br />
more helpful for the local and municipal authorities<br />
than that provided by water depth and duration maps<br />
alone. It helps authorities to recognise those areas<br />
where most vulnerable households can be found in<br />
order to determine the levels of flooding they can<br />
manage and at which point external assistance may be<br />
required.” This study tried to answer when flooding<br />
would be a threat to people. It took into account not<br />
only quantitative data but also perceptions and coping<br />
strategies of people.<br />
That measures should be context specific is illustrated<br />
by this next example of a study that tried to capture<br />
the adaptations farmers made to the proposed AWM<br />
technologies of a project. Farmers in Peru were<br />
supplied with irrigation drip kits (Levelt, 2004). Due<br />
to the low water pressure farmers manually drilled out<br />
the nozzles. One of the measures used in this study was<br />
the distribution uniformity of the adapted irrigation<br />
and comparing this with the original design of the<br />
drip kits. Interestingly, it showed that the foreseen<br />
uniformity based on higher pressure and smaller<br />
nozzles was similar to that of the adapted irrigation<br />
kit of the farmers to their local context. Understanding<br />
why the farmers had changed the kits informed what<br />
aspects were measured. The study then also assessed<br />
7
awm interventions and monitoring and evaluation<br />
how the adapted technology was distributed beyond<br />
the direct beneficiaries of the project and what<br />
markets influenced the adapted design. In each AWM<br />
intervention different adaptations will be made based<br />
on the local difficulties farmers have to overcome and<br />
adapt to. Therefore measures to assess why and how<br />
farmers adapt the technology will be different for each<br />
intervention.<br />
Measuring indicators can be done in many ways,<br />
at different spatial and temporal scales and with as<br />
many or as little measurements, interviews or surveys.<br />
Most importantly, all the collected data will need<br />
to be analysed and should contribute to answering<br />
the information questions set before data collection<br />
is undertaken. Similar to the other elements of the<br />
monitoring and evaluation framework, measures<br />
should be reviewed before another phase of data<br />
collection takes place to ensure necessary changes are<br />
made.<br />
8
stockholm environment institute<br />
4 A synthesised framework and its applications<br />
AWM interventions contain a wide range of<br />
different components including agricultural and<br />
forest production, land-use changes, biodiversity and<br />
conservation measures, water resources management,<br />
and a multiplicity of associated poverty alleviation<br />
efforts. Keeping track of the various elements and<br />
disentangling their impacts is a complex task. Yet<br />
many frameworks exist that can lend indicators for<br />
AWM intervention M&E. In an effort to create a<br />
general framework that highlights important themes<br />
yet is not a blueprint for every project we synthesised<br />
several existing frameworks. The themes can guide<br />
the design of information flows between stakeholders,<br />
help identify gaps in existing M&E frameworks, or<br />
be used as a starting point for developing M&E for a<br />
new AWM intervention or investment. The synthesis<br />
reviewed M&E documentation by a wide range of<br />
organisations with expertise in AWM interventions<br />
(World Bank, 2008; IFAD, 2002; Hernández, 1995;<br />
DFID, 1999; Layke, 2009; Palanisami et al., 2009;<br />
UNEP, 2002; BACP, 2009; de Bruin, 2005; Barron et<br />
al., 2010). Further details about the methodology can<br />
be found in Appendix F.<br />
The frameworks all cover M&E from a different<br />
angle, often related to their organisational interest or<br />
thematic aim. For example the World Bank Toolkit<br />
specifically focuses on AWM projects, but the World<br />
Resources Institute working paper by Layke (2009)<br />
aims to improve ecosystem services indicators of<br />
AWM interventions. Consequently, not all sources<br />
cover the same breadth of indicators or indicators<br />
for all of the five livelihood assets. Financial capital<br />
is covered by all of the sources, although the World<br />
Bank Toolkit and Palanisami et al. (2009), for IWMI-<br />
ICRISAT, contain the most detailed indicators to<br />
capture changes in financial capital. Human capital is<br />
covered by all sources except for the BACP; the BACP<br />
source specifically hones in on indicators that relate to<br />
products and policies for enhancing biodiversity.<br />
Indicators to capture change in natural capital, such<br />
as changes in water resources, land use, vegetative<br />
cover, biodiversity, etc. are described by all sources<br />
to varying degrees. However, the IWMI-ICRISAT<br />
framework (Palanisami et al., 2009) includes the<br />
largest number of natural capital indicators (excluding<br />
water quality). The FAO framework (Hernández, 1995)<br />
about watershed management projects covers resource<br />
availability, hydrology and soil and production-related<br />
indicators. The World Bank Toolkit mainly focuses on<br />
production and water quality. Interestingly, the World<br />
Bank Toolkit has a strong emphasis on indicators<br />
related to physical assets whereas DFID’s focus is<br />
predominantly on capturing change in social capital.<br />
We conclude that each of these frameworks has been<br />
developed with their own specific agenda and aim, and<br />
therefore, the indicators they utilise may be too themespecific<br />
for every AWM project. However, when<br />
combined, the various frameworks give a balanced set<br />
of M&E indicators to capture intended and unintended<br />
impacts of AWM interventions.<br />
The different frameworks also focus on different<br />
scales. The FAO reference describes indicators that<br />
should be measured at the watershed scale whereas<br />
the World Bank Toolkit focuses primarily on projectlevel<br />
indicators. The BACP indicators span both the<br />
project level and policy level. The WRI framework<br />
by Layke (2009) highlights the need for indicators to<br />
be measured at different levels - local, national and<br />
regional - and different times to capture impacts on all<br />
of the flows of ecosystem services.<br />
4.1 Indicator themes for AWM<br />
interventions<br />
Since budgets for M&E are often limited, it is important<br />
to tailor the M&E framework to the specific goals<br />
and context of the project. It is useless to spend time<br />
and money collecting information that is irrelevant<br />
to the project at hand. However, the synthesised list<br />
of indicator themes in table 1 can provide a starting<br />
point for an AWM project team to think through the<br />
more specific indicators and locally valid measures for<br />
their project M&E. The five capitals (financial, human,<br />
natural, physical and social capital) of livelihood assets<br />
within the sustainable livelihoods framework (DFID,<br />
1999) are used to ensure a holistic picture of assessment.<br />
In this way, the social, human, and environmental<br />
indicators are included along with the financial and<br />
physical indicators that are more commonly part of<br />
M&E of AWM interventions.<br />
Both project and impact indicator themes are included<br />
(as discussed in section 2.1 above.) Examples<br />
of possible measures for each indicator theme in<br />
table 1 are shown in Appendices A and B. Not all<br />
example measures are valid or useful for every AWM<br />
intervention. Indicator themes at project level and<br />
the measures in Appendix B capture those that are<br />
specifically focused on keeping the project on track<br />
to reach milestones through measurement of inputs<br />
9
awm interventions and monitoring and evaluation<br />
Table 1: Impact and project indicator themes for AWM interventions<br />
Livelihood capital Impact indicator themes Project indicator themes<br />
Financial capital<br />
Income and wealth<br />
Agricultural production<br />
Cost of production<br />
Sources of income<br />
Assets, savings<br />
Access to capital/credit<br />
Business development<br />
Income and wealth<br />
Cost of production<br />
Assets, savings<br />
Buyers and other value-chain participants of the<br />
targeted commodities integrate biodiversity criteria<br />
in the value chain<br />
Financial products, biodiversity-friendly, available<br />
to the actors in the targeted commodities and<br />
countries<br />
Economic returns to investment in AWM intervention<br />
Human capital<br />
In and out migration<br />
Agricultural training<br />
Literacy level<br />
Schooling<br />
Health<br />
Food security/nutrition<br />
Labour<br />
Technology adaptation<br />
Agricultural training<br />
Technology adaptation<br />
Natural capital<br />
Physical capital<br />
Social capital<br />
Soil<br />
Quantity and quality of water<br />
resources<br />
Land use<br />
Forest/vegetation<br />
Biodiversity management<br />
Production related<br />
Irrigation related<br />
Infrastructure<br />
Water infrastructure<br />
Housing<br />
Changes in knowledge exchange<br />
Institutions/governance for resource<br />
management<br />
Financial organisations<br />
Collective action<br />
Empowerment<br />
Equity<br />
Soil<br />
Quantity and quality of water resources<br />
Production related<br />
Water infrastructure<br />
Institutions/governance for resource management<br />
Policies<br />
Financial organisations<br />
Empowerment<br />
and outputs. Project indicator themes and measures in<br />
Appendix A focus on indicators that may be important<br />
at the watershed level and indicate the indirect effects<br />
of the intervention. Here we also include indictors<br />
that could relate to external factors (figure 1 in section<br />
3.2). An example is the rainfall throughout the year (in<br />
appendix A: natural capital, hydrology).<br />
In some cases, the indicator theme could be applicable<br />
either as a project or impact indicator. Depending on the<br />
project details, measurement of change in, for example,<br />
“assets and savings” can be either attributed to the<br />
project as an output, or could be considered an impact.<br />
If the project contains a significant market-development<br />
component, this theme could be considered to track<br />
project progress. However, if the project has a minimal<br />
market-development component, any change in this<br />
theme could be an indirect effect of the project’s work<br />
or might have happened for other reasons. Thus, it<br />
would be considered an impact, or even en external<br />
10
stockholm environment institute<br />
factor. This example further highlights the conclusion<br />
that the synthesised list of indicator themes are useful<br />
only as a starting point and each project must select<br />
the most valuable indicators and measures for the goals<br />
and potential impacts at hand.<br />
An important part of AWM interventions is addressing<br />
gender issues. The indicator themes of empowerment<br />
and equity under ‘social capital’ both relate to gender<br />
issues, but they go further. They focus on equity for,<br />
and empowerment of, any group in society that is<br />
marginalised because of gender, age, religion, ethnicity<br />
or livelihood strategy. The example measures in<br />
appendices A and B for these two themes should be<br />
read using this broader focus.<br />
4.2 M&E frameworks of two<br />
organisations implementing<br />
AWM interventions<br />
One important use of the synthesised indicator themes<br />
is reflection on existing frameworks to reveal gaps or<br />
useful additions. As an example, we reviewed some of<br />
the M&E indicators of two organisations that work at<br />
different scales. The first organisation, International<br />
Development Enterprises, works globally with several<br />
different country offices and programmes. The second<br />
organisation, IDE-India1, works on projects within<br />
India. Both aim to develop supply chains for AWM<br />
technologies in order to improve the condition of<br />
smallholder farmers.<br />
International Development Enterprise (IDE)<br />
IDE is one organisation involved in implementing<br />
interventions that use AWM technologies. From<br />
their website (IDE, 2010) “IDE is a social enterprise<br />
dedicated to ending poverty in the developing<br />
world not through handouts, but by helping farm<br />
families access the tools and knowledge they need to<br />
increase their income.” To accomplish this goal, IDE<br />
attempts to strengthen the supply chains within which<br />
smallholders operate. Local distributors and dealers are<br />
trained to manufacture and sell irrigation technologies<br />
such as drip irrigation kits and treadle pumps while<br />
IDE business associates help farmers with extension<br />
services and connection to markets.<br />
1 IDE-India was historically one country program of IDE.<br />
However, IDE-India successfully spun off from IDE in<br />
2004. They are now completely autonomous organisations<br />
with different M&E systems, although they maintain<br />
a partnership.<br />
IDE developed their M&E framework (IDE, 2007) for<br />
the purposes of accountability to stakeholders, external<br />
communication, and internal learning for improved<br />
decision-making. The framework standardises M&E<br />
across the different country programs through the<br />
use of multiple tools. These tools include rolling<br />
baseline households surveys, farming system case<br />
studies, livelihood impact case studies, qualitative<br />
studies, natural resource impact assessments, focus<br />
group discussions with smallholders, and customer<br />
satisfaction surveys. This combination of tools enables<br />
IDE to monitor a set of indicators which are presented<br />
in Appendix C. We compared their indicators with the<br />
indicator themes we suggested in table 1. Because IDE<br />
focuses on bringing AWM interventions to smallholder<br />
farmers through market actors, they have two<br />
additional indicator themes that were not included in<br />
table 1: “customer satisfaction” and “markets”. These<br />
apply specifically to their approach and may or may<br />
not be valid for other AWM intervention programmes<br />
or projects. This once again illustrates that indicators<br />
should be made relevant to the organisation’s specific<br />
goals and approach. The global framework explicitly<br />
mentions that the indicators can be adapted to<br />
increase relevance to each country context and project<br />
intervention. To make the process more cost effective<br />
and help build local capacity, IDE could encourage the<br />
country programs to establish their indicators together<br />
with local communities and stakeholders (as discussed<br />
in chapter 3).<br />
The comparison in Appendix C shows that some natural<br />
capital indicators are included in IDE’s framework,<br />
but these could be expanded upon to include impacts<br />
that go beyond the direct effects of the AWM<br />
interventions to ensure environmental sustainability<br />
of the interventions in the long term. The organisation<br />
is undertaking a two-year Environmental Impact<br />
Assessment to develop a tool that aims to “identify,<br />
evaluate and monitor the potential environmental<br />
impacts of existing and proposed projects and act as<br />
a screening tool for project feasibility in relation to<br />
environmental sustainability” (IDE, 2009). They are<br />
using two country programs to test and refine the tool.<br />
Once completed, the tool will assist all IDE country<br />
programs in assessing the potential environmental<br />
impacts of proposed projects prior to their inception<br />
and mitigate these from the onset of the project. The<br />
tool emphasises the assessment should be done for both<br />
participant and potential non-participant impacts, for<br />
example, the effects on those living downstream of the<br />
project area. The tool will help projects to assess, among<br />
others, impacts on water resources, irrigation, crops,<br />
domestic water supplies, flooding, agro-chemical use,<br />
ecology, and human health; a wide range of indicators<br />
11
awm interventions and monitoring and evaluation<br />
that can help improve the M&E of existing and future<br />
IDE projects to address environmental impacts.<br />
IDE-India<br />
IDE-India is a country level organisation with a similar<br />
approach to IDE. In order to review M&E at the<br />
country level, we interviewed some people involved<br />
with M&E at IDE-India and analysed some of their<br />
evaluation documents. IDE-India’s organisational<br />
structure has five layers: national office (Delhi);<br />
regional offices; field offices; business associates;<br />
dealers/distributors; and manufacturers. Information<br />
on both the smallholders and market participants<br />
is collected when each piece of equipment is sold;<br />
farmers obtain a warranty card based on their address.<br />
Monitoring at IDE-India is done on a monthly basis in<br />
order to compile this information and make it available<br />
at the various administrative levels of the organisation.<br />
The geographic information helps IDE-India to target<br />
promotional activities to areas with lower sales and<br />
training activities in areas with higher sales. The main<br />
aim of their monitoring is to provide feedback to the<br />
local level staff. The information captured through<br />
monitoring becomes input for periodic evaluations<br />
and is used to select farmers for interviews and other<br />
surveys that are part of the evaluation process.<br />
IDE-India’s evaluation strategy includes an internal<br />
review of their work every two years and external<br />
reviews at times requested by donors. The indicators<br />
used for internal evaluations have some, but not<br />
complete, overlap with those specified by donors. Their<br />
systematic evaluation provides them great benefit, and<br />
many impact indicators are thoroughly covered. Yet, by<br />
comparing their internal evaluation indicators with the<br />
indicator themes we developed in table 1, it becomes<br />
evident that some topics could be more thoroughly<br />
addressed to improve both understanding of impact<br />
and efficiency of future evaluation processes (see<br />
Appendix D). In the cases where a suggested indicator<br />
theme was not found in the reviewed reports, the table<br />
states that this theme has not been covered. There<br />
were two reports reviewed: one internal evaluation<br />
and one external evaluation. The internal assessment<br />
was done by The Energy and Resources Institute<br />
(TERI) and is a socio-economic-techno-environmental<br />
assessment of the treadle pump (IDE-India, 2007); it<br />
also assessed the potential for mitigating green house<br />
gases through using the pump. The external evaluation<br />
was done for the Lemelson Foundation and is a study<br />
of the social, economic and environmental impacts of<br />
the drip irrigation kit among customers in the states of<br />
Maharashtra, Madhya Pradesh, Karnataka and Tamil<br />
Nadu (IDE-India, 2008a). All measures in this report<br />
were asked in the context of ‘has adoption of Drip<br />
led to…’. While it is likely that internal evaluations<br />
remain consistent, external evaluations may include<br />
additional or different indicators than those presented<br />
in the Lemelson Foundation external report. For<br />
example, an external evaluation conducted for the<br />
donor Acumen Fund entitled ‘A fairy tale for all A<br />
Rapid Assessment of IDEI’s Treadle Pump Programme<br />
in Uttar Pradesh, and its Impact on Children’s Welfare’<br />
(IDE-India, 2008b) focuses heavily on the social and<br />
human capitals, which is a marked difference from<br />
the Lemelson Foundation external report. However,<br />
the two reviewed reports provide a good example of<br />
the types of assessments made on IDE-India’s work.<br />
Through comparing the assessment indicators with<br />
those in the livelihoods capitals table, it is possible<br />
to identify which areas could benefit from additional<br />
attention.<br />
The comparison in Appendix D shows that social<br />
and human capitals are both captured through<br />
only one or two measures in both the internal and<br />
external evaluation examples. As mentioned above,<br />
the Acumen Fund evaluation report contained much<br />
more information on the impacts on human and social<br />
capitals. In order to capture the impacts of AWM in a<br />
more holistic way, IDE-India could potentially benefit<br />
from including the social and human capital indicators<br />
contained in the Acumen Fund evaluation report in all<br />
of their internal and external evaluations.<br />
In both evaluations, the impact of the technology was<br />
assessed by interviewing both users and non users<br />
of the technology. This made it possible to highlight<br />
the barriers to purchasing the technology. It also<br />
highlighted the negative impacts on those who are<br />
not able or do not want to adopt the technology. A<br />
comparison was often made between the ‘before’ and<br />
‘after’ situation of adopting the AWM technology.<br />
Both types of comparisons, as discussed in section<br />
2.3 above, give a contextualised, yet different, set of<br />
insights into the impacts.<br />
The TERI evaluation includes a groundbreaking<br />
assessment of CO 2 emissions that can be mitigated<br />
through using the treadle pump. Similar assessments<br />
should be made by other organisations or projects when<br />
AWM interventions stimulate the use of diesel pumps<br />
or motor pumps. Beyond the emissions assessment,<br />
however, neither the TERI nor the Lemelson Foundation<br />
evaluation assessed the effects of farmers using drip or<br />
treadle pump technology beyond the farmers’ fields at<br />
scales of the community or the watershed. Although<br />
neither evaluation claimed to focus on environmental<br />
impacts, there is still room for improvement in that<br />
area. There are several examples of impacts that could<br />
12
stockholm environment institute<br />
be included in future evaluations: effects on soils, for<br />
example the effect of increasing land intensification<br />
through availability of irrigation on soil fertility; on<br />
hydrology, especially groundwater levels and water<br />
quality due to typical increases in agro chemical<br />
application for increased production; and the effects<br />
on other natural resources in the area such as forests<br />
or biodiversity. Similar to the conclusion for IDE, it is<br />
important for IDE-India to capture information about<br />
environmental impacts, as discussed in section 3.2,<br />
and to go beyond the direct effects of drip or treadle<br />
pump technology which are currently the main focus<br />
of IDE-India’s evaluations. This will help the AWM<br />
interventions to be sustainable in the long term.<br />
4.3 Example of a baseline assessment<br />
Monitoring and evaluation is best begun with a<br />
baseline assessment; then periodic evaluation against<br />
the baseline will help a project or programme to assess<br />
change. The watershed-scale Baseline Assessment of<br />
the AWM Solutions project in the Mkindo watershed<br />
of Tanzania (Cinderby et al., 2010) illustrates how<br />
the indicator themes in table 1 can also be used as a<br />
starting point for developing a baseline assessment.<br />
The aim of the work was to assess the current use of,<br />
and dependency on, local natural resources of different<br />
livelihood strategies in the watershed to understand the<br />
potential for AWM technologies. From this baseline, a<br />
new AWM intervention project could be designed to<br />
consider the diverse number of livelihood strategies<br />
and AWM technologies already existing within the<br />
area.<br />
Researchers used the indicator themes in table 1 to guide<br />
the selection of potential measures. These measures<br />
were then discussed with local partners and adjusted to<br />
make them more appropriate to the local context. For<br />
example, a question was added after discussion with<br />
local partners: “do you have issues with other users of<br />
land or water” Conflicts have previously developed<br />
in the area between pastoralists and those dependent<br />
on agriculture, so the partners felt it was an important<br />
aspect of livelihoods to capture. Appendix E shows the<br />
measures used in the baseline assessment for Tanzania.<br />
In order to conduct a baseline assessment of the<br />
Mkindo watershed with a small budget and short timespan,<br />
four communities were selected for in-depth<br />
case studies. The results of this work took the form of<br />
livelihood narratives, which described the dependency<br />
of each livelihood strategy on natural resources. The<br />
communities were selected during discussions between<br />
the project team and the district authority. The criteria<br />
included: their position in the watershed (both upstream<br />
and downstream); accessibility of surface water;<br />
access to different water management technologies<br />
(including formal canal irrigation systems); the range<br />
of livelihood strategies present in each location<br />
(including crop producers and livestock specialists)<br />
and ease of engagement (in terms of both physical<br />
access and existing linkages to village councils or<br />
community representatives). The resulting narratives<br />
were verified as relevant throughout the watershed in<br />
a meeting with experts who worked within a portion of<br />
or the entire watershed.<br />
A range of AWM technologies are already in use<br />
in the area and participants had ideas about ways to<br />
improve their crop and livestock management. Thus,<br />
the results from the baseline assessment could be<br />
useful for a new AWM initiative to create a package of<br />
AWM interventions that fits local concerns and takes<br />
into account already existing AWM technologies. The<br />
collected information could be compared with future<br />
surveys or participatory mapping activities to assess<br />
change over time due to the project and change outside<br />
of the project’s influence. For example, the ‘reliability<br />
of water sources’ is an indicator that could highlight<br />
depletion of the water table in certain areas that could<br />
also have a reciprocal effect on the success of the<br />
project. The assessment could also be used to create<br />
important institutional links between the project staff<br />
and local organisations and people.<br />
This chapter provides a way in which new or ongoing<br />
AWM interventions can keep track of their wide<br />
range of different components. Creating a useful<br />
M&E framework is a complex task, however the<br />
synthesised indicator themes represented in table 1<br />
can be a starting point for thinking about necessary<br />
project-specific indicators. The examples of IDE and<br />
IDE-India illustrate how existing M&E frameworks<br />
can be analysed using the table to identify gaps or areas<br />
of improvement. The work in Tanzania shows how the<br />
table could be used as a starting point for developing a<br />
baseline assessment.<br />
13
awm interventions and monitoring and evaluation<br />
5 Conclusions<br />
• AWM interventions need a well-designed<br />
monitoring and evaluation framework that<br />
captures the holistic picture of its planned<br />
and unplanned effects on the watershed and<br />
livelihoods of people.<br />
• An M&E framework is context-specific and<br />
should be developed with local stakeholders to<br />
inform the acceptable and unacceptable limits and<br />
thresholds of change.<br />
• An M&E that is designed before the project and<br />
includes a baseline will support learning during<br />
the project to help mitigate or even avoid negative<br />
side effects of developing water resources for<br />
agriculture ensuring environmental sustainability.<br />
• Inclusion of impact indicators in an AWM M&E<br />
framework in addition to project indicators can<br />
help the project capture and learn from impacts<br />
beyond the project area and timeframe. This<br />
will help to fully assess potential positive and<br />
negative changes, including possible “negative<br />
externalities”.<br />
• Since budgets for M&E are often limited, it is<br />
important to tailor the M&E framework to the<br />
specific goals and context of the project.<br />
• Both monitoring and evaluation are processes<br />
that should be adjusted throughout the project<br />
or programme to address changes such as:<br />
involved actors drop out and/or new ones join<br />
in; the political situation shifts; or unforeseen<br />
environmental limits are reached.<br />
• Each synthesised M&E framework has its own<br />
specificity, and the indicators it utilises may<br />
be too theme-specific for every AWM project.<br />
Taken together they give a balanced view of<br />
what indicator themes can be used for an AWM<br />
intervention.<br />
• The synthesised indicator themes represented<br />
in table 1 can be used to: 1) analyse existing<br />
M&E frameworks to identify gaps or areas<br />
of improvement; 2) provide a starting point<br />
for thinking about necessary project-specific<br />
indicators; and 3) as a starting point for<br />
developing a baseline assessment.<br />
14
stockholm environment institute<br />
References<br />
BACP (2009) Project Monitoring and evaluation plan.<br />
Template for submission of Proposed Project M&E<br />
Plan. Biodiversity and Agricultural Commodities<br />
Program, International Finance Corporation, World<br />
Bank Group.<br />
Barron, J., Noel, S. and Mikhail, M. (2010) Review<br />
of agricultural water management intervention<br />
impacts at watershed scale: a synthesis of changes<br />
and externalities using the livelihood framework.<br />
SEI Research report. Stockholm, Sweden.<br />
Batchelor, C. H., Rama Mohan Rao, M. S. and<br />
Manohar Rao, S. (2003) Watershed development:<br />
A solution to water shortages in semi-arid India<br />
or part of the problem Land Use and Water<br />
Resources Research, 3, 1-10.<br />
Cinderby, S., De Bruin, A., Mbilinyi, B., Kongo, V.<br />
and Barron, J. (2010) Participatory Geographic<br />
Information Systems for Agricultural Water<br />
Management Scenario Development: A Tanzanian<br />
Case Study. 11th WaterNet/WARFSA/GWP-SA<br />
Symposium. Zimbabwe.<br />
Davies, R. and Dart, J. (2005) Most Significant<br />
Change’ (MSC) Technique: A Guide to Its Use.<br />
United Kingdom: CARE International, United<br />
Kingdom; Oxfam Community Aid Abroad,<br />
Australia; Learning to Learn, Government of South<br />
Australia; Oxfam New Zealand; Christian Aid,<br />
United Kingdom; Exchange, United Kingdom;<br />
Ibis, Denmark; Mellemfolkeligt Samvirke (MS),<br />
Denmark; Lutheran World Relief, United States of<br />
America.<br />
De Bruin, A. (2005) Managing a watershed by<br />
managing a project. MSc, Wageningen University.<br />
De Graaff, J., Cameron, J., Sombatpanit, S., Pieri,<br />
C. and Woodhill, J. (eds.) (2007) Monitoring and<br />
Evaluation of Soil Conservation and Watershed<br />
Development Projects, Enfield, NH, USA: Science<br />
Publishers.<br />
Dfid (1999) Sustainable Livelihoods Guidance Sheets,<br />
Section 2 The Livelihoods Framework. UK:<br />
Department for International Development.<br />
Douthwaite, B., Delve, R., Ekboir, J. and Twomlow,<br />
S. (2003) Contending with Complexity: The Role<br />
of Evaluation in Implementing Sustainable Natural<br />
Resource Management. International Journal of<br />
Agricultural Sustainability, 1, 51-66.<br />
Douthwaite, B., Alvarez, B. S., Cook, S., Davies, R.,<br />
George, P., Howell, J., Mackay, R. and Rubiano,<br />
J. (2007) Participatory Impact Pathways Analysis:<br />
A Practical Application of Program Theory in<br />
Research-for-Development. Canadian Journal of<br />
Program Evaluation 22, 127-159.<br />
Earl, S., Carden, F. and Smutylo, T. (2001) Outcome<br />
mapping: Building Learning and Reflection<br />
into Development Programs. Ottowa, Canada<br />
International Development Research Centre.<br />
German, L., Mowo, J. and Kingamkono, M.<br />
(2006) A methodology for tracking the “fate”<br />
of technological interventions in agriculture.<br />
Agriculture and Human Values, 23, 353-369.<br />
Guijt, I. (1998) Participatory monitoring and impact<br />
assessment of sustainable agriculture initiatives:<br />
an introduction to the key elements. SARL<br />
Programme Discussion Paper 1. London: IIED.<br />
Guijt, I. (1999) Participatory monitoring and<br />
evaluation for natural resource management and<br />
research. Socio-economic Methodologies for<br />
Natural Resource Research. Chatham, UK: Natural<br />
Resources Institute.<br />
Guijt, I. (2008) Seeking Surprise: Rethinking<br />
monitoring for collective learning in rural resource<br />
management. PhD, Wageningen University.<br />
Hernández, E. A. (1995) Monitoring and evaluation of<br />
watershed management project achievements. FAO<br />
Conservation Guide 24. Rome: FAO.<br />
Herweg, K. and Steiner, K. (2002) Volume 1:<br />
Procedure. Impact Monitoring and Assessment.<br />
Instruments for use in rural development projects<br />
with a focus on sustainable land management.<br />
Wabern, Switzerland: CDE & GTZ.<br />
15
awm interventions and monitoring and evaluation<br />
IDE (2007) IDE Monitoring and Evaluation<br />
Framework for PRISM Projects. IDE.<br />
IDE (2009) Draft Environmental Assessment Protocol.<br />
Toolkit for Developing and Implementing Poverty<br />
Reduction through Irrigation and Smallholder<br />
Markets (PRISM) Programs. Keller-Bliesner<br />
Engineering LLC for IDE.<br />
IDE. (2010) Mission [Online]. Available: http://www.<br />
ideorg.org/OurStory/Mission.aspx [Accessed 13<br />
July 2010].<br />
IDE-INDIA (2007) Socio-economic-technoenvironmental<br />
assessment of IDEI products:<br />
Treadle pump. Delhi: The Energy and Resources<br />
Institute, IDEI-India.<br />
IDE-INDIA (2008a) A fairy tale for all A Rapid<br />
Assessment of IDEI’s Treadle Pump Programme<br />
in Uttar Pradesh, and its Impact on Children’s<br />
Welfare. Delhi: IDE.<br />
IDE-INDIA (2008b) From desperation to drip<br />
irrigation. An Assessment Conducted for IDEI<br />
by Symbiotec Research Associates. Delhi: The<br />
Lemelson Foundation, IDEI India.<br />
IFAD (2002) A guide for project monitoring &<br />
evaluation. Managing for impact in rural<br />
development. Rome: Office of Evaluation and<br />
Studies, IFAD.<br />
Joshi, P. K., Jha, A. K., Wani, S. P., Sreedevi, T. K.<br />
and Shaheen, F. A. (2008) Impact of watershed<br />
program and conditions for success: a metaanalysis<br />
approach. Global Theme on Agro<br />
ecosystems Report 46. International Crops<br />
Research Institute for the semi-Arid Tropics<br />
(ICRISAT).<br />
Layke, C. (2009) Working paper: Measuring Nature’s<br />
Benefits: A Preliminary Roadmap for Improving<br />
Ecosystem Service Indicators. Washington, DC:<br />
World Resource Institute.<br />
McCartney, M. P., Boelee, E., Cofie, O. and Mutero, C.<br />
M. (2007) Minimizing the negative environmental<br />
and health impacts of agricultural water resources<br />
development in sub-Saharan Africa. Working Paper<br />
117. Colombo, Sri Lanka: International Water<br />
Management Institute.<br />
MDF (2003) Course on PCM: Monitoring and<br />
Evaluation of Project Portfolios. Ede: MDF<br />
training and consultancy.<br />
OECD (1991) Principles for Evaluation of<br />
Development Assistance. Paris: OECD,<br />
Development Assistance Committee.<br />
Palanisami, K., Suresh Kumar, D. and WANI, S. P.<br />
(2009) A Manual on Watershed Impact Assessment<br />
of watersheds. Global Theme on Agro ecosystems<br />
Report 53. Andhra Pradesh, India: IWMI, ITP and<br />
ICRISAT.<br />
Peters, G., McCall, M. K. and Van Westen, C. (2009)<br />
Coping Strategies and Manageability: How<br />
Participatory Geographical Information Systems<br />
Can Transform Local Knowledge into Better<br />
Policies for Disaster Risk Management. Disaster<br />
Studies Working Paper 22. London: International<br />
Institute for Geo-Information Science and Earth<br />
Observation.<br />
Stroud, A. (2004) Understanding People, their<br />
Livelihood Systems and the Demands and Impact<br />
of Innovations: A Synthesis. Uganda Journal of<br />
Agricultural Sciences, 9, 797-818.<br />
UNEP (2002) UNEP Environmental Impact<br />
Assessment Training Resource Manual. 2 ed.:<br />
Economics and Trade Branch, United Nations<br />
Environment Programme.<br />
WORLD BANK (2008) Toolkit for Monitoring and<br />
Evaluation of Agricultural Water Management<br />
Projects. Report 44799. Washington, DC:<br />
Agricultural and Rural Development Department,<br />
World Bank.<br />
Levelt, D. (2004) El uso y la adaptación de la<br />
tecnología de riego por aspersión en la Sierra<br />
Andina de Perú : estudio de caso en la comunidad<br />
campesina “Cutipata”, región Cusco, Perú. MSc,<br />
Wageningen University.<br />
16
stockholm environment institute<br />
Appendices<br />
Appendix A: Indicator themes and measures at impact level<br />
Livelihood capital Indicator theme Examples of measures<br />
Financial capital Income and wealth Net income generated (e.g. per ha, family, household)<br />
Changes in income/wealth relative to others<br />
Agricultural production Net income by activity (crop, livestock, forestry and related)<br />
Total seasonal value of crop production (e.g. per command<br />
area, unit water consumed, unit water supplied)<br />
Cost of production<br />
Total seasonal management, organisation and maintenance<br />
expenditure<br />
Sources of income<br />
Revenue generated from off-farm land<br />
Different sources of family income (including employment)<br />
Consumption expenditure changes (including food consumption)<br />
Has independent income been created<br />
Assets, savings<br />
Proportion of output that farmers market annually<br />
Changes in wage rate<br />
In what form do people keep their savings<br />
Do the savings give people security<br />
Access to capital/credit How often do people use financial credit And when<br />
From where do they access it<br />
Business development Number of households who started a business<br />
Human capital In/out migration Change in in/out migration<br />
Agricultural training<br />
Number of farms using introduced technologies<br />
Changes in behaviour<br />
Literacy level<br />
Annual literacy rate<br />
Schooling<br />
Number of schools in operation nearby<br />
Ability of parents to pay school fees<br />
Percentage of girls in school<br />
Number of children that go to school<br />
Health<br />
Number of families/year receiving medical care<br />
Quality of health care<br />
Annual mortality rate<br />
Ability of family to pay for healthcare<br />
Accessibility of healthcare (i.e. distance to clinic)<br />
Food security/nutrition Height for weight of children<br />
Height for age of children<br />
Length of hunger period<br />
Labour<br />
Changes in labour needed<br />
Technology adaptation Number of people taking up adapted technology<br />
Natural capital Soil Soil salinity<br />
Soil fertility<br />
Tons of avoided sedimentation/ changes in soil loss<br />
17
awm interventions and monitoring and evaluation<br />
Livelihood capital Indicator theme Examples of measures<br />
Quantity and quality of water Drainage water quality: biological<br />
resources<br />
Drainage water quality: chemical<br />
Annual low water flow<br />
Annual flood peaks<br />
Rainfall<br />
Changes in ground water table (i.e. water table rise) and<br />
well yield.<br />
Land use<br />
Area under different crops (including fodder and food)<br />
Area of pasture and grazing lands<br />
Productivity of pasture and grazing lands<br />
Degraded land<br />
Rehabilitated land<br />
Area of water bodies<br />
Forest/vegetation<br />
Changes in forest area (natural and planted)<br />
Biodiversity of forests (natural and planted)<br />
Change in forest use (timber and non-timber products)<br />
Biodiversity management Areas under conservation (formally and informally)<br />
Connectivity/fragmentation of natural habitat<br />
Rate of deforestation<br />
Trends in abundance and distribution of selected species<br />
(flora, fauna)<br />
Production related<br />
Quality of crop<br />
Differences in cropping pattern<br />
Difference in cropping intensity<br />
Change in cropping species<br />
Trends in use of agrochemicals<br />
Irrigation related<br />
Water availability, surface and groundwater, availability<br />
downstream (inflow/outflow)<br />
Physical capital Infrastructure Road and track practicable all year round<br />
Communications (i.e. radio, print, mobile phone, internet<br />
coverage)<br />
Changes in public transport<br />
Water infrastructure<br />
Main system water delivery efficiency<br />
Delivery performance ratio<br />
Dependability of water delivery interval<br />
Overall scheme efficiency<br />
Improved control, enabling better distribution of available<br />
supplies<br />
Improved measurement, enabling better distribution and<br />
monitoring of available supplies<br />
Livelihood capital Indicator theme Examples of measures<br />
18
stockholm environment institute<br />
Livelihood capital Indicator theme Examples of measures<br />
Physical capital Water infrastructure Increased security of supply (lowered risk of structure collapse<br />
or canal breach)<br />
Percentage of houses with access to clean drinking water<br />
Housing<br />
Changes in housing<br />
Social capital Changes in exchange Number of trained participants sharing knowledge<br />
Institutions/governance for<br />
resource management<br />
Adherence to equitable rules<br />
of operation<br />
Has social organisation changed<br />
Financial organisations<br />
Collective action<br />
Empowerment<br />
Equity<br />
Change in participation in social institutions<br />
Number of procedures, policies or regulations that were<br />
improved, added or eliminated<br />
What financial organisations exist<br />
Who has access to financial organisations<br />
Number of new groups formed<br />
Better linkages with other organisations and people<br />
How aware are people of their rights and other policies<br />
that impact them<br />
Which groups are excluded from sources of information<br />
Are different groups able to make their own choices or are<br />
they constrained by family pressure or local custom<br />
Change in level of conflict<br />
Impact on women (decision making, health, life style and<br />
awareness)<br />
Are access rights secure<br />
Is there equal access to resources<br />
Who is excluded from which resources<br />
Land distribution<br />
19
awm interventions and monitoring and evaluation<br />
Appendix B:<br />
Indicator themes and measures at project level<br />
Livelihood capital Indicator theme Examples of measures<br />
Financial capital Income and wealth Agricultural Productivity and net returns at plot level,<br />
Farm profit<br />
Cost of production<br />
Total seasonal management, organisation and maintenance<br />
expenditure<br />
Assets, savings<br />
Change in livestock population<br />
Change in leased land<br />
Change in newly bought land<br />
Farm and household assets acquired<br />
Buyers and other value-chain<br />
participants of the targeted<br />
commodities integrate biodiversity<br />
criteria in the value<br />
chain<br />
Financial products, biodiversity-friendly,<br />
available to the<br />
actors in the targeted commodities<br />
and countries<br />
Economic returns to investment<br />
Trade volume of products adhering to biodiversityfriendly<br />
production practices and standards in a certain<br />
timeframe<br />
Number of Financial Institutes (FI) or commodity traders<br />
that adopt biodiversity-friendly financial products<br />
Number of traders accessing the biodiversity-friendly<br />
financial products<br />
Net Present Worth (NPW), Benefit-Cost Ratio (BCR),<br />
and Internal Rate of Return (IRR)<br />
Human capital Agricultural training Number of meetings small holders attended<br />
Number of demonstration plots visited or seen<br />
Percentage of population in intervention area adopting<br />
promoted AWM interventions<br />
Technology adaptation Type of modifications made to technology<br />
Reasons for adaptation<br />
Natural capital Soil Change in soil conservation areas<br />
Quantity and quality of water<br />
resources<br />
Production related<br />
Limits to well drilling due to arsenic levels<br />
Salinity filters<br />
Direct and indirect water use<br />
Duration of water availability for various uses (domestic<br />
and productive) by source<br />
Change in storage capacity of the landscape<br />
Yields (crops, forest, fruit)<br />
Number of farms that have changed production practices<br />
(i.e. adopted new production practices promoted<br />
by project)<br />
Change in crop diversification over certain timeframe<br />
Physical capital Water infrastructure Change in surface water storage (e.g. capacity of<br />
ponds, tanks)<br />
Change in number of wells<br />
Change in seepage from canals and leakage from<br />
structures, resulting in change in conveyance<br />
Changes in infrastructure to improve access of livestock<br />
to system/infrastructure<br />
Increased canal and drain capacity, able to take<br />
design flows<br />
20
stockholm environment institute<br />
Livelihood capital Indicator theme Examples of measures<br />
Social capital<br />
Institutions/governance for<br />
resource management<br />
Policies<br />
Financial organisations<br />
Empowerment<br />
Increase in number of institutions over specific timeframe<br />
Number of policies that were added or improved to<br />
incorporate biodiversity concerns<br />
Number of entities that implemented recommended<br />
changes – i.e. sustainable management practices<br />
(BMPs), formal commitments to adhere to certain<br />
standards or P&C, adoption of land management<br />
plans<br />
Fee water collection ratio<br />
Number of female participants in community organisations<br />
Amount of female representation in the management<br />
of water user bodies<br />
Project Management Management Number of trained operational staff for water system<br />
Managed and monitored<br />
watershed area<br />
Participation<br />
Level of adaptation of work and staff to the local context<br />
Involvement of local people in project design and<br />
implementation<br />
Number of agenda items on biodiversity in village<br />
council meetings<br />
Involvement of local people in water management<br />
organisation<br />
Level of communication between community and<br />
extension agents<br />
Number of beneficiary families in poor communities<br />
supported<br />
21
awm interventions and monitoring and evaluation<br />
Appendix C: IDE suggested indicators for M&E<br />
Livelihood capital Indicator theme Suggested indicators in M&E framework of IDE<br />
Financial capital Income and wealth Median of the amount and rate (per cent) of net annual<br />
income changes of project beneficiaries<br />
Farmers’ net margin and sales volumes<br />
Percentage of retail price received by the farmer<br />
Percentage of net-income derived from crop sales<br />
Agricultural production Not covered<br />
Cost of production Change in use of purchased inputs by farmers<br />
Costs to obtain services<br />
Sources of income Not covered<br />
Assets, savings<br />
Farmers’ risk management strategies to respond to market<br />
dynamics (prices, quality requirements, contract compliance,<br />
etc.)<br />
Access to capital/credit Use of services by farmers and VC actors<br />
Business development Not covered<br />
Economic returns to investment<br />
of donor<br />
Total net farm HH income generated (absolute value and per<br />
dollar of donor investment)<br />
Human capital In and out migration Not covered<br />
Agricultural training Change in knowledge/capacity in production practices<br />
Abandonment rate of improved production practices<br />
Change in knowledge/capacity of farmers in proper use of<br />
inputs<br />
Literacy level<br />
Not covered<br />
Schooling<br />
Not covered<br />
Health<br />
Not covered<br />
Food security/nutrition Not covered<br />
Labour<br />
Productivity per unit labour (i.e. implicit rural wage rate)<br />
Technology adaptation Not covered<br />
Natural capital Soil Soil quality: changes in salinity<br />
Water quality<br />
Water quality: changes in salinity<br />
Hydrology<br />
Changes in specific environmental parameters over the<br />
project period (e.g., groundwater levels)<br />
Water quantity: total water use relative to total resource availability<br />
Land use<br />
Land use: change in irrigated area, slash-and-burn area,<br />
erosion<br />
Change in area for commercial production using improved<br />
production practices<br />
Forest/vegetation<br />
Not covered<br />
Biodiversity management Not covered<br />
Production related<br />
Efficiency in natural resource use of traditional and IDE-promoted<br />
farming systems (irrigation, horticulture, crop varieties,<br />
etc.)<br />
Productivity per unit land Farmers’ risk management strategies<br />
to respond to production condition dynamics (plagues,<br />
weather)<br />
Change in use of purchased inputs by farmers<br />
22
stockholm environment institute<br />
Livelihood capital Indicator theme Suggested indicators in M&E framework of IDE<br />
Natural capital Irrigation related Change in irrigated area using specific irrigation technologies<br />
Abandonment rate of specific irrigation technologies<br />
Change in productivity per unit water<br />
Change in knowledge / capacity in irrigation practice and<br />
efficient use of water resources<br />
Physical capital Infrastructure Not covered<br />
Water infrastructure Not covered<br />
Housing<br />
Not covered<br />
Market<br />
Body of evidence on market sustainability<br />
Ability among farmers to identify and respond to market<br />
opportunities<br />
Sales volume to the specific output markets (through the<br />
value chains)<br />
Number and organisational strength of marketing networks<br />
Change in number of service providers<br />
Change in number of clients of service providers<br />
Social capital Changes in knowledge Not covered<br />
exchange<br />
Institutions/governance for Not covered<br />
resource management<br />
Financial organisations Number of smallholders/micro-small entrepreneurs (MSEs)<br />
linked with marketing networks<br />
Collective action<br />
Not covered<br />
Empowerment<br />
Qualitative impact on marginalised households and/or individuals<br />
within households<br />
Equity<br />
Percentage of customers from marginalised groups<br />
Project<br />
Management<br />
Management<br />
Participation<br />
Customer satisfaction<br />
Not covered<br />
Cumulative and year-on-year increase in the number of<br />
project customers<br />
Customer satisfaction with inputs (including quality, timeliness,<br />
etc.)<br />
Customer satisfaction with input suppliers (including service,<br />
technical advice, etc.)<br />
Customer satisfaction with services<br />
Quality of service to smallholders<br />
23
awm interventions and monitoring and evaluation<br />
Appendix D: Measures used in two IDE-India evaluations<br />
Livelihood capital and indicator<br />
themes of table 1<br />
Internal assessment<br />
Impacts of Treadle pump (TERI report)<br />
External assessment<br />
Impacts of Drip technology<br />
(Lemelson Foundation report)<br />
Financial capital<br />
Income and wealth Annual income Increase in income<br />
Agricultural production Changes in cropping patterns<br />
Changes in size of cultivated area<br />
Increased yield<br />
Factors leading to increase in<br />
income<br />
Higher cropping intensity<br />
Changes in cropping pattern<br />
Changes in input use<br />
Shift to high value crops<br />
Cost of production<br />
Cost of installation of pump<br />
Failure of the equipment, problems faced in<br />
operation,<br />
Cost of repair and maintenance<br />
Decrease in cost of cultivation<br />
Cost of production<br />
Sources of income Primary and secondary occupation Other sources of income<br />
Assets, savings<br />
Total land owned<br />
How is the increased income being utilised<br />
For creating assets or for consumption<br />
How the increased income is<br />
being utilised (for creating assets<br />
or for consumption)<br />
How absolute saving in water<br />
was used (for irrigating more<br />
area and thus earn greater<br />
income)<br />
Access to capital/credit Not covered Not covered<br />
Business development Not covered Not covered<br />
Human capital<br />
In and out migration Not covered Not covered<br />
Agricultural training Not covered Not covered<br />
Literacy level Not covered Not covered<br />
Schooling Not covered Not covered<br />
Health Not covered Not covered<br />
Food security/nutrition Not covered Change in food security<br />
Labour<br />
Hours of operation in rainy, winter and summer<br />
Not covered<br />
seasons<br />
Number of hours of diesel pump renting in<br />
rainy, winter and summer seasons<br />
Technology adaptation Not covered Not covered<br />
24
stockholm environment institute<br />
Livelihood capital and indicator<br />
themes of table 1<br />
Internal assessment<br />
Impacts of Treadle pump (TERI report)<br />
External assessment<br />
Impacts of Drip technology<br />
(Lemelson Foundation report)<br />
Natural capital<br />
Soil Not covered Not covered<br />
Water quality Not covered Impact on source of water<br />
Hydrology<br />
Crops grown at present and before treadle<br />
pump adoption in rainy, winter and summer<br />
Change in area under cropping<br />
Average rainfall<br />
seasons<br />
Land use Not covered Not covered<br />
Forest/vegetation Not covered Not covered<br />
Natural capital<br />
Biodiversity management Not covered Not covered<br />
Production related Changes in cropping patterns Increase in cropping intensity<br />
Changes in cropping patterns<br />
Extension of cropping season<br />
Not covered<br />
Changes in inputs – level of<br />
inputs as well as type of inputs<br />
Changes in crop productivity<br />
Irrigation related<br />
Physical capital<br />
Hours of operation in rainy, winter and summer<br />
seasons<br />
Number of hours of DP renting in rainy, winter<br />
and summer seasons<br />
Infrastructure Not covered Not covered<br />
Water infrastructure<br />
Device used at present, model, year of installation<br />
Not covered<br />
Use of diesel pump prior to treadle pump<br />
adoption<br />
Change in pattern of renting diesel pump<br />
(for non users) Diesel pump usage in rainy,<br />
winter and summer seasons<br />
Housing Not covered Not covered<br />
Social capital<br />
Changes in knowledge<br />
exchange<br />
Institutions/governance for<br />
resource management<br />
Perception on treadle pump use<br />
(for non users) Perception on diesel pump<br />
use<br />
Not covered<br />
Changes in water use efficiency<br />
Savings in water used in absolute<br />
terms<br />
Change in area under drip<br />
Not covered<br />
Not covered<br />
Financial organisations Not covered Not covered<br />
Collective action Not covered Not covered<br />
Empowerment Not covered Change in social status<br />
Equity Not covered Not covered<br />
25
awm interventions and monitoring and evaluation<br />
Appendix E: Measures used in baseline assessment of resource-based<br />
livelihoods<br />
Livelihood capital Indicator theme Measures used in Mkindo watershed, Tanzania<br />
Financial capital Income and wealth Number of people dependent on similar use of<br />
resources<br />
Agricultural production How much is sold and consumed<br />
Cost of production<br />
Sources of income<br />
Proportion of income How much production is sold<br />
Other sources of income<br />
Relative importance of different sources of income<br />
Assets, savings<br />
Other benefits from owning livestock<br />
Access to capital/credit<br />
Business development<br />
Human capital In and out migration<br />
Agricultural training<br />
Have you had any training<br />
Literacy level<br />
Schooling<br />
Health<br />
Any health related issues<br />
Food security/nutrition<br />
Labour<br />
Technology adaptation<br />
Natural capital Soil<br />
Water quality<br />
What is the water quality<br />
Hydrology<br />
Frequency of river water use<br />
How is water used<br />
Was last year a good / normal / bad year for water<br />
availability<br />
What are water rich and water poor areas<br />
Land use<br />
Area under crops, grazing, forest<br />
Quality of grazing land<br />
Seasonality of grazing area<br />
Forest/vegetation<br />
How often is forest used For what purpose<br />
Biodiversity management<br />
Production related<br />
Type of crops, cropping pattern<br />
Use of fertilisers<br />
Number of harvests<br />
Average yield<br />
Irrigation related<br />
Frequency of irrigation water use<br />
Physical capital Infrastructure Where are the markets, how accessible are they<br />
Water infrastructure<br />
How is water transported to where it is needed Reliability<br />
of water sources<br />
Housing<br />
26
stockholm environment institute<br />
Livelihood capital Indicator theme Measures used in Mkindo watershed, Tanzania<br />
Social capital<br />
Changes in knowledge<br />
exchange<br />
Institutions/governance for<br />
resource management<br />
Financial organisations<br />
Collective action<br />
Empowerment<br />
Equity<br />
Do you have issues with other users of land or water<br />
How is the resource managed<br />
What would improve crop or livestock management<br />
Position in the community<br />
How are communal resources managed<br />
Who makes decisions about livestock and crop management<br />
Who decides how to spend income from crops and<br />
livestock<br />
Accessibility of water<br />
27
awm interventions and monitoring and evaluation<br />
Appendix F:<br />
Methodology for synthesised frameworks<br />
The frameworks used in the synthesis included:<br />
World Bank, 2008; IFAD, 2002; FAO, 1995; DFID,<br />
1999; Layke, 2009; Palanisami et al., 2009; UNEP,<br />
2002; BACP, 2009; de Bruin, 2005. Several steps<br />
were taken to conduct the synthesis. First, a list was<br />
compiled of all indicators and their source. Similar<br />
indicators that were mentioned by multiple sources<br />
were summarised into one indicator that reflected<br />
the common information aim. When different units<br />
of measurement were mentioned, these were added<br />
between brackets. However, the scale at which the<br />
project operates affects which unit of measure is most<br />
relevant (e.g. field, crop, community, or watershed).<br />
Thus only the general description of the indicator was<br />
kept in the tables shown in appendices A and B.<br />
Once the overall list of 138 indicators was generated,<br />
they were categorised according to the five capitals<br />
of livelihood assets: financial, human, natural,<br />
physical and social capital (DFID, 1999). Use of this<br />
framework for classification of indicators ensured that<br />
social, human, and environmental indicators would be<br />
included in the list. In some cases this division is too<br />
strict and one indicator could fall into several capitals.<br />
Those indicators were kept under the main asset they<br />
described. The examples of indicators and measures<br />
in the Appendices are a selection of the full list to<br />
represent the breadth of possibility but refrain from too<br />
much specificity. Care was taken to include indicators<br />
that were mentioned by most of the sources reviewed.<br />
28
SEI - Africa<br />
Institute of Resource Assessment<br />
University of Dar es Salaam<br />
P.O. Box 35097, Dar es Salaam<br />
Tanzania<br />
Tel: +255-(0)766079061<br />
SEI - Asia<br />
15th Floor Witthyakit Building<br />
254 Chulalongkorn University<br />
Chulalongkorn Soi 64<br />
Phyathai Road Pathumwan<br />
Bangkok 10330<br />
Thailand<br />
Tel: +(66) 22514415<br />
SEI - Oxford<br />
Suite 193<br />
266 Banbury Road,<br />
Oxford, OX2 7DL<br />
UK<br />
Tel: +44 1865 426316<br />
SEI - Stockholm<br />
Kräftriket 2B<br />
SE -106 91 Stockholm<br />
Sweden<br />
Tel: +46 8 674 7070<br />
SEI - Tallinn<br />
Lai 34, Box 160<br />
EE -10502, Tallinn<br />
Estonia<br />
Tel: +372 6 276 100<br />
SEI - U.S.<br />
11 Curtis Avenue<br />
Somerville, MA 02144<br />
USA<br />
Tel: +1 617 627-3786<br />
SEI - York<br />
University of York<br />
Heslington<br />
York YO10 5DD<br />
UK<br />
Tel: +44 1904 43 2897<br />
The Stockholm Environment Institute<br />
SEI is an independent, international research institute. It has been<br />
engaged in environment and development issues at local, national,<br />
regional and global policy levels for more than a quarter of a century.<br />
SEI supports decision making for sustainable development by<br />
bridging science and policy.<br />
sei-international.org<br />
ISBN XX XX XX